A Further Look at Financial Statements CHAPTER 2.
35
A Further Look at Financial Statements CHAPTER 2
-
date post
20-Dec-2015 -
Category
Documents
-
view
221 -
download
0
Transcript of A Further Look at Financial Statements CHAPTER 2.

A Further Look at Financial Statements
CHAPTER
2

• To provide the most useful financial To provide the most useful financial information for information for decision makingdecision making
Objective of Financial ReportingObjective of Financial Reporting

• GGenerallyenerally
• AAcceptedccepted
• AAccountingccounting
• PPrinciplesrinciples
General Guide for Financial General Guide for Financial ReportingReporting

• Understandability Understandability
• RelevanceRelevance
• Reliability Reliability
• Comparability and consistencyComparability and consistency
Characteristics of Useful Characteristics of Useful InformationInformation

Constraints in AccountingConstraints in Accounting
• Cost-benefitCost-benefit
• MaterialityMateriality

Classified Balance SheetClassified Balance Sheet
AssetsAssets
• Current assets Current assets
• Long-term investmentsLong-term investments
• Property, plant, and Property, plant, and equipmentequipment
• Intangible assetsIntangible assets
LiabilitiesLiabilities
• Current liabilitiesCurrent liabilities
• Long-term liabilitiesLong-term liabilities
A classified balance sheet generally contains the A classified balance sheet generally contains the following standard classifications:following standard classifications:
Shareholders’ EquityShareholders’ Equity
• Share capitalShare capital
• Retained earningsRetained earnings

Current AssetsCurrent Assets
• Assets expected to be converted to cash or Assets expected to be converted to cash or used in the business within the year used in the business within the year
• Listed in order of liquidityListed in order of liquidity• ExamplesExamples
– CashCash– Short-term investmentsShort-term investments– Accounts receivableAccounts receivable– InventoriesInventories– Prepaid expensesPrepaid expenses

Long-Term InvestmentsLong-Term Investments
• Assets that can be converted into cash, but whose Assets that can be converted into cash, but whose conversion is not expected within one yearconversion is not expected within one year
• Assets not intended for use within the businessAssets not intended for use within the business
• ExampleExample
– Investments in shares and Investments in shares and bonds of other corporations bonds of other corporations

Property, Plant, and EquipmentProperty, Plant, and Equipment
• Tangible assets with relatively long useful Tangible assets with relatively long useful liveslives
• Assets used in operating the businessAssets used in operating the business
Property, Plant, and EquipmentProperty, Plant, and Equipment
ExamplesExamples– LandLand– Land improvementsLand improvements– BuildingsBuildings– Machinery and Machinery and
equipmentequipment– Furniture and fixturesFurniture and fixtures

Intangible AssetsIntangible Assets
• Intangible assets with relatively long Intangible assets with relatively long useful livesuseful lives
• Future value because of the exclusive Future value because of the exclusive rights or privileges they possessrights or privileges they possess

Intangible AssetsIntangible Assets
ExamplesExamples–PatentsPatents–CopyrightsCopyrights–Trademarks or Trademarks or
trade namestrade names–FranchisesFranchises–GoodwillGoodwill
© ® © ® ™™

AmortizationAmortization
• Allocation of an asset’s full purchase price to Allocation of an asset’s full purchase price to matchmatch cost to revenues over the entire cost to revenues over the entire estimated useful life instead of expensing full estimated useful life instead of expensing full cost in the year of purchasecost in the year of purchase
• The cost of long-lived assets with indefinite The cost of long-lived assets with indefinite lives (e.g., land) is not amortizedlives (e.g., land) is not amortized

AmortizationAmortization
• Accumulated amortizationAccumulated amortization account shows the account shows the total amount of amortization taken to datetotal amount of amortization taken to date
• The difference between the cost of the asset The difference between the cost of the asset and its accumulated amortization is referred and its accumulated amortization is referred to as the to as the net book valuenet book value of the asset of the asset

CSU CORPORATIONBalance Sheet
December 31, 2004
Amortizable long-lived assets should be shown at Amortizable long-lived assets should be shown at net book valuenet book value (cost less accumulated amortization) (cost less accumulated amortization)
AssetsAssets
CashCash
Accounts receivableAccounts receivable
SuppliesSupplies
EquipmentEquipment
Less: Accumulated amortizationLess: Accumulated amortization
Total assetsTotal assets
$24,000$24,000
8,0008,000
$ 2,000$ 2,000
4,0004,000
1,8001,800
16,00016,000
$23,800$23,800

– Accounts payableAccounts payable– Wages payableWages payable– Notes (bank loans) payableNotes (bank loans) payable– Interest payableInterest payable– Income taxes payableIncome taxes payable– Current maturities of long-term liabilitiesCurrent maturities of long-term liabilities
Current LiabilitiesCurrent Liabilities
Obligations that are supposed to be paid Obligations that are supposed to be paid within the coming yearwithin the coming year

Long-Term LiabilitiesLong-Term Liabilities
• Debts expected to be paid after one yearDebts expected to be paid after one year– Bonds payableBonds payable
– Mortgages payableMortgages payable
– Long-term notes payableLong-term notes payable
– Capital lease liabilitiesCapital lease liabilities
– Obligations under employee pension plansObligations under employee pension plans

Shareholders' EquityShareholders' Equity
• Share capitalShare capital– Investments in the business by the Investments in the business by the
shareholdersshareholders
• Retained earningsRetained earnings– Earnings kept for use in the businessEarnings kept for use in the business

Ratio AnalysisRatio Analysis
• Mathematical relationshipMathematical relationship• Relationship can be expressed in terms ofRelationship can be expressed in terms of
– PercentagePercentage
– RateRate
– ProportionProportion
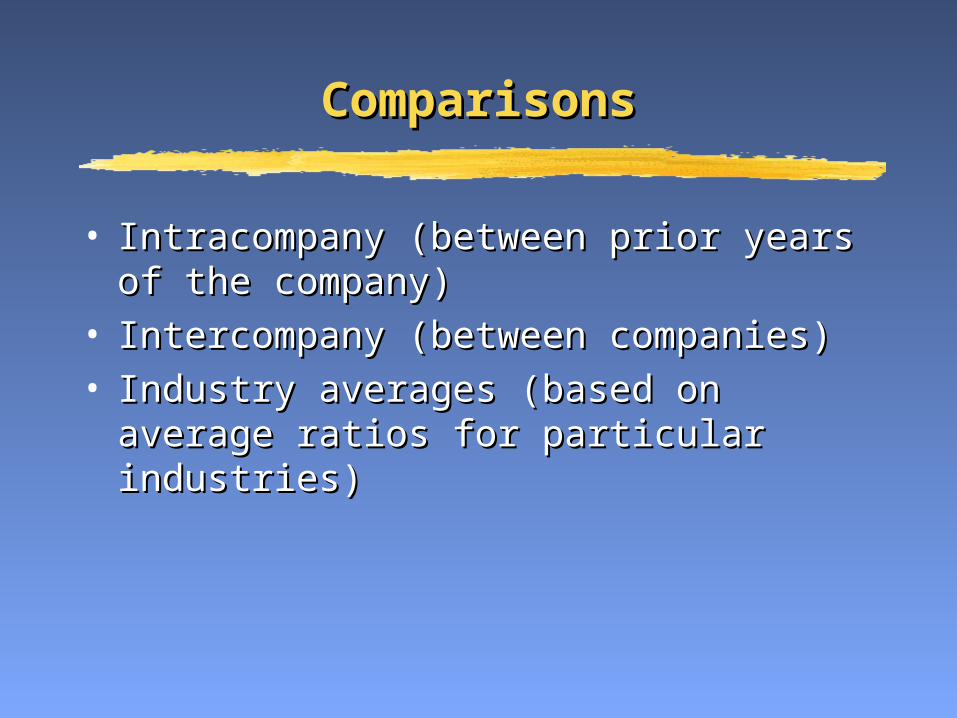
ComparisonsComparisons
• Intracompany (between prior years of the Intracompany (between prior years of the company)company)
• Intercompany (between companies)Intercompany (between companies)• Industry averages (based on average ratios Industry averages (based on average ratios
for particular industries)for particular industries)

Financial Ratio ClassificationsFinancial Ratio Classifications
• Profitability ratiosProfitability ratios– Measure the earnings or operating success of a Measure the earnings or operating success of a
company for a given period of timecompany for a given period of time
• Liquidity ratiosLiquidity ratios– Measure the short-term ability of the company to Measure the short-term ability of the company to
pay its maturing obligations and to meet pay its maturing obligations and to meet unexpected needs for cashunexpected needs for cash
• Solvency ratiosSolvency ratios– Measure the ability of a company to survive over Measure the ability of a company to survive over
a long period of timea long period of time

Using the Statement of EarningsUsing the Statement of Earnings
• Many stakeholders in a company are Many stakeholders in a company are concerned with profitability. Two ratios can be concerned with profitability. Two ratios can be used to assess profitability.used to assess profitability.
• Earnings per share:Earnings per share: measures the net measures the net earnings for each common share.earnings for each common share.
• Price-earnings ratio:Price-earnings ratio: measures the ratio of the measures the ratio of the market price of each common share to its market price of each common share to its earnings per share.earnings per share.

Profitability RatiosProfitability Ratios
• EPSEPS = = Net Income - Preferred DividendsNet Income - Preferred Dividends
Number of SharesNumber of Shares
• P-E RatioP-E Ratio = = Market Price Per ShareMarket Price Per ShareEarnings Per ShareEarnings Per Share

Using the Classified Balance Using the Classified Balance SheetSheet
• The classified balance sheet can be used to The classified balance sheet can be used to evaluate a company’s financial healthevaluate a company’s financial health
• Liquidity ratios measure the short term ability Liquidity ratios measure the short term ability of the company to pay its maturing obligations of the company to pay its maturing obligations (e.g. working capital, current ratio)(e.g. working capital, current ratio)
• Solvency ratios measure the company’s Solvency ratios measure the company’s ability to survive over a long period of time ability to survive over a long period of time (e.g. debt to total assets)(e.g. debt to total assets)

Liquidity RatiosLiquidity Ratios
• Working CapitalWorking Capital = = Current Assets - Current LiabilitiesCurrent Assets - Current Liabilities
• Current RatioCurrent Ratio = = Current AssetsCurrent Assets Current Liabilities Current Liabilities

Solvency RatiosSolvency Ratios
• Debt to Total AssetsDebt to Total Assets = = Total LiabilitiesTotal Liabilities
Total AssetsTotal Assets
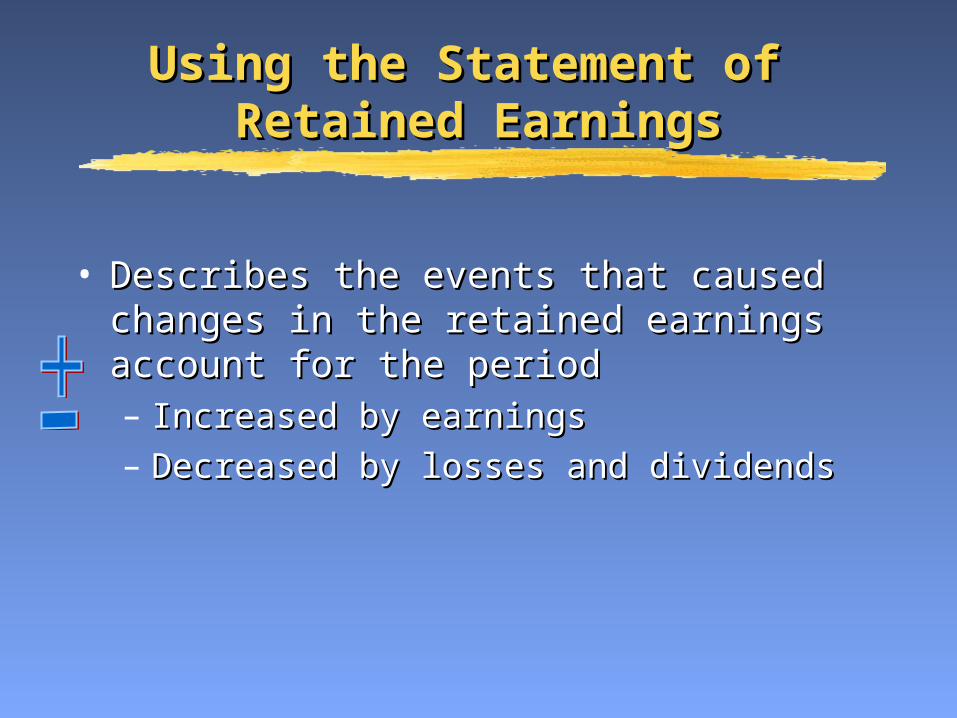
Using the Statement of Using the Statement of Retained EarningsRetained Earnings
• Describes the events that caused changes in Describes the events that caused changes in the retained earnings account for the periodthe retained earnings account for the period– Increased by earningsIncreased by earnings
– Decreased by losses and dividendsDecreased by losses and dividends

CSU CORPORATIONStatement of Retained EarningsYear Ended December 31, 2004
Retained earnings, January 1Retained earnings, January 1Add: Net earningsAdd: Net earnings
Less: DividendsLess: DividendsRetained earnings, December 31 Retained earnings, December 31
$ 0 (1)$ 0 (1) 6,800 6,800 (2)(2)
6,8006,800 00$6,800 $6,800 (3)(3)

Using the Statement of Using the Statement of Retained EarningsRetained Earnings
Statement Interrelationships:Statement Interrelationships:
(1)(1) Opening retained earnings comes from, and agrees Opening retained earnings comes from, and agrees to, ending retained earnings on prior period balance to, ending retained earnings on prior period balance sheetsheet
(2)(2) Net earnings comes from, and agrees to, net Net earnings comes from, and agrees to, net earnings on statement of earningsearnings on statement of earnings
(3)(3) Ending retained earnings goes to, and agrees to, Ending retained earnings goes to, and agrees to, ending retained earnings on current period balance ending retained earnings on current period balance sheetsheet

Using theUsing theCash Flow StatementCash Flow Statement
• To provide information aboutTo provide information about– Cash receiptsCash receipts– Cash paymentsCash payments– Changes in cash (and cash equivalents)Changes in cash (and cash equivalents)
• From changes inFrom changes in– Operating activitiesOperating activities– Financing activitiesFinancing activities– Investing activitiesInvesting activities

Operating ActivitiesOperating Activities
• Cash inflows and cash outflows Cash inflows and cash outflows associated with the primary operations of associated with the primary operations of the businessthe business

Financing ActivitiesFinancing Activities
• Cash inflows / outflows that come from Cash inflows / outflows that come from sources funding the businesssources funding the business– Sale of shares / payment of dividendsSale of shares / payment of dividends– Issuing debt / repaying debtIssuing debt / repaying debt

Investing ActivitiesInvesting Activities
• Cash inflows / outflows that result from Cash inflows / outflows that result from changes in investments, property, plant and changes in investments, property, plant and equipment and intangible assetsequipment and intangible assets– Purchasing / disposing of investments and Purchasing / disposing of investments and
long-lived assets using cashlong-lived assets using cash
– Lending money and collecting the loansLending money and collecting the loans
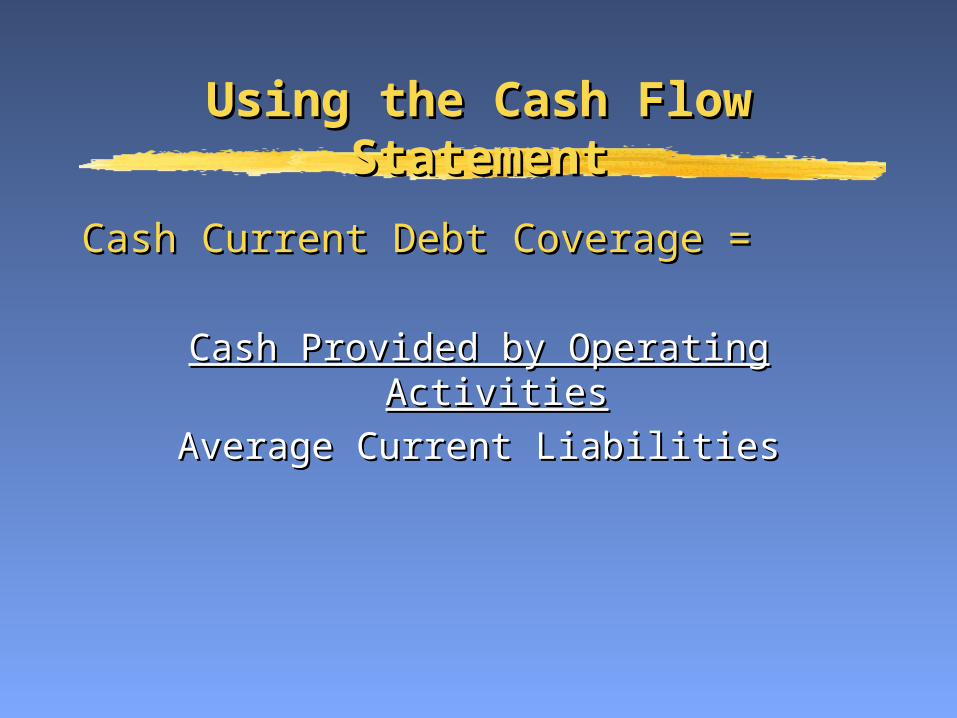
Using the Cash Flow StatementUsing the Cash Flow Statement
Cash Current Debt Coverage =Cash Current Debt Coverage =
Cash Provided by Operating ActivitiesCash Provided by Operating Activities
Average Current LiabilitiesAverage Current Liabilities

Using the Cash Flow StatementUsing the Cash Flow Statement
Cash Total Debt Coverage =Cash Total Debt Coverage =
Cash Provided by Operating ActivitiesCash Provided by Operating Activities
Average Total LiabilitiesAverage Total Liabilities