A Full 3-D Finite Element Analysis of Group Interaction ...
13
Modern Applied Science; Vol. 12, No. 5; 2018 ISSN 1913-1844 E-ISSN 1913-1852 Published by Canadian Center of Science and Education 9 A Full 3-D Finite Element Analysis of Group Interaction Effect on Laterally Loaded Piles Amer Alkloub 1 , Rabab Allouzi 1 , Haider Alkloub 2 & Ramia Al-Ajarmeh 1 1 Department of Civil Engineering, The University of Jordan, Amman, Jordan 2 Cities and Villages Development Bank, Amman, Jordan Correspondence: Amer Alkloub, Department of Civil Engineering, University of Jordan, Queen Rania St., Amman 11942, Jordan. Tel: 1-962-790-983689. E-mail: [email protected] Received: March 8, 2018 Accepted: March28, 2018 Online Published: April 17, 2018 doi:10.5539/mas.v12n5p9 URL: https://doi.org/10.5539/mas.v12n5p9 Abstract Piles are used for many types of structures to resist vertical and lateral loads. Design considerations of piles under lateral load are very crucial because the lateral performance of the pile foundations significantly influences the integrity of the structures supported by group of piles. Finite element study has been conducted to investigate the group interaction effect on the laterally loaded piles. This study investigates three factors, piles spacing, group arrangement, and group size. It has been concluded that: (1) As the piles spacing increases as the reduction factor increases and becomes close to one. (2) No reduction due to group interaction for piles spaced at eight times the pile diameter. (3) Group efficiency factor increases in piles that are arranged in a single row. (4) As the number of piles increases more reduction in the lateral resistance occurs. Keywords: finite element, piles, lateral load, interaction effect 1. Introduction Piles are usually constructed in groups and tied together by a concrete cap at the ground surface. The lateral load capacity of pile foundations is critically important in the design of structures which may be subjected to earthquakes, high winds, earth pressure, and vehicles impact in bridges. Because of the high cost and test setup difficulty of conducting lateral load tests on pile groups, FE analysis is currently widely conducted by using FE commercial programs which are available to make the analysis of soil-structure interaction possible. Once FE models are developed and calibrated based on available experimental data, FE models can be further used to estimate the response under different conditions. to investigate the lateral response of group of piles if an appropriate soil and concrete models were used. Piles in closely spaced groups behave differently than single isolated pile because of pile-soil-pile interactions that take place in the pile group (Butterfield and Banerjee 1971, Poulos 1968, Rollins et al. 2005). It is generally recognized that deflections of a pile in a closely spaced group are greater than the deflections of an individual pile at the same load because of these interaction effects. In other words, lateral stiffness of a single pile is larger than the lateral stiffness of one pile in a group of piles. Consequently, the maximum bending moment in a group will also be larger than that for a single pile, because the soil behaves as if it has less resistance, allowing the group to deflect more for the same load per pile. In this study, group interaction effect is studied using finite element method utilizing the general finite element software package ABAQUS by comparing the response of a single pile laterally loaded with the same response of a group of piles under the same conditions. Previous experimental study was conducted by Chandrasekaran et al. (2009) showed that the lateral capacity of piles in 3×3 group at three diameter spacing is about 40% less than that of the single pile. Rollins et al (2005) conducted a full-scale test on a single pile and 3×3 pile group at 3.3 pile diameter spacing, their tests showed that group interaction effects became progressively more important in reducing lateral resistance as pile spacing decreased from 5.65, to 4.4 to 3.3 pile diameters on centers and the lateral capacity for the front and trailing rows are 20% and 80% less, respectively than that of the single pile. Figure 2 illustrates the concept of pile group interaction.
Transcript of A Full 3-D Finite Element Analysis of Group Interaction ...

Modern Applied Science; Vol. 12, No. 5; 2018 ISSN 1913-1844 E-ISSN 1913-1852
Published by Canadian Center of Science and Education
9
A Full 3-D Finite Element Analysis of Group Interaction Effect on Laterally Loaded Piles
Amer Alkloub1, Rabab Allouzi1, Haider Alkloub2 & Ramia Al-Ajarmeh1 1 Department of Civil Engineering, The University of Jordan, Amman, Jordan 2 Cities and Villages Development Bank, Amman, Jordan Correspondence: Amer Alkloub, Department of Civil Engineering, University of Jordan, Queen Rania St., Amman 11942, Jordan. Tel: 1-962-790-983689. E-mail: [email protected] Received: March 8, 2018 Accepted: March28, 2018 Online Published: April 17, 2018 doi:10.5539/mas.v12n5p9 URL: https://doi.org/10.5539/mas.v12n5p9 Abstract Piles are used for many types of structures to resist vertical and lateral loads. Design considerations of piles under lateral load are very crucial because the lateral performance of the pile foundations significantly influences the integrity of the structures supported by group of piles. Finite element study has been conducted to investigate the group interaction effect on the laterally loaded piles. This study investigates three factors, piles spacing, group arrangement, and group size. It has been concluded that: (1) As the piles spacing increases as the reduction factor increases and becomes close to one. (2) No reduction due to group interaction for piles spaced at eight times the pile diameter. (3) Group efficiency factor increases in piles that are arranged in a single row. (4) As the number of piles increases more reduction in the lateral resistance occurs. Keywords: finite element, piles, lateral load, interaction effect 1. Introduction Piles are usually constructed in groups and tied together by a concrete cap at the ground surface. The lateral load capacity of pile foundations is critically important in the design of structures which may be subjected to earthquakes, high winds, earth pressure, and vehicles impact in bridges. Because of the high cost and test setup difficulty of conducting lateral load tests on pile groups, FE analysis is currently widely conducted by using FE commercial programs which are available to make the analysis of soil-structure interaction possible. Once FE models are developed and calibrated based on available experimental data, FE models can be further used to estimate the response under different conditions. to investigate the lateral response of group of piles if an appropriate soil and concrete models were used. Piles in closely spaced groups behave differently than single isolated pile because of pile-soil-pile interactions that take place in the pile group (Butterfield and Banerjee 1971, Poulos 1968, Rollins et al. 2005). It is generally recognized that deflections of a pile in a closely spaced group are greater than the deflections of an individual pile at the same load because of these interaction effects. In other words, lateral stiffness of a single pile is larger than the lateral stiffness of one pile in a group of piles. Consequently, the maximum bending moment in a group will also be larger than that for a single pile, because the soil behaves as if it has less resistance, allowing the group to deflect more for the same load per pile. In this study, group interaction effect is studied using finite element method utilizing the general finite element software package ABAQUS by comparing the response of a single pile laterally loaded with the same response of a group of piles under the same conditions. Previous experimental study was conducted by Chandrasekaran et al. (2009) showed that the lateral capacity of piles in 3×3 group at three diameter spacing is about 40% less than that of the single pile. Rollins et al (2005) conducted a full-scale test on a single pile and 3×3 pile group at 3.3 pile diameter spacing, their tests showed that group interaction effects became progressively more important in reducing lateral resistance as pile spacing decreased from 5.65, to 4.4 to 3.3 pile diameters on centers and the lateral capacity for the front and trailing rows are 20% and 80% less, respectively than that of the single pile. Figure 2 illustrates the concept of pile group interaction.

mas.ccsenet.org Modern Applied Science Vol. 12, No.5; 2018
10
Figure 1. Illustration of reduction in lateral pile resistance due to pile-pile interaction
Bridge Design Manual (BDM) from Washington State Department of Transportation proposed group reduction factors based on the piles spacing in the direction of loading. Table 1 shows group reduction factors proposed by BDM. Table 1. Group Efficiency Reduction Factors for Foundation Element Groups Subjected to Lateral Load (D: Pile diameter)
Center to Center Spacing (In direction of applied loading)
Efficiency Reduction Factor
8D 1.0 6D 0.9 5D 0.8 4D 0.65 3D 0.5 2D 0.4
This study aims to investigate the factors that affect the response of laterally loaded piles and compare the obtained results with previous works. Many tests were conducted to study what are the most significant factors that affect the group efficiency factor, for example: (1) Piles spacing, (2) Group arrangement, (3) Group size, and (4) Soil type. This study investigates three factors, piles spacing, group arrangement, and group size, which actually have the most significant impact on the group efficiency factor as recommended by previous work. Group efficiency

mas.ccsenet.org Modern Applied Science Vol. 12, No.5; 2018
11
factor proposed by the Bridge Design Manualinvestigated and compared with obtained results. To undertake this purpose, 24 Mathematical models were built to cover all cases of piles spacing at different piles arrangements. 2. Method To investigate the effect of the aforementioned factors on the group interaction effect of piles under lateral loads, laterally loaded single pile was modeled by ABAQUS and the resulting force-displacement curve was used to determine the single pile lateral stiffness (Kpile), after that in case of four piles arranged in 2 2 fashion, four piles (2 2) closely spaced (Different spacing and arrangements were studied) were modeled and force-displacement curve generated for a center point between the piles which will be used to determine the total stiffness for the pile group (Kgroup). It is expected for the four piles to have lateral stiffness less than 4 Kpile due to the group interaction effect which this study tried to investigate and expressed in Equation (1).
Kgroup: Lateral stiffness of group of piles.
Kpile: Lateral stiffness of a single pile.
N: Number of piles in a group
Center to center pile spacing is the dominant factor affecting pile group efficiency (R. L. Mokwa). During this study different ratios of center to center pile spacing to pile diameter studied which are: 1.5, 2, 2.5, 3, 3.5, 4, and 8. Different piles arrangement were studied to see the effect of piles arrangement on group efficiency factor. Figure 2 shows piles arrangement that used in the study.
Figure 2. Piles group arrangements
2.1 Soil and Pile Properties One layer of Clay soil was used in the study consist of a thick homogeneous layer of dry clay with an average drained shear strength cu = 10 kPa, a friction angle ф' = 30°, and a unit weight of 18 kN/m3. Drained soil condition was assumed in the study.Piles are concrete piles with a circular cross-section of 0.6 m diameter.Piles are made of 35 MPa concrete strength.Figure 3 shows soil and pile properties.
Figure 3. Soil and pile properties
Equation (1)
D = 0.6m L = 10m
Cu = 10 kPa ф' = 30° ρ = 18 kN/m3

mas.ccsenet.org Modern Applied Science Vol. 12, No.5; 2018
12
3. Mathematical Models Two modeling approaches were used in this study; two-dimensional model for a single pile under lateral load and three-dimensional model for the same pile used in the two-dimensional model. Each model comprises two parts: the concrete pile and the soil layer. For the soil brick dimensions, it is recommended for the length and the width of the brick to be greater than 30D, where D is the diameter of the pile, and the height of the brick should be greater than 2L, where L is the pile embedded length.Contact property was assigned between the pile and the soil layer which simulate the friction surface between the pile and soil.While boundary conditions assigned at the exterior faces of the soil brick to prevent soil layer from moving in the horizontal plane while it is free to settle in the gravity direction.Detailed discussion for each modeling approach is shown below. 3.1 Two-Dimensional Model Plain strain parts with thickness equal to 1 m were used for the two-dimensional model; the two-dimensional model and the finite element mesh are shown in Figure 4.The clay layer is 20 m deep and 20 m wide.The pile is initially in perfect contact with the soil.Soil was modeled as an elastic perfectly plastic material with Young’s modulus equal to 4 MPa and Poisson ratio equal to 0.3.Soil assigned plastic strain equal to 3%.Concrete material was assigned to the pile defined as an elastic material based on the fact that the pile is short pile so the soil is expected to yield before the pile yield.The interaction between the pile and the soil is simulated using a penalty-type interface between the pile and the soil with a friction factor of 0.3.
Figure 4. Soil-pile two-dimensional model
Planar shell elements were used to model the soil and the pile with 0.2 m mesh size for the soil layer and 0.1 m for the pile.The base of the clay layer is fixed in the x and y directions.The side edges allow sliding in the y direction (gravity direction), but prevent displacement in the x-direction.180 kN-lateral static load applied at the top of the pile as a surface traction. 3.2 Three-Dimensional Model Three-dimensional model consist of the soil brick and the pile is shown in Figure 5.The soil is modeled as a brick with 30 m side length and 20 m in height, while the pile modeled as 0.6m-diameter cylinder of 10m length.Soil was modeled as an elastic perfectly plastic material with Young’s modulus equal to 4MPa and Poisson ratio equal to 0.3.Soil assigned plastic strain equal to 3%.Concrete material was assigned to the pile defined as an elastic material based on the fact that the pile is short pile so the soil is expected to yield before the pile yield.Lateral static load was applied at the top of the pile as a surface traction of value equal to 636 kN/m2.The pile assumed to be in perfect contact with the soil at the start.The interaction between the pile and the soil simulated using penalty-type interface elements between the pile and the soil with a friction factor of 0.3.This type of interface is capable of describing the

mas.ccsenet.org Modern Applied Science Vol. 12, No.5; 2018
13
frictional interaction between the pile surface and the soil in contact.
Figure 5. Soil-pile three-dimensional model Pile and soil block were modeled by using eight-node linear brick elements with reduced integration and without pore water pressure.The base of the clay layer is fixed in the x, y, and z directions.The side planes allow sliding in the z (gravity direction) direction, but prevent displacement in the x- and y-directions.It is noted that the mesh is finer in the vicinity of the pile since that zone is the zone of stress concentration.In case of group of piles, constraint was assigned at the top of pile to simulate what piles cap doing in the real behavior.Pin type was used to constraint the piles tips together and the reference point assumed to be the centroidal point of the group of piles. Element type study was conducted to investigate the effect of the type element on the lateral response of a single pile where elements with and with reduced integration and triangle element were considered. Different level of mesh refinement was investigated by making the mesh course mesh in different level and making the mesh fine in different levels also. 4. Results and Discussion The pile ultimate capacity calculated using Brom’s Method was applied at the pile tip in the two-dimensional model. Figure 6 showsdisplacement contour in the x-direction in both the pile and the soil. The pile tip moved about 12 cm due to applying 180 kN-force in the lateral direction. It is clear from Figure 6 that there is a separation formed between the pile and the soil at the top third of the soil due to the applied lateral load, while another separation formed at the bottom of the pile due to the rigid rotational movement of the pile.
Figure 6. Displacement in X-direction due to the applied lateral load.

mas.ccsenet.org Modern Applied Science Vol. 12, No.5; 2018
14
Figure 7 shows S22 stresses in the pile. S22 stresses are concentrated at about 4.5 m (14.8 ft) from the top of the pile which means fixation point of the pile occurs at that location approximately. Bridge Design Manual locates the fixation point in piles or shafts at 4.6 m (15ft) below the soil surface, which close to what Figure 8 shows.
Figure 7. Pile normal stresses in Y-direction Figure 8 shows the linear part of force-displacement relationship achieved for the same pile-soil properties and loading by using the two- and three-dimensional modeling approach.It is obvious in Figure 9 that the three-dimensional model gives stiffer lateral response than that from the two-dimensional model, which can be justified because the pile in the three dimensional model is supported laterally by almost ½ of it parameter while the separation between the pile and the soil layer occurs at the other half of the pile parameter.In the two-dimensional model the soil supports the pile in one plane which is not true.Modeling the two-dimensional model in ABAQUS by using Axisymmetric part definition might gives a good results compared to the three-dimensional model.It is obvious in Figure 9 that there is a discrepancy between the two models so three-dimensional model approach was adopted in modeling of pile group during the whole study.
Figure 8. Lateral load – Displacement Relation in 2D and 3D models

mas.ccsenet.org Modern Applied Science Vol. 12, No.5; 2018
15
Figure 9. Opening contour in the pile
Figure 9 shows opening or gap contour in the pile due to applied lateral load at the top of the pile. Gray region at the top of the pile in Figure 9 shows the separation occurred between the pile and the soil due to the lateral load. Figure 10 shows lateral load versus displacement at the top of the pile for different pile arrangement spaced at three times the pile diameter. Linear relation between the force and displacement is shown at the beginning within the first 10 mm displacement after the linear relation, a nonlinear relation between force and displacement comes to the scene which is expected due to different source of nonlinearity either from geometry or material. Figure 11 shows displacement in the global x direction due to the applied lateral loading for different piles arrangements. Displacement contours in the direction of applied loads show the response interaction occurs between the piles where as the spacing between piles becomes greater as the interaction between piles gets smaller and smaller.
Figure 10. Lateral load versus displacement at the top of the pile for different piles arrangement (Piles spacing is
3 times the pile diameter)

mas.ccsenet.org Modern Applied Science Vol. 12, No.5; 2018
16
Figure 11. Displacement Contour in X-direction due to the applied lateral load. (a): Single pile, (b): 3 x 1 pile
arrangement, (c): 2 x 3 piles arrangement, and (d) 2 x 2 pile arrangement As mentioned above, this study aims to investigate the factors that affect the response of laterally loaded piles and compare the obtained results with previous works; so many ABAQUS models were built with different piles spacing and arrangements to undertake this aim. Table 2 shows piles spacing and arrangements and the corresponding file name. Table 2. ABAQUS files and the corresponding piles spacing, arrangement, and efficiency reduction factor.
ABAQUS File Name
Pile(s) Arrangement
Piles Spacing1
(D)2 Lateral Stiffness
(kN/m) Group Efficiency
Reduction Factor, p3 1x1Pile 1 Х 1 - 5262 1
2x1Piles-1.5D 2 Х 1 1.5D 7886 0.75 2x1Piles-2D 2 Х 1 2D 8286 0.79
2x1Piles-2.5D 2 Х 1 2.5D 8501 0.81 2x1Piles-4D 2 Х 1 4D 8958 0.85 2x1Piles-6D 2 Х 1 6D 9354 0.89 2x1Piles-8D 2 Х 1 8D 10166 0.97
2x2Piles-1.5D 2 Х 2 1.5D 11474 0.55 2x2Piles-2D 2 Х 2 2D 12589 0.60
2x2Piles-2.5D 2 Х 2 2.5D 13334 0.63 2x2Piles-3D 2 Х 2 3D 14120 0.67
2x2Piles-3.5D 2 Х 2 3.5D 15012 0.71 2x2Piles-4D 2 Х 2 4D 15315 0.73 2x2Piles-8D 2 Х 2 8D 21281 1.01 3x1Piles-2D 3 Х 1 2D 10744 0.68
(c)
(a)
mas.ccsenet.org Modern Applied Science Vol. 12, No.5; 2018
17
3x1Piles-3D 3 Х 1 3D 11670 0.74 3x1Piles-4D 3 Х 1 4D 12489 0.79 3x1Piles-6D 3 Х 1 6D 13701 0.87 3x1Piles-8D 3 Х 1 8D 15263 0.97 3x2Piles-2D 3 Х 2 2D 15583 0.49 3x2Piles-3D 3 Х 2 3D 17982 0.57 3x2Piles-4D 3 Х 2 4D 20035 0.63 3x2Piles-6D 3 Х 2 6D 24412 0.77 3x2Piles-8D 3 Х 2 8D 30184 0.96
Note 1. Center to center piles spacing divided by the diameter of the pile. Note 2. Pile diameter. Note 3. Group efficiency reduction factor.
From Table 2 many conclusions can be drawn; (1) As the piles spacing increases as the reduction factor increases and becomes close to one. (2) No reduction due to group interaction for piles spaced at eight times the pile diameter. (3) Group efficiency factor increases in piles are arranged in a single row. (4) As the number of piles increases more reduction in the lateral resistance occurs. As discussed in the literature review, numerous experimental tests were conducted and many methods were suggested to express the reduction in the lateral efficiency of group of piles. Table 3 compares reduction factor achieved by the present study and the reduction factors by various experimental and field studies Table 3. Comparison of p-Multiplier Values from Various Experimental and Field Studies (All Pile Groups with Pile Center-to-Center Spacing of 3 Pile Widths)
Author Piles Arrangement Group Efficiency Reduction Factor, p
Present study 2 Х 1 0.81 2 Х 2 0.67 3 Х 1 0.74 3 Х 2 0.57
Brown et al. (1987) 3 Х 3 0.5 Meimom et al. (1986) 2 Х 2 0.5 Rollins et al. (1998) 3 Х 3 0.4 McVay et al. (1995) 3 Х 3 0.4
Figure 12 shows group efficiency factor varies with different piles spacing and arrangement.Group efficiency factor varies significantly between different piles arrangement at small piles spacing, while this difference getting smaller as the piles spacing getting bigger.It is obvious from Figure 13 that the BDM recommends very low efficiency factor for piles spaced at five times the pile diameter or less, while the BDM recommends a larger value of efficiency reduction factor for pile arrangement spaced at large distance.

mas.ccsenet.org Modern Applied Science Vol. 12, No.5; 2018
18
Figure 12. Comparison of p-Multiplier Values from the present study and the BDM
4.1 Mesh Refinement Study Mesh refinement study was conducted on the single pile model because refining mesh on multiple-piles models takes very long time for running (more than 7 hours).Different levels of mesh size were investigated to find what level of refinement is accepted to converge to the good approximate solution in reasonable time.The typical mesh size used in the study which found reasonable is by seeding the edge of the pile for 8 elements and 30 elements for each edge of the soil block.Table 4 shows the level of refinement used to conduct the mesh refinement study on the single pile model. Table 4. Level of refinement for pile and soil brick.(Single pile arrangement)
Refinement Level Pile Seeding
Soil Brick Seeding1
Running Time (Hours)
Very Fine Mesh 12 45 7 Fine Mesh 10 35 3
Normal Mesh 8 30 1.5 Course Mesh 6 20 1
Very Course Mesh 4 15 0.75 Note 1. Seeding for each side of the soil brick. Figure 13 shows the response of the single pile under lateral load with different level of refinement. All mesh levels gives almost same response in the linear response except the very course mesh because of problems in stress concentration at the edge of piles since the pile become square in very course level.Figure 14 shows the stress concentration occurred at very course mesh level which gives softer solution than the other curves.

mas.ccsenet.org Modern Applied Science Vol. 12, No.5; 2018
19
Figure 13. Lateral load versus displacement at the top of the pile for different mesh level
Figure 14. Using very course mesh results in stress concentration occurred at the pile corner due to lateral loads
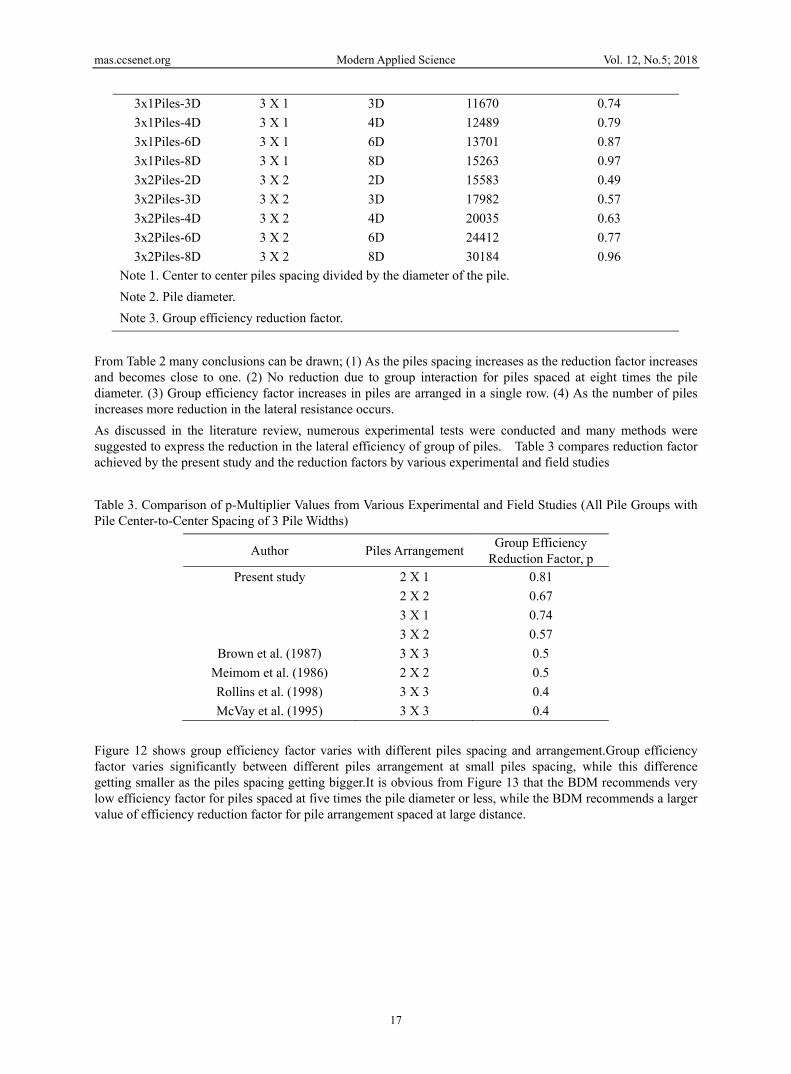
4.2 Element Type Study For the single pile model, five types of elements were investigated to know the effect of the element type on the response of the pile under lateral loading.Figure 16 shows lateral load versus displacement at the top of the pile using different element types (CPE3, CPE4R, CPE4, CPE8R, and CPE8).It is obvious from Figure 16 that
mas.ccsenet.org Modern Applied Science Vol. 12, No.5; 2018
20
elements with high number of nodes (i.e. CPE8R, and CPE8) give softer solution than what element with fewer nodes give.Elements with reduced integration (i.e. CPE4R, and CPE8R) give softer solution than the other types of element.All elements behave the same in the linear part of the analysis as shown in Figure 16.
Figure 15. Lateral load versus displacement at the top of the pile for single pile model using different elements
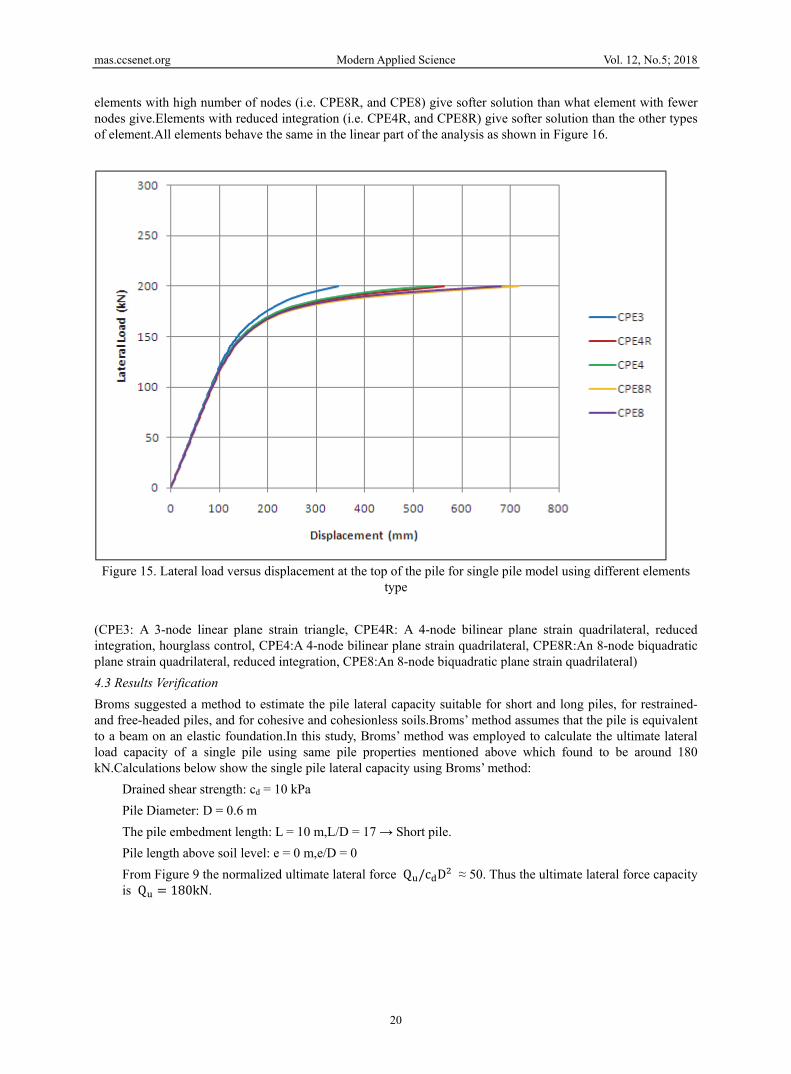
type (CPE3: A 3-node linear plane strain triangle, CPE4R: A 4-node bilinear plane strain quadrilateral, reduced integration, hourglass control, CPE4:A 4-node bilinear plane strain quadrilateral, CPE8R:An 8-node biquadratic plane strain quadrilateral, reduced integration, CPE8:An 8-node biquadratic plane strain quadrilateral) 4.3 Results Verification Broms suggested a method to estimate the pile lateral capacity suitable for short and long piles, for restrained- and free-headed piles, and for cohesive and cohesionless soils.Broms’ method assumes that the pile is equivalent to a beam on an elastic foundation.In this study, Broms’ method was employed to calculate the ultimate lateral load capacity of a single pile using same pile properties mentioned above which found to be around 180 kN.Calculations below show the single pile lateral capacity using Broms’ method:
Drained shear strength: cd = 10 kPa Pile Diameter: D = 0.6 m The pile embedment length: L = 10 m,L/D = 17 → Short pile. Pile length above soil level: e = 0 m,e/D = 0 From Figure 9 the normalized ultimate lateral force Q /c D ≈ 50. Thus the ultimate lateral force capacity is Q = 180kN.

mas.ccsenet.org Modern Applied Science Vol. 12, No.5; 2018
21
Figure 16. Broms’ method solution for short piles embedded in cohesive soils
5. Conclusions Average lateral load resistance is a function of pile spacing and piles arrangement, while the piles spacing increases as the reduction factor increases and becomes close to one.No reduction due to group interaction for piles spaced at eight times the pile diameter because each pile starts to respond alone to the applied lateral loads with interaction in response with other piles in the group.Group efficiency factor increases in piles arranged in a single row, while as the number of piles increases and gets complicated in arrangement more reduction in the lateral resistance will be. Modeling of the soil brick with length of the brick equal to 30D is enough in case of single pile model, while in case of group of piles further length should be used. Element size equal to 1m for soil meshing could be a good size in case of using desktop computers.Very course mesh will result in a very soft response and stress concentration. Using elements with reduced integration results in softer solution than element without reduced integration. Group efficiency factor varies significantly between different piles arrangement at small piles spacing, while this difference getting smaller as the piles spacing getting bigger. The BDM recommends very low efficiency factor for piles spaced at five times the pile diameter or less, while the BDM recommends a larger value of efficiency reduction factor for pile arrangement spaced at large distance. References ABAQUS/CAE 6.11-1 (2011). Dassault Systèmes Inc., United States. Butterfield, R., & Banerjee. K. (1971). The Problem of Pile Group–Pile Cap Interaction.Géotechnique, 21(2),
135-142. Poulos H. (1976). Behavior of laterally loaded piles near a cut or slope. Australian Geomechanics Journal, 6-12. Rollins, K. et al (2005). Measured and Computed Lateral Response of a Pile Group in Sand. Journal of
Geotechnical and Geoenvironmental Engineering. Sam, H. (2007). Applied Soil Mechanics: with ABAQUS Applications. John Wiley & Sons, Inc. ISBN:
978-0-471-79107-2. Washington Department of Transportation. (2011). Bridge Design Manual M23-50. Copyrights Copyright for this article is retained by the author(s), with first publication rights granted to the journal. This is an open-access article distributed under the terms and conditions of the Creative Commons Attribution license (http://creativecommons.org/licenses/by/4.0/).