A French corporation with an Executive Board and a ......of any legal opinion and Aubay expressly...
14
A French corporation with an Executive Board and a Supervisory Board with share capital of €11,315,730. Registered office: 113 Boulevard de la Bataille de Stalingrad 69100 Villeurbanne Lyon Trade and Company Register (RCS) No. 331 518 498 Translation disclaimer: This document is a free translation of the original French language version of the interim financial report (rapport semestriel) provided solely for the convenience of English-speaking readers. This report should consequently be read in conjunction with, and construed in accordance with French law and French generally accepted accounting principles. While all possible care has been taken to ensure that this translation is an accurate representation of the original French document, this English version has not been audited by the company’s statutory auditors and in all matters of interpretation of information, views or opinions expressed therein, only the original language version of the document in French is legally binding. As such, the translation may not be relied upon to sustain any legal claim, nor be used as the basis of any legal opinion and Aubay expressly disclaims all liability for any inaccuracy herein.
Transcript of A French corporation with an Executive Board and a ......of any legal opinion and Aubay expressly...

A French corporation with an Executive Board and a Supervisory Board with share capital of €11,315,730.
Registered office: 113 Boulevard de la Bataille de Stalingrad
69100 Villeurbanne
Lyon Trade and Company Register (RCS) No. 331 518 498
Translation disclaimer: This document is a free translation of the original French language version of the interim financial report (rapport semestriel) provided solely for the convenience of English-speaking readers. This report should consequently be read in conjunction with, and construed in accordance with French law and French generally accepted accounting principles. While all possible care has been taken to ensure that this translation is an accurate representation of the original French document, this English version has not been audited by the company’s statutory auditors and in all matters of interpretation of information, views or opinions expressed therein, only the original language version of the document in French is legally binding. As such, the translation may not be relied upon to sustain any legal claim, nor be used as the basis of any legal opinion and Aubay expressly disclaims all liability for any inaccuracy herein.
ASSETS (€ thousands) Notes 06/30/2019 12/31/2018
Goodwill 2 6,113 6,082
Intangible assets 3 22,689 22,014
Property, plant and equipment 4/5 8,653 7,050
Financial assets 3,734 3,745
Equity-accounted investments 995 744
Non-current assets 42,184 39,635
Inventories 187 147
Trade receivables 21,868 20,516
Deferred tax assets 521 524
Other receivables and accruals 4,124 5,035
Cash and marketable securities 6 19,247 22,794
Current assets 45,947 49,016
TOTAL ASSETS 88,131 88,651
SHAREHOLDERS' EQUITY AND LIABILITIES (€
thousands) Notes 06/30/2019 12/31/2018
Share capital 11,445 11,218
Additional paid-in capital 20,105 19,681
Consolidated income (loss) 5,450 8,843
Reserves and retained earnings 14,658 8,027
Shareholders’ equity 7 51,658 47,769
Attributable to the parent 51,658 47,769
Attributable to non-controlling interests 0 0
Provisions for contingencies and expenses 9 1,498 1,492
Borrowings and financial liabilities 10 7,166 9,318
Trade payables 6,941 6,157
Tax and employee-related liabilities 12,079 14,415
Deferred tax liabilities 432 430
Other payables and accruals 11 8,357 9,070
Payables 34,975 39,390
TOTAL SHAREHOLDERS' EQUITY AND LIABILITIES 88,131 88,651

(€ thousands) Note 06/30/2019 % of
sales 06/30/2018
% of sales
Sales 12 50,135 100% 42,415 100%
Own production of goods and services capitalized 13 3,192 6% 2,968 7%
Other operating income 562 1% 527 1%
Cost of sales -897 -2% -720 -2%
Change in inventory 28 0% -27 0%
Other operating expenses -13,309 -27% -11,088 -26%
Staff costs -27,883 -56% -23,481 -55%
Tax and similar expenses -668 -1% -600 -1%
Net allowances for amortization and depreciation -3,650 -7% -3,182 -8%
Net allowances for provisions -287 -1% -172 0%
Operating profit 7,223 14% 6,640 16%
Net financial income / (expense) 14 116 0% 2 0%
Current operating income of consolidated operations 7,339 15% 6,642 16%
Net exceptional items 139 0% 14 0%
Income taxes -2,279 -5% -1,895 -4%
Share of income from equity-accounted associates 251 1% 151 0%
Allowances for goodwill amortization 0 0
Net income 5,450 11% 4,912 12%
Basic earnings per share in euros 15 1.02 0.93
Diluted earnings per share in euros 1.00 0.85

(€ thousands)
Capital stock and
additional paid-in capital
Translation
difference
Net income and
retained earnings
Equity attributable
to the parent
Non-
controlling interests
Consolidated
shareholders' equity
Balance at January 1, 2018 30,238 -972 10,354 39,620 0 39,620
Annual profit/(loss) 4,912 4,912 4,912
Currency translation adjustments 367 367 367
Stock options 313 313 313
Treasury shares 0 0
Dividends -1,756 -1,756 -1,756
Changes in Group structure of consolidated operations
0 0
Other changes 0 0
Balance as of June 30, 2018 30,551 -605 13,510 43,456 0 43,456
Balance at January 1, 2019 30,899 -446 17,316 47,769 0 47,769
Annual profit/(loss) 5,450 5,450 5,450
Currency translation adjustments 122 122 122
Stock options 554 554 554
Treasury shares 0 0
Dividends -2,237 -2,237 -2,237
Changes in Group structure of
consolidated operations 0 0 0
Other changes 0 0
Balance as of June 30, 2019 31,453 -324 20,529 51,658 0 51,658

(€ thousands) 06/30/2019 06/30/2018 12/31/2018
Consolidated net income 5,450 4,912 8,843
Adjustments to reconcile non-cash items to cash generated from operations:
Net allowances for depreciation and provisions 3,676 3,169 7,170
- Carrying value of assets sold 11 0 65
- Proceeds from the disposal of assets -15 -3 -59
Cash flows after net financial expense 9,122 8,078 16,019
Tax liabilities 2,279 1,895 2,940
Taxes paid -1,887 -1,335 -2,795
Interest expense and income 25 35 120
Change in operating working capital -3,035 -1,643 -650
NET CASH PROVIDED BY/ (USED IN) OPERATING ACTIVITIES 6,504 7,030 15,634
Acquisition of intangible assets -5,954 -3,831 -7,792
Acquisition of property, plant and equipment 15 3 279
Proceeds from the disposal of PPE and intangible assets -80 -274 -46
Change in non-current investments -282 -288 -543
NET CASH PROVIDED BY/ (USED IN) INVESTING ACTIVITIES -6,301 -4,390 -8,102
Dividends paid to shareholders of the parent company -2,237 -1,756 -1,756
Capital increases or contributions
Issuance costs for capital increases
Amount received from the exercise of stock options 554 313 661
Change in treasury shares
Repayment of borrowings – finance leases -2,177 -2,231 -4,398
Change in borrowings
NET CASH PROVIDED BY / (USED IN) FINANCING ACTIVITIES -3,860 -3,674 -5,493
NET CHANGE IN CASH AND CASH EQUIVALENTS -3,657 -1,034 2,039
Effect of exchange rate changes on cash 110 84 124
Cash and cash equivalents at beginning of year 22,794 20,632 20,632
Cash and cash equivalents at end of year 19,247 19,682 22,794

1. Significant accounting policies, basis of consolidation Adoption and approval of the accounts
The condensed consolidated financial statements of Esker Group at June 30, 2019 were adopted by the Executive Board and submitted for approval to the Supervisory Board on September 12, 2019.
Statement of compliance
The consolidated financial statements were presented on the basis of French law and French GAAP and notably the accounting policies set out in Regulation 99-03 of April 29, 1999 on the French General Chart of Accounts (Plan Comptable Général) of France's Accounting Regulations Committee (Comité de Reglementation Comptable or "CRC") and the subsequent updates resulting from CRC Regulations 2005-05 and 2000-06.
Also applied were CRC Regulation 2004-06 of November 23, 2004 on the definition, recognition and measurement of assets and CRC Regulation 2002-10 of December 12, 2002 on the depreciation, amortization and impairment of assets.
Use of estimates
The financial statements reflect the assumptions and estimates made by the Group. The preparation of financial statements requires the use of estimates and assumptions to measure certain assets, liabilities expenses and commitments. Actual data may differ from those resulting from these assumptions and estimations.
Group structure for consolidation
There have been no changes in the consolidation scope in the 2019 first half.
Company Head office
2019 2018
Consolidation
method (1) Controlling
interest (%)
Ownership interest
(%)
Controlling interest
(%)
Ownership interest
(%)
ESKER Lyon (France) Parent company
Esker GmbH Essen (Germany) 100.0% 100.0% 100.0% 100.0% F
Esker Ltd Derbyshire (United Kingdom) 100.0% 100.0% 100.0% 100.0% F
Esker Srl Milan (Italy) 100.0% 100.0% 100.0% 100.0% F
Esker Iberica Sl Madrid (Spain) 99.8% 99.8% 99.8% 99.8% F
Esker Inc. Madison (United States) 100.0% 100.0% 100.0% 100.0% F
Esker Australia Pty Ltd Sydney (Australia) 100.0% 100.0% 100.0% 100.0% F
Esker Documents
Automation Asia Pte Ltd Singapore 100.0% 100.0% 100.0% 100.0% F
Esker Documents Automation (M) Sdn Bhd
Kuala Lumpur (Malaysia) 100.0% 100.0% 100.0% 100.0% F
Esker Solution Canada Inc. Montreal (Canada) 100.0% 100.0% 100.0% 100.0% F
Esker Documents Automation (HK) Ltd
Hong Kong 100.0% 100.00% 100.0% 100.0% F
CalvaEdi Paris (France) 100.0% 100.0% 100.0% 100.0% F
TermSync Madison (United States) 100.0% 100.0% 100.0% 100.0% F
E-integration Ratingen (Germany) 100.0% 100.0% 100.0% 100.0% F
Neotouch Cloud Solution Dublin (Ireland) 30.0% 30.0% 30.0% 30.0% E.M.
(1): F : Full Consolidation, E.M. : Equity method

Seasonal nature of business for the period
The Group's business is characterized by a degree of seasonality with revenue historically higher in the last quarter. However, the magnitude of this seasonal variation is nevertheless variable in nature and as such difficult to quantify.
2. Notes to the balance sheet, income statement and statement of cash flows
Note 1 Segment reporting
Esker Group has chosen to apply geographical segmentation as its sole criteria for segment reporting. According to the criteria, business is broken down into six main segments: France (of which CalvaEdi), Germany (of which e-integration), the United Kingdom, southern Europe, Asia-Pacific and the Americas.
As of June 30, 2019In thousands
of euros France Germany
United
Kingdom
Southern
Europe
Australia,
Asia Americas
Total
Group
External sales 21,057 2,919 2,248 2,811 2,562 18,538 50,135
Property, plant and equipment and intangible assets
27,066 210 17 658 128 3,263 31,342
As of June 30, 2018In thousands
of euros France Germany
United Kingdom
Southern Europe
Australia, Asia
Americas Total
Group
External sales 17,637 3,147 1,949 2,201 2,185 15,296 42,415
Property, plant and equipment and
intangible assets 26,185 99 29 107 46 2,163 28,629
Note 2 Goodwill
06/30/2019 12/31/2018
In thousands of euros Gross Amortization Net Net
TermSync 5,083 94 4,989 4,958
CalvaEdi 137 2 135 135
E-integration 989 989 989
TOTAL GOODWILL 6,209 96 6,113
6,082
Changes recorded in H1 2019
As of 06/30/2019In thousands of euros Opening balance
Increases Reductions Currency
effect Closing balance
TermSync 5,052 31 5,083
CalvaEdi 137 137
E-integration 989 989
GOODWILL - GROSS VALUE 6,178 0 0 31 6,209
TermSync 94 94
CalvaEdi 2 2
E-integration 0 0
GOODWILL - AMORTIZATION 96 0 0 0 96
GOODWILL - NET VALUE 6,082 0 0 31 6,113
As from July 1, 2016, goodwill is amortized over the period of its useful life. Goodwill is considered indefinite and is no longer amortized.
Goodwill is tested for impairment in the period.
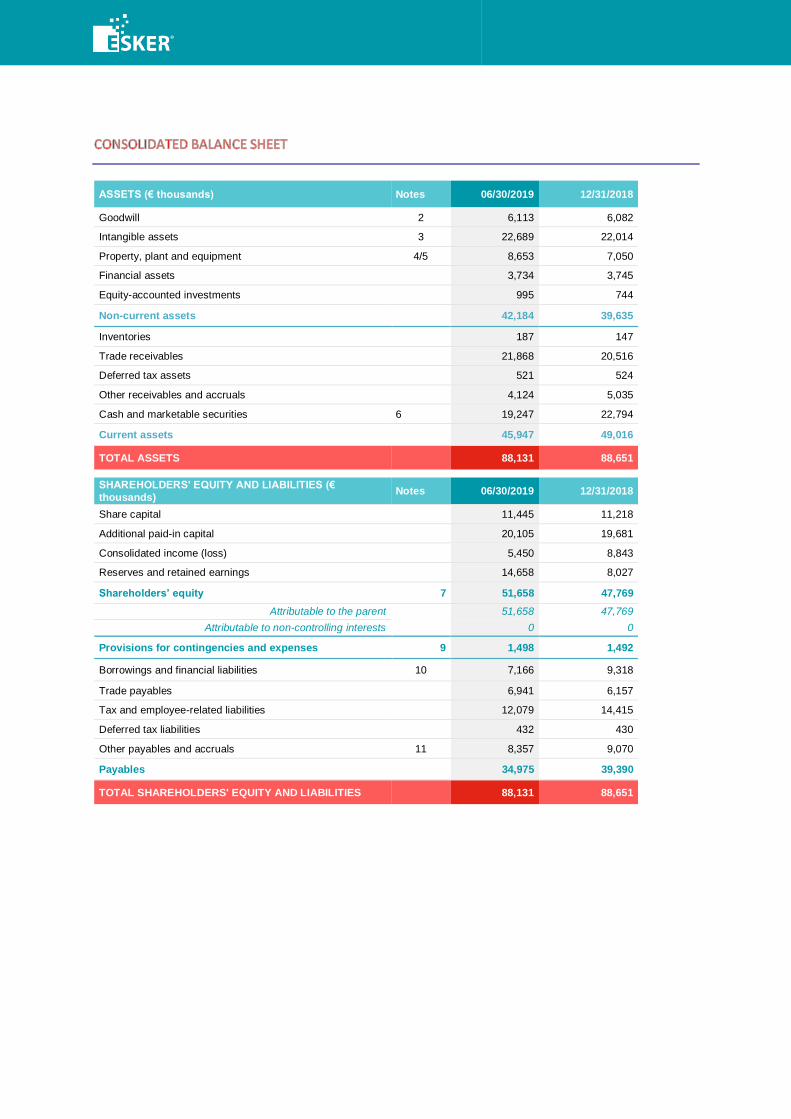
Note 3 Intangible assets
06/30/2019 12/31/2018
In thousands of euros Gross Amortization Net Net
Development expenditures 36,705 25,142 11,563 11,054
Trademarks 1,630 1,630 1,627
Software 1,787 1,695 92 131
Customer-related intangible assets 7,410 1,195 6,215 6,428
Intangible assets in progress 3,189 3,189 2,774
TOTAL INTANGIBLE ASSETS 50,721 28,032 22,689
22,014
Development expenditures recorded under intangible assets include:
Costs incurred for the development of document process automation applications;
Costs for the development of on-demand services for our complete offering of solutions.
Changes recorded in H1 2019
As of 06/30/2019In thousands of euros Opening balance
Increases Reductions Other
changes Closing balance
Development expenditures 33,922 2,783 36,705
Trademarks 1,627 3 1,630
Software 1,836 37 -91 5 1,787
Customer-related intangible assets 7,410 7,410
Intangible assets in progress 2,774 3,191 -2,776 3,189
INTANGIBLE ASSETS – GROSS VALUE 47,569 3,228 -91 15 50,721
Development expenditures 22,868 2,272 2 25,142
Software 1,705 76 -90 4 1,695
Customer-related intangible assets 982 213 1,195
INTANGIBLE ASSETS – AMORTIZATION 25,555 2,561 -90 6 28,032
INTANGIBLE ASSETS – NET VALUE 22,014 667 -1 9 22,689
Changes recorded concern development expenditures capitalized in the period and concerning mainly expenditures incurred in connection with our SaaS (Software as a Service) solutions.
Note 4 Property, plant and equipment
06/30/2019 12/31/2018

In thousands of euros Gross Amortization Net Net
Land 1,077 1,077 983
Buildings 1,179 82 1,097 815
Office and computer equipment 6,079 3,628 2,451 1,660
Fixtures and improvements 3,363 880 2,483 2,007
Equipment and tooling 6,838 5,963 875 1,006
Transport equipment 62 22 40 48
Furniture 985 355 630 531
TOTAL PROPERTY, PLANT AND EQUIPMENT 19,583 10,930 8,653
7,050
Changes recorded in H1 2019
As of 06/30/2019In thousands of euros Opening balance Increases Reductions Other
changes
Closing
balance
Land 983 94 1,077
Buildings 873 306 1,179
Office and computer equipment 5,017 1,271 -215 6 6,079
Fixtures and improvements 2,722 640 -2 3 3,363
Equipment and tooling 6,695 249 -108 2 6,838
Transport equipment 64 -2 62
Furniture 816 167 2 985
PROPERTY, PLANT AND EQUIPMENT – GROSS VALUE
17,170 2,727 -327 13 19,583
Buildings 58 24 82
Office and computer equipment 3,357 466 -200 5 3,628
Fixtures and improvements 715 166 -1 880
Equipment and tooling 5,689 378 -108 4 5,963
Transport equipment 16 7 -1 22
Furniture 285 69 1 355
PROPERTY, PLANT AND EQUIPMENT – DEPRECIATION
10,120 1,110 -310 10 10,930
PROPERTY, PLANT AND EQUIPMENT – NET VALUE
7,050 1,617 -17 3 8,653
Note 5 Finance leases
In thousands of euros Gross Accumulated
amortization
Net
As of December 31, 2017 6,096 -4,273 1,823
Increase 0 -849 -849
Decrease -149 149 0
Translation difference 0 0 0
As of December 31, 2018 5,947 -4,973 974
Increase -364 -364
Decrease 0
Translation difference 0
As of June 30, 2019 5,947 -5,337 610
Finance lease commitments for the six-month period ended June 30, 2019 break down as follows:

In thousands of euros
Less than 1 year
2-5 years More than 5 years
TOTAL
Total value of future minimum lease payments 363 82 445
Discounted value of future minimum lease payments 354 80 434
Note 6 Cash and marketable securities
In thousands of euros Net value 06/30/2019 Net value 12/31/2018
Marketable securities 393 493
Cash and cash equivalents 18,854 22,301
TOTAL CASH AND MARKETABLE SECURITIES 19,247 22 94
Marketable securities correspond to shares in Sicav money market funds and time deposits not subject to a risk of loss in value.
Note 7 Shareholders' equity
Amount (€ thousands) Number of shares
Capital stock at 12/31/2017 10,961 5,480,366
Capital increases 125 62,600
Exercise of stock options and warrants 132 65,999
Capital stock at 12/31/2018 11,218 5,608,965
Capital increases 98 48,900
Exercise of stock options and warrants 129 64,733
CAPITAL STOCK AT 06/30/2019 11,445 5,722,598
The Company is subject to no specific regulatory or contractual obligations in respect to the share capital. The Group does not have a specific policy concerning share capital. The balance between recourse to external financing and equity financing through capital increases by the issue of new shares is assured on a case-by-case basis according to the transactions under consideration. Share capital monitored by the Group includes the same components as consolidated shareholders' equity.
A dividend of €0.41 per share was paid for the period.
Note 8 Stock option and restricted stock unit plans
Changes in the number of stock options, restricted stock units (RSU) and warrants granted to Group employees in the 2019 first half break down as follows:
Stock options Bonus shares granted, not issued
Quantity Weighted average exercise price in €
Quantity Weighted average exercise price in €
Balance exercisable at 12/31/2018 198,380 20.07 48,900 46.55
Granted 28,750 79.75 82,300 84.20
Exercised -64,733 8.56 -48,900 46.55
Matured or forfeited for reason of departure -1,500 2.74 0 0.00
Balance exercisable at 06/30/2019 160,897 35.78 82,300 84.20

Note 9 Provisions
In thousands of euros
12/31/2018 Increases,
allowances of the period
Payments
in the period
Reversals of
provisions unused in the
period
Other
changes
06/30/2019
Provisions for contingencies and expenses
130 (130) 0
Pension liabilities 1362 147 -11 1498
TOTAL PROVISIONS 1,492 147 -11 -130 0 1,498
Pension liabilities consist of commitments relating to retirement severance payments for employees of Esker France and contributions payable to employees of Esker Italy.
Pension obligations for retirement severance benefits for Esker France employees are calculated annually using the projected unit credit method. This calculation is made in accordance with the provisions provided for under the applicable collective bargaining agreement (SYNTEC) according to the following criteria:
Estimated age of retirement,
Seniority of personnel on the retirement date;
Probability of continued presence at retirement age;
Salary escalation rate;
Discount rate.
In addition, since 2016, a portion of the pension obligations in France have been partially covered by an external plan destined to be gradually increased through premium payments. There were no additional payments in the 2019 first half.
NOTE 10 Financial liabilities
In thousands of euros 06/30/2019 12/31/2018
Finance leases 628 998
Bank debt 6,538 8,320
TOTAL BORROWINGS 7,166 9,318
Finance leases
Borrowings recognized represent the reverse entry of capitalized finance leases as described above in note 4.
Note 11 Other payables and accruals
In thousands of euros 06/30/2019 12/31/2018
Deferred revenue 5,440 6,250
Customer deposits and guarantees 2,849 2,765
Other payables 68 55
TOTAL OTHER PAYABLES AND ACCRUALS 8,357 9,070
Deferred revenue concerns primarily maintenance contracts for which sales are recognized on a straight-line basis
over the duration of the contract.

Note 12 Revenue
In thousands of euros 06/30/2019 06/30/2018
Software sales 1,225 982
Fax card sales 164 305
Contracts for product updates and maintenance 3,494 3,683
Services 8,657 7,872
Traffic 36,595 29,573
NET SALES 50,135 42,415
Note 13 Research and development expenses
In thousands of euros 06/30/2018 06/30/2018
R&D expenses for the period -4,627 -4,183
Capitalized development expenditures 3,192 2,968
Amortization of capitalized development expenditures -2,272 -1,969
RESEARCH AND DEVELOPMENT EXPENSES NOT CAPITALIZED -3,707 -3,184
An analysis of development expenditures recorded under intangible assets in the 2019 first half is presented in Note
2.
Note 14 Net financial income (expense)
In thousands of euros 06/30/2019 06/30/2018
Financial income 288 75
Net currency gains/(losses) -5 -37
Financial expenses -167 -36
NET FINANCIAL INCOME / (EXPENSE) 116 2

Note 15 Earnings per share
06/30/2019 06/30/2018
Net earnings
(in euros)
Weighted average
number of shares
Net earnings
(in euros)
Weighted average
number of shares
Basis of calculation for basic earnings per share
5,450,000 5,353,058 4,912,000 5,272,262
Dilutive stock options 83,415 141,609
Dilutive bonus shares 3,277 370,509
Basis of calculation for diluted earnings per share
5,450,000 5,439,750 4,912,000 5,784,380
Basic earnings per share 1.02 0.93
Diluted earnings per share 1.00 0.85
Basic net earnings per share and diluted net earnings per share are calculated by dividing the portion of net income
reverting to the Group by the appropriate number of shares. For basic net earnings per share, this is the weighted
average number of ordinary shares outstanding after excluding treasury shares held by the company.
For diluted net earnings per share, the calculation is based on the weighted average number of potential shares
outstanding in the period. This includes notably shares taken into account to calculate basic net earnings per share
plus dilutive stock options, warrants and bonus shares.
Note 16 Transactions with related parties
Commercial relations between majority-owned Esker Group companies
In connection with commercial relations between Esker Group member companies, amounts are invoiced for the
following:
Sales of solutions by the parent company to subsidiaries,
Royalties,
Marketing expense chargebacks,
Staff costs chargebacks.
All these transactions are carried out on an arms-length basis and fully eliminated in the consolidated financial
statements.
Other transactions with related parties
Compensation and benefits of any nature paid to corporate officers considered as related parties are presented
below.
In thousands of euros 06/30/2019 06/30/2018
Supervisory Board 50 50
Executive Board 463 458
Total 513 508
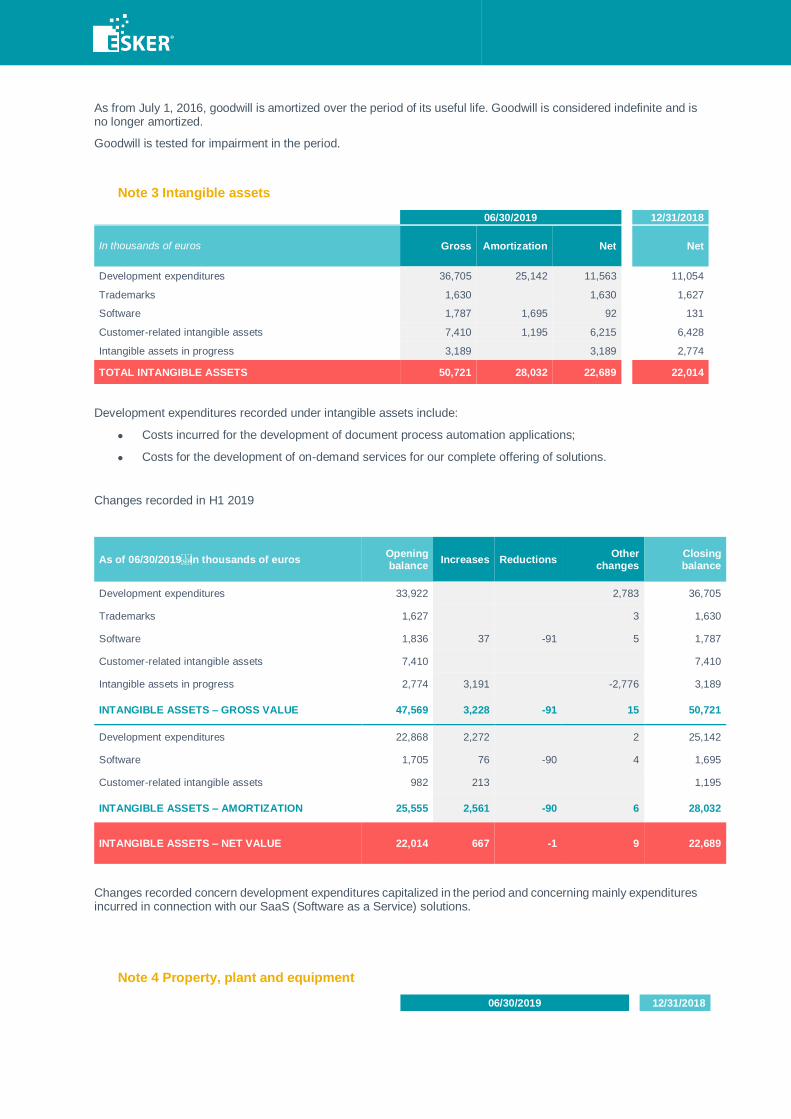
Note 17 Off-balance sheet commitments
Off-balance sheet commitments and contingent liabilities are presented below.
Contractual obligations (€ thousands)
TOTAL
Payables by maturity
Less than 1 year
1-5 years More than
5 year Expense of the period
Long-term debt -
Lease finance obligations Information disclosed in note 4
Operating leases 12,412 2,933 7,630 1,849 1,740
Irrevocable purchase obligations -
Other long-term obligations -
TOTAL 12,412 2,933 7,630 1,849 1,740
Note 18 Post-closing events
None.