A Free Orientation on Statistical Data Analysis is conducted on Saturday 25/07/2015 at 10 AM and it...
46
Statistical Data Analysis • Developments in the field of statistical data analysis often follow advancements in other fields to which statistical methods are applied. • Decision making process under uncertainty is largely based on application of statistical data analysis.
-
Upload
sevuga-perumal -
Category
Data & Analytics
-
view
52 -
download
1
Transcript of A Free Orientation on Statistical Data Analysis is conducted on Saturday 25/07/2015 at 10 AM and it...

Statistical Data Analysis
• Developments in the field of statistical data analysis often follow advancements in other fields to which statistical methods are applied.
• Decision making process under uncertainty is largely based on application of statistical data analysis.

Data, Information, Facts & Knowledge
Data is known to be crude information and not knowledge by itself.
The sequence from data to knowledge is: from Data to Information, from Information to Facts, and finally, from Facts to Knowledge.

Statistical Model & Decision Making
Statistical skills enable you to intelligently collect, analyze and interpret data relevant to their decision-making.

Data Science
• Data science is the process of formulating a quantitative question that can be answered with data.
• Collecting and cleaning the data,
• Analyzing the data, and
• Communicating the answer to the question to a relevant audience.
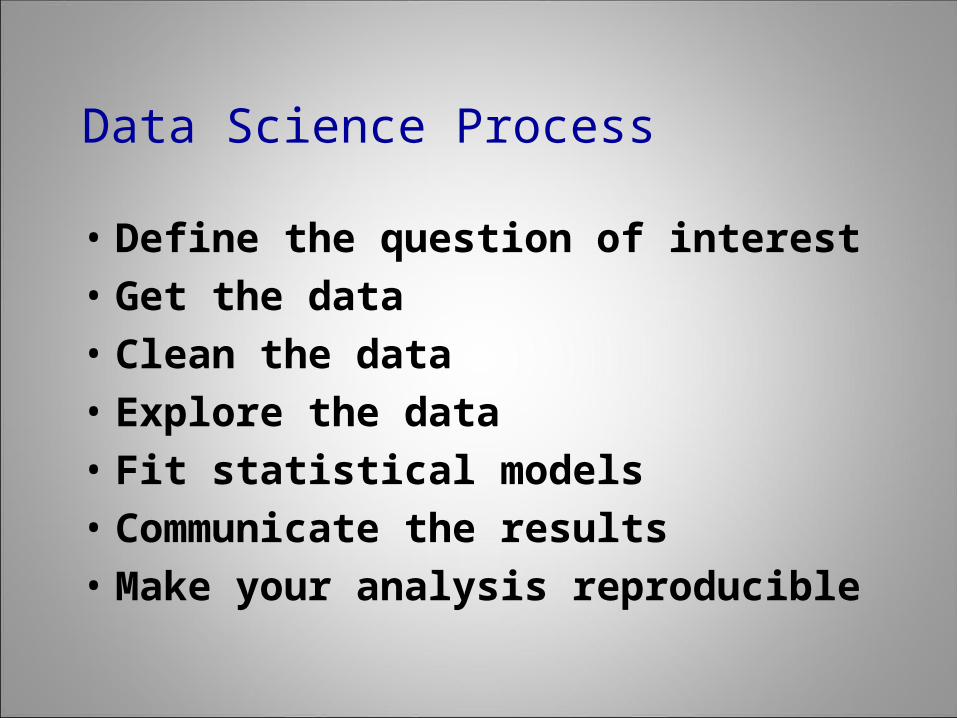
Data Science Process
• Define the question of interest
• Get the data
• Clean the data
• Explore the data
• Fit statistical models
• Communicate the results
• Make your analysis reproducible

Data Analytics vs Data Science:
• A “Data Analyst” focuses on the movement and interpretation of data, typically with a focus on the past and present.
• A “Data Scientist” focuses on summarizing data to provide forecasting based on the patterns identified from past and current data

CRISP-DM process model

CRISP-DM process model
• Business understanding – Determine Business Objectives, Assess Situation, Determine Data Mining Goals, Produce Project Plan
• Data understanding – Collect Initial Data, Describe Data, Explore Data, Verify Data Quality
• Data preparation – Select Data, Clean Data, Construct Data, Integrate Data
• Modeling – Select modeling technique, Generate Test Design, Build Model, Assess Model
• Evaluation - Evaluate Results, Review Process, Determine Next Steps
• Deployment – Plan Deployment, Plan Monitoring and Maintenance, Produce Final Report, Review Project

Data Analytics vs Data Science:

Case Study
• A large organization wants to improve call center performance and extract tactical business value from call center data
• In the above case, the Data Analyst and Scientist would both use data but, in different ways.
• The Data Analyst would be concerned with reporting metrics, such as average call time.
• The Data Scientist would be concerned with using the historical data to predict the future, such as predicting future months call volumes.

Case Study

Statistical analysis
• It’s the science of collecting, exploring and presenting large amounts of data to discover underlying patterns and trends.
• Statistics are applied every day – in research, industry and government

Statistical analysis - Examples
• Manufacturers use statistics to weave quality into beautiful fabrics, to bring lift to the airline industry and to help guitarists make beautiful music.
• Researchers keep children healthy by using statistics to analyze data from the production of viral vaccines, which ensures consistency and safety.

Statistical analysis - Examples
• Communication companies use statistics to optimize network resources, improve service and reduce customer churn by gaining greater insight into subscriber requirements.
• Government agencies around the world rely on statistics for a clear understanding of their countries, their businesses and their people

Statistical analysis – Present & Future
• Traditional methods for statistical analysis – from sampling data to interpreting results – have been used by scientists for thousands of years.
• But today’s data volumes make statistics ever more valuable and powerful.
• Affordable storage, powerful computers and advanced algorithms have all led to an increased use of computational statistics.

Populations and Samples
• A population is a collection of values that has one value for every member in the group of interest.
• A sample is also a collection of values, but it does not represent the entire group of interest.

Random Samples
• The sample must be representative of the population. This is usually accomplished by collecting a random sample.
• A sample is a simple random sample if the process that is used to collect the sample ensures that any one sample is as likely to be selected as any other sample.

Stratified Random Sample
• Conduct a survey to find out students’ opinions of their professors.
• At first, you decide to randomly sample students on campus.
• Decide to group students according to class, and to get a random sample from each class (seniors, juniors, and freshmen).
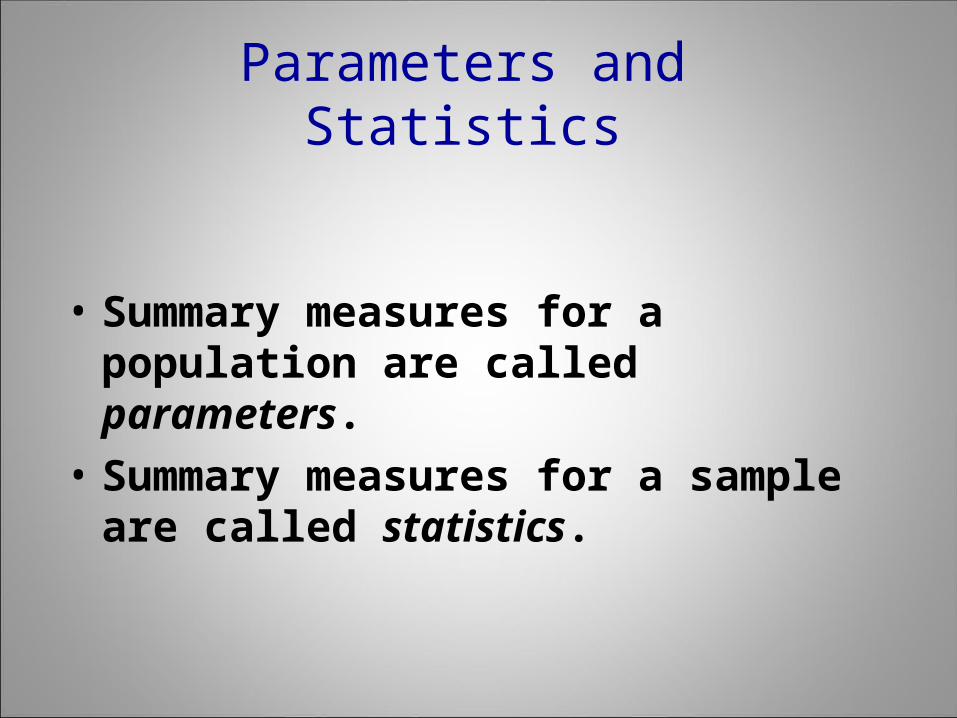
Parameters and Statistics
• Summary measures for a population are called parameters.
• Summary measures for a sample are called statistics.

Mean, Variance & Std Deviation
• The mean is a measure that describes the center of a distribution of values.
• The variance is a measure that describes the dispersion around the mean.
• The standard deviation is the square root of the variance.

Parameters Variables
• If the data set is a population of values, the average is a parameter, which is called the population mean (µ).
• The population variance is denoted with σ 2 and is called sigma-squared.
• The standard deviation is the square root of the variance and it is denoted with σ for a population.

Statistics Variables
• If the data set is a sample of values, the average is a statistic, which is called the sample average (x̄ )
• The sample variance is denoted with s 2 and is called s-squared.
• The standard deviation is the square root of the variance and it is denoted with s for a sample.

The Normal Distribution
• The normal distribution is a theoretical distribution of values for a population. The normal distribution has a precise mathematical definition.

Normal Distribution Characteristics
• The normal distribution is completely defined by its mean and standard deviation.
• The normal distribution has mean=mode=median.
• The normal distribution is symmetric.
• The normal distribution is smooth.

The Empirical Rule
• If data is from a normal distribution, the Empirical Rule gives a quick and easy way to summarize the data. The Empirical Rule says the following:
• About 68% of the values are within one standard deviation of the mean.
• About 95% of the values are within two standard deviations of the mean.
• More than 99% of the values are within three standard deviations of the mean.

An Example

Data Values
• Aerie Height in Meters
• 15.00 3.50 3.50 7.00 1.00 7.00 5.75
• 27.00 15.00 8.00 4.75 7.50 4.25 6.25
• 5.75 5.00 8.50 9.00 6.25 5.50 4.00
• 7.50 8.75 6.50 4.00 5.25 3.00 12.00
• 3.75 4.75 6.25 3.25

Dataset - Creation
data falcons;
input aerieht @@;
label aerieht='Aerie Height in Meters';
datalines;
15.00 3.50 3.50 7.00 1.00 7.00 5.75 27.00 15.00 8.00
4.75 7.50 4.25 6.25 5.75 5.00 8.50 9.00 6.25 5.50
4.00 7.50 8.75 6.50 4.00 5.25 3.00 12.00 3.75 4.75
6.25 3.25 2.50
;
run;

Dataset - Summarization
proc univariate data=falcons normal plot;
var aerieht;
histogram aerieht / normal(color=red);
probplot aerieht / normal(mu=est sigma=est color=red);
title 'Normality Test for Prairie Falcon Data';
run;

UNIVARIATE Results

Distribution and Probability Plot for aerieht
-3 -2 -1 0 1 2 3
Normal Quantiles
0
5
10
15
20
25
Aerie
Heig
ht in
Meter
s
0 5 10 15
Count
2.5
7.5
12.5
17.5
22.5
27.5
Aerie
Heig
ht in
Meter
s

2.5 7.5 12.5 17.5 22.5 27.5
Aerie Height in Meters
0
10
20
30
40
50
60
Per
cent
Normal(Mu=6.8788 Sigma=4.7918)Curve
Distribution of aerieht

Building a Hypothesis Test
• In building a hypothesis test, you work with the null hypothesis, which describes one idea about the population.
• The null hypothesis is contrasted with the alternative hypothesis, which describes a different idea about the population.

Hypothesis Test - Example
• You want to know whether the average price of hamburger is the same as last year’s average price of $3.29 per pound.
• You collect prices of hamburger from several grocery stores, and you want to use this sample to determine whether the population mean is different from $3.29.
• The null and alternative hypotheses are written as the following:Ho: μ = 3.29
Ha: μ=3.29

Paired Groups
• Are students’ grades on an achievement test higher after they complete a special course on how to take tests?
• Do employees who follow a regular exercise program for a year have lower resting pulse rates than they had when they started the program?

Independent Groups
• Do male accountants earn different salaries than female accountants?
• Do people who are given a new shampoo use a different amount of shampoo than people who are given an old shampoo?

Comparing Groups
• Deciding whether you have independent or paired groups
• Summarizing data from paired/independent groups
• Building a statistical test of hypothesis to compare the two groups
• Deciding which statistical test to use
• performing statistical tests for paired/independent groups

Comparing Multiple Groups
• compare the effects of six different fertilizers on the growth of geraniums.
• You have 30 plants, and you randomly assigned five plants to each of the six fertilizer groups.
• You carefully controlled other factors: you used the same type of soil for all 30 plants, you made sure that they all received the same number of hours of light each day, and you applied the fertilizers on the same day and in the same amounts to all 30 plants.

Comparing Multiple Groups
• At the end of this designed experiment, you measured the height of each plant.
• Now, you want to compare the six fertilizer groups in terms of plant height.

ANOVA
Analysis Of Variance• The Analysis Of Variance, popularly known as the
ANOVA, can be used in cases where there are more than two groups.
• A One-Way Analysis of Variance is a way to test the equality of three or more means at one time by using variances.
• The null hypothesis will be that all population means are equal, the alternative hypothesis is that at least one mean is different.

Correlation and Regression
• Can SAT scores be used to predict college grade point averages?
• How does the age of a house affect its selling price? Is heart rate affected by the amount of blood cholesterol?
• How much of an increase in sales results from a specific increase in advertising expenditures?
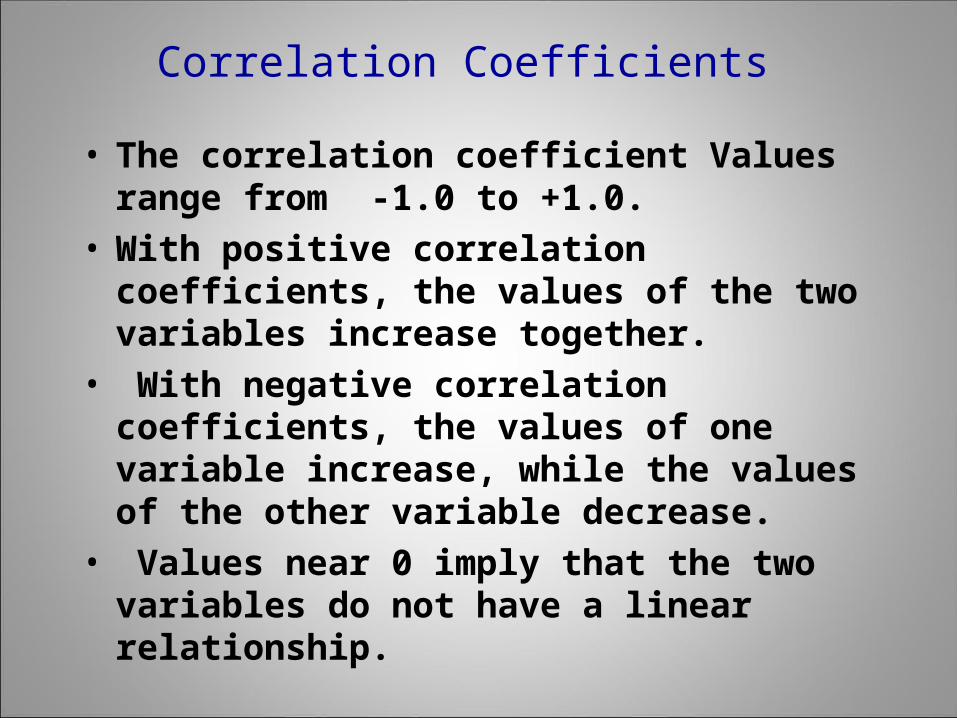
Correlation Coefficients
• The correlation coefficient Values range from -1.0 to +1.0.
• With positive correlation coefficients, the values of the two variables increase together.
• With negative correlation coefficients, the values of one variable increase, while the values of the other variable decrease.
• Values near 0 imply that the two variables do not have a linear relationship.

Regression
• A correlation coefficient indicates that a linear relationship exists.
• However, a correlation coefficient does not fully describe the relationship between the two variables.
• A regression analysis of the data answers these questions.
• In regression analysis, the problem of interest is the nature of the relationship itself between the dependent variable and the independent variable.
classification variables
• Do Democrats and Republicans have the same responses to a survey question asking about campaign reforms?
• Do rural and urban residents own different types of vehicles (sports cars, sedans, SUVs, and trucks)? Do graduate and undergraduate students differ in whether they share an apartment, have their own apartment, or live in a dorm?

Performing Tests for Independence
• When you collect classification data, you want to know whether the variables are related in some way.
• The null hypothesis is that the row and column variables are independent. The alternative hypothesis is that the row and column variables are not independent.

Thank You
Wish you all the best for further study


![· Page 4 Orientation Programme Completed OR-71 conducted by the Centre of Professional Development in Higher Education [CPDHE],University of …](https://static.fdocuments.us/doc/165x107/5fc42e139ef3dc2a2b468241/page-4-orientation-programme-completed-or-71-conducted-by-the-centre-of-professional.jpg)