A framework for organizational performance assessment in ...
99
Purdue University Purdue e-Pubs Open Access eses eses and Dissertations 4-2016 A framework for organizational performance assessment in the construction industry Zenith Rathore Purdue University Follow this and additional works at: hps://docs.lib.purdue.edu/open_access_theses Part of the Civil Engineering Commons , and the Organizational Behavior and eory Commons is document has been made available through Purdue e-Pubs, a service of the Purdue University Libraries. Please contact [email protected] for additional information. Recommended Citation Rathore, Zenith, "A framework for organizational performance assessment in the construction industry" (2016). Open Access eses. 807. hps://docs.lib.purdue.edu/open_access_theses/807
Transcript of A framework for organizational performance assessment in ...

Purdue UniversityPurdue e-Pubs
Open Access Theses Theses and Dissertations
4-2016
A framework for organizational performanceassessment in the construction industryZenith RathorePurdue University
Follow this and additional works at: https://docs.lib.purdue.edu/open_access_theses
Part of the Civil Engineering Commons, and the Organizational Behavior and Theory Commons
This document has been made available through Purdue e-Pubs, a service of the Purdue University Libraries. Please contact [email protected] foradditional information.
Recommended CitationRathore, Zenith, "A framework for organizational performance assessment in the construction industry" (2016). Open Access Theses.807.https://docs.lib.purdue.edu/open_access_theses/807


A FRAMEWORK FOR ORGANIZATIONAL
PERFORMANCE ASSESSMENT IN THE CONSTRUCTION INDUSTRY
A Thesis
Submitted to the Faculty
of
Purdue University
by
Zenith Rathore
In Partial Fulfillment of the
Requirements for the Degree
of
Master of Science
May 2016
Purdue University
West Lafayette, Indiana

ii
For my family
for their unconditional love and support
who forever inspired me to reach the zenith

iii
ACKNOWLEDGMENTS
Firstly, I would like to express my sincere gratitude to my advisor Dr. Emad
Elwakil for the continuous support of my research study, for his patience,
motivation, and immense knowledge. His guidance helped me in all the time of
research and writing of this thesis. I could not have imagined having a better
advisor and mentor for my master’s study. Besides my advisor, I would like to thank
the rest of my thesis committee: Dr. Bryan Hubbard and Dr. Mark Shaurette, for
their insightful comments and encouragement, but also for the questions which
incented me to widen my research from various perspectives. Brenda and Fran, who
always gave me their unflinching support and counsel. And lastly, my friends for all
the memorable times we shared and making Purdue a home away from home.

iv
TABLE OF CONTENTS
Page
LIST OF FIGURES . . . . . . . . . . . . . . . . . . . . . . . . . . . . . . . vi
LIST OF TABLES . . . . . . . . . . . . . . . . . . . . . . . . . . . . . . . . viii
ABSTRACT . . . . . . . . . . . . . . . . . . . . . . . . . . . . . . . . . . . ix
CHAPTER 1. INTRODUCTION . . . . . . . . . . . . . . . . . . . . . . . . 11.1 Scope . . . . . . . . . . . . . . . . . . . . . . . . . . . . . . . . . . 11.2 Significance . . . . . . . . . . . . . . . . . . . . . . . . . . . . . . . 21.3 Research Question . . . . . . . . . . . . . . . . . . . . . . . . . . . 31.4 Assumptions . . . . . . . . . . . . . . . . . . . . . . . . . . . . . . . 31.5 Limitations . . . . . . . . . . . . . . . . . . . . . . . . . . . . . . . 31.6 Delimitations . . . . . . . . . . . . . . . . . . . . . . . . . . . . . . 41.7 Definitions . . . . . . . . . . . . . . . . . . . . . . . . . . . . . . . . 51.8 Summary . . . . . . . . . . . . . . . . . . . . . . . . . . . . . . . . 5
CHAPTER 2. REVIEW OF RELEVANT LITERATURE . . . . . . . . . . 72.1 Critical Success Factors . . . . . . . . . . . . . . . . . . . . . . . . . 72.2 Existing Performance Metrics . . . . . . . . . . . . . . . . . . . . . 102.3 Modelling techniques adopted- Fuzzy Approach . . . . . . . . . . . 152.4 Challenges and Limitations of Existing Metrics . . . . . . . . . . . . 162.5 Summary . . . . . . . . . . . . . . . . . . . . . . . . . . . . . . . . 18
CHAPTER 3. FRAMEWORK AND METHODOLOGY . . . . . . . . . . . 193.1 Framework . . . . . . . . . . . . . . . . . . . . . . . . . . . . . . . . 193.2 Methodology . . . . . . . . . . . . . . . . . . . . . . . . . . . . . . 193.3 Study Variables . . . . . . . . . . . . . . . . . . . . . . . . . . . . . 223.4 Independent Variables . . . . . . . . . . . . . . . . . . . . . . . . . 223.5 Dependent Variables . . . . . . . . . . . . . . . . . . . . . . . . . . 253.6 Sample and Population . . . . . . . . . . . . . . . . . . . . . . . . . 253.7 Survey . . . . . . . . . . . . . . . . . . . . . . . . . . . . . . . . . . 253.8 Data Collection . . . . . . . . . . . . . . . . . . . . . . . . . . . . . 263.9 Data Analyis . . . . . . . . . . . . . . . . . . . . . . . . . . . . . . 413.10 Summary . . . . . . . . . . . . . . . . . . . . . . . . . . . . . . . . 42
CHAPTER 4. DATA ANALYSIS . . . . . . . . . . . . . . . . . . . . . . . . 434.1 Significance of factors . . . . . . . . . . . . . . . . . . . . . . . . . . 434.2 Analytic Hierarchy Process (AHP) . . . . . . . . . . . . . . . . . . 43

v
Page4.3 Regression Analysis . . . . . . . . . . . . . . . . . . . . . . . . . . . 504.4 Fuzzy Logic Modelling . . . . . . . . . . . . . . . . . . . . . . . . . 52
4.4.1 Hierarchical Fuzzy Expert System . . . . . . . . . . . . . . . 534.4.2 Assigning Membership Function . . . . . . . . . . . . . . . . 544.4.3 Fuzzy Inference . . . . . . . . . . . . . . . . . . . . . . . . . 604.4.4 Defuzzification . . . . . . . . . . . . . . . . . . . . . . . . . 61
4.5 System Analysis and Verification . . . . . . . . . . . . . . . . . . . 624.5.1 System Analysis . . . . . . . . . . . . . . . . . . . . . . . . . 634.5.2 Verification of the Developed Model . . . . . . . . . . . . . . 64
CHAPTER 5. CONCLUSION . . . . . . . . . . . . . . . . . . . . . . . . . . 695.1 Summary . . . . . . . . . . . . . . . . . . . . . . . . . . . . . . . . 695.2 Conclusion . . . . . . . . . . . . . . . . . . . . . . . . . . . . . . . . 695.3 Limitations . . . . . . . . . . . . . . . . . . . . . . . . . . . . . . . 705.4 Recommendation and Future works . . . . . . . . . . . . . . . . . . 72
APPENDIX A. RESEARCH SURVEY QUESTIONNAIRE . . . . . . . . . 73
APPENDIX B. INSTITUTIONAL REVIEW BOARD(IRB) PROTOCOL . 75
LIST OF REFERENCES . . . . . . . . . . . . . . . . . . . . . . . . . . . . 82

vi
LIST OF FIGURES
Figure Page
3.1 Research Framework . . . . . . . . . . . . . . . . . . . . . . . . . . . . 20
3.2 Study variables . . . . . . . . . . . . . . . . . . . . . . . . . . . . . . . 23
3.3 Non-financial critical success factors . . . . . . . . . . . . . . . . . . . 23
3.4 Financial critical success factors . . . . . . . . . . . . . . . . . . . . . 24
3.5 Data response . . . . . . . . . . . . . . . . . . . . . . . . . . . . . . . 26
3.6 Data used for study . . . . . . . . . . . . . . . . . . . . . . . . . . . . 27
3.7 Participant population characteristic . . . . . . . . . . . . . . . . . . . 28
3.8 Participant population characteristic . . . . . . . . . . . . . . . . . . . 28
3.9 Rating for implementation of Clear, Vision, Mission & Goals vs Rank oforganization . . . . . . . . . . . . . . . . . . . . . . . . . . . . . . . . 29
3.10 Rating of Competitive Strategy vs Rank of organization . . . . . . . . 29
3.11 Rating of Organizational Structure vs Rank of organization . . . . . . 30
3.12 Rating of Political Condition Policies vs Rank of organization . . . . . 31
3.13 Rating of Number of Full-time Employees vs Rank of organization . . 31
3.14 Rating for Usage of International Standards (ISO) vs Rank of organization 32
3.15 Rating for Availability of Knowledge vs Rank of organization . . . . . 33
3.16 Rating for Usage of Information Technology vs Rank of organization . 33
3.17 Rating for Business Experience vs Rank of organization . . . . . . . . 34
3.18 Business Experience (years) vs Rank of organization . . . . . . . . . . 34
3.19 Rating for Product Maintenance vs Rank of organization . . . . . . . 35
3.20 Rating for Employee Culture Environment vs Rank of organization . . 36
3.21 Rating for Employee Compensation Motivation vs Rank of organization 37
3.22 Rating for Total Quality Management(TQM) vs Rank of organization 37
3.23 Rating for Training for Employees vs Rank of organization . . . . . . . 38

vii
Figure Page
3.24 Rating for Quick Liquid Assets vs Rank of organization . . . . . . . . 38
3.25 Rating for Feedback vs Rank of organization . . . . . . . . . . . . . . 39
3.26 Rating for Research and Development vs Rank of organization . . . . 40
3.27 Rating for Market Condition and Customer Engagement practices vs Rankof organization . . . . . . . . . . . . . . . . . . . . . . . . . . . . . . . 40
3.28 Financial data for organizations . . . . . . . . . . . . . . . . . . . . . 42
4.1 Layers in Analytic Hierarchy Process . . . . . . . . . . . . . . . . . . . 44
4.2 Pairwise comparison matrix . . . . . . . . . . . . . . . . . . . . . . . . 46
4.3 Decomposed weights for sub-factors . . . . . . . . . . . . . . . . . . . 49
4.4 Regression analysis for variance for best subset. . . . . . . . . . . . . . 51
4.5 Shortlisted qualitative variables . . . . . . . . . . . . . . . . . . . . . . 52
4.6 Overall Hierarchical Fuzzy Model . . . . . . . . . . . . . . . . . . . . . 53
4.7 Second level of Hierarchical Fuzzy model developed using Fuzzy LogicToolbox . . . . . . . . . . . . . . . . . . . . . . . . . . . . . . . . . . . 58
4.8 Membership functions assigned to input variable . . . . . . . . . . . . 60
4.9 If-then rule setup . . . . . . . . . . . . . . . . . . . . . . . . . . . . . 61
4.10 Membership function assigned to Output variable . . . . . . . . . . . . 62
4.11 Fuzzy rule output . . . . . . . . . . . . . . . . . . . . . . . . . . . . . 63
4.12 Fuzzy rule output . . . . . . . . . . . . . . . . . . . . . . . . . . . . . 64
4.13 Model behavior for Financial vs Non-Financial with respect to Rank . 65
4.14 Model behavior for Financial vs Market Diversification with respect toRank . . . . . . . . . . . . . . . . . . . . . . . . . . . . . . . . . . . . 67
4.15 Model behavior for Non-Financial vs Market Diversification with respectto Rank . . . . . . . . . . . . . . . . . . . . . . . . . . . . . . . . . . . 68

viii
LIST OF TABLES
Table Page
4.1 Eigen Vector Weights (Wi)for main factors . . . . . . . . . . . . . . . . 47
4.2 Random Consistency Index . . . . . . . . . . . . . . . . . . . . . . . . 47
4.3 Factor and sub-factor weights . . . . . . . . . . . . . . . . . . . . . . . 48
4.4 Membership function range value . . . . . . . . . . . . . . . . . . . . . 55
4.5 Factor and sub-factor weights, globalized weights and normalized weights 56
4.6 If-then rules for sub-factors . . . . . . . . . . . . . . . . . . . . . . . . 57
4.7 Sub factor weights and equivalent impact . . . . . . . . . . . . . . . . . 59
4.8 Validation results . . . . . . . . . . . . . . . . . . . . . . . . . . . . . . 66
A.1 Response Table . . . . . . . . . . . . . . . . . . . . . . . . . . . . . . . 74
ix
ABSTRACT
Rathore, Zenith M.S., Purdue University, May 2016. A Framework forOrganizational Performance Assessment in the Construction Industry. MajorProfessor: Emad Elwakil.
Organizations have been trying to increase their efficiency and improve their
performance in order to achieve their goals. Organizational success is determined by
various factors. Construction industry is a project based industry which is
extremely dynamic in nature. The need to identify the weak points and search
solutions to improve performance of construction organization is extremely crucial.
Industry has always focused on measure of project success. Previous research works
have primarily focused on the measurement of financial or tangible assets.However,
previous studies lack the understanding of qualitative factors and their combine
effect on organizational performance. Therefore, the objective of the present
research is to identify and study the success factors - both financial and non-financial
factors. The potential success factors are collected from literature and construction
experts through a questionnaire that is prepared and sent to evaluate the effect of
these potential success factors on organizational performance. The collected data is
analyzed using Analytic Hierarchy Process (AHP) to shortlist the critical success
factors. Hierarchical Fuzzy Expert System is used to build a prediction model based
on these critical success factors. The developed research/model benefits both
researcher and practitioners to predict accurate company performance.

1
CHAPTER 1. INTRODUCTION
Construction is a diverse, project-based industry (Ozorhon, 2012). The
project-based nature of the construction industry makes every project unique
(Veshosky, 1998). Moreover, the market structure is extremely fragmented, making
it very competitive and difficult for any particular organization to dominate (Kim &
Reinschmidt, 2012). The unique nature of concerns and challenges often render the
generalizable decision rules and frameworks for organizational phenomena unusable
(Pinto & Covin, 1989). Financial and tangible assets gained are often translated to
organization success. In a review of project success factors conducted, it is has been
noted that project success was considered only as a subject of implementation in the
1980s (Muller, 2012).
The approach towards the subject has evolved over the years. It is now
extended from inception to closing out of a project. Today, the literature in this
field spans the entire product life cycle from product success to business success.
This change has led to a shift in emphasis from project success to organizational
success. The need to examine architectural/engineering/construction (A/E/C)
organizations and the factors that impact the performance of organizations is now
necessary to compete in an ever-changing marketplace (Liu, Wang, Skibniewski, He,
& Zhang, 2014).
1.1 Scope
Organizations have been trying to increase their efficiency and improve their
performance in order to achieve their goals. Organizational success is determined by
various factors that impact organizational performance. Uncertainty and uniqueness
of projects are inherent characteristics of this industry, making it a conglomeration
2
of unpredictable variables. Furthermore, the lack of a performance measurement for
the construction industry makes it difficult to evaluate these variables. Hence,
developing an effective construction performance assessment model has been very
difficult (Rathore & Elwakil, 2015). The objective of the present research is to
identify and study the success factors and to develop performance prediction
model(s) for construction organizations. The potential success factors are collected
from the literature and shortlisted based on construction expert opinions. A
questionnaire is prepared and sent to evaluate the impact and implementation of
these potential success factors on organizational performance. The collected data is
analyzed using a Hierarchical Fuzzy Expert System (HFES) modelling approach to
build a prediction model. The developed research/model benefits both researcher
and practitioners to predict accurate company performance.
1.2 Significance
Globalized competition and customer needs forced construction companies to
assess their performance beyond the financial measures, that is, profitability;
turnover, etc (Isik, Arditi, Dikmen, & Birgonul, 2010). Profit and success are
considered the main drivers of any organization. Achieving success depends on
many factors which have direct effect on the performance of organizations. Most of
construction organizational success factors are qualitative in nature rather than
quantitative. Thus making it important to determine these success factors, which
can then be used later to predict and improve organizational performance.
Modeling the performance of construction organizations from a financial
prospective has been extensively researched; however, modeling the performance
considering non-financial aspects has not receive sufficient attention from
researchers. The ability to predict construction organization performance will
enable practitioners to identify weak points, which will lead to search solutions to

3
improve efficiency, which will ultimately increase profits and success (Rathore &
Elwakil, 2015).
1.3 Research Question
What factors impact an organization’s performance in the construction
industry? Develop a comprehensive prediction model based on the non-financial and
financial factors that impact an organization’s performance.
1.4 Assumptions
The assumptions for this study include:
• The participants of study are experts within the construction industry. By
expert, the author assumes that participants have sufficient experience in the
construction industry.
• The responses provided by the participants have been made with sound
judgement. The ratings provided are on scale of five and they understand that
rating of one stands for minimum impact and five stands for maximum impact.
1.5 Limitations
The limitations for this study include:
• The framework for performance assessment model will be based on data
responses collected from the experts in industry. The interpretation of
questions may vary from individual to individual.
• The participants of survey that form the sample for data collection are not
from the same organization or in the same functional role. Hence, the
perspectives of individuals will vary from one functional role to another.

4
• The survey will be conducted for organizations listed in the Engineering
News-Record for the top 400 U.S. contractor and the top 500 U.S. design
firms. Hence, the impact of certain factors may be on extremes or may not
even be included in the shortlisted factors.
1.6 Delimitations
The delimitations for this study include:
• The critical success factors are shortlisted from the existing literature. Out of
the eighteen shortlisted factors, only seven parameters are used to develop the
overall performance assessment model for construction organizations. Many
sub-factors have not been included.
• Due to scarcity of time the data has not been classified as per the type of
contracts executed by construction organization i.e. Engineering Procurement
Construction (EPC), Design Build (DB), General Contractor (GC), etc. is not
considered for this study.
• Most companies listed in the ENR Top 400 Contractors and Top 500 Design
firms are not publicly listed. This constraint made it impossible to include
financial ratios in the model. However, based on the publicly available revenue
of companies, annual growth rate, three year Cumulative Annual Growth Rate
(CAGR), revenue from various segments of industry and market diversification
entropy have been included.
• The qualitative data collected is based on the opinions of expert. Quantitative
data such as the growth rate, revenue per employee, number of full time
employees and total years of business for organizations has been collected from
the publicly available data sources such as ENR reports, company websites
and PrivCo. These are included in model to evaluate the combined impact on
the output.

5
1.7 Definitions
In the broader context of thesis writing, the researcher defines the following
terms:
Organization: A social unit of people that is structured and managed to meet a
need or to pursue collective goals. All organizations have a management
structure that determines relationships between the different activities and the
members, and subdivides and assigns roles, responsibilities, and authority to
carry out different tasks.
ISO 22301:2013 defines organization as person or group of people that has its
own functions with responsibilities, authorities and relationships to achieve its
objective.
Organization goals: The overall objectives, purpose and mission of a business that
have been established by its management and communicated to its employees.
The organizational goals of a company typically focus on its long range
intentions for operating and its overall business philosophy that can provide
useful guidance for employees seeking to please their managers.
Performance: The accomplishment of a given task measured against preset known
standards of accuracy, completeness, cost, and speed. An analysis of a
company’s performance as compared to goals and objectives.
ISO 22301:2013 defines Performance as measurable result. It further states
that,” Performance can relate to the management of activities, processes,
products, (including services), systems or organizations.”
1.8 Summary
This chapter provided the scope, significance, research question,
assumptions, limitations, delimitations, definitions, and other background
information for the research project. The next chapter provides a review of the

6
literature relevant to the factors affecting organizational performance, existing
performance metrics and their limitations.
7
CHAPTER 2. REVIEW OF RELEVANT LITERATURE
This chapter provides a review of literature relevant to the the factors that
impact organizational performance. This chapter includes a background on the
existing performance metric systems.
2.1 Critical Success Factors
Determining factors for project success or failure has been of keen interest to
both academicians and industry professionals alike. Most of the factors identified
have been focused on project execution rather than the organizational success.
Cooke-Davies (2002) has mentioned in his work that although project management
literature does not illustrate much on the corporate success, both direct and indirect
link exists. Organization effectiveness depends upon successful management of its
projects (Pinto & Covin, 1989). Project success brings about a beneficial change to
the organization and vice-versa (Cooke-Davies, 2002). Similarly, any improvement
in the organizations structure will improve the chances of project success. Project
success is influenced by several critical success factors, for example, top management
support, communication, sufficient resources, etc. are derivatives of organizations.
Further to this, the study recognizes important factors that link project success and
corporate success. These factors are categorized in five areas, which are, general
corporate strategy, business operations, research and development, IT/IS
development and Facilities management. The paper stresses that every factor deals
with people, as they are the ones who execute the project. Thus, it is necessary to
include the influence of people in organizations. Pinto and Covin (1989) and Muller
(2012) have discussed that project success is dependent on the interaction of
individuals, project teams and organizational success.

8
Chinowsky and Meredith (2000) proposed the concept of seven guiding
principles of strategic management for construction industry. These include vision,
mission, goals, core competencies, and knowledge resources, education, finance,
markets and competition (Chinowsky and Meredith, 2000). Knowledge and
information are now considered as critical factors that influence a companys
lifespan. They are rated higher than land, capital or labor (Bontis & Dragonetti,
1999). A good knowledge data base will allow organizations to leverage against
their competitors in future and thus giving organizations a competitive edge
(Arthur, 1994). Unfortunately, knowledge being an intangible asset is difficult to
measure and hence often forgotten in the process (Bontis & Dragonetti, 1999).
Organizations are conceptualized as the product of though and action of
[their] members (Sims, H. P., & Gioia, 1986) or as Weick (1987) stated the body of
thought by organizational thinkers (Nicolini & Meznar, 1995). Human elements are
the assets of organizations that are capable of learning, evolving, innovating and
creatively propelling the growth of an organization, which is essential for long-run
survival of the organization. It has been noted that majority of Human Resource
Accounting (HRA) techniques have been designed for industries like accounting
firms, banks, insurance companies and financial service firms, where human
resources represent a substantial share of the organization value (Bontis &
Dragonetti, 1999). However, construction organizations lack such initiatives that
are designed to evaluate employee performance, satisfaction and compensation.
Factors such as organizations employee culture and engagement are important
aspects for an organization. Another important factor are the feedback systems, as
they are extremely crucial for implementation of metric system and evaluating
performance of organization. Feedback evaluation is one of the critical success
factors that aid in analyzing and improving organization performance (Hauser &
Katz, 1998).
Earliest seminal works in field of economics by Viner (1931) on long run
average cost cycles, that show that economies of scale help organizations to grow

9
efficiently up to a certain critical production level. Expansion of firm that results in
reduced cost is called economy of scale. There are two types of economies of scale-
internal and external. Internal economies of scale in are long term phenomena
achieved by appropriate adjustment of scale of operations to the successive output
(Viner, 1931). Technical economies allows organizations to capitalize on the
processes and assets developed. For example, a company owning its own fleet of
machinery. Pecuniary or purchasing economies allows companies to purchase raw
material in bulk and gain purchasing discounts. Companies save across all their
plants, departments, divisions, or subsidiaries by utilizing central administrative and
management cost by turning administrative department in to shared services center.
Large firms benefit from established credit lines. The risk bearing economies can be
achieved by large firms as they can afford to take higher risk and take up high risk
projects. However they can also suffer from diseconomy of scale, that is, when
production increases beyond critical level, it results in diseconomy of scale.
Firm size is one of the factors that can impact an organizations growth. If
the firm is too big the management communication can be inefficient due to poor
communication and coordination problems. This often leads to low morale in
employees. Factors such as morale of employee are intangible and hence, difficult to
account for in an organizations growth by just looking at financial statements.
Large firms also experience inefficiencies due to Principle-agent problem. Viner
(1931) also pointed out that the internal economy of scale is independent to external
economy of scale. External economy of scale refers to the positive developments or
increase in output generated by the industry as a whole. Similar to internal
pecuniary economy of scale, external pecuniary economy of scale also benefits
organizations when there is an increase in number of suppliers and they offer more
competitive prices. Challenging Viners theory of impact of firm size and economies
of scale on the organization performance, Simon and Bonini proposed a stochastic
mechanism using Gibrats law for firm growth and the skewed distribution of firm
sizes (Simon & Bonini, 1958). The results show that the distribution of percentage

10
of change in the size of firms in a given size class is the same for firms in all size
classes. Thus, the expected rate of growth is independent of current size of a firm.
2.2 Existing Performance Metrics
Benchmarking has been defined as a continuous, systematic process for
evaluating the products, services, and work processes of organizations that are
recognized as representing best practices for purpose of organization improvement
(Spendolini, 1992). A company is a complex structure, comprising of various
interconnected components that influence its performance (Tang & Ogunlana,
2003). Performance prediction of construction organizations enables identification of
the weak points in order to improvise processes and to increase profits (T. Zayed,
Elwakil, & Ammar, 2012). The attention of organizations is usually focused on
improving the efficiency of its tangible assets as they can be measured and
evaluated (Hauser & Katz, 1998). In the process, the organizations often do not
consider the invisible and intangible assets that impact the overall performance. A
good metric system empowers an organization (Hauser & Katz, 1998). In a recent
study and analysis of a case study by Gustavsson (2012), a need for new
collaborative project practice development and organizational change has been
discussed. Company performance is usually assessed by evaluation of measurable
characteristics of performance indicators (Bititci & Muir, 1997). At the same time,
it is important to understand that the productivity or output in the construction
industry is not homogeneous, that is, outputs cannot be measured in cubic meter.
Given the diverse nature of construction industry, it is impossible to aggregate all
types of outputs and measure them with one physical measurement unit. It is
important to understand the heterogeneous results and develop ways to analyze
them (Vogl & Abdel-wahab, 2015).
The existing literature shows that numerous models were developed to
measure performance by using critical success factors, performance measures, and

11
indicators. Academics have a tendency to characterize projects as similar entities;
thus these studies have been done looking at the broader picture rather than for a
particular case (Pinto & Covin, 1989). These studies mostly address metric
requirements for the manufacturing industries rather than construction. It is
important to note that the product life in the manufacturing industry goes through
a standard process. The performance is usually measured in per unit cost. The
repetitive process makes it possible to standardize the process and improve the
overall performance. The project management studies have been shifting focus to
organizational strategies and operations. World manufacturers are now competing
on key success factors other than price/cost. Unarguably, the characteristics and
properties of goals and challenges may be similar. However, too often academics
have generalized decision rules for organizational phenomena, while practitioners
have been stressing the unique nature of their concern (Pinto & Covin, 1989). The
closest initiative to measure construction performance was based on the total
quality management (Fisher, Miertschin, & Pollock Jr., 1995).
One of the earliest measurement instruments developed to measure the
project performance was proposed by Pinto and Slevin. The Project
Implementation Profile (PIP) allows assessment of an organizations ability to carry
a project through its full implementation (Pinto & Mantel, 1990). The PIP was a
support tool to enable managers to assess the status of their project by seeking
answers to questions related to 10 critical success factors identified by Pinto and
Slevin (1987). The process required participants to give responses on a 5-point
Likert scale. These responses were used to assess success or failure in terms of time
schedule, budget overrun, quality of work, client satisfaction and utility of final
project. It is important to note that the tool was developed focused more on project
success rather than organization success. It is undeniable that the factors also
concern the organization, for example, the resources and budget also fall under the
organization performance. However, the tool does not take cognizance of these

12
factors and is not effective enough to understand the overall performance of the
construction organization.
In 1992, members of Houston Business Roundtable (HBR) embarked on the
journey of establishing performance metrics. This process included sending out a
survey to member companies of HBR to determine four main preliminary tasks:
determine the interest of HBR companies in a metric system; identify activities that
should be measured; how to measure activities; collect information and analyze
information. After confirming a 90% interest and willingness from HBR member,
the HBR members decided on 10 activities that were selected for benchmarking.
The 10 factors were costs (actual vs authorized), schedule (actual vs estimated),
scope changes, reengineering work, construction labor (actual vs estimated), worker
hours per drawing, project cost distribution, field defects and percent of rejected
welds (Fisher et al., 1995).
Studies conducted in the construction industry have laid more emphasis on
the measurement of project performance rather than company performance (Isik et
al., 2010). Bontis and Dragonetti (1999) proposed the Balanced ScoreCard (BSC).
The framework placed emphasis on qualitative measures at the organizational level
and advocated the balance between measures of financial and non-financial success.
Another example of performance measurement and management framework is the
Performance Prism. The first part of this framework encourages assessing
stakeholder satisfaction and assessing the needs of the stakeholder. The second part
is to understand the needs of organization (i.e., the reciprocal relationships) as well
as on how to align strategies, processes and capabilities (Neely, Adams, & Crowe,
2001). The Prism focuses on significant measures and connects the performance
practices within the organization. These frameworks are more than a decade old.
Hence, in order to keep up with the ever changing markets, many new studies are
being carried out. Performance measurement has always been a challenge in
construction industry (Nasir et al., 2012). The construction industry has not seen
much improvement in productivity and performance measurement as in
13
manufacturing sector (Harrison, 2007). Industry groups in several different
countries have initiated benchmarking programs focused mainly on construction
performance measures (Costa, Formoso, Kagioglou, Alarcon, & Caldas, 2006).
Earliest concepts of bench marking systems in construction industry were
introduced in 1990s and were initiated by countries like the United States of
America, the United Kingdom (UK), Chile, Japan, and Brazil. In 1993, the
Construction Industry Institute introduced the first benchmarking system in the
public sector of the construction industry. This was followed by the Construction
Excellence Program launched by the Construction Best Practice Program (CBPP)
and Key Performance Indicators (KPIs) program launched by the UK Best Practice
Program in 1988 (Nasir et al., 2012). In 2008, the Construction Sector Council, a
Canada based organization, launched a program to measure and benchmark project
performance in the Canadian construction industry. The metrics developed
benchmarks to measure: project cost, time, safety and quality performance; labor
productivity; rework; project conditions and management practices related to
health. The goal of the program was to develop benchmarks to assess the labor
productivity and project performance (Nasir et al., 2012). Again, the study was
based on the project success factors.
Costa et al. (2006) has summarized various benchmarking systems employed
by construction industry from four different countries (i.e., Brazil, Chile, the UK
and the US). The benchmarking initiatives are 1. Key Performance Indicators in
the UK; 2. National Benchmarking System for Chilean Construction Industry
(NBS-Chile); 3. CII benchmarking system and metric in US; and 4. The
performance measurement in for benchmarking in Brazilian Construction Industry.
These programs have generated recommendations like: Classification of performance
measures; establishing frameworks that allow performance to performance
management; 3. developing collaborative learning processes; inventing new
measures; and developing framework for performance assessment.

14
Another framework proposed by Canadian Construction Innovation Council
(CCIC) evolved from the project success factors to a framework that encompasses
factors that impact the organization functioning. The metrics developed by the
CCIC would be relevant to the project and organization level, and also allow
indication and assessment of performance at the organization level. This framework
included factors that were categorized into seven main performance categories, that
is, costs (estimated, actual and predicted), time (estimated, actual and predicted),
quality (levels of client satisfaction), safety (incidents and lost time), innovation
(procurement, management, technology), and sustainability (design and
construction). The major drawback of this framework is that it required accurate
data for a large number of factors and the analysis followed was even more complex
(Nasir et al., 2012). Organizations that focus on satisfying the customers with
greater efficiency and effectiveness have an edge over their competitors (Neely,
Gregory, & Platts, 1995). Studies have shown that practitioners have been able to
determine that improving communication has a major impact on construction
practice. It allows better customer engagement, leading to better performance of
organizations. Neely et al. (1995) stresses the importance of metrics associated with
quality, time, cost and flexibility, thus relating performance of organizations with
project success.
Attempts have also been made to understand the relationship between the
internal and external factors affecting organizational performance. Empirical studies
carried on the construction market structure show that the construction industry
being highly fragmented makes it very competitive (Kim & Reinschmidt, 2012).
Studies have been carried out to identify relationship between market fragmentation
and organizational diversification (Kim & Reinschmidt, 2012). By analyzing return
on mean equity, Pandya and Rao (1998) concluded that specialized or less
diversified firms face more volatility in profitability than more diversified firms. Choi
and Russell (2005) used 12 years data of publicly traded companies to identify any

15
relation between diversification and profitability. However, no significant difference
in profitability were found in companies categorized by different diversification level.
In a previous study by (T. Zayed et al., 2012), nine critical success factors
(CSFs) were defined as the most significant to develop a prediction model for
organizational performance. The Artificial Neural Network (ANN) model was used
to assess the most significant success factors, as ANN provides the contributing
weight of each factor after the completion of the training process. Another study
developed a fuzzy logic model with the same data aiming to develop the best fit
model for the performance prediction (Rathore & Elwakil, 2015).
2.3 Modelling techniques adopted- Fuzzy Approach
Lotfi Zadeh introduced fuzzy logic as a powerful modeling technique that is
can be used to understating the uncertainty and qualitative aspects of human
nature (Zadeh, 1965). Fuzzy techniques have been widely utilized in several studies
over the past decade. It has the ability to virtually connect humans to computers
through analyzing linguistic inputs to stem numerical outputs (Chan, Chan, &
Yeung, 2009). Traditionally, a set of inputs has sharp and crisp boundaries, where
elements are either in or out of a set, and ranking of a membership of a variable is
zero or one (Nguyen, 1985). However, in the real world, information is mainly
ambiguous and incomplete. That is when fuzzy logic is applicable as elements are
allowed to have partial memberships ranging from zero to one (i.e., zero is no
membership and one is full membership) (Fayek & Oduba, 2005).
T. Zayed et al. (2012), has previously developed prediction models for
performance of construction organizations using the Artificial Neural Network
model and regression. A total of 18 factors were identified from the literature
review. Based on the responses received from industry experts (5-point Likert scale
was used), these factors were evaluated and allotted ranks using ANN training (i.e.
ranking the factors to determine the relative importance of each variable and the

16
highest impact on the model). Analysis of weights of the trained neural network are
used to derive the contribution percentages. The higher the value implies that the
variable contribution to classification/prediction is also high. Based on the ANN
rankings, nine factors with highest contribution factor were shortlisted from the
pool of 18 factors Neuroshell software package was used to develop and train the
ANN model. Similarly, MINITAB software is used to build a regression model for
construction organizations performance using the selected CSFs.
One of the many advantages of theoretic properties of ANN is the ability to
distinguish unspecified relations such as nonlinear effects and/or interactions.
However, this advantage comes at the cost of minimized interpret-ability of the
model output. The black box quality of an ANN model makes it next to impossible
to gain insight into a problem based on an ANN model. Regression technique allows
the user to sequentially remove possible explanatory variables that do not
contribute to the fit of the model (Sargent, 2001). Regression techniques permit
hypothesis testing concerning both the uni-variate and multivariate association
amongst each explanatory variable and the outcome of interest. However, it fails to
recognize or identify the highly nonlinear factors, or correlation among variables
Sargent (2001). Human reasoning being more approximate than precise in nature
often makes it difficult to measure and determine the measure of factors affecting a
particular cause.
2.4 Challenges and Limitations of Existing Metrics
The process to develop a successful performance prediction model is a very
long and tedious task. It takes analysis of a large number of factors from a broad
strata of projects. The data requirements are immense. Also, the project values,
life-cycle, location, etc. are the variables that need to be accounted for. The time
taken to develop the program, identify potential participants, introduce the concept,
obtain feedback, revise parameters, re-evaluate can be extremely long. Further to

17
that, it is a challenge to convince firms to provide data for the on-going projects and
data on any changes that may be observed after the suggested actions. Once a
benchmark has been developed, it becomes a significant strategic asset. CII took
almost eight years to derive a functional benchmarking model with considerable
number of projects to make meaningful assessments at project level (Nasir et al.,
2012). Despite the awareness and importance performance measurement data,
companies or knowledge bodies have not been able to establish data banks (Costa et
al., 2006). Existing empirical studies only focus on few factors and attempt to
establish a relationship. These factors can be internal, that is, with in organization
and external related to market conditions. Previous studies have focused on
individual or combination of few factors. Due to the limited scope the whole system
has not been evaluated. Thus making it necessary to understand and identify the
underlying relationship between the factors amongst categories and the across
different categories that impact an organizations performance.
The data from companies vary as the companies that execute small projects
only form a fraction of the total industrys turnover. Only large organizations are
able to afford executing projects with a very small profit margin, as they have in
house capabilities, established processes, established lines of credit and qualify for
large projects. However, it is important to note that small organizations barely
manage to stay afloat. It will thus be necessary to account for the organization size
while developing a prediction model. Alternatively, different prediction models need
to be developed depending on the organization size, specialty contractors, types of
contracts undertaken, for example, Engineering Procurement and Construction
(EPC), Construction Management at Risk (CMR), Architectural and Design firms,
General Contractor, etc.

18
2.5 Summary
This chapter provided a review of the literature relevant to the critical
success factors that impact organizational performance, existing metric systems and
the challenges that are associated with the existing metrics. The next chapter
provides the framework and methodology to be used in the research project.

19
CHAPTER 3. FRAMEWORK AND METHODOLOGY
This chapter outlines the intent of research, methodology and specifics
related to data collection. The author will first discuss the purpose of research and
then explain the methodology in detail along with reasons for the chosen
methodology and conclude with review and summation.
3.1 Framework
The existing literature shows that numerous models were developed to
measure performance by using critical success factors, performance measures, and
indicators. However, they mostly address metric requirements for the manufacturing
industries rather than construction. Studies conducted in the construction industry
have placed more emphasis on the measurement of project performance rather than
company performance (Isik et al., 2010). The attention of organizations is usually
focused on improving the efficiency of its tangible assets as they can be measured
and evaluated (Hauser & Katz, 1998). In the process, the organizations often do
not consider the invisible and intangible assets that impact the overall performance.
A good metric system empowers the organization (Hauser & Katz, 1998).
3.2 Methodology
The methodology for this research are summarized step-wise as below:
• A literature review is conducted to identify the factors that impact
performance of the construction organizations. Factors shortlisted from the
literature review will be analyzed for their impact on performance of the

20
Figure 3.1.: Research Framework

21
construction organization. These factors are also referred to as Critical
Success Factors (CSFs).
• Based on the literature review conducted, factors that have an impact on
organizational performance have been shortlisted. The proposed performance
assessment model will include both qualitative and quantitative factors. The
model is developed in order to determine the overall performance in terms of
category of rank. Due to the nature of research question, the researcher has
adopted a mixed method- qualitative and quantitative approach. The
framework of this research is presented Figure 3.1.
• A questionnaire is designed to evaluate the impact and implementation of the
shortlisted non-financial CSFs in their respective organizations. The
questionnaire also asks about the participant’s total number of experience, the
designation held in the current organization and name of the organization,
refer Appendix A. The questionnaire is distributed to professionals across the
construction industry via in-person interaction, emails and an on-line qualtrics
survey.
• Simultaneously, a database for quantitative factors is compiled for all
organizations, whose employees participated in the survey. From this data,
factors representing financial trend analysis and market diversification of
organization are calculated.
• Analytic Hierarchical Process (AHP) is used to shortlist 18 qualitative factors.
The results of this process will be validated from the Best Subset Regression
function. The subset with highest Rsq and adjusted Rsq will be used for
modelling purpose.
• A performance assessment model for the construction organization is
developed using a Hierarchical Fuzzy Expert System. As the number of

22
factors are large and their values are on different scales. It is recommended to
use the Hierarchical Fuzzy Expert System (HFES).
• The first layer of HFES is developed by building two sub-models of fuzzy
expert system for non-financial (qualitative) factors and financial
(quantitative) factors. The input variables are the respective sub-factors and
the output is the impact value of the combined effect of sub-factors.
• The output from first layer is used as input for the second layer of fuzzy
expert system. The input variables are assigned fuzzy membership and fuzzy
relations are established. The defuzzification gives the category of rank of the
organization.
• The model will be tested and mathematically validated by Average Validity
Percentage (AVP) and Average Invalidity Percentage (AIP) in order to
determine the accuracy in assessing the performance of construction
organization.
3.3 Study Variables
The study aims at evaluating organizational performance based on both
financial and non-financial parameters. Hence, the study variables are categorized in
three broad categories, that is, Non-financial parameters, Financial parameters and
Market Condition as presented in Figure 3.2
3.4 Independent Variables
This study aims at assessing the qualitative factors with quantitative factors.
Independent variables are the input variables that determine the value of output or
dependent variable. Based on the literature review, 18 qualitative factors have been
shortlisted for non-financial critical success factors, as shown in Figure 3.3. These

23
Figure 3.2.: Study variables
Figure 3.3.: Non-financial critical success factors

24
factors have previously been investigated in study conducted by Elwakil et al.
(2009) and Rathore and Elwakil (2015). The qualitative variables are categorized in
four categories, i.e., Administrative and Legal; Technical; Management and Market
and Finance as presented in Figure 3.3.
Figure 3.4.: Financial critical success factors
A total of 18 quantitative factors have been identified for the study. It
includes financial factors representing organization growth and market
diversification. Based on the publicly available financial information factors
pertaining to revenue and annual growth are included in the model. A longitudinal
database of revenue for organizations for past 5 years was compiled. The factors
include annual growth rate in revenue, three year cumulative, percent of different
market segment revenue, productivity (revenue/employee), total number of years in
business and firm size (number of employees) as presented in Figure 3.4. Figure 3.4
shows the financial factors compiled from the publicly available data. Additionally,
the Market Diversification of an organization is measured by Entropy, which is
computed as shown in Equation 3.1.
25
Entropy =N∑i=1
ln1
pi(3.1)
Where, pi= Revenue share of the ith segment in firm total revenue
N= Number of Market segments
3.5 Dependent Variables
The dependent variable is the rank of the organization published by ENR
Top 400 Contractors and ENR Top 500 Design Firm Sourcebook 2015 published.
The rank is inversely proportional to the revenue of the organization in the year
2015. Higher the revenue earned, smaller is the rank. To maintain confidentiality of
the organizations the rank has been categorized into categories, i.e. 1-100, 101-200,
201-300, 301-400, 401-500 and 501 and above. This variable is also the output in
model.
3.6 Sample and Population
The study focuses on the organizational performance of construction
companies. The proposed model includes the financial factors, hence, the
population for this study will be the construction companies listed in ENR Top 400
Contractor and Top 500 Design Firm Sourcebook 2015. Participants from the
mentioned companies were recruited through interaction at Purdue University’s
Building Construction Management Career fair in Spring 2016.
3.7 Survey
The questionnaire had two parts where Part I asked the experts from
construction organizations to answer the questions pertaining to their total
experience in construction industry, the designation they hold in current
organization and the name of the current organization they work for. Part II asked

26
the experts to use a specified five-point Likert scale to rate the impact and
implementation of identified success factors on organization performance. The scale
was specified from 1 being Very Low to 5 being Very High.
3.8 Data Collection
The data collection procedure included a literature review and identification
of potential critical success factors. Eighteen non-financial factors were shortlisted.
This was followed by preparation of questionnaire designed to assess the impact and
implementation of these factors in construction industry.
Figure 3.5.: Data response
A total of 300 questionnaires were sent out to organizations. Out of which
130 responses were received, that is a response rate of 43.3%. Approximately 40
responses were incomplete or had missing information about the company they
worked for, which made it impossible to link the financial information. Hence, these
responses had to be excluded and only 90 responses were used for this study as
presented in Figure 3.5 and Figure 3.6. Out the 90 responses, 72 responses were
used for training and modelling purposes and 18 responses were kept aside for
validation purpose.
Following results were obtained from the responses to survey questionnaire:

27
Figure 3.6.: Data used for study
• Survey population characteristics: Based on the responses, it can be seen that
the number of the responses received from participants belong to organizations
ranked in five rank categories, that is, 1-100 (42 responses), 101-200 (19
responses), 201-300 (8 responses), 301-400 (2 responses) and 401-501 (19
responses), refer figure 3.7. It can be seen in figure 3.8, the responses received
have a big cluster of companies in the rank category from 1-200. There are
few responses from companies that are ranked in the range between 250-500.
The next cluster is the companies that are ranked more than 500.
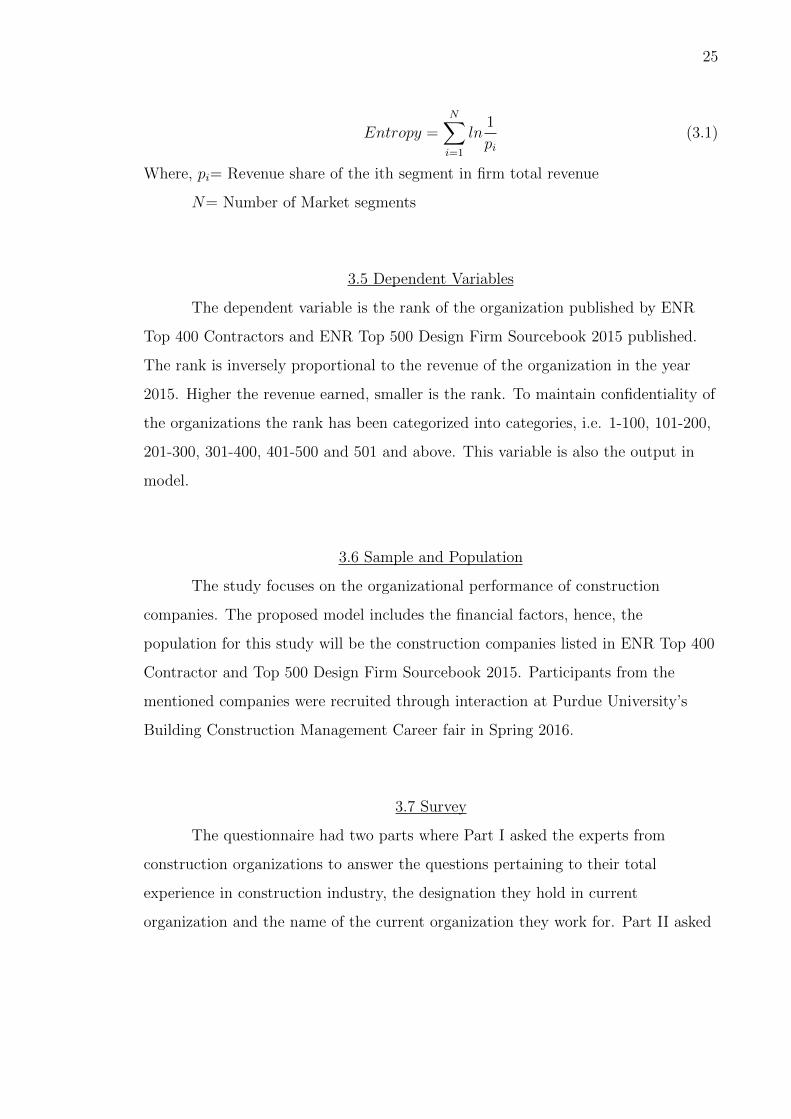
• Clear Vision, Mission and Goals: Based on the response from participants, it
can be seen that the highest rating is given by participants from companies
ranked between the range 1 to 100. Most participants have rated the
implementation of clear vision, mission and goals in their respective
organizations as high, as seen in Figure 3.9. The mean rating is 4.077 and the
standard deviation is 0.9625.
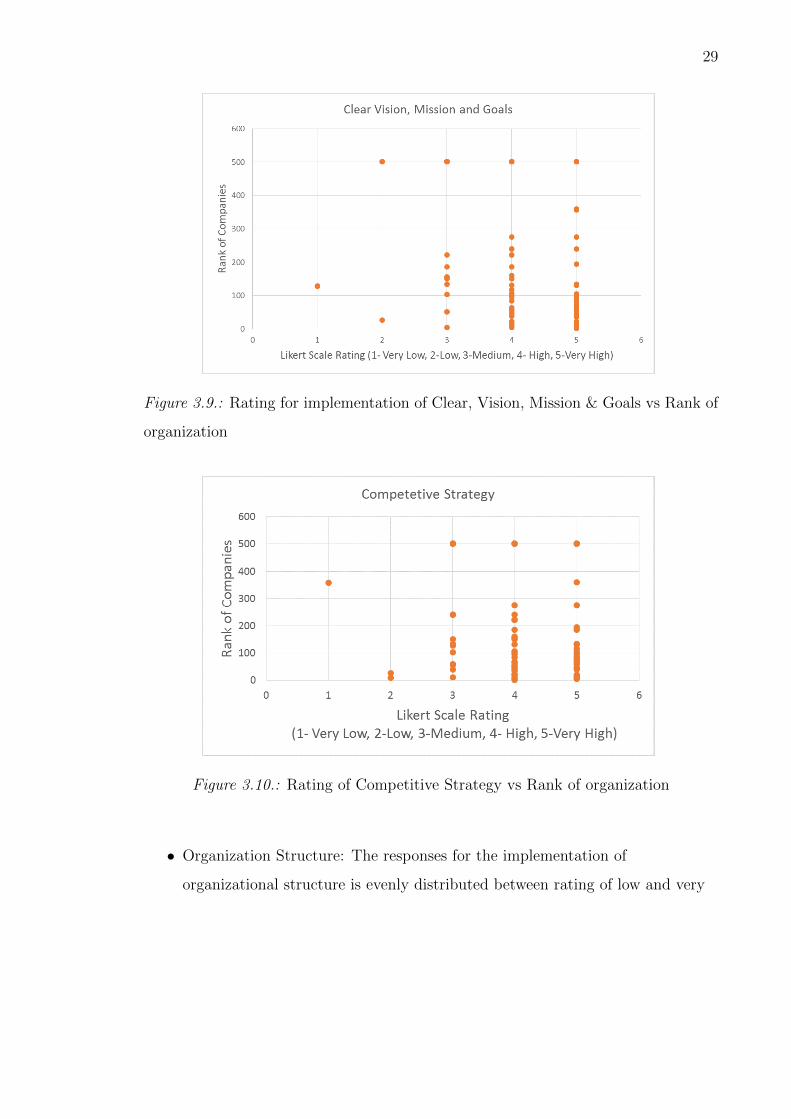
• Competitive Strategy: It is observed from the responses that irrespective of
the rank of organization, most participants have intended to rate the
competitive strategies employed in their organizations as high, as seen in
Figure 3.10. The mean rating is 4.043 and the standard deviation is 0.850.

28
Figure 3.7.: Participant population characteristic
Figure 3.8.: Participant population characteristic
29
Figure 3.9.: Rating for implementation of Clear, Vision, Mission & Goals vs Rank of
organization
Figure 3.10.: Rating of Competitive Strategy vs Rank of organization
• Organization Structure: The responses for the implementation of
organizational structure is evenly distributed between rating of low and very
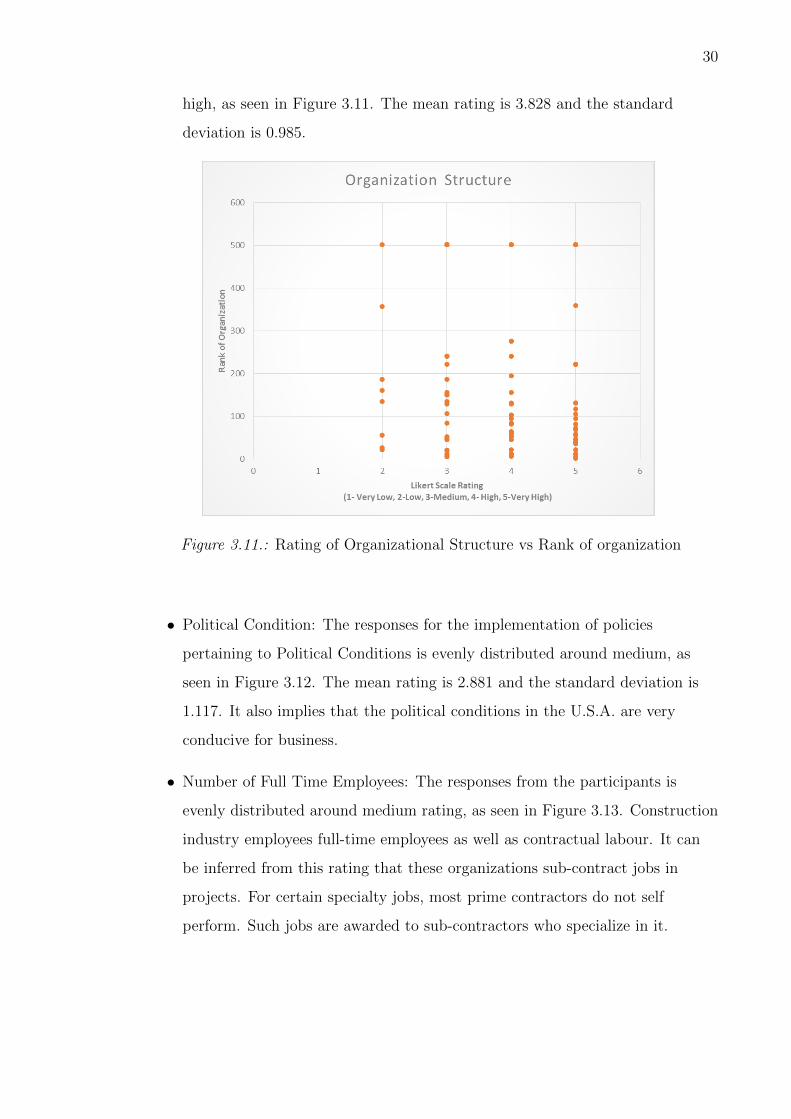
30
high, as seen in Figure 3.11. The mean rating is 3.828 and the standard
deviation is 0.985.
Figure 3.11.: Rating of Organizational Structure vs Rank of organization
• Political Condition: The responses for the implementation of policies
pertaining to Political Conditions is evenly distributed around medium, as
seen in Figure 3.12. The mean rating is 2.881 and the standard deviation is
1.117. It also implies that the political conditions in the U.S.A. are very
conducive for business.
• Number of Full Time Employees: The responses from the participants is
evenly distributed around medium rating, as seen in Figure 3.13. Construction
industry employees full-time employees as well as contractual labour. It can
be inferred from this rating that these organizations sub-contract jobs in
projects. For certain specialty jobs, most prime contractors do not self
perform. Such jobs are awarded to sub-contractors who specialize in it.

31
Figure 3.12.: Rating of Political Condition Policies vs Rank of organization
Figure 3.13.: Rating of Number of Full-time Employees vs Rank of organization

32
Additionally, it helps to control the overhead costs with-in the organizations.
The mean rating is 3.659 and the standard deviation is 1.108.
Figure 3.14.: Rating for Usage of International Standards (ISO) vs Rank of
organization
• Usage of International Standards (ISO): The responses for implementation of
the International Standards in the organizations is mainly spread between low
and medium, as seen in Figure 3.14. One of the reasons for such rating is that
most organizations work on projects within the U.S.A. and mostly follow
American Standards Codes. The mean rating is 2.389 and the standard
deviation is 1.313.
• Availability of Knowledge: The responses from participants imply that the
experience of professionals, establishing database and learning from previous
projects in the organizations is ranked high, as seen in Figure 3.15. The mean
rating is 3.967 and the standard deviation is 0.857.

33
Figure 3.15.: Rating for Availability of Knowledge vs Rank of organization
Figure 3.16.: Rating for Usage of Information Technology vs Rank of organization
• Usage if Information Technology(IT): The responses for usage of technology is
rated between medium and high,as seen in Figure 3.16. It is also observed that
companies ranked between have given rating primarily in high and very high.

34
Thus, it can be implied that organization with high ranks depend on usage of
IT very much. The mean rating is 3.674 and the standard deviation is 0.9037.
Figure 3.17.: Rating for Business Experience vs Rank of organization
Figure 3.18.: Business Experience (years) vs Rank of organization

35
• Business Experience: The responses show that participants from companies
ranked between rank 1 to 100 have rated business experience of their
organization as high and very high. It also means that organizations with high
ranks have been in construction organization for a longer number of years.
The mean rating is 3.988 and the standard deviation is 0.9062. Further, to
compare this response to quantitative value of number of years of business
experience, data pertaining to actual number of years of business was collected
which is shown in Fig 3.18. It can be seen that most responses have been
rated higher. To reduce the bias, the quantitative data was normalized and
then converted to 5 point rating for model development.
Figure 3.19.: Rating for Product Maintenance vs Rank of organization
• Product Maintenance: The responses for product maintenance, that is services
after project completion, has distributed over ratings, as seen in Figure 3.19.
Most organizations complete the project and handover the spaces. It is
difficult to establish, if there is any co-relation between project maintenance
services and organizational rank. The mean rating is 3.340 and the standard
deviation is 1.133.

36
Figure 3.20.: Rating for Employee Culture Environment vs Rank of organization
• Employee Culture Environment: The responses for employee culture
environment varies from medium to very high, as shown in Figure 3.20. It can
be implied that the most participants have rated the employee culture as high.
One of the reasons for such a response could be their presence as company
representatives and recruiters at Purdue Building Construction Management
Career Fair. The mean rating is 4.175 and the standard deviation is 0.889.
• Employee Compensation and Motivation: The responses for employee culture
environment varies from medium to very high, as shown in Figure 3.20. An
interesting observation is that the number of participants who rated employee
culture as very high are more than those who rated employee compensation. It
can be implied that participants prefer a good employee culture environment
in organization. However, they are not very happy with the compensation
they receive. The mean rating is 3.835 and the standard deviation is 0.859.
• Applying Total Quality Management (TQM): The responses for application of
total quality management practices varies from medium to high, as shown in

37
Figure 3.21.: Rating for Employee Compensation Motivation vs Rank of organization
Figure 3.22.: Rating for Total Quality Management(TQM) vs Rank of organization
Figure 3.22. It was observed that most organizations place high emphasis on
quality. However, there are some organizations that lack a total quality
management system. The mean rating is 3.342 and the standard deviation is
1.064.

38
Figure 3.23.: Rating for Training for Employees vs Rank of organization
• Training for Employees: The responses for employee training varies from
medium to high, as shown in Figure 3.22. Most organizations place high
importance on on-job training for their employees. The mean rating is 3.922
and the standard deviation is 0.902.
Figure 3.24.: Rating for Quick Liquid Assets vs Rank of organization
39
• Quick Liquid Assets: Construction industry is a very asset intensive industry.
The responses for employee training varies from medium to high, as shown in
Figure 3.24. It may also be noted that companies ranked between 1 to 100,
have high asset liquidity. It can be implied that these organizations’ cash flow
cycle is well managed. The mean rating is 3.488 and the standard deviation is
1.195.
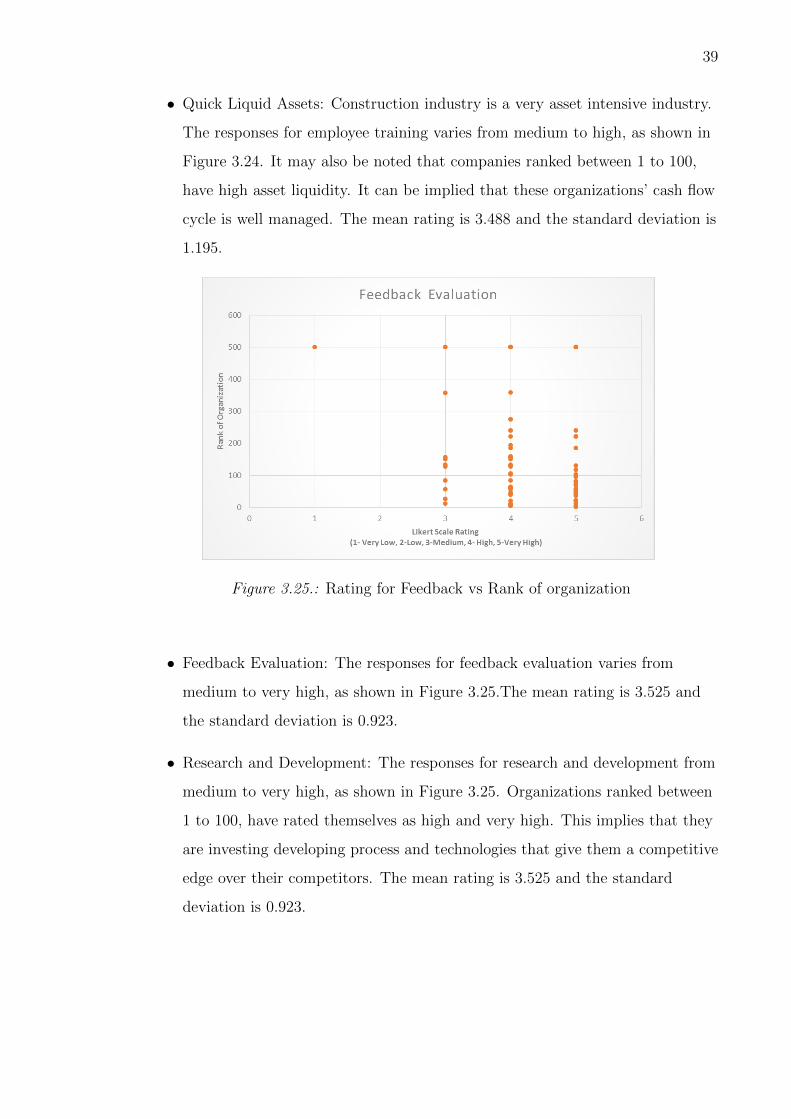
Figure 3.25.: Rating for Feedback vs Rank of organization
• Feedback Evaluation: The responses for feedback evaluation varies from
medium to very high, as shown in Figure 3.25.The mean rating is 3.525 and
the standard deviation is 0.923.
• Research and Development: The responses for research and development from
medium to very high, as shown in Figure 3.25. Organizations ranked between
1 to 100, have rated themselves as high and very high. This implies that they
are investing developing process and technologies that give them a competitive
edge over their competitors. The mean rating is 3.525 and the standard
deviation is 0.923.

40
Figure 3.26.: Rating for Research and Development vs Rank of organization
Figure 3.27.: Rating for Market Condition and Customer Engagement practices vs
Rank of organization
• Market Condition/Customer Engagement: Understanding market conditions
and being able to develop lasting relationships with customers is one of the
most important ways of gaining business in construction industry. Since, most

41
products can only be seen after the construction process and the samples are
usually the previous projects, previous projects and relationships with clients
provide companies with word of mouth recommendation. This is one of the
most important form of marketing strategy in construction industry. The
responses for this factor varies from medium to very high, as shown in Figure
3.27. Organizations ranked between 1 to 100, have rated themselves as high
and very high. This implies that they are investing in developing process and
technologies that give them a competitive edge over their competitors. The
mean rating is 4.219 and the standard deviation is 0.7424.
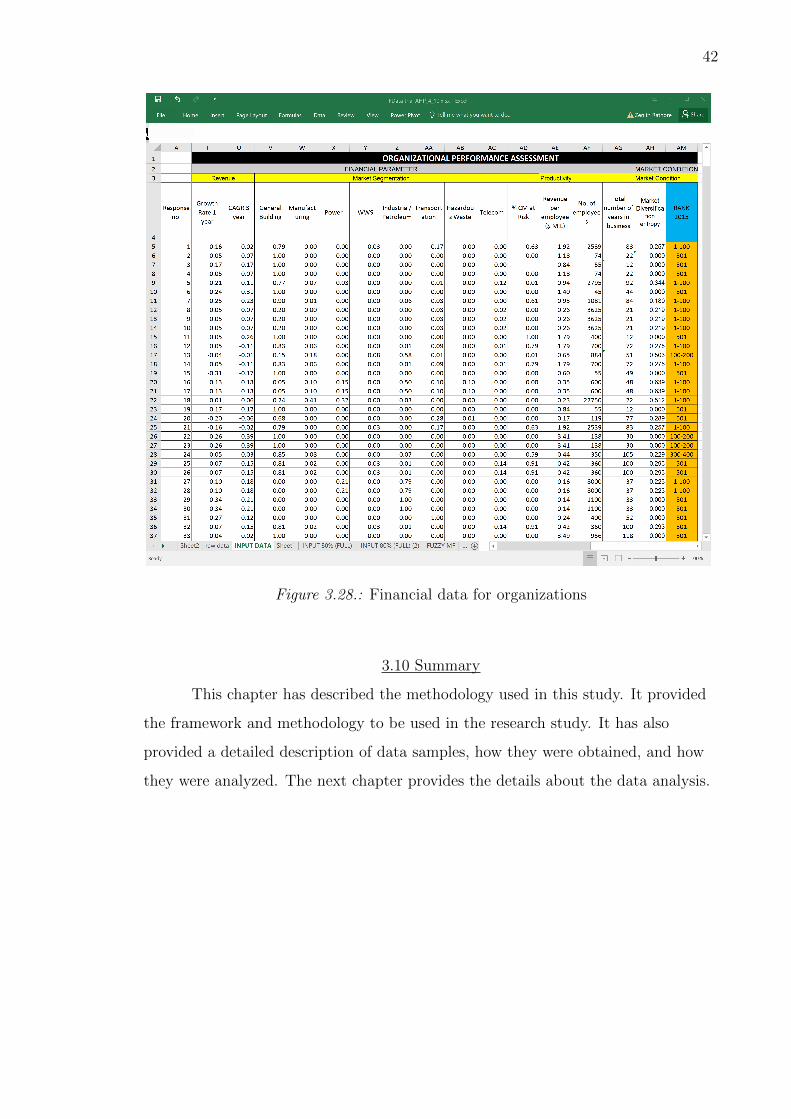
Additionally, the financial information pertaining to the organizations was
retrieved from ENR Top 400 Contractor and Top 500 Design firms Sourcebook
publications. A longitudinal database was developed for revenue of different firms
for past five years. The revenue earned in previous financial years was used to
calculate annual growth rate, three year cumulative annual growth rate. The market
diversification entropy was calculated from revenue percentage from different market
segments for those organizations as shown in Figure 3.28.
3.9 Data Analyis
The total number of variables including qualitative and quantitative add up
to 32 variables. Since the number of variables is very high, it is imperative to rank
and determine the significant factors. To rank the factors Regression Best Subset
Analysis was carried out using Minitab 17 and Analytic Hierarchy Process (AHP).
Followed by Hierarchical Fuzzy Expert System modelling using Fuzzy Logic Toolbox
Matlab 2015. The model will be tested and validated mathematically by Average
Validity Percentage (AVP) and Average Invalidity Percentage (AIP).
42
Figure 3.28.: Financial data for organizations
3.10 Summary
This chapter has described the methodology used in this study. It provided
the framework and methodology to be used in the research study. It has also
provided a detailed description of data samples, how they were obtained, and how
they were analyzed. The next chapter provides the details about the data analysis.

43
CHAPTER 4. DATA ANALYSIS
This chapter goes in depth to explain methods and steps involved in
shortlisting variables. The author will first discuss the purpose of variable ranking
and then explain the methodology in detail along with reasons for the chosen
methodology and conclude with review and summation.
4.1 Significance of factors
The total number of independent variables, both qualitative and
quantitative, add up to total of 32 variables. The number of variables is very large
and hence to perform further analysis, we need to shortlist the factors that really
contribute to the performance of an organization. For initial analysis of data to
check for co-relation between variables, regression analysis using Minitab 17 was
carried out. The results from Regression analysis were Rsq equal to 99.1% and Rsq
(adj) equal to 97.7%. Such results do not indicate high co-relation between factors,
instead the number of variables are very large and no co-relation could be identified.
Hence, making it all the more necessary to reduce the factors. Different methods
exist to shortlist the factors. Since, we are dealing with 18 number of qualitative
factors, the Analytic Hierarchy Process will be a suitable method to determine the
significance of factors by comparison with other factors within a category.
4.2 Analytic Hierarchy Process (AHP)
The Analytic Hierarchy Process (AHP), developed by Thomas Saaty in 1977,
is a multi-criteria decision making process of qualitative factors when arranged in a
hierarchical process (Saaty, 1990). The process allows to solve complex decision, by

44
aiding users in organizing information pertaining to thoughts, knowledge and
judgement into a hierarchical framework and quantify the effect of qualitative
factors by a sequence of pair-wise comparison judgements (Saaty, 1990). In this
study, AHP has been used to evaluate the significance of impact of qualitative
factors on overall organizational performance. The basic procedure to carry out
AHP consists of following steps:
Figure 4.1.: Layers in Analytic Hierarchy Process
1. First, the hierarchy of factors is established and selection of criteria. The top
most level focuses on the goal of the problem in our case it the Organizational
Performance. The intermediate levels contain the qualitative or non-financial
parameters, that are categorized into four main categories in (i.e.
Administrative and Legal, Technical, Management and Market and Finance).
The next level or sub-level includes 18 sub-factors (i.e. Clear Vision, Mission
and Goals, Competitive Strategy, Organizational Structure, Political
Conditions, Number of Full Time Employees, Usage of International Aspects
(ISO), Availability of knowledge Usage of IT, Business Experience, Product
Maintenance, Employee Culture Environment, Employee Compensation and

45
Motivation, Applying Total Quality Management, Training, Quick Liquid
Assets, Feedback Evaluation, Research and Development and Market
Conditions/Customer Engagement. The layout of hierarchy helps decision
makers to assess the relationship between factors and the assessment whether
the factors are of same magnitude (Fares & Zayed, 2010). Please refer Figure
4.1.
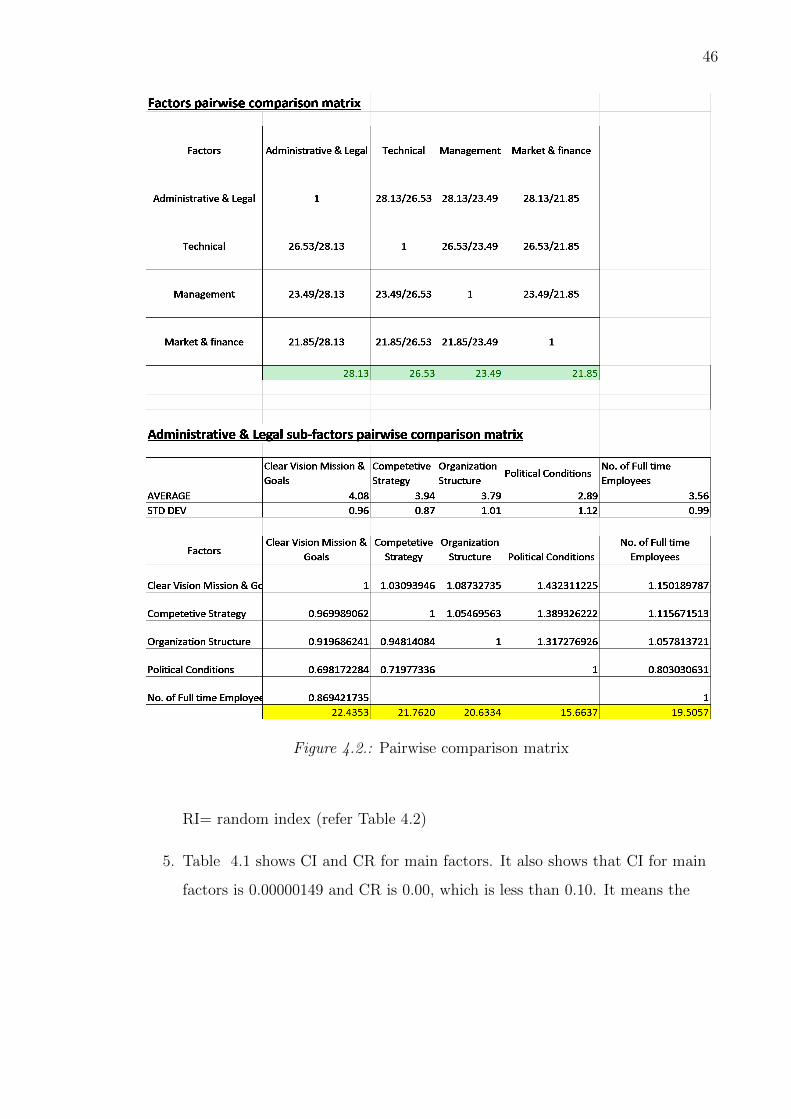
2. Second step involves priority setting of criteria by pair-wise comparison
matrices for main factors. Based on the impact rating of the 18 factors, a
matrix is assigned with overall rating for four main factors, i.e. Administrative
and Legal, Technical, Management and Market and Finance and their sub
factors. Figure 4.2 shows the analysis of pair-wise comparison matrices for
average values of main factors and their sub-factors.
3. Third step is assigning priorities and establish pair-wise comparison for
sub-factors within each main category. This step involves average values of
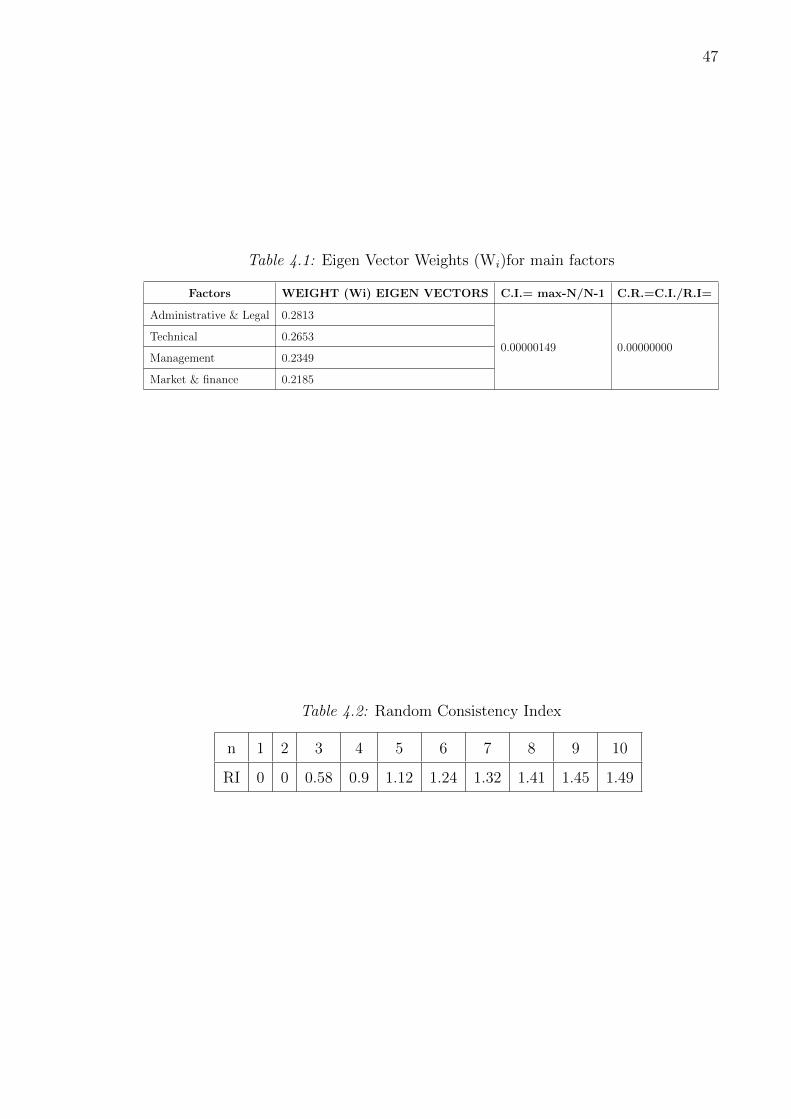
sub-factor with in one main factor. The AHP methodology applied to these
matrices gives the weight factor of each factor (Wi). Table 4.1 shows the
weights of factors.
4. Fourth step is Consistency Analysis. This step verifies the consistency of
pair-wise comparison matrix. Weights can be accepted only if the matrix is
consistent. Therefore, consistency index (CI) and consistency ratio (CR) will
be calculated as follows (Fares & Zayed, 2010):
CI =λmax −mm− 1
CR =CI
RI
Where, CI= the matrix consistency index.
m= matrix size
λmax =the maximum eigen value.
46
Figure 4.2.: Pairwise comparison matrix
RI= random index (refer Table 4.2)
5. Table 4.1 shows CI and CR for main factors. It also shows that CI for main
factors is 0.00000149 and CR is 0.00, which is less than 0.10. It means the
47
Table 4.1: Eigen Vector Weights (Wi)for main factors
Factors WEIGHT (Wi) EIGEN VECTORS C.I.= max-N/N-1 C.R.=C.I./R.I=
Administrative & Legal 0.2813
0.00000149 0.00000000Technical 0.2653
Management 0.2349
Market & finance 0.2185
Table 4.2: Random Consistency Index
n 1 2 3 4 5 6 7 8 9 10
RI 0 0 0.58 0.9 1.12 1.24 1.32 1.41 1.45 1.49
48
Tab
le4.
3:F
acto
ran
dsu
b-f
acto
rw
eigh
ts
Fact
ors
Ave.
Weig
ht-
Main
Fact
ors
Ave.
Sub
-fact
ors
Weig
ht
Ave.
Deco
mp
ose
dW
eig
ht
Ad
min
istr
ati
ve
&L
egal
0.2
813
Cle
arV
isio
nM
issi
on&
Goa
ls0.
2244
0.06
31
Com
pet
itiv
eS
trat
egy
0.21
760.
0612
Org
aniz
atio
nS
tru
ctu
re0.
2063
0.05
80
Pol
itic
alC
ond
itio
ns
0.15
660.
0441
No.
ofF
ull
tim
eE
mplo
yees
0.19
510.
0549
Tech
nic
al
0.2
653
Usa
geif
Inte
rnat
ion
alS
tan
dar
ds
(IS
O)
0.13
360.
0355
Ava
ilab
ilit
yof
Kn
owle
dge
0.22
840.
0606
Usa
geof
IT0.
2159
0.05
73
Bu
sin
ess
Exp
erie
nce
(n
o.of
year
s)0.
2338
0.06
20
Pro
du
ctM
ainte
nan
ce0.
1883
0.04
99
Man
agem
ent
0.2
349
Em
plo
yee
Cu
ltu
reE
nvir
onm
ent
0.26
960.
0633
Em
plo
yee
Com
pen
sati
onan
dM
otiv
atio
n0.
2495
0.05
86
Ap
ply
ing
Tot
alQ
ual
ity
Man
agem
ent
(TQ
M)
0.22
070.
0518
Tra
inin
gfo
rem
plo
yees
0.26
010.
0611
Mark
et
&fi
nan
ce0.2
185
Em
plo
yee
Cu
ltu
reE
nvir
onm
ent
0.23
610.
0516
Em
plo
yee
Com
pen
sati
onan
dM
otiv
atio
n0.
2462
0.05
38
Ap
ply
ing
Tot
alQ
ual
ity
Man
agem
ent
(TQ
M)
0.21
400.
0468
Tra
inin
gfo
rem
plo
yees
0.30
370.
0663

49
Figure 4.3.: Decomposed weights for sub-factors
main matrix is consistent and the weight vectors generated for this matrix are
acceptable.
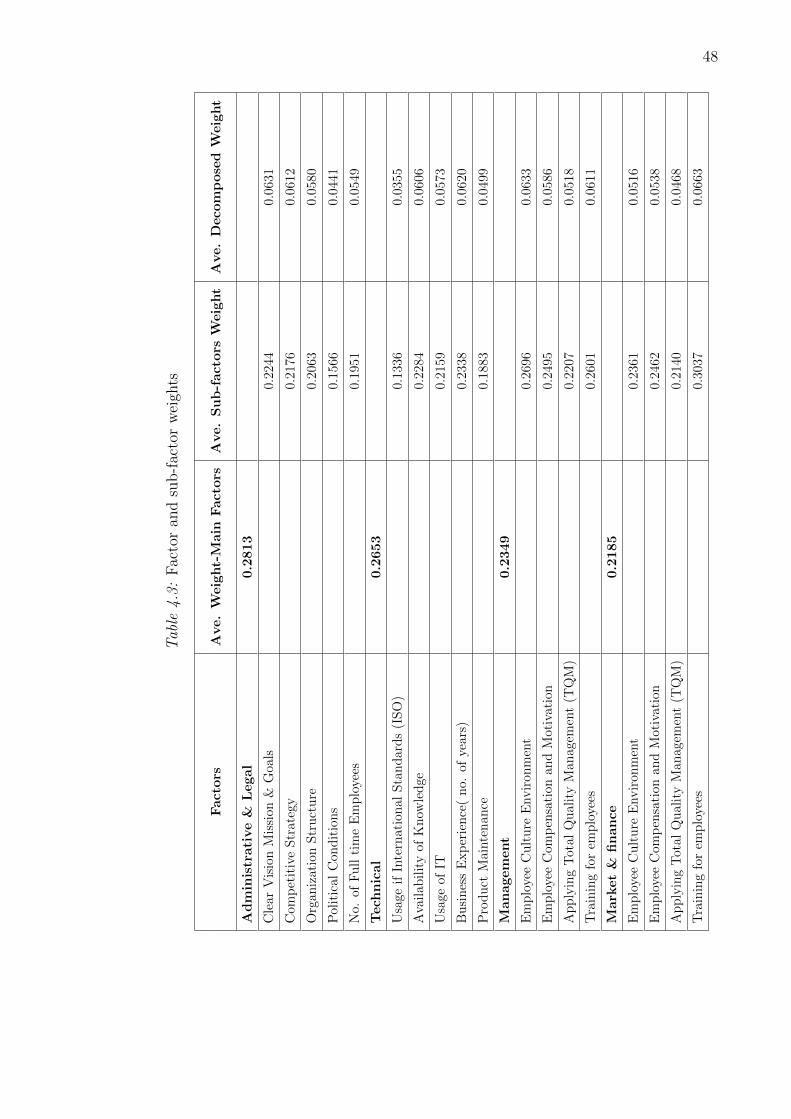
6. The process is repeated for sub-factors, Table A.1 shows weights for main
factors and sub-factors, followed by calculation of Average Decomposed
weight. The decomposed weight is calculated by multiplying the main factor
weight by its sub-factor weight. The decomposed weight will represent the
50
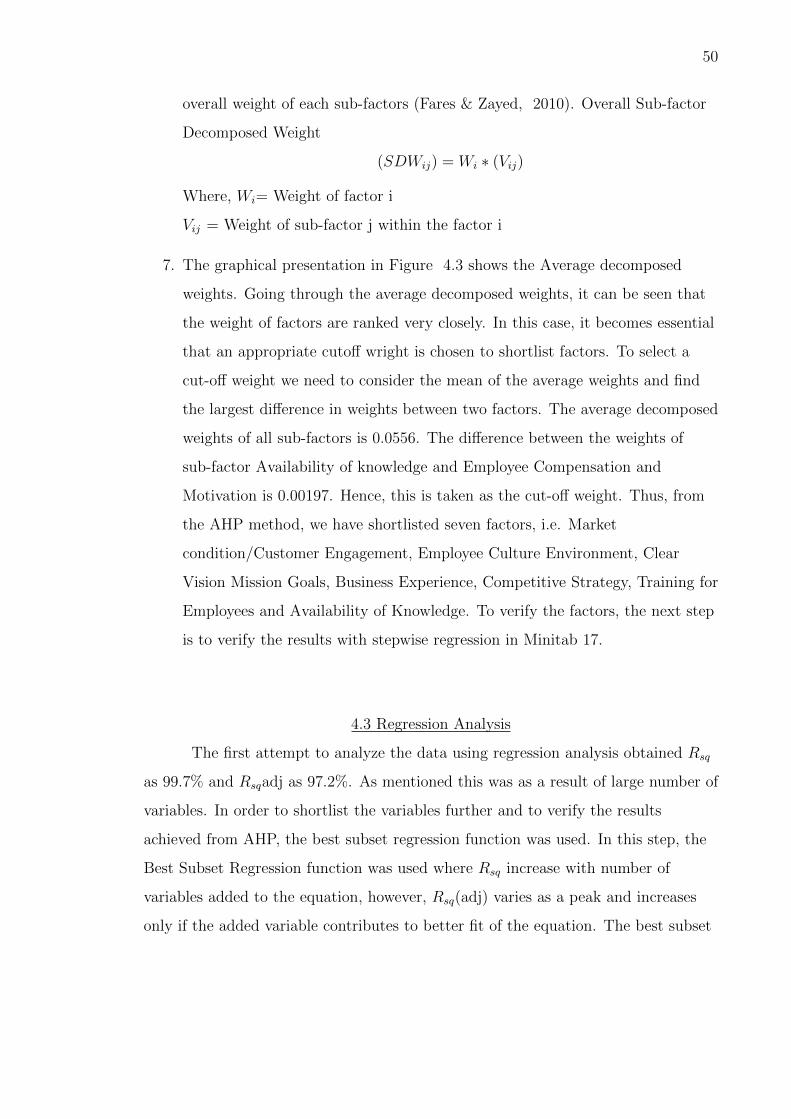
overall weight of each sub-factors (Fares & Zayed, 2010). Overall Sub-factor
Decomposed Weight
(SDWij) = Wi ∗ (Vij)
Where, Wi= Weight of factor i
Vij = Weight of sub-factor j within the factor i
7. The graphical presentation in Figure 4.3 shows the Average decomposed
weights. Going through the average decomposed weights, it can be seen that
the weight of factors are ranked very closely. In this case, it becomes essential
that an appropriate cutoff wright is chosen to shortlist factors. To select a
cut-off weight we need to consider the mean of the average weights and find
the largest difference in weights between two factors. The average decomposed
weights of all sub-factors is 0.0556. The difference between the weights of
sub-factor Availability of knowledge and Employee Compensation and
Motivation is 0.00197. Hence, this is taken as the cut-off weight. Thus, from
the AHP method, we have shortlisted seven factors, i.e. Market
condition/Customer Engagement, Employee Culture Environment, Clear
Vision Mission Goals, Business Experience, Competitive Strategy, Training for
Employees and Availability of Knowledge. To verify the factors, the next step
is to verify the results with stepwise regression in Minitab 17.
4.3 Regression Analysis
The first attempt to analyze the data using regression analysis obtained Rsq
as 99.7% and Rsqadj as 97.2%. As mentioned this was as a result of large number of
variables. In order to shortlist the variables further and to verify the results
achieved from AHP, the best subset regression function was used. In this step, the
Best Subset Regression function was used where Rsq increase with number of
variables added to the equation, however, Rsq(adj) varies as a peak and increases
only if the added variable contributes to better fit of the equation. The best subset

51
reported is the highest Rsq and Rsqadj value. Also, the Mallow’s coefficient Cp
should be equal or close to equal to number of variables (Fares & Zayed, 2010).
Figure 4.4.: Regression analysis for variance for best subset.
For this data, the best subset identified included 20 factors (qualitative and
quantitative). After multiple iterations for various subsets shortlisted from AHP, the
best subset analysis was carried out. The highest Rsq value achieved was 88.92%,
Rsqadj as 78.97% and Rsqpredicted as 55.04%, refer figure 4.4. Figure 4.5 shows the

52
Figure 4.5.: Shortlisted qualitative variables
seven shortlisted qualitative varables for modelling purpose. The low Rsqpred value
indicates that this model has very low prediction rate. There are two main reason
for this. Firstly, the equation deals with human opinion which are highly qualitative
and difficult to model. Secondly, the majority of participants who responded in the
survey fall between rank 1 to 200. Therefore, this model can best predict ranking for
organizations that fall between this range. This was the main reason for not utilizing
regression prediction model to assess organizational performance assessment.
4.4 Fuzzy Logic Modelling
Human reasoning being more approximate than precise in nature often makes
it difficult to measure and determine the measure of factors affecting a particular
cause. Introduced by Zadeh (1965), Fuzzy logic can be used as a tool to understand
imprecision and qualitative aspects of natural language and imprecise cognitive

53
reasoning. Fuzzy logic-based systems are used to analyze and process linguistic
inputs to derive outputs or decisions (Senouci, El-Abbasy, & Zayed, 2012). Matlab
R2015a Fuzzy Logic Tool Box software is used to process fuzzy logic inference.
4.4.1 Hierarchical Fuzzy Expert System
The hierarchical fuzzy model consists of sub-models, which correspond to the
three main categories. In addition to the sub-model there will be one more model
that combines the outputs of these sub-models in order to generate the rank of of
the organization. The fuzzy structure of each of the models is identical. The
membership function assigned to input variables and the knowledge based rules
differ. When dealing with high number of variables, like in this study, the total
number of shortlisted independent variables are 20, developing a single layer fuzzy
model is not recommended.
Figure 4.6.: Overall Hierarchical Fuzzy Model

54
As the qualitative variables were measured on different scale compared to
quantitative variables. For example, annual growth rate is measure in percentage
and entropy was measured in fraction or decimal values. Assigning weight to the
membership on one layer is extremely difficult. The weight for individual factor can
be used for comparison with the same category, however, a sub-factor from non
financial category cannot be compared to sub-factors from financial category.
Additionally, for every variable there should be seven-nine rules. To build a
one layer fuzzy model the minimum number of rules required will be more than 140
rules for 20 variables. The hierarchical model allows us to work with less number of
rules. The sub-model for this study will be built using only 7-8 factors (Fayek &
Tsehayae, 2012). With usable data set of 75 responses from the survey, the
hierarchical system will allow us to develop the prediction model. The set of
responses required for knowledge based rule training and testing will be satisfied.
There will be total three models, two sub-models for financial and non financial
factors and the third model will be second layer of fuzzy model which will combine
inputs of financial, non financial and market diversification factor as shown in
Figure 4.6. Since, there is only one factor under market diversification, a separate
sub-model will not be developed. The steps involved are as following:
4.4.2 Assigning Membership Function
Existing literature review shows that different form of membership function
are used depending on the type problem. The factor’s fuzzy membership is such
that the real input can be converted in to fuzzy number value in range [0,1].
1. For all the independent variables, the values were normalized so that they
could be brought to scale between 0.0 to 1.0. The normalized data as attached
in Appendix A was calculated using the formula below
zi = (Xi −Xmin)/(Xmax −Xmin)

55
Table 4.4: Membership function range value
Range Membership Function
0.0-0.2 Very High
0.2-0.4 High
0.4-0.6 Moderately low
0.6-0.8 Low
0.8-1.0 Very Low
2. The independent variables are assigned gaussian membership function with
range from 0.0 to 1.0. In this study, we are dealing with expert opinions and
hence instead of giving it crisp boundary, it is assigned a wave form
membership. The membership function value and the corresponding range is
as shown in Table 4.4.
3. The relative weight of each factor at the first level of hierarchy is determined.
The normalized global weights calculated for each main factor and sub-factor.
This step was carried out for sub-factors of financial and non-financial
categories. Since, only one factor falls under market diversification, the weight
of only one factor was calculated at the factor level. The normalized global
weights allow the sub-factors to be compared to each other. The globalized
weight is calculated by multiplication of weight of individual sub factor to the
weight of main factor (Fares & Zayed, 2010). The last column shows the
normalized global weights. It shows that the Market condition and Customer
Engagement is factor with highest weight at 1.000, closely followed by
employee culture environment which is second highest at 0.984, refer Table 4.5.
4. The next step, involves developing of if-then rules, that is, the impact of
sub-factor on the output, as shown in Table 4.6.
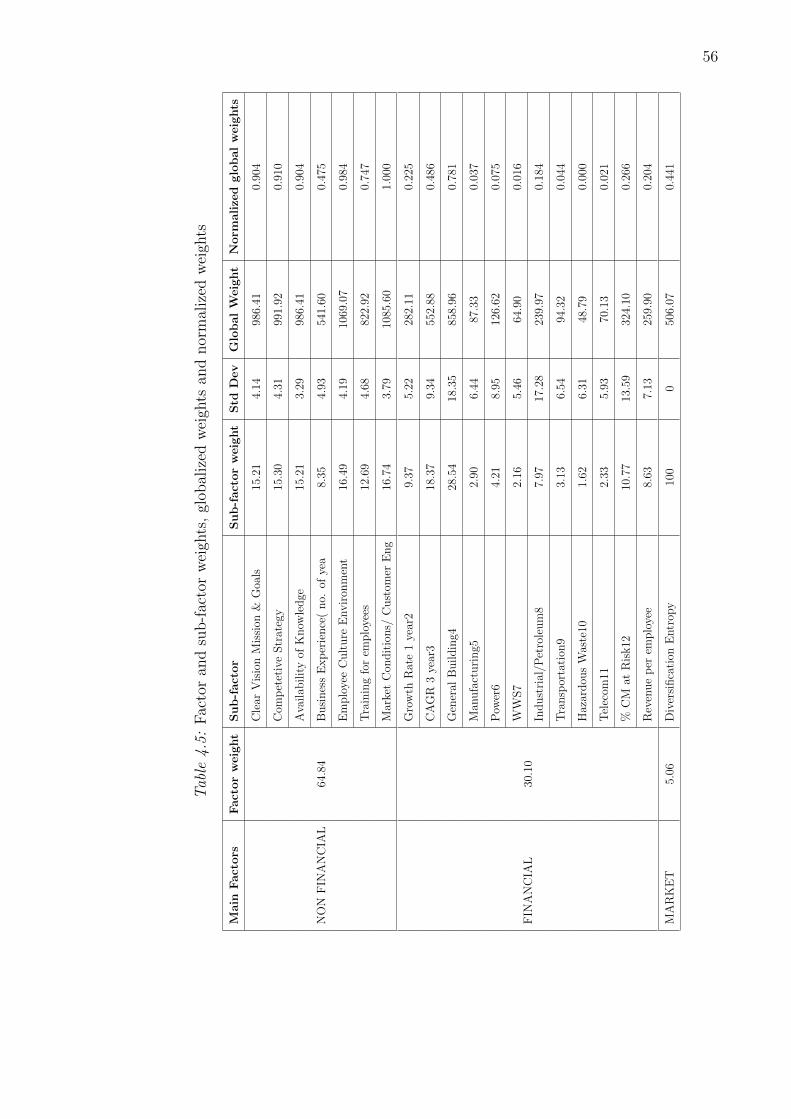
56
Tab
le4.
5:F
acto
ran
dsu
b-f
acto
rw
eigh
ts,
glob
aliz
edw
eigh
tsan
dnor
mal
ized
wei
ghts
Main
Fact
ors
Fact
or
weig
ht
Su
b-f
act
or
Su
b-f
act
or
weig
ht
Std
Dev
Glo
bal
Weig
ht
Norm
ali
zed
glo
bal
weig
hts
NO
NF
INA
NC
IAL
64.8
4
Cle
arV
isio
nM
issi
on&
Goa
ls15
.21
4.14
986.
410.
904
Com
pet
etiv
eS
trat
egy
15.3
04.
3199
1.92
0.91
0
Ava
ilab
ilit
yof
Kn
owle
dge
15.2
13.
2998
6.41
0.90
4
Bu
sin
ess
Exp
erie
nce
(n
o.of
yea
8.35
4.93
541.
600.
475
Em
plo
yee
Cu
ltu
reE
nvir
onm
ent
16.4
94.
1910
69.0
70.
984
Tra
inin
gfo
rem
plo
yees
12.6
94.
6882
2.92
0.74
7
Mar
ket
Con
dit
ion
s/C
ust
omer
Eng
16.7
43.
7910
85.6
01.
000
FIN
AN
CIA
L30
.10
Gro
wth
Rat
e1
year
29.
375.
2228
2.11
0.22
5
CA
GR
3ye
ar3
18.3
79.
3455
2.88
0.48
6
Gen
eral
Bu
ild
ing4
28.5
418
.35
858.
960.
781
Man
ufa
ctu
rin
g52.
906.
4487
.33
0.03
7
Pow
er6
4.21
8.95
126.
620.
075
WW
S7
2.16
5.46
64.9
00.
016
Ind
ust
rial
/Pet
role
um
87.
9717
.28
239.
970.
184
Tra
nsp
orta
tion
93.
136.
5494
.32
0.04
4
Haz
ard
ous
Was
te10
1.62
6.31
48.7
90.
000
Tel
ecom
112.
335.
9370
.13
0.02
1
%C
Mat
Ris
k12
10.7
713
.59
324.
100.
266
Rev
enue
per
emp
loye
e8.
637.
1325
9.90
0.20
4
MA
RK
ET
5.06
Div
ersi
fica
tion
Entr
opy
100
050
6.07
0.44
1
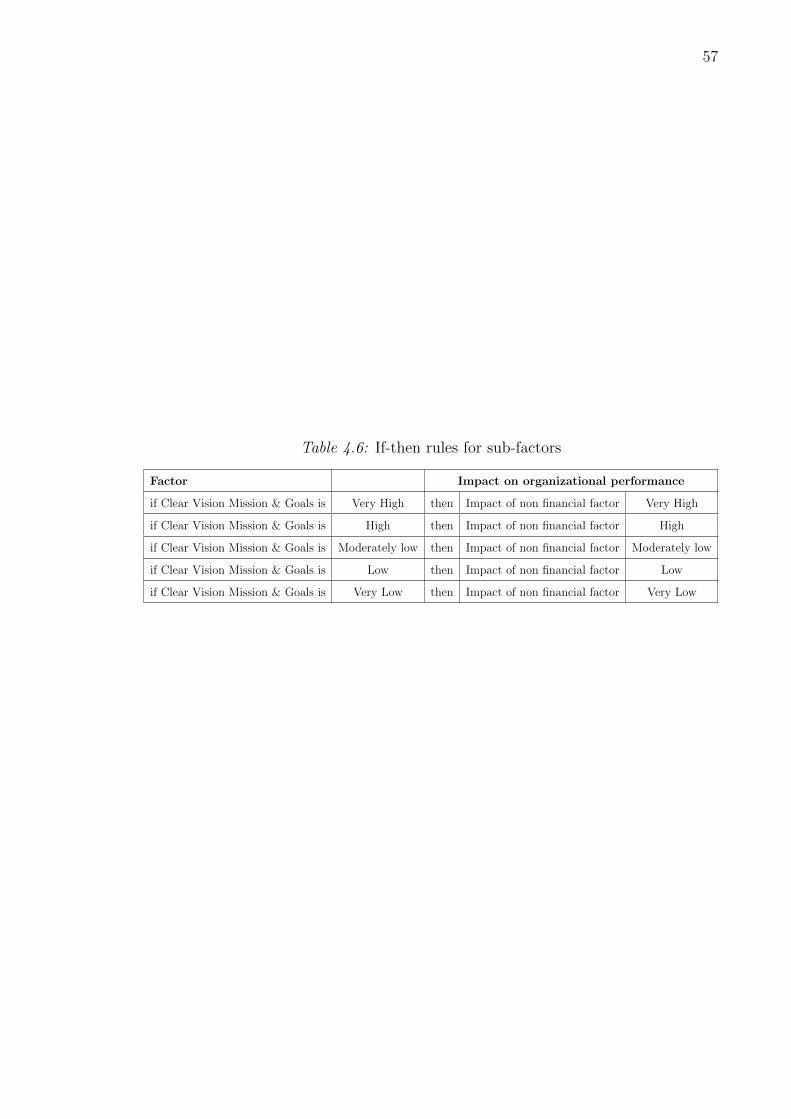
57
Table 4.6: If-then rules for sub-factors
Factor Impact on organizational performance
if Clear Vision Mission & Goals is Very High then Impact of non financial factor Very High
if Clear Vision Mission & Goals is High then Impact of non financial factor High
if Clear Vision Mission & Goals is Moderately low then Impact of non financial factor Moderately low
if Clear Vision Mission & Goals is Low then Impact of non financial factor Low
if Clear Vision Mission & Goals is Very Low then Impact of non financial factor Very Low
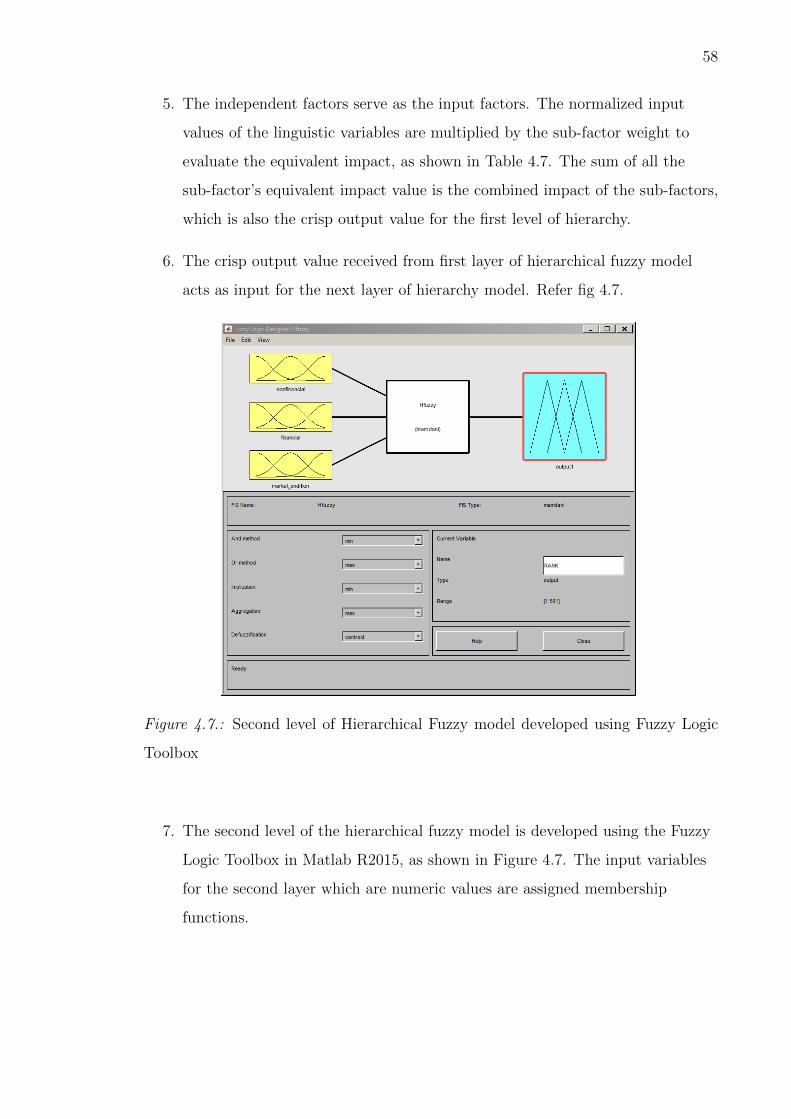
58
5. The independent factors serve as the input factors. The normalized input
values of the linguistic variables are multiplied by the sub-factor weight to
evaluate the equivalent impact, as shown in Table 4.7. The sum of all the
sub-factor’s equivalent impact value is the combined impact of the sub-factors,
which is also the crisp output value for the first level of hierarchy.
6. The crisp output value received from first layer of hierarchical fuzzy model
acts as input for the next layer of hierarchy model. Refer fig 4.7.
Figure 4.7.: Second level of Hierarchical Fuzzy model developed using Fuzzy Logic
Toolbox
7. The second level of the hierarchical fuzzy model is developed using the Fuzzy
Logic Toolbox in Matlab R2015, as shown in Figure 4.7. The input variables
for the second layer which are numeric values are assigned membership
functions.

59
Tab
le4.
7:Sub
fact
orw
eigh
tsan
deq
uiv
alen
tim
pac
t
Ru
len
o.C
lear
Vis
ion
Com
pet
itiv
eS
trat
egy
Ava
ilab
ilit
yof
Kn
owle
dge
Bu
sin
ess
Exp
Em
plo
yee
Cu
ltu
reT
rain
ing
emp
loye
esM
arke
tC
ond
s/C
ust
omer
En
gE
qu
ival
ent
Iim
pac
tC
omb
ined
Imp
act
15.2
115.3
015.2
18.3
516.4
912.6
916.7
4
10.
750.
500.
750.
500.
750.
330.
756.
38H
igh
20.
750.
500.
750.
041.
000.
671.
007.
25H
igh
30.
750.
751.
000.
561.
001.
001.
008.
87V
ery
hig
h
40.
750.
500.
750.
511.
000.
671.
007.
64H
igh
50.
751.
000.
750.
100.
750.
670.
757.
24H
igh
61.
000.
751.
000.
101.
000.
671.
008.
44V
ery
hig
h
71.
001.
000.
750.
430.
750.
671.
008.
31V
ery
hig
h
81.
001.
001.
000.
430.
501.
001.
008.
70V
ery
hig
h
90.
500.
500.
500.
280.
500.
330.
504.
61M
od
erat
e
101.
001.
001.
000.
281.
001.
001.
009.
39V
ery
hig
h
110.
750.
750.
500.
280.
500.
331.
006.
20H
igh
121.
000.
750.
500.
111.
000.
331.
007.
27H
igh
130.
251.
000.
500.
040.
250.
330.
754.
80M
od
erat
e
140.
500.
501.
000.
460.
500.
670.
756.
36H
igh
151.
000.
751.
000.
501.
001.
000.
758.
78V
ery
hig
h
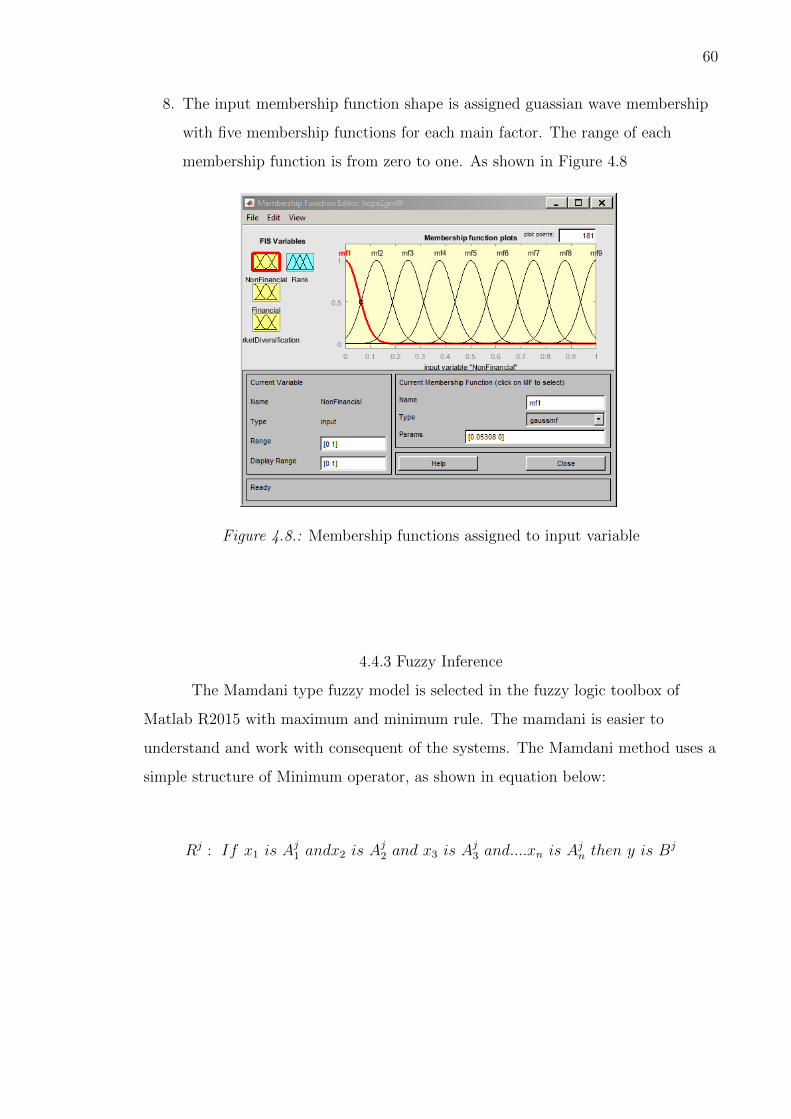
60
8. The input membership function shape is assigned guassian wave membership
with five membership functions for each main factor. The range of each
membership function is from zero to one. As shown in Figure 4.8
Figure 4.8.: Membership functions assigned to input variable
4.4.3 Fuzzy Inference
The Mamdani type fuzzy model is selected in the fuzzy logic toolbox of
Matlab R2015 with maximum and minimum rule. The mamdani is easier to
understand and work with consequent of the systems. The Mamdani method uses a
simple structure of Minimum operator, as shown in equation below:
Rj : If x1 is Aj1 andx2 is A
j2 and x3 is A
j3 and....xn is A
jn then y is B
j

61
Where Rj is the j-th rule, Aji (j= 1,2, N,i=1,2,n), Bj are the fuzzy subsets of
the inputs and outputs respectively. This rule can be written mathematically
(Fares, 2008; Jin 2003) as
µRj(x1, x2, x3, ....., xn, y) = µA1
j ∧ µA2
j ∧ µA3
j...... ∧ µAn
j ∧ µB
The minimum operator is used to calculate the firing strength of each fuzzy
rule. The firing strength is directly proportional to the impact on the output. The
rules are setup up in the if-then format as shown in Figure 4.9
Figure 4.9.: If-then rule setup
4.4.4 Defuzzification
There are multiple defuzzification methods. In this study, the output factor
is assigned triangular shape with nine membership functions. The reason for nine
membership function is to increase the sensitivity and accuracy of model, as shown

62
Figure 4.10.: Membership function assigned to Output variable
in Figure 4.10. Output membership function maps the height corresponding to the
firing strength of rules (Chao & Skibniewski, 1998). In this layer of fuzzy process,
the output values are obtained by defuzzified value of centroid of the triangular
membership assigned to the output variable. This numeric output is the predicted
rank of the organization as shown in Figure 4.12.
4.5 System Analysis and Verification
Two methods have been used to test and verify the developed model and
system. First approach is to determine the sensitivity or stability of model by
assessing the efect of the different factors on the model behaviour. For this purpose
the in-built tool surface is used to see the model behavior. The second approach is

63
Figure 4.11.: Fuzzy rule output
model accuracy testing which uses results from regression model to verify the results
of developed model.
4.5.1 System Analysis
To ensure that the model is sensitive and stable to perform under different
parameters this model is tested by validation rule set. As seen in the Figures 4.13,
4.14 and 4.15.

64
Figure 4.12.: Fuzzy rule output
4.5.2 Verification of the Developed Model
To verify the developed model, 20% of the data set was left untouched for
testing purposes. To determine whether the model is verified or not when using
results comparison as in this study, two terms can be used to determine the validity
of the model, Average Validity Percent (AIP) and Average Invalidity Percent (AIP).
AVP represents the validation percent out of 100 and AIP represents the prediction
error (T. M. Zayed & Halpin, 2005). These two terms are shown in Equation below:
AIP = ((n∑
i=1
|1− (Ei ÷ Ci)|))÷ n (4.1)

65
Figure 4.13.: Model behavior for Financial vs Non-Financial with respect to Rank
AV P = 1− AIP (4.2)
Where
AIP : Average Invalidity Percent
AVP : Average Validity Percent
Ei : Estimated value
Ci : Actual value
Table 4.8 shows the validation data with comparison of categories of actual
organization rank and the predicted category of organization rank. The Average
Invalidity Percentage is 36.667%. Therefore, the average validity percentage is
64.334%. Thus the model is stable.

66
Table 4.8: Validation results
Rank Category (C) Predicted Rank Category (E) ABS(1-(E/C))
1 1 0.00
2 1 0.50
4 1 0.75
5 5 0.00
1 1 0.00
2 2 0.00
3 1 0.67
3 1 0.67
2 5 1.50
3 1 0.67
1 1 0.00
3 5 0.67
1 1 0.00
1 1 0.00
2 2 0.00
AIP% 36.11

67
Figure 4.14.: Model behavior for Financial vs Market Diversification with respect to
Rank
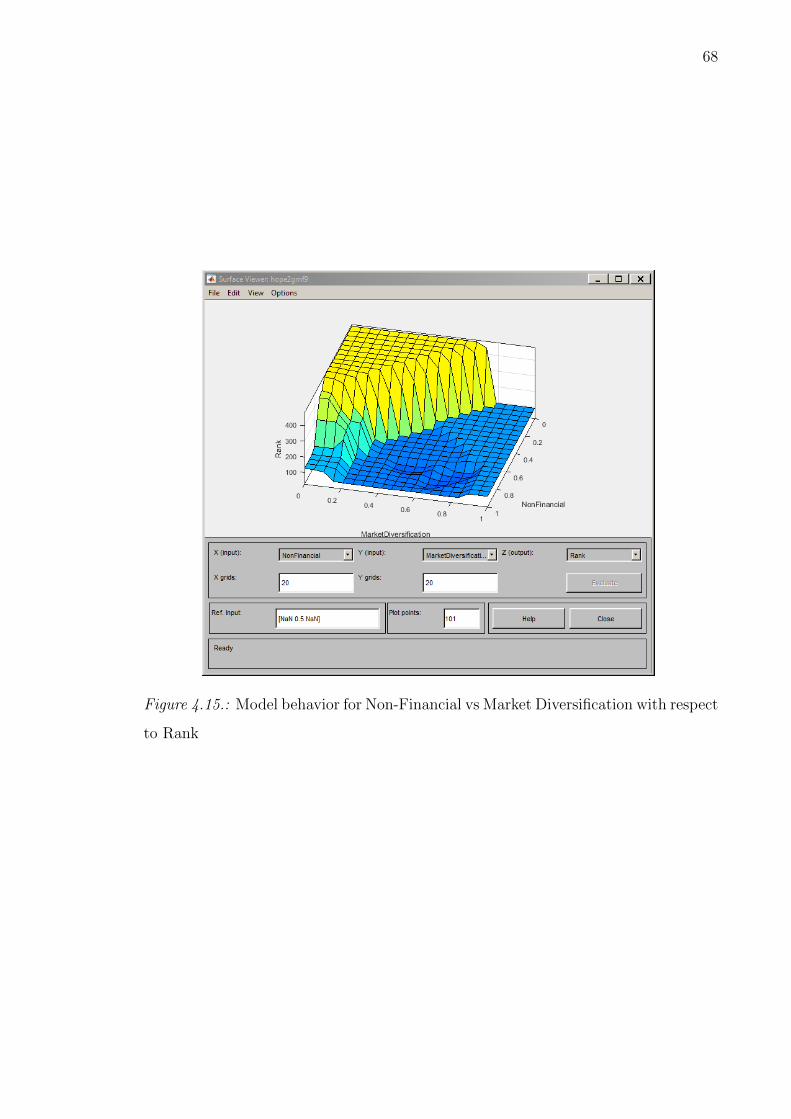
68
Figure 4.15.: Model behavior for Non-Financial vs Market Diversification with respect
to Rank

69
CHAPTER 5. CONCLUSION
5.1 Summary
The performance of a construction organization is dependent on several
success factors. Only few research studies have focused to identify and measure the
non-financial performance of the construction organization.The present study
includes a literature survey to validate the importance of critical success factors
identified in previous studies. This paper represents development of a comprehensive
framework to assess the performance of construction organizations based on 20
factors categorized into financial, non-financial and market diversification, using
hierarchical fuzzy approach. The seven qualitative or non-financial critical success
factors (i.e. Clear Vision, Mission, and Goals, Competition Strategy, Availability of
Knowledge, Business Experience (no. of years), Employee Culture Environment,
Market condition and Customer Engagement) were selected using Analytic
Hierarchy Process (AHP) ranking system. In order to assess the combined impact of
factors on the overall organization performance, they have been modelled using
hierarchical fuzzy expert system. Fuzzy input and outputs and the rules governing
them are designed using the data responses collected from industry professionals.
The study will be a step towards understanding a detailed analysis of factors that
may impact the overall performance.
5.2 Conclusion
During the course of this research, multiple points of observation and
concern have been concluded from data response and analysis, such as:
70
• It can be deducted from the collected questionnaire that industry professionals
rate the impact of Customer Engagement and Employee Cultural
Environment as very high.
• The ranking of impact of critical success factors such as Product Maintenance,
Research and Development, Usage of International Standards and Political
conditions is very low. The average decomposed weight from the AHP process
shows that construction industry rates impacts of investment in Research and
Development of in-house technologies as low and medium. They mainly rely
on the products from computing firms.
• The political condition in the U.S.A. is more conducive. In previous study, the
survey which was sent out to middle eastern countries, the impact of political
conditions was rated as high and very high (Elwakil et al., 2009).
• The Hierarchical Fuzzy Model proposed is based on the expert opinions of
industry professionals. It is necessary to establish certain parameters or rubric
following which they answer the questionnaire. The personal bias leads to
extensive outliers, thus making the model inefficient.
• It is also observed that majority of participants have rated the employee
culture environment of their respective organization as high and very high.
However, the rating for employee compensation is low. This either represents
that the employees of these organizations are not paid well or the participants
favor a better employee culture environment over employee compensation.
This represent personal bias in the responses.
5.3 Limitations
The developed model uses AHP to shortlist qualitative factors and
hierarchical fuzzy expert system technique to assess the organizational performance.
There are some inherent limitations in this model such as:
71
• The critical success factors have been shortlisted from literature review and
the impact rating from participants. There is possibility that a factor could be
left out if the frequency of appearance is low.
• Furthermore, based on geographical conditions and socio-economic conditions
the model can only predict ranking of organizations that fall in that
geographic location.
• The total number of collected questionnaires is 130. However, the usable data
was only 90. The model accuracy can be improved by increasing the number
of participant responses which are used to develop knowledge based rules of
the fuzzy expert system.
• The more the data collected, the more accurate will be the results as the
number of training rules will also increase. Furthermore, if the data should be
collected from companies that are wide across the range of ranking.
• Majority of the construction firms from which responses were received were
not publicly listed. This limited the number key financial performance
indicating factors that could be included in the model.
• Due to technical constraints only the second layer of hierarchical fuzzy expert
model could be developed in Matlab R2015. The first layer was manually
calculated to compute the combined impact of sub-factors in sub-model.
• The input membership was Gaussian membership in the second layer of fuzzy
expert system and the crisp output values were fuzzified again and assigned
Gaussian membership. In the process, the model loses its accuracy.
• The data collected focused on companies that were present during the Purdue
Building Construction Management Career Fair. It can be seen that the
majority of companies are from Midwest, thus the responses received were

72
clustered around certain organization ranking. Such data set limits the
train-ability of the system.
• Furthermore, the model can only predict the category of the rank, not exact
rank. To be able to make the model more accurate, data over wide range of
rank needs to be collected.
5.4 Recommendation and Future works
The developed research/model benefits both researcher and practitioners to
predict accurate company performance. Some of the recommendation and future
works that can enhance the model and the research in general are listed below:
• Develop rubrics for survey participants to rate their opinion without bias.
• Collect quantitative information to validate the responses to qualitative
questions.
• Include more quantitative financial factors to improve the accuracy of model
by assessing the overall performance.
• to reduce personal bias multiple participants from the same organizations
should participate in the survey.
• The study shows a need for further investigation on critical success factor to
select the optimum number and nature for modeling the organizations
performance.
• The end results of this research will lead to a new generation of specific and
accurate company performance model and fully automated models/systems
that might partially replace the expert opinion techniques.

APPENDICES

73
APPENDIX A. RESEARCH SURVEY QUESTIONNAIRE
Assessing Impact of Critical Success Factors on Overall Organizational
Performance
Dr. Emad Elwakil and Zenith Rathore
School of Construction Management, Purdue University
Please enter your information below*:
1. Your Total experience in construction industry (in years):
2. Select your present designation in company:
(a) Project Engineer/ Field Engineer
(b) Project Manager
(c) Estimator
(d) Superintendent
(e) HR/Administrative
(f) Other (please specify)
3. Name of your present company*:
*This information will not be reported in results. Any identifiable information
will be coded and confidentiality will be maintained.
Please provide you expert opinion for the following on a scale of one to five:
COLUMN 1: Please rate the level of IMPACT of factor on organizational
performance.
COLUMN 2: Please rate the level of IMPLEMENTATION of the factor in
your current organization Where, 1=Very Low 2= Low 3=Moderate 4=High 5=
Very high
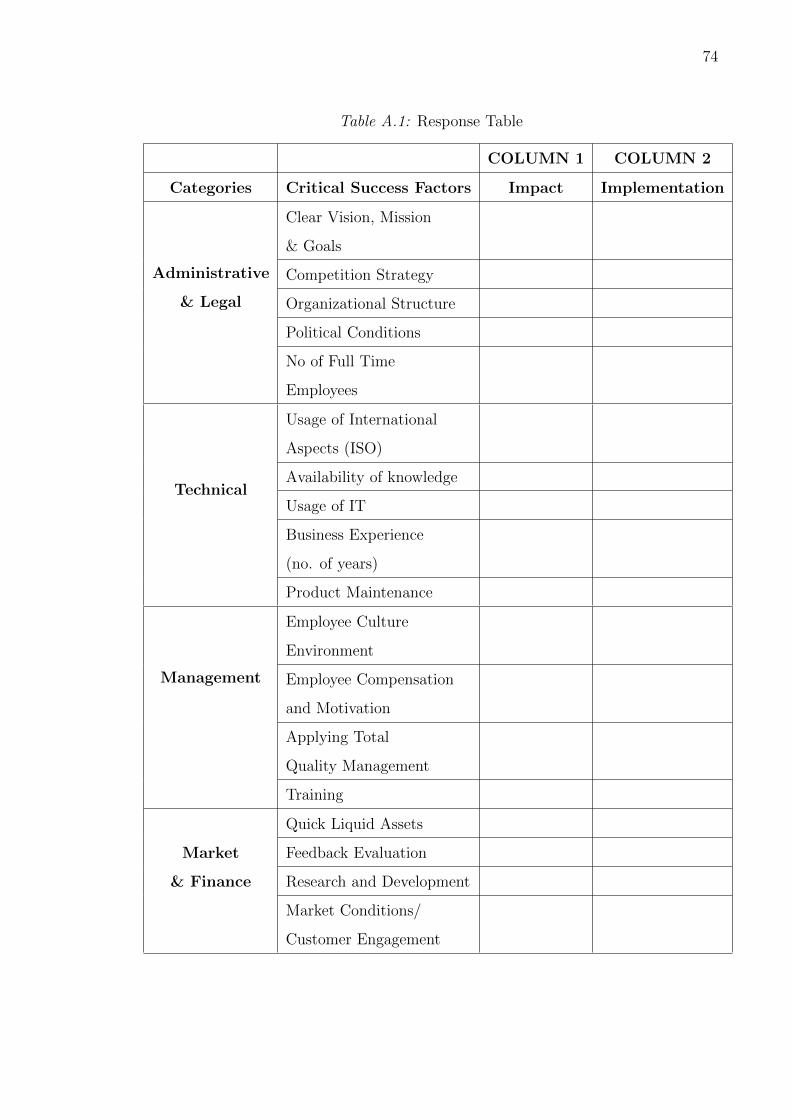
74
Table A.1: Response Table
COLUMN 1 COLUMN 2
Categories Critical Success Factors Impact Implementation
Administrative
& Legal
Clear Vision, Mission
& Goals
Competition Strategy
Organizational Structure
Political Conditions
No of Full Time
Employees
Technical
Usage of International
Aspects (ISO)
Availability of knowledge
Usage of IT
Business Experience
(no. of years)
Product Maintenance
Management
Employee Culture
Environment
Employee Compensation
and Motivation
Applying Total
Quality Management
Training
Market
& Finance
Quick Liquid Assets
Feedback Evaluation
Research and Development
Market Conditions/
Customer Engagement
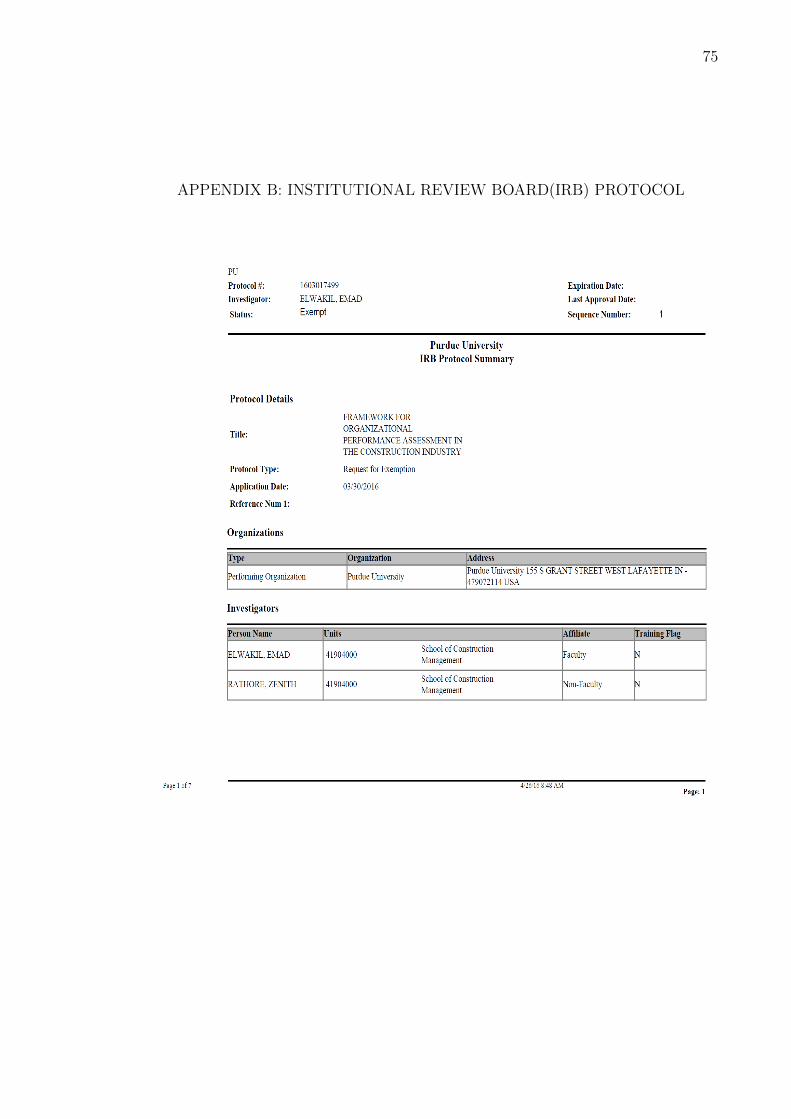
75
APPENDIX B: INSTITUTIONAL REVIEW BOARD(IRB) PROTOCOL
76
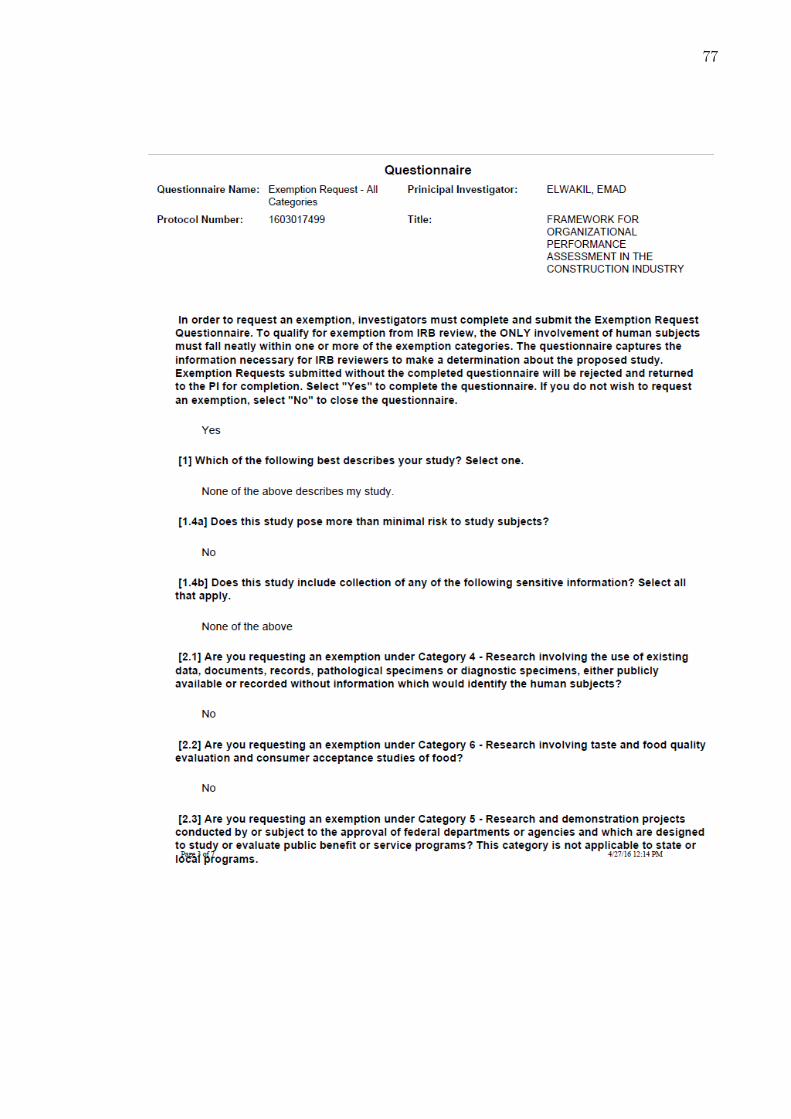
77

78

79
80
81

LIST OF REFERENCES

82
LIST OF REFERENCES
Bititci, U., & Muir, D. (1997). Integrated performance measurement systems: adevelopment guide. International Journal Of Operations & ProductionManagement , 17 , 522–556.
Bontis, N., & Dragonetti, N. C. (1999). The Knowledge Toolbox : A Review of theTools Available to Measure and Manage Intangible Resources. EuropeanManagment Journal , 17 (4), 391–402. doi: 10.1016/S0263-2373(99)00019-5
Chan, A. P. C., Chan, D. W. M., & Yeung, J. F. Y. (2009). Overview of theApplication of Fuzzy Techniques in Construction Management Research(Vol. 135). doi: 10.1061/(ASCE)CO.1943-7862.0000099
Chao, L.-C., & Skibniewski, M. J. (1998). Fuzzy Logic for Evaluating AlternativeConstruction Technology. Journal of Construction Engineering andManagement , 124 , 297–304. doi: 10.1061/(ASCE)0733-9364(1998)124:4(297)
Chinowsky and Meredith, J. (2000). Strategic Management in ConstructionIndustry. (February), 1–9.
Choi, J., & Russell, J. S. (2005). Long-Term Entropy and Profitability Change ofUnited States Public Construction Firms. Journal of Management inEngineering , 21 (1), 17–26. doi: 10.1061/(ASCE)0742-597X(2005)21:1(17)
Cooke-Davies, T. (2002). The ”real” success factors on projects. InternationalJournal of Project Management , 20 , 185–190. doi:10.1016/S0263-7863(01)00067-9
Costa, D., Formoso, C., Kagioglou, M., Alarcon, L., & Caldas, C. (2006).Benchmarking initiatives in the construction industry: lessons learned andimprovement opportunities. , 22 (4), 158–167. Retrieved fromhttp://usir.salford.ac.uk/583/ doi:10.1061/(ASCE)0742-597X(2006)22:4(158)
Elwakil, E., Ammar, M., Zayed, T., Mahmoud, M., Eweda, A., & Mashhour, I.(2009). Investigation and Modeling of Critical Success Factors. AmericanSociety of Civil Engineers , 350–359.
Fares, H., & Zayed, T. (2010). Hierarchical Fuzzy Expert System for Risk ofFailure. (February), 53–62.
Fayek, A. R., & Oduba, A. (2005). Predicting Industrial Construction LaborProductivity Using Fuzzy Expert Systems. Journal of ConstructionEngineering and Management , 131 (8), 938–941. doi:10.1061/(ASCE)0733-9364(2005)131:8(938)

83
Fayek, A. R., & Tsehayae, A. A. (2012). Modeling Construction LabourProductivity Using Fuzzy Logic and Exploring the Use of Fuzzy HybridTechniques.
Fisher, D., Miertschin, S., & Pollock Jr., D. R. (1995). Benchmarking inConstruction Industry. Journal of Management in Engineering , 11 (Rothman1992), 50–57. doi: 10.1061/(ASCE)0742-597X(1995)11:1(50)
Gustavsson, T. K. (2012). Boundary action in construction projects: newcollaborative project practices. International Journal of Managing Projectsin Business , 5 , 364–376. doi: 10.1108/17538371211235272
Harrison, P. (2007). Can Measurement Error Explain the Weakness of ProductivityGrowth in the Canadian Construction Industry ? Centre for the Study ofLiving Standards , 1–100.
Hauser, J., & Katz, G. (1998). Metrics: you are what you measure! EuropeanManagement Journal , 16 (5), 517–528. doi: 10.1016/S0263-2373(98)00029-2
Isik, Z., Arditi, D., Dikmen, I., & Birgonul, M. T. (2010). Impact of Resources andStrategies on Construction Company Performance. Journal of Managementin Engineering , 26 (January), 9–18. doi:10.1061/(ASCE)0742-597X(2010)26:1(9)
Kim, H.-J., & Reinschmidt, K. F. (2012). Market Structure and OrganizationalPerformance of Construction Organizations. Journal of Management inEngineering , 28 (2), 212–220. Retrieved from10.1061/(ASCE)ME.1943-5479.0000082\ doi:10.1061/(ASCE)ME.1943-5479.0000082
Liu, H., Wang, M.-j., Skibniewski, M. J., He, J.-s., & Zhang, Z.-s. (2014).Identification of Critical Success Factors for Construction Innovation : Fromthe Perspective of Strategic Cooperation. Frontiers of EngineeringManagement(1989), 202–209. doi: 10.15302/J-FEM-2014027
Muller, R. (2012). Critical success factors in projects: Pinto, Slevin, and Prescottthe elucidation of project success. International Journal of ManagingProjects in Business , 5 , 757–775. doi: 10.1108/17538371211269040
Nasir, H., Haas, C. T., Rankin, J. H., Fayek, A. R., Forgues, D., & Ruwanpura, J.(2012). Development and implementation of a benchmarking and metricsprogram for construction performance and productivity improvement.Canadian Journal of Civil Engineering , 39 , 957–967. doi: 10.1139/l2012-030
Neely, A., Adams, C., & Crowe, P. (2001). The performance prism in practice.Measuring Business Excellence, 5 , 6–13. doi: 10.1108/13683040110385142
Neely, A., Gregory, M., & Platts, K. (1995). Performance measurement systemdesign: a literature review and research agenda. International Journal OfOperations & Production Management , 15(4), 80–116. Retrieved fromhttp://www.emeraldinsight.com/journals.htm
Nguyen, V. U. (1985). Tender Evaluation by Fuzzy Sets (Vol. 111). doi:10.1061/(ASCE)0733-9364(1985)111:3(231)

84
Nicolini, D., & Meznar, M. B. (1995). social construction of organizationallearning:Conceptual and Practical Issues in the Field (Vol. 48). doi:10.1177/001872679504800701
Ozorhon, B. (2012). Analysis of Construction Innovation Process at Project Level.Journal of Management in Engineering(October), 120915010108004. doi:10.1061/(ASCE)ME.1943-5479.0000157
Pandya, A. M., & Rao, N. V. (1998). Diversification and firm performance: anempirical evaluation. Journal of Financial and Strategic Decisions , 11 (2),67–81.
Pinto, J. K., & Covin, J. G. (1989). Critical factors in project implementation: acomparison of construction and R&D projects (Vol. 9). doi:10.1016/0166-4972(89)90040-0
Pinto, J. K., & Mantel, S. J. (1990). The causes of project failure. IEEETransactions on Engineering Management , 37 (4), 269–276. doi:10.1109/17.62322
Pinto, J. K., & Slevin, D. P. (1987). Critical factors in successful projectimplementation. IEEE Transactions on Engineering Management ,EM-34 (I), 22–27. Retrieved fromhttp://ieeexplore.ieee.org/lpdocs/epic03/wrapper.htm doi:10.1109/TEM.1987.6498856
Rathore, Z., & Elwakil, E. (2015). A Framework of Organizational PerformanceAssessment. In (pp. 1–10).
Saaty, T. L. (1990). How to make a decision: The analytic hierarchy process.European Journal of Operational Research, 48 (1), 9–26. doi:10.1016/0377-2217(90)90057-I
Sargent, D. J. (2001). Comparison of artificial neural networks with other statisticalapproaches: results from medical data sets. Cancer , 91 , 1636–1642.
Senouci, A., El-Abbasy, M. S., & Zayed, T. (2012). Fuzzy-Based Model forPredicting Failure of Oil Pipelines. Journal of Infrastructure Systems , 1–10.doi: 10.1061/(ASCE)IS.1943-555X
Simon, H. A., & Bonini, C. (1958). The Size Distribution of Business Firms.American Economic Association, 48 (4), 607–617. doi: 10.1257/jep.6.3.79
Sims, H. P., & Gioia, D. A. (1986). The thinking organization. Jossey-Bass Inc Pub.
Spendolini, M. (1992). The benchmarking book Michael J. Spendolini. , xiv, 207 ill.24 cm.
Tang, Y. H., & Ogunlana, S. O. (2003). Modelling the dynamic performance of aconstruction organization. Construction Management and Economics ,21 (February 2015), 127–136. doi: 10.1080/0144619032000079699
Veshosky, D. (1998). Managing Innovation Information in Engineering andConstruction Firms. Journal of Management in Engineering , 14 (February),58–66. doi: 10.1061/(ASCE)0742-597X(1998)14:1(58)

85
Viner, J. (1931). Cost Curves and Supply Curves. Zeitschrift fur Nationalokonomie(Journal of Economics), 3 (1), 23–46. doi: DOI: 10.1007/BF01316299
Vogl, B., & Abdel-wahab, M. (2015). Measuring the Construction Industry ’ sProductivity Performance : Critique of International ProductivityComparisons at Industry Level. , 04014085 (10), 1–10. doi:10.1061/(ASCE)CO.1943-7862.0000944.
Zadeh, L. A. (1965). Fuzzy Sets. Information and Control , 8 , 338–353. doi:10.1109/2.53
Zayed, T., Elwakil, E., & Ammar, M. (2012). A Framework for PerformanceAssessment of Organizations in the Construction Industry. InternationalJournal of Architecture, Engineering and Construction, 1 (4), 199–212.Retrieved fromhttp://www.iasdm.org/journals/index.php/ijaec/article/view/120doi: 10.7492/IJAEC.2012.022
Zayed, T. M., & Halpin, D. W. (2005). Pile Construction Productivity Assessment., 131 (June), 705–714.