
Improving Query Representations for Dense Retrieval with ...
Upload
truongliemCategory
view
213download
0
A Framework for Moving Sensor Data Queryand Retrieval of Dynamic Atmospheric Events
Shen-Shyang Ho1, Wenqing Tang1, W. Timothy Liu1, and Markus Schneider2
1 Jet Propulsion Laboratory, California Institute of Technology,Pasadena CA 91109, USA,
{sho, Wenqing.Tang, [email protected]},2 Department of Computer & Information Science & Engineering,
University of Florida, Gainesville, FL 32611, [email protected]
Abstract. One challenge in Earth science research is the accurate andefficient ad-hoc query and retrieval of Earth science satellite sensor databased on user-defined criteria to study and analyze atmospheric eventssuch as tropical cyclones. The problem can be formulated as a spatio-temporal join query to identify the spatio-temporal location where mov-ing sensor objects and dynamic atmospheric event objects intersect, ei-ther precisely or within a user-defined proximity. In this paper, we de-scribe an efficient query and retrieval framework to handle the problem ofidentifying the spatio-temporal intersecting positions for satellite sensordata retrieval. We demonstrate the effectiveness of our proposed frame-work using sensor measurements from QuikSCAT (wind field measure-ment) and TRMM (precipitation vertical profile measurements) satel-lites, and the trajectories of the tropical cyclones occurring in the NorthAtlantic Ocean in 2009.
Key words: data retrieval, satellite data, atmospheric events, spatio-temporal join
1 Introduction
The Earth Observing System Data and Information System (EOSDIS)3 is acomprehensive data and information system which archives, manages, and dis-tributes Earth science data from the EOS spacecrafts (a.k.a. satellite sensors)[1]. A challenge of EOSDIS is how to “help users find the data that they needand how to get it to them” [2]. The Warehouse Inventory Search Tool (WIST)4
This work was partially carried out at the Jet Propulsion Laboratory, CaliforniaInstitute of Technology and was funded by the National Aeronautics and SpaceAdminstration (NASA) Advanced Information Systems Technology (AIST) Programunder grant number AIST-08-0081.
3 http://esdis.eosdis.nasa.gov4 https://wist.echo.nasa.gov/~wist/api/imswelcome/
2
is the primary search and order tool for Earth Science data sets for EOSDIS. Itallows users to browse and retrieve satellite measurements based on user-definedspatial and temporal conditions. This type of data query and retrieval is knownin the Earth science community as data “subseting”. One important use of theretrieved satellite sensor data is the improvement of weather forecasting suchas the use of QuikSCAT wind measurements to accurately depict the initialconditions of air and sea states for tropical cyclone forecast model [3].
In the mid-nineties, there was an ambitious project to develop a “flexible,extensible, and seamless SCF [Scientific Computing Facilities] for scientific dataanalysis, knowledge discovery, visualization, and collaboration” called the OpenArchitecture Scientific Information System (OASIS) to support EOSDIS basedon the Common Object Request Broker Architecture (CORBA) [4]. The OASISwas not embraced by the scientific community which could have been the resultof serious technical, complexity, and security issues related to CORBA [5].
Currently, there is still a lack of capabilities that support flexible data re-trieval in the EOSDIS. One non-existent capability is the accurate and efficientad-hoc query and retrieval of Earth science satellite sensor data for dynamicatmospheric events such as tropical cyclones based on ad-hoc user-defined cri-teria and event trajectories. In this paper, we describe a fast data query andretrieval framework based on a spatio-temporal partitioning scheme driven bythe partitioning of the moving satellite trajectory so that the positions whichthe satellite trajectory and an atmospheric event trajectory intersect, either pre-cisely or within close proximity, are used for satellite data retrieval. We demon-strate the feasibility of our framework on the tropical cyclone event which is a“non-frontal synoptic scale low-pressure system over tropical or sub-tropical wa-ters with organized convection and definite cyclonic surface wind circulation”5.Experimental results are used to show the effectiveness of our proposed frame-work using sensor measurements from QuikSCAT (wind field measurement) andTRMM (precipitation vertical profile measurements) satellites, and the tropicalcyclones occurring in the North Atlantic Ocean in 2009.
From published scientific journal papers [6–10], one observes that such acapability is extremely important to scientists who retrieve specific sensor data ofspecific atmospheric events for statistical analysis. Some query examples derivedfrom these published scientific papers that require search, retrieval, and analysisof satellite data containing cyclone features, are listed below:
1. Retrieve TRMM precipitation data for tropical cyclones that attained tropi-cal storm intensity or higher over western North Pacific and the South ChinaSea between longitudes 100oE and 180o. 138 sensor datasets from 61 tropicalcyclones retrieved [6].
2. Retrieve TRMM precipitation data for tropical cyclones from December 1997to December 2003. 3703 sensor datasets from 563 tropical cyclones retrieved[7].
5 http://www.aoml.noaa.gov/hrd/tcfaq/A1.html
3
3. Retrieve QuikSCAT wind data for tropical cyclones in western North Pacificfrom September 1999 to December 2004 which formed west of 160oE andsouth of 26oN . Datasets containing 124 tropical cyclones retrieved [8].
Our problem is fundamentally different from previous research to discoverand track cyclones from either sea-level pressure fields [11] or from heterogeneoussatellite data [12]. For our problem, the cyclone tracks are known. Our maincontribution is an efficient framework that enables the retrieval of satellite databased on known cyclone tracks, an approach to fuse two databases with widelydifferent characteristics.
The paper is organized as follows. In Section 2, we briefly review previous re-search and systems developed for satellite data query and retrieval, in particular,for the tropical cyclone events. In Section 3, the satellite sensor data query andretrieval problem is defined. In Section 4, the satellite data and tropical cycloneevent trajectory data are briefly described. In Section 5, the satellite sensor tra-jectory data partitioning scheme and partition search algorithm are described indetail. In Section 6, the satellite data retrieval algorithm is described in detail.In Section 7, experimental results are presented to demonstrate the feasibility ofour proposed framework for both QuikSCAT and TRMM satellite sensor data.Some visualizations of the retrieved satellite data sets from a queried hurricanetrajectory are also shown.
2 Related Work
Existing state-of-the-art publicly available web-based tropical cyclone data andinformation portals6 7, data archives 8, and forecast services 9 provide excellentvisualizations and information of tropical cyclones and satellite sensor measure-ments.
However, comfortable data access (e.g., ad-hoc data retrieval for specificweather events) is not provided, and users only have limited, simple, and hard-coded query and request capabilities. Examples of such queries are:
1. Provide specific satellite data of a specified region at a specific date andtime. [EOSDIS]
2. Provide the static dataset for a specific tropical cyclone event. [PhysicalOceanography DAAC: Hurricane/Typhoon Tracker]
Users are not able to perform own queries to retrieve satellite data based onarbitrary trajectory information and retrieval parameters.
6 Navy/NRL Tropical Cyclone. http://www.nrlmry.navy.mil/tc_pages/tc_home.
html7 NASA GSFC Hurricane Portal. http://daac.gsfc.nasa.gov/hurricane/8 Physical Oceanography DAAC Hurricane/Typhoon Tracker. http://podaac.jpl.
nasa.gov/hurricanes/9 NOAA National Hurricane Center. http://www.nhc.noaa.gov/pastall.shtml
4
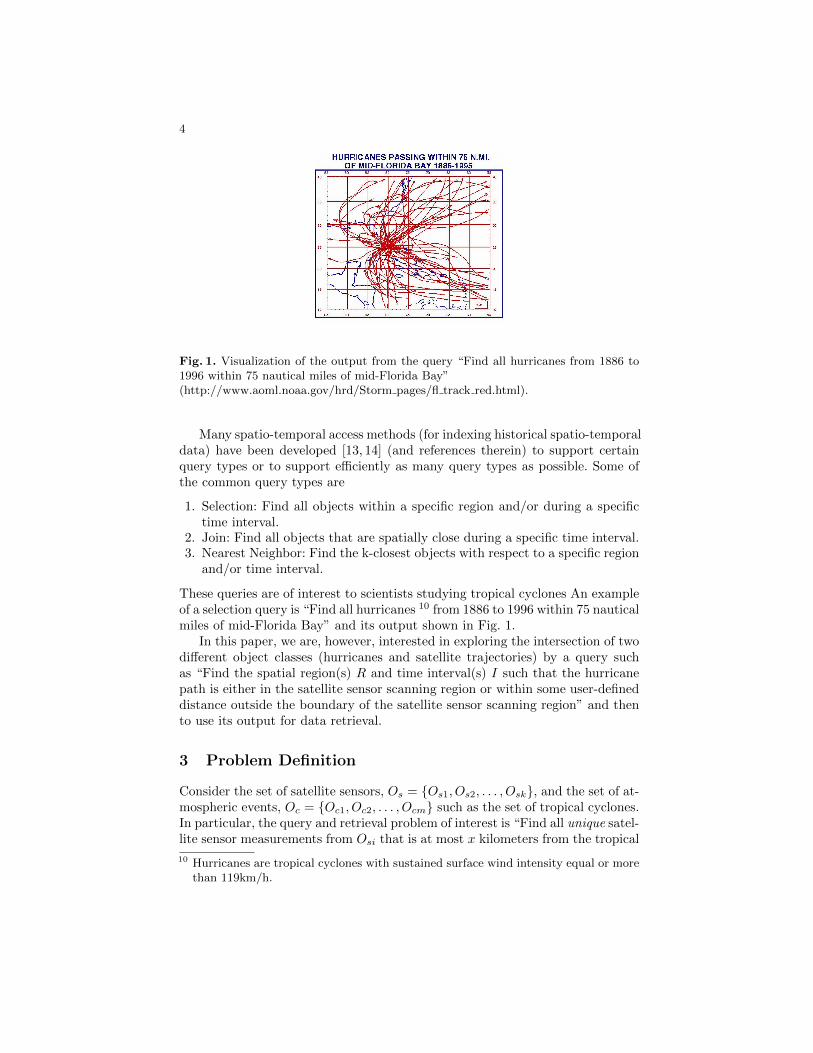
Fig. 1. Visualization of the output from the query “Find all hurricanes from 1886 to1996 within 75 nautical miles of mid-Florida Bay”(http://www.aoml.noaa.gov/hrd/Storm pages/fl track red.html).
Many spatio-temporal access methods (for indexing historical spatio-temporaldata) have been developed [13, 14] (and references therein) to support certainquery types or to support efficiently as many query types as possible. Some ofthe common query types are
1. Selection: Find all objects within a specific region and/or during a specifictime interval.
2. Join: Find all objects that are spatially close during a specific time interval.3. Nearest Neighbor: Find the k-closest objects with respect to a specific region
and/or time interval.
These queries are of interest to scientists studying tropical cyclones An exampleof a selection query is “Find all hurricanes 10 from 1886 to 1996 within 75 nauticalmiles of mid-Florida Bay” and its output shown in Fig. 1.
In this paper, we are, however, interested in exploring the intersection of twodifferent object classes (hurricanes and satellite trajectories) by a query suchas “Find the spatial region(s) R and time interval(s) I such that the hurricanepath is either in the satellite sensor scanning region or within some user-defineddistance outside the boundary of the satellite sensor scanning region” and thento use its output for data retrieval.
3 Problem Definition
Consider the set of satellite sensors, Os = {Os1, Os2, . . . , Osk}, and the set of at-mospheric events, Oc = {Oc1, Oc2, . . . , Ocm} such as the set of tropical cyclones.In particular, the query and retrieval problem of interest is “Find all unique satel-lite sensor measurements from Osi that is at most x kilometers from the tropical
10 Hurricanes are tropical cyclones with sustained surface wind intensity equal or morethan 119km/h.

5
Characteristics Os Oc
Temporal long shortLength (several years) (unlikely to be several months)
Temporal fine grain course grainResolution (order of 10−1 seconds) (several hours)
Motion high lowSpeed (a full orbit is about 100 minutes)
Representation line segments points(can be extended to a region)
Spatial continuous motion unlikely to be stationary,Position (orbiting; not geostationary satellites) but possible
Data Updates/ No delete; No delete;Modifications most current historical, most current
Table 1. Differences in the characteristics between the satellite sensor objects and thetropical cyclone objects
cyclone path P of Ocj and in the time interval I.” It can be generalized to “Findall unique satellite sensor measurements from satellite Os1, . . . , Osk that are atmost x kilometers from the tropical cyclone paths p1, . . . , pm in region R at timeinterval I.” This is closely related to the spatio-temporal join which retrieves allpairs of objects < o1, o2 > with o1 ∈ Os and o2 ∈ Oc, |o1(tq) − o2(tq)| ≤ dwhere tq is a time-stamp and d is an upper-bound threshold. Our problem goesfurther by querying for the positions and time instances where and when the joincondition is satisfied. This condition is likely to be satisfied at multiple positionsand time instances. An orbiting satellite sensor trajectory consists of many yearsof continuous spatio-temporal information. Hence, one needs to construct an ef-ficient partitioning scheme to handle the lengthy data sequence. We constructthe partitions by treating time as another dimension for a satellite sensor ob-ject. The tropical cyclone objects are stored in an index structure since thereare some fundamental differences between the two object types. The differencesin the characteristics between the two object types are shown in Table 1. Forselection and nearest neighbor queries for objects in Oc, one can use an indexstructure such as TB-tree [15] or SEB-tree [16].
Let S be the spatial bound (latitude[min, max], longitude[min, max]) and Tbe the temporal bound time(start, end). Queries that return sensor objects andtheir intersecting spatio-temporal information such as
Oq = {osi ∈ Os|Os ∩ST Os 6= ∅ within spatial bound S and temporal bound T}TS = {(t, s)|t ∈ T, s ∈ S and Os ∩ST Os 6= ∅ within spatial bound S and
temporal bound T}

6
Field matrix size Unit Minimum Maximum
wvc lat [nrow, ncol] degree -90.00 90.00wvc lon [nrow, ncol] degree E 0.00 359.99selected speed [nrow, ncol] meter per second 0.00 50.00selected direction [nrow, ncol] degree from North 0.00 359.99wvc row time [nrow] Coordinated 1993-001 2009-365
Universal Time (UTC) T00:00.000 T23:59:59.999
Table 2. Relevant QuikSCAT data fields. nrow: number of rows; ncol: number ofcolumns.
Field Structure Size
Scan Time Table 9 bytes× nscanGeo-location Array 2× npixel × nscan
Table 3. Relevant TRMM spatio-temporal data field. nscan: number of rows in thedata matrix; npixel: number of column in the data matrix.
are not the focus of this paper as the intersections (∩ST11) of satellite sensor
trajectories alone are not useful information for atmospheric, ocean, and weatherevent research. One is interested in
Oq = {osi ∈ Os|Oc ∩ST Os 6= ∅ within spatial bound S and temporal bound T}TS = {(t, s)|t ∈ T, s ∈ S and Oc ∩ST Os 6= ∅ within spatial bound S and (1)
temporal bound T}
The first one is a “Which” query such as a selection or nearest neighbor query.The latter one is a query which determines the positions and time instanceswhere and when the trajectories of the objects in the two sets intersect, eitherprecisely or within a certain proximity. In this paper, we focus on the latterquery which can be derived from the first one and its outputs are applicable toour satellite data retrieval problem.
4 Data Description
In this paper, we use the Level 2B QuikSCAT wind field swath data and theLevel 2A12 TRMM precipitation swath data stored in hierarchical data format(HDF)12 to demonstrate the feasibility and efficiency of the partitioning schemeand the data retrieval framework. In Section 4.1, we give a brief descriptionof the satellite data. In Section 4.2, we give a brief description of the tropicalcyclone trajectories.
11 ∩ST denotes the operation that returns the set of elements from the bigger set(usually Oc, if the two sets are different) when the trajectories of objects in Oc andOs intersect. The simplest case is when |Oc| = |Os| = 1.
12 http://www.hdfgroup.org/
7
Name Format Description
Year 2-byte integer 4-digit yearMonth 1-byte integer The month of the YearDay of Month 1-byte integer The day of the MonthHour 1-byte integer The hour (UTC) of the DayMinute 1-byte integer The minute of the HourSecond 1-byte integer The second of the minuteDay of Year 2-byte integer The day of the Year
Table 4. Scan Time
Name Minimum Maximum
Latitude -90.00 90.00Longitude -179.99 180.00
Table 5. Geo-location. Off-Earth is represented by -9999.9
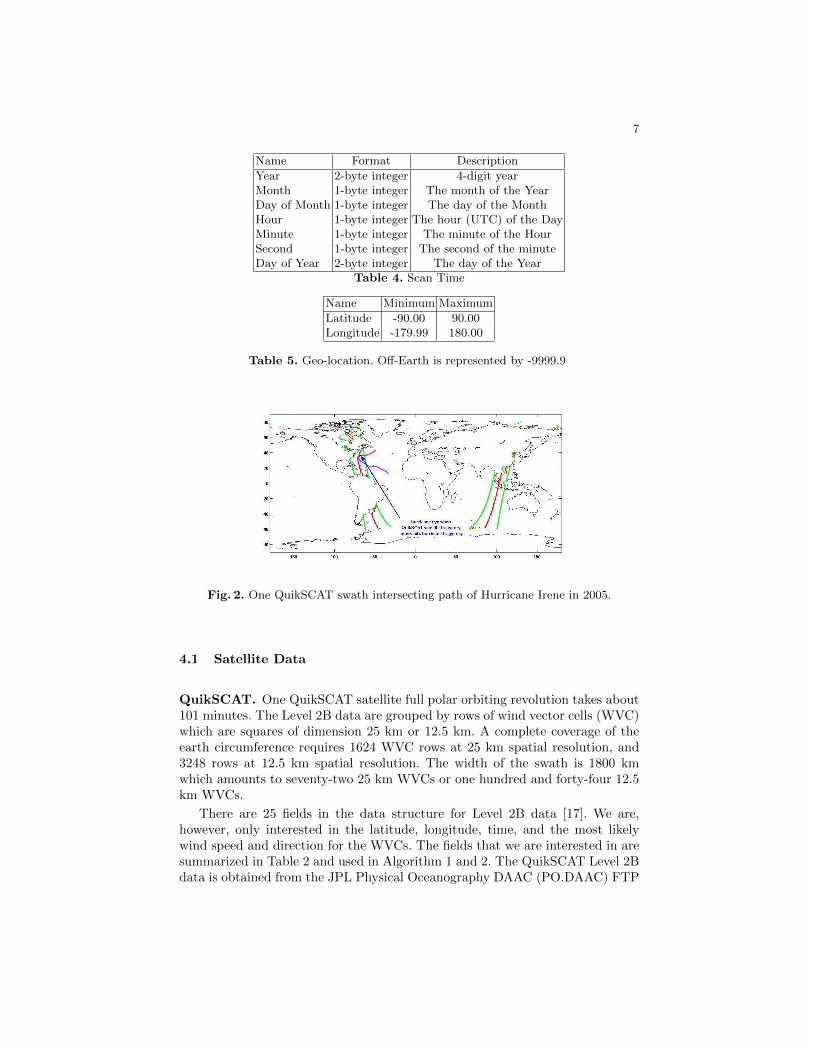
Fig. 2. One QuikSCAT swath intersecting path of Hurricane Irene in 2005.
4.1 Satellite Data
QuikSCAT. One QuikSCAT satellite full polar orbiting revolution takes about101 minutes. The Level 2B data are grouped by rows of wind vector cells (WVC)which are squares of dimension 25 km or 12.5 km. A complete coverage of theearth circumference requires 1624 WVC rows at 25 km spatial resolution, and3248 rows at 12.5 km spatial resolution. The width of the swath is 1800 kmwhich amounts to seventy-two 25 km WVCs or one hundred and forty-four 12.5km WVCs.
There are 25 fields in the data structure for Level 2B data [17]. We are,however, only interested in the latitude, longitude, time, and the most likelywind speed and direction for the WVCs. The fields that we are interested in aresummarized in Table 2 and used in Algorithm 1 and 2. The QuikSCAT Level 2Bdata is obtained from the JPL Physical Oceanography DAAC (PO.DAAC) FTP
8
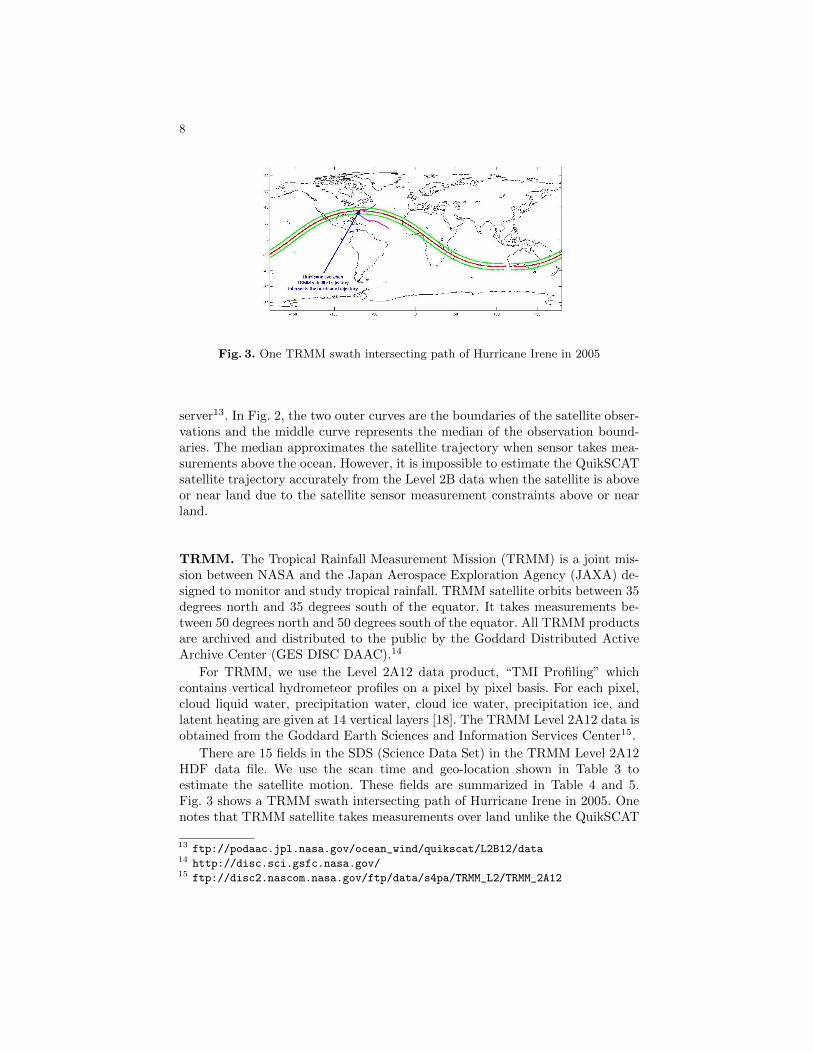
Fig. 3. One TRMM swath intersecting path of Hurricane Irene in 2005
server13. In Fig. 2, the two outer curves are the boundaries of the satellite obser-vations and the middle curve represents the median of the observation bound-aries. The median approximates the satellite trajectory when sensor takes mea-surements above the ocean. However, it is impossible to estimate the QuikSCATsatellite trajectory accurately from the Level 2B data when the satellite is aboveor near land due to the satellite sensor measurement constraints above or nearland.
TRMM. The Tropical Rainfall Measurement Mission (TRMM) is a joint mis-sion between NASA and the Japan Aerospace Exploration Agency (JAXA) de-signed to monitor and study tropical rainfall. TRMM satellite orbits between 35degrees north and 35 degrees south of the equator. It takes measurements be-tween 50 degrees north and 50 degrees south of the equator. All TRMM productsare archived and distributed to the public by the Goddard Distributed ActiveArchive Center (GES DISC DAAC).14
For TRMM, we use the Level 2A12 data product, “TMI Profiling” whichcontains vertical hydrometeor profiles on a pixel by pixel basis. For each pixel,cloud liquid water, precipitation water, cloud ice water, precipitation ice, andlatent heating are given at 14 vertical layers [18]. The TRMM Level 2A12 data isobtained from the Goddard Earth Sciences and Information Services Center15.
There are 15 fields in the SDS (Science Data Set) in the TRMM Level 2A12HDF data file. We use the scan time and geo-location shown in Table 3 toestimate the satellite motion. These fields are summarized in Table 4 and 5.Fig. 3 shows a TRMM swath intersecting path of Hurricane Irene in 2005. Onenotes that TRMM satellite takes measurements over land unlike the QuikSCAT
13 ftp://podaac.jpl.nasa.gov/ocean_wind/quikscat/L2B12/data14 http://disc.sci.gsfc.nasa.gov/15 ftp://disc2.nascom.nasa.gov/ftp/data/s4pa/TRMM_L2/TRMM_2A12
9
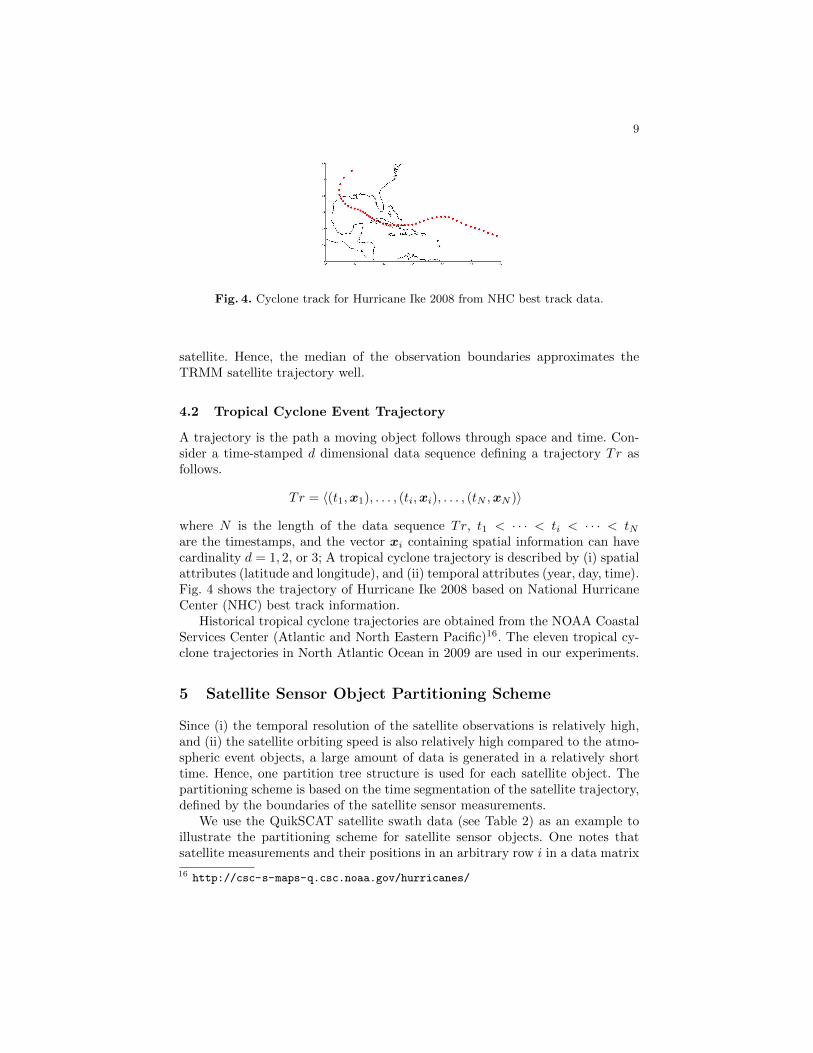
Fig. 4. Cyclone track for Hurricane Ike 2008 from NHC best track data.
satellite. Hence, the median of the observation boundaries approximates theTRMM satellite trajectory well.
4.2 Tropical Cyclone Event Trajectory
A trajectory is the path a moving object follows through space and time. Con-sider a time-stamped d dimensional data sequence defining a trajectory Tr asfollows.
Tr = 〈(t1,x1), . . . , (ti,xi), . . . , (tN ,xN )〉
where N is the length of the data sequence Tr, t1 < · · · < ti < · · · < tNare the timestamps, and the vector xi containing spatial information can havecardinality d = 1, 2, or 3; A tropical cyclone trajectory is described by (i) spatialattributes (latitude and longitude), and (ii) temporal attributes (year, day, time).Fig. 4 shows the trajectory of Hurricane Ike 2008 based on National HurricaneCenter (NHC) best track information.
Historical tropical cyclone trajectories are obtained from the NOAA CoastalServices Center (Atlantic and North Eastern Pacific)16. The eleven tropical cy-clone trajectories in North Atlantic Ocean in 2009 are used in our experiments.
5 Satellite Sensor Object Partitioning Scheme
Since (i) the temporal resolution of the satellite observations is relatively high,and (ii) the satellite orbiting speed is also relatively high compared to the atmo-spheric event objects, a large amount of data is generated in a relatively shorttime. Hence, one partition tree structure is used for each satellite object. Thepartitioning scheme is based on the time segmentation of the satellite trajectory,defined by the boundaries of the satellite sensor measurements.
We use the QuikSCAT satellite swath data (see Table 2) as an example toillustrate the partitioning scheme for satellite sensor objects. One notes thatsatellite measurements and their positions in an arbitrary row i in a data matrix
16 http://csc-s-maps-q.csc.noaa.gov/hurricanes/

10
Fig. 5. A segment of the QuikSCAT satellite data swath divided into partitions.
(e.g., selected speed[i, 1:ncol]) have a fix timestamp in QuikSCAT, TRMM, andother satellites. Hence, the satellite sensor object at a fix time instance t (e.g.,wvc row time[i]) can be represented by a spatial line segment or curve definedby the latitude and longitude values in row i in the position matrices (e.g.,wvc lat[i,1:ncol] and wvc lon[i,1:ncol]).
The QuikSCAT satellite data swath is divided into partitions such that eachpartition is a spatial region within a time interval defined by a fixed n number ofconsecutive wvc row time elements (see Fig. 5). These partitions form the leavenodes in the partition tree. Each partition time interval varies slightly due to thenon-uniform measurement sampling. Each leave node (partition) contains (i) thetemporal information consisting of the start of the time interval wvc row time[i]= ts, and the end of the time interval wvc row time[i + n − 1] = te, and (ii)the spatial information for a swath data partition defined by the first and lastnon-zero elements in wvc lat[i,1:ncol] and wvc lon[i,1:ncol] at ts, and wvc lat[i+n − 1,1:ncol] and wvc lon[i + n − 1,1:ncol] at te. In other words, a leave nodepartition is a quadrilateral region defined by the four corners of the data swathpartition approximating the data swath partition. One notes that as n increases,some measurements in a data swath partition nearer to one of the swath databoundaries fall outside the leave node partition. If n is too high, one may fail toidentify the data swath partitions that intersect a tropical cyclone trajectory.
The partition tree structure for a satellite sensor object is shown in Fig.6. Revolution numbers (Rev. No) are unique incremental numbers tagging theorbits. p ids are unique numbers tagging the partitions shown in Fig. 5. For theQuikSCAT satellite object, there are either 365 or 366 Julian days each year,14 unique revolution numbers per day, and each swath defined by a revolutionnumber is divided into segments containing n consecutive time instances. Forthe TRMM satellite object, the only difference is that there is either 15 or 16unique revolution numbers per day.
Algorithm 1 is used to search the partition tree structure (for QuikSCATswath data) for partitions that intersect a path defined by two consecutive tra-jectory points and the user-defined radius R in degree. In Lines 2 to 3, spatio-

11
Root Node: [Year, Y]
|
Non-Leave Nodes: [Year, Y; Julian Day, D]
|
Non-Leave Nodes: [Year, Y; Julian Day, D; Rev. Number, Rn]
|
Non-Leave Nodes: [Rev. No., Rn; time: s_time, e_time]
|
Leave Nodes: [p_id; Rev. No., Rn; Partition, P; time: Ps_time, Pe_time]
Fig. 6. Partition tree scheme for the moving satellite trajectory.
temporal points between the two consecutive trajectory points and their cor-responding circumference points are computed. For each interpolated spatio-temporal point, the partition tree structure is searched to locate the Revolutionnumber Rn which the spatio-temporal point may be in (Line 5). When a Rn islocated, the partitions which may contain the interpolated point will be searched(Lines 8 to 14). If the interpolated point and its circumference points are foundin a partition, I and TS are updated (Lines 10 to 13). I contains informationrelated to the start time instances and the end time instances of the spatio-temporal partitions that the interpolated points and their circumference pointsintersect. The goal of Line 20 is to locate the earliest start time and the latestend time from I and also the start row number RIs and the end row number RIein the swath Rn. TS is the set defined in (1). Algorithm 1 can be generalized toother satellite sensor data.
6 Retrieval Algorithm
Next, we describe the algorithm that retrieves all satellite measurements withina specified radius R from TS defined in (1). In practice, we want a unique set ofretrieved satellite sensor measurements, M = {M1, . . . ,Ms} from the satellitesensor data set S such that
Mi
⋂Mj = ∅, i 6= j,∀i, j ∈ {1, . . . , s} (2)
with each Mi defined by Mi = {m|m ∈ S, |m− tpi| < R} and represented by aunique tpi ∈ TS and a user-defined radius R. However, one is likely to matchmore than one (interpolated) trajectory point tpi ∈ TS to a specific satellitemeasurement partition. This may result in Mi
⋂Mj 6= ∅ with Mi corresponding
to tpi and Mj corresponding to tpj , tpi 6= tpj , and i 6= j. One needs to identifythe best time interpolated trajectory position x̂ that corresponds to the satel-lite measurement set Mx̂ such that (2) is satisfied. We compute the best timeinterpolated trajectory position x̂ as follows.
x̂ = argminx∈X
{s̄− x} for s̄ ∈ T (3)

12
Input: Two consecutive trajectory points, (ts,xs) and (te,xe); Radius, R (indegree)
Output: RIs, RIe, Rn, TS1: TS := {}; I := {} ;2: Generate a set of interpolated points, P = {p1, . . . , pk}, using (ts,xs) and
(te,xe);3: Generate a set of circumference points, Ci for each pi ∈ P based on R;4: for interpolated point pi = (ti,xi) do5: Identity Rn and leave-node partitions within
time interval T =[s time, e time] in the partition tree based on ti;6: if Rn 6= ∅ then7: Ci := Ci
⋃{pi};
8: for partition, Qj in T of Rn do9: Ii := {Qj |Qj
⋂Ci 6= ∅};
10: if Ii 6= ∅ then11: I := I
⋃Ii ;
12: TS := TS⋃{pi} ;
13: end if14: end for15: end if16: end for17: if I = ∅ then18: RIs := RIe := Rn := ∅;19: end if20: Use I to identify the start row number, RIs and end row number, RIe
for wvc lat, wvc lon, and wvc row time in Rn.
Algorithm 1: Partition tree search to locate the tropical cyclone event insatellite swath data.
Input: Rn, RIs, RIe, R (in degree), TS.Output: Point Sets: PSws, PSwd
1: Retrieve QuikSCAT HDF Data with Rev. No., Rn;2: py := {wvc lat[i, 1 : ncol], i ∈ [RIs, RIe]};3: px := {wvc lon[i, 1 : ncol], i ∈ [RIs, RIe]};4: ws := {selected speed[i, 1 : ncol], i ∈ [RIs, RIe]};5: wd := {selected direction[i, 1 : ncol], i ∈ [RIs, RIe]};6: Compute x̂ using (3) OR Cyclone Eye Locator (see Algorithm 3);7: for p(j) := (py(j), px(j)) do8: dist(j) :=‖ p(j)− x̂ ‖2;9: end for
10: PSws := {ws(k) | dist(k) < R};11: PSwd := {wd(k) | dist(k) < R};
Algorithm 2: Retrieval algorithm for wind direction and speed measure-ments.
where
T =
{s | s =
xe − xs
te − ts(t− ts) + xs for t ∈ [ts, te]
},
X = {x = (x1, x2) | x1 = wvc lat[i, j], x2 = wvc lon[i, j], (4)
∀(i, j), j = 1, · · · , ncol and wvc row time(i) ∈ [ts, te]},

13
Input: QuikSCAT L2B Data with rev. no, Rn; (ts,xs) and (te,xe).Output: S, Cyclone Eye1: Subset the L2B data based on (ts,xs) and (te,xe);2: Grid the L2B subseted data;3: for Pixel i from the gridded L2B subseted data do4: Compute the normal vector n̂i to the direction vector d̂i;5: Calculate which 8-neighbors n̂i is pointing;6: Update the neighbor count Nk of the pixel k n̂i is pointing;7: Update lk, list of neighbor pixels, pointing at k ;8: end for9: MaxNeighbor := max1≤k≤m Nk;
10: V C := {i | Ni ≥MaxNeighbor − 1};11: for j ∈ V C do12: root := j;13: Count[j] := SizeOfSpanningTree(root, lroot);14: end for15: S := arg maxj∈V C Count[j];
Algorithm 3: Cyclone eye locator.
such that (ts,xs) and (te,xe) are two consecutive (interpolated) trajectory pointsand Ms
⋂Me 6= ∅.
Algorithm 2 retrieves wind direction and speed measurement sets from theQuikSCAT HDF data files based on user-defined radius and outputs from Al-gorithm 1. Assuming that Rn is a single revolution number, a single HDF datafile is retrieved (Line 1). To improve the accuracy of a tropical cyclone eye posi-tion x̂ and data retrieval, a cyclone eye locator algorithm (see Algorithm 3 [19])based on the vortex feature of a tropical cyclone can be used instead of com-puting x̂ using (3) (Line 6). Then, the distances between all the spatial pointsin the partition located using outputs from Algorithm 1 and x̂ are computed(Line 7-9). The point sets containing wind speed and direction measurementswithin the user-defined radius, R, are created (Lines 10 to 11). Algorithm 2 canbe generalized to data retrieval for any satellite HDF file.
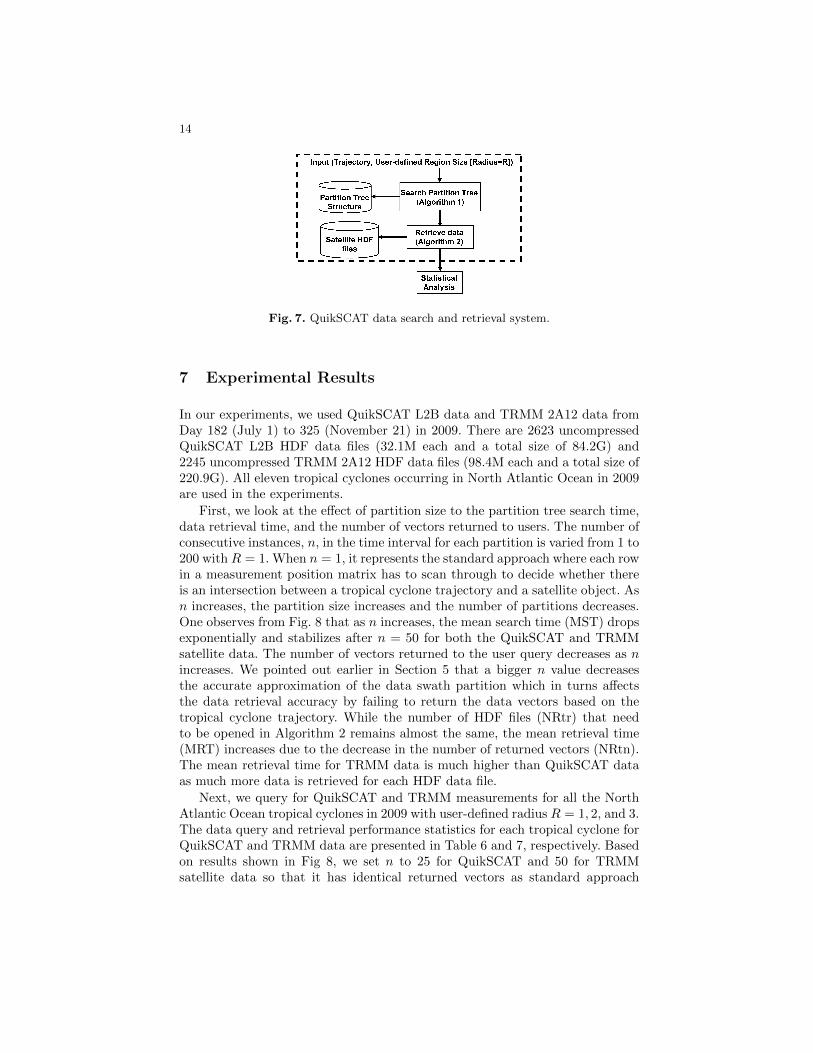
A simple query and retrieval system for QuikSCAT L2B swath data is shownin Fig. 7. The user inputs consist of arbitrary trajectory information and theretrieval parameter R. First, Algorithm 1 searches the partition tree structure.The retrieval parameter R and the outputs from Algorithm 1 are then used byAlgorithm 2 to retrieve the satellite data for analysis.
One notes that using Algorithm 3 increases the computation cost of Algo-rithm 2. Algorithm 3 works as follows. First, the satellite data is gridded (Line2). Then, one computes the normal vector to the wind direction at each griddedpixel and compute the number of pixels pointing to each gridded pixels (Lines 3to 8). The most likely cyclone eye position is the one which creates the largestspanning tree from among the pixels (Lines 11 to 14) with the largest numberof pixels pointing to them (Line 15). For TRMM measurements, one can use thecharacteristics discussed in [6] to improve the cyclone eye positions.
14
Fig. 7. QuikSCAT data search and retrieval system.
7 Experimental Results
In our experiments, we used QuikSCAT L2B data and TRMM 2A12 data fromDay 182 (July 1) to 325 (November 21) in 2009. There are 2623 uncompressedQuikSCAT L2B HDF data files (32.1M each and a total size of 84.2G) and2245 uncompressed TRMM 2A12 HDF data files (98.4M each and a total size of220.9G). All eleven tropical cyclones occurring in North Atlantic Ocean in 2009are used in the experiments.
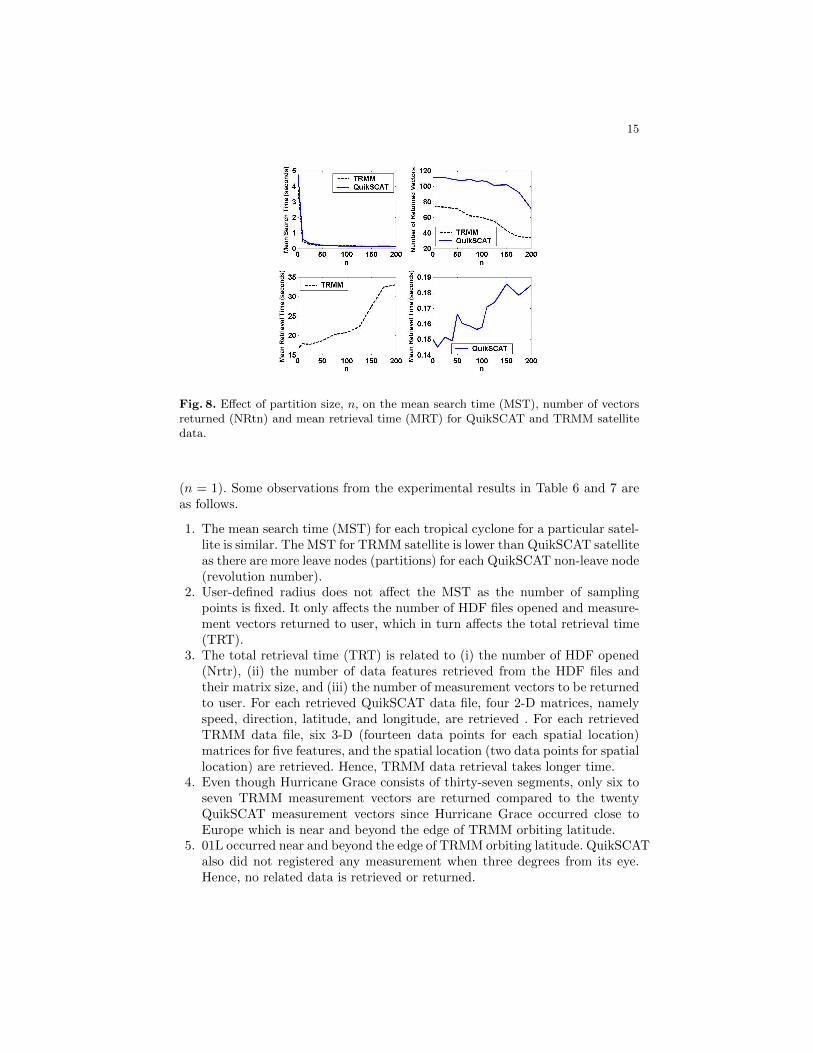
First, we look at the effect of partition size to the partition tree search time,data retrieval time, and the number of vectors returned to users. The number ofconsecutive instances, n, in the time interval for each partition is varied from 1 to200 with R = 1. When n = 1, it represents the standard approach where each rowin a measurement position matrix has to scan through to decide whether thereis an intersection between a tropical cyclone trajectory and a satellite object. Asn increases, the partition size increases and the number of partitions decreases.One observes from Fig. 8 that as n increases, the mean search time (MST) dropsexponentially and stabilizes after n = 50 for both the QuikSCAT and TRMMsatellite data. The number of vectors returned to the user query decreases as nincreases. We pointed out earlier in Section 5 that a bigger n value decreasesthe accurate approximation of the data swath partition which in turns affectsthe data retrieval accuracy by failing to return the data vectors based on thetropical cyclone trajectory. While the number of HDF files (NRtr) that needto be opened in Algorithm 2 remains almost the same, the mean retrieval time(MRT) increases due to the decrease in the number of returned vectors (NRtn).The mean retrieval time for TRMM data is much higher than QuikSCAT dataas much more data is retrieved for each HDF data file.
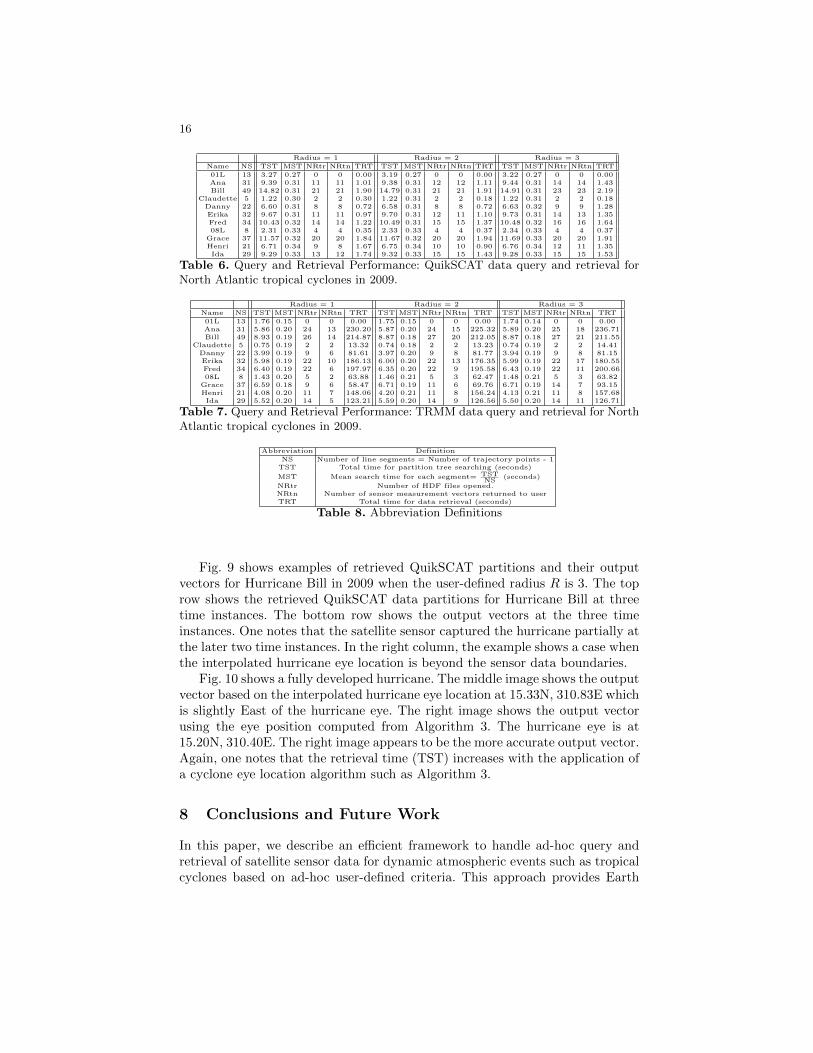
Next, we query for QuikSCAT and TRMM measurements for all the NorthAtlantic Ocean tropical cyclones in 2009 with user-defined radius R = 1, 2, and 3.The data query and retrieval performance statistics for each tropical cyclone forQuikSCAT and TRMM data are presented in Table 6 and 7, respectively. Basedon results shown in Fig 8, we set n to 25 for QuikSCAT and 50 for TRMMsatellite data so that it has identical returned vectors as standard approach
15
Fig. 8. Effect of partition size, n, on the mean search time (MST), number of vectorsreturned (NRtn) and mean retrieval time (MRT) for QuikSCAT and TRMM satellitedata.
(n = 1). Some observations from the experimental results in Table 6 and 7 areas follows.
1. The mean search time (MST) for each tropical cyclone for a particular satel-lite is similar. The MST for TRMM satellite is lower than QuikSCAT satelliteas there are more leave nodes (partitions) for each QuikSCAT non-leave node(revolution number).
2. User-defined radius does not affect the MST as the number of samplingpoints is fixed. It only affects the number of HDF files opened and measure-ment vectors returned to user, which in turn affects the total retrieval time(TRT).
3. The total retrieval time (TRT) is related to (i) the number of HDF opened(Nrtr), (ii) the number of data features retrieved from the HDF files andtheir matrix size, and (iii) the number of measurement vectors to be returnedto user. For each retrieved QuikSCAT data file, four 2-D matrices, namelyspeed, direction, latitude, and longitude, are retrieved . For each retrievedTRMM data file, six 3-D (fourteen data points for each spatial location)matrices for five features, and the spatial location (two data points for spatiallocation) are retrieved. Hence, TRMM data retrieval takes longer time.
4. Even though Hurricane Grace consists of thirty-seven segments, only six toseven TRMM measurement vectors are returned compared to the twentyQuikSCAT measurement vectors since Hurricane Grace occurred close toEurope which is near and beyond the edge of TRMM orbiting latitude.
5. 01L occurred near and beyond the edge of TRMM orbiting latitude. QuikSCATalso did not registered any measurement when three degrees from its eye.Hence, no related data is retrieved or returned.
16
Radius = 1 Radius = 2 Radius = 3
Name NS TST MST NRtr NRtn TRT TST MST NRtr NRtn TRT TST MST NRtr NRtn TRT
01L 13 3.27 0.27 0 0 0.00 3.19 0.27 0 0 0.00 3.22 0.27 0 0 0.00Ana 31 9.39 0.31 11 11 1.01 9.38 0.31 12 12 1.11 9.44 0.31 14 14 1.43Bill 49 14.82 0.31 21 21 1.90 14.79 0.31 21 21 1.91 14.91 0.31 23 23 2.19
Claudette 5 1.22 0.30 2 2 0.30 1.22 0.31 2 2 0.18 1.22 0.31 2 2 0.18Danny 22 6.60 0.31 8 8 0.72 6.58 0.31 8 8 0.72 6.63 0.32 9 9 1.28Erika 32 9.67 0.31 11 11 0.97 9.70 0.31 12 11 1.10 9.73 0.31 14 13 1.35Fred 34 10.43 0.32 14 14 1.22 10.49 0.31 15 15 1.37 10.48 0.32 16 16 1.6408L 8 2.31 0.33 4 4 0.35 2.33 0.33 4 4 0.37 2.34 0.33 4 4 0.37
Grace 37 11.57 0.32 20 20 1.84 11.67 0.32 20 20 1.94 11.69 0.33 20 20 1.91Henri 21 6.71 0.34 9 8 1.67 6.75 0.34 10 10 0.90 6.76 0.34 12 11 1.35Ida 29 9.29 0.33 13 12 1.74 9.32 0.33 15 15 1.43 9.28 0.33 15 15 1.53
Table 6. Query and Retrieval Performance: QuikSCAT data query and retrieval forNorth Atlantic tropical cyclones in 2009.
Radius = 1 Radius = 2 Radius = 3
Name NS TST MST NRtr NRtn TRT TST MST NRtr NRtn TRT TST MST NRtr NRtn TRT
01L 13 1.76 0.15 0 0 0.00 1.75 0.15 0 0 0.00 1.74 0.14 0 0 0.00Ana 31 5.86 0.20 24 13 230.20 5.87 0.20 24 15 225.32 5.89 0.20 25 18 236.71Bill 49 8.93 0.19 26 14 214.87 8.87 0.18 27 20 212.05 8.87 0.18 27 21 211.55
Claudette 5 0.75 0.19 2 2 13.32 0.74 0.18 2 2 13.23 0.74 0.19 2 2 14.41Danny 22 3.99 0.19 9 6 81.61 3.97 0.20 9 8 81.77 3.94 0.19 9 8 81.15Erika 32 5.98 0.19 22 10 186.13 6.00 0.20 22 13 176.35 5.99 0.19 22 17 180.55Fred 34 6.40 0.19 22 6 197.97 6.35 0.20 22 9 195.58 6.43 0.19 22 11 200.6608L 8 1.43 0.20 5 2 63.88 1.46 0.21 5 3 62.47 1.48 0.21 5 3 63.82
Grace 37 6.59 0.18 9 6 58.47 6.71 0.19 11 6 69.76 6.71 0.19 14 7 93.15Henri 21 4.08 0.20 11 7 148.06 4.20 0.21 11 8 156.24 4.13 0.21 11 8 157.68Ida 29 5.52 0.20 14 5 123.21 5.59 0.20 14 9 126.56 5.50 0.20 14 11 126.71
Table 7. Query and Retrieval Performance: TRMM data query and retrieval for NorthAtlantic tropical cyclones in 2009.
Abbreviation Definition
NS Number of line segments = Number of trajectory points - 1TST Total time for partition tree searching (seconds)
MST Mean search time for each segment= TSTNS
(seconds)
NRtr Number of HDF files opened.NRtn Number of sensor measurement vectors returned to userTRT Total time for data retrieval (seconds)
Table 8. Abbreviation Definitions
Fig. 9 shows examples of retrieved QuikSCAT partitions and their outputvectors for Hurricane Bill in 2009 when the user-defined radius R is 3. The toprow shows the retrieved QuikSCAT data partitions for Hurricane Bill at threetime instances. The bottom row shows the output vectors at the three timeinstances. One notes that the satellite sensor captured the hurricane partially atthe later two time instances. In the right column, the example shows a case whenthe interpolated hurricane eye location is beyond the sensor data boundaries.
Fig. 10 shows a fully developed hurricane. The middle image shows the outputvector based on the interpolated hurricane eye location at 15.33N, 310.83E whichis slightly East of the hurricane eye. The right image shows the output vectorusing the eye position computed from Algorithm 3. The hurricane eye is at15.20N, 310.40E. The right image appears to be the more accurate output vector.Again, one notes that the retrieval time (TST) increases with the application ofa cyclone eye location algorithm such as Algorithm 3.
8 Conclusions and Future Work
In this paper, we describe an efficient framework to handle ad-hoc query andretrieval of satellite sensor data for dynamic atmospheric events such as tropicalcyclones based on ad-hoc user-defined criteria. This approach provides Earth

17
Fig. 9. QuikSCAT examples of retrieved partition and output vector when R = 3 forHurricane Bill in 2009.
Fig. 10. A fully developed Hurricane Bill from QuikSCAT measurements. Left: Re-trieved Partition; Middle: Output vector with R = 3 using interpolated eye location;Right: Output vector with R = 3 using Algorithm 3.
science researchers the capability to retrieve and manipulate satellite data tostudy dynamic atmospheric events. Future work include (i) integrating the cur-rent framework into a moving objects database for both satellite sensor objectsand dynamic atmospheric (also earth and ocean) event objects, and (ii) the de-sign and implementation of a spatio-temporal query language that enables usersto pose ad-hoc satellite data retrieval queries (see query examples in Section 1).One also foresees the possibility of integrating our query and retrieval frameworkinto a scientific workflow system to support flexible scientific analysis.
References
1. Esfandiari, M., Ramapriyan, H., Behnke, J, and Sofinowski, E.: Earth observingsystem (EOS) data and information system (EOSDIS) - evolution update and future.IEEE Inter. Geoscience and Remote Sensing Symposium, pp. 4005–4008 (2007)
2. Behnkre, J., Watts, T. .H., Kobler, B., Lowe, D., Fox, S., and Meyer, R.: EOSDISpetabyte archives: tenth anniversary. Proc. 22nd IEEE/13th NASA Goddard Confer-ence on Mass Storage Systems and Technologies (MSST’ 05), pp. 81–93 (2005)
18
3. Yueh, S. H., Stiles, B. W., and Liu, W. T.: QuikSCAT Wind Retrievals for TropicalCyclones, IEEE Transactions on Geoscience and Remote Sensing. Vol. 41, No. 11,pp. 2616-2628 (2003)
4. Mesrobian, E., Muntz, R., Shek, E. C., Nittel, S., Rouche, M., Kriguer, M., andFabbrocino, F.: OASIS: An EOSDIS science computing facility. Proc. SPIE, vol.2820, pp. 284–298 (1996)
5. Henning, M.: The Rise and Fall of CORBA. ACM Queue, vol. 4, no. 5, pp. 28–34(2006)
6. Kodama, Y. M. and Yamada, T.: Detectability and Configuration of Tropical Cy-clone Eyes over the Western North Pacific in TRMM PR and IR Observations.Monthly Atmospheric Review, vol. 133, pp. 2213–2226 (2005)
7. Yokoyama, C. and Takayabu, Y. N.: A Statistical Study on Rain Characteristics ofTropical Cyclones using TRMM Satellite Data. Monthly Atmospheric Review, vol.136, pp. 3848–3862 (2008)
8. Lee C. S., Cheung, K. W., Hui, S. N., and Elsberry, R. L.: Mesoscale FeaturesAssociated with Tropical Cyclone Formations in the Western North Pacific. MonthlyAtmospheric Review, vol. 136, pp. 2006–2022 (2008)
9. Rodgers, E. B. and Pierce, H. F.: A Satellite Observational Study of Precipita-tion Characteristics in Western North Pacific Tropical Cyclones. Journal of AppliedMeteorology, vol. 34, pp. 2587–2599 (1995)
10. McTaggart-Cowan, R., Deane, G. D., Bosart, L. F., Davis, C. A., and GalarneauT. J. Jr.: Climatology of Tropical Cyclogenesis in the North Atlantic (1948-2004).Monthly Weather Review, vol. 136, pp. 1284–1304 (2008)
11. Shek E. C., Muntz, R., Mesrobian, E.: Extensible Parallel Query Processing forExploratory Geoscientific Data Mining. Data Min. Knowl. Discov., vol. 5, no. 4, pp.277-304 (2001)
12. Ho, S.-S. and Talukder, A.: Automated Cyclone Discovery and Tracking usingKnowledge Sharing in Multiple Heterogeneous Satellite Data. Proc. 14th ACMSIGKDD Int. Conf. on Knowledge Discovery and Data Mining, pp. 928–936 (2008)
13. Guting, R. H. and Schneider, M.: Moving Objects Databases. Morgan Kaufmann(2005)
14. Mokbel, M. F., Ghanem, T. M., and Aref, W. G.: Spatio-Temporal Access Methods.Bullentin of the IEEE Computer Society Technical Committee on Data Engineering,Vol. 26, No. 2, pp. 40–49 (2003)
15. Pfoser, D., Jensen, C. S., and Theodoridis, Y.: Novel Approaches to the Indexingof Moving Object Trajectories. Proc. 26th Int. Conf. on Very Large Databases, pp.395–403 (2000)
16. Song, Z. and Roussopoulos, N.: SEB-tree: An Approach to Index ContinuouslyMoving Objects. Proc. 4th Int. Conf. on Mobile Data Management, pp. 340–344(2003)
17. Lungu, T. and et. al.: QuikSCAT Science Data Product User’s Manual, Version3.0, D-18053-Rev A (2006)
18. Tropical Rainfall Measuring Mission Science Data and Information System, Vol.4: File Specifications for TRMM Products - Level 2 and Level 3, Release 6.09 (2007)
19. Ho, S.-S. and Talukder, A.: Utilizing Spatio-Temporal Text Information for CycloneEye Annotation in Satellite Data. Proc. IJCAI Workshop on Cross-media Informa-tion Access and Mining, pp. 25–32 (2009)