A Framework for Building a Smart Port and Smart Port IndexA Framework for Building a Smart Port and...
40
A Framework for Building a Smart Port and Smart Port Index Anahita Molavi *1 , Gino J. Lim † 1 , Bruce Race ‡ 2 1 Department of Industrial Engineering, University of Houston 2 College of Architecture and Design, University of Houston Abstract Ports and harbors are facing stiff competition for market share and delivering more effective and secure flow of goods worldwide. High performing ports are implementing smart technologies to better manage operations meeting new challenges in maintaining safe, secure, and energy efficient facilities that mitigate environmental impacts. In this context, a new concept has emerged which is called smart port. However, a unified definition of a smart port has not been well documented. This paper attempts to develop a framework for a smart port and a quantitative metric, Smart Port Index (SPI), that ports can use to improve their resiliency and sustainability. Our proposed SPI is based on Key Performance Indicators (KPIs) gathered from the literature. These KPIs are organized around four key activity domains of a smart port: operations, environment, energy, and safety & security. Case studies are conducted to show how one can use SPI and to assess the performance of some of the busiest ports in the world. Our methodology provides a quantitative tool for port authorities to develop their smart port strategies, assess their smartness, and identify strengths and weaknesses of their current operations for continuous improvement. Our study reveals that smart port initiatives around the world have different levels of comprehensiveness. The results of this study also suggest that government policies and region-specific variables can impact SPI value. Keywords: Smart Port Index, Maritime Transportation, Key Performance Indicators, Resilience, Sustainability 1 Introduction Ports are regional multimodal intersections of global supply chains. They function in the context of complex infrastructure, business transactions, and regulations. With the global economy demanding maritime transportation, ports have faced increasing pressure * [email protected] † [email protected] ‡ [email protected] 1
Transcript of A Framework for Building a Smart Port and Smart Port IndexA Framework for Building a Smart Port and...
A Framework for Building a Smart Portand Smart Port Index
Anahita Molavi ∗1, Gino J. Lim †1, Bruce Race ‡2
1Department of Industrial Engineering, University of Houston2College of Architecture and Design, University of Houston
Abstract
Ports and harbors are facing stiff competition for market share and delivering moreeffective and secure flow of goods worldwide. High performing ports are implementingsmart technologies to better manage operations meeting new challenges in maintainingsafe, secure, and energy efficient facilities that mitigate environmental impacts. Inthis context, a new concept has emerged which is called smart port. However, a unifieddefinition of a smart port has not been well documented. This paper attempts to developa framework for a smart port and a quantitative metric, Smart Port Index (SPI), thatports can use to improve their resiliency and sustainability. Our proposed SPI is basedon Key Performance Indicators (KPIs) gathered from the literature. These KPIs areorganized around four key activity domains of a smart port: operations, environment,energy, and safety & security. Case studies are conducted to show how one can useSPI and to assess the performance of some of the busiest ports in the world. Ourmethodology provides a quantitative tool for port authorities to develop their smartport strategies, assess their smartness, and identify strengths and weaknesses of theircurrent operations for continuous improvement. Our study reveals that smart portinitiatives around the world have different levels of comprehensiveness. The results ofthis study also suggest that government policies and region-specific variables can impactSPI value.
Keywords: Smart Port Index, Maritime Transportation, Key Performance Indicators,Resilience, Sustainability
1 Introduction
Ports are regional multimodal intersections of global supply chains. They function in
the context of complex infrastructure, business transactions, and regulations. With the
global economy demanding maritime transportation, ports have faced increasing pressure∗[email protected]†[email protected]‡[email protected]
1
to optimize their performance in terms of economic, environmental, energy and functional
challenges that impact their sustainability.
Key elements and associated issues include operations (e.g., congestion, delays, operating
errors, and lack of information sharing (Braveboy, 2015)), environment (e.g., air, water and
noise pollution, waste disposal, construction and expansion activities (Lam and Notteboom,
2014)), energy (e.g., increasing energy consumption, increasing energy costs, and energy dis-
ruption impacts on the port activities (Buiza et al., 2015; Abbasi et al., 2019)), safety (e.g.,
berthing impacts, vessel collisions, and striking while at berth (Pak et al., 2015; Cho et al.,
2018)), and security (e.g., armed robbery, cyber security issues, unlawful acts, stowaways,
drug smuggling, use of ports as conduit for moving weapons and terrorist attacks (Interna-
tional Maritime Organization, 2016b; Biobaku et al., 2016; Lim et al., 2018)). These issues
may persist if preventive and corrective actions are not planned and performed in a timely
manner. In response to the existing problems, ports are adopting technology-based solutions,
as well as new approaches to port operations planning and management. Implementation of
such solutions to mitigate recent problems is known to be switching to smart ports.
Our comprehensive literature review reveals two different perspectives of a smart port.
One perspective is that the smartness of a port relates more to the ideology rather than
technologies and physical infrastructures. In other words, policy decisions and the smart
use of resources are more important than the implementation of technologies. Another
view of smartness is related to the utilization of recent technologies in order to improve the
port performance or provide solutions for energy and environmental issues (PortTechnology,
2016).
Literature review reveals that current smart port initiatives around the world can be
categorized into two groups: multipurpose initiatives and targeted initiatives.
Smart Port Multipurpose Initiatives
This category includes those practices with comprehensive long-term plans and strate-
gies covering various aspects of port activities. These are primarily being conducted by large
2
ports or associations. As a first step, port authorities have detected and evaluated current
and possible future problems, and have identified solutions for eliminating or avoiding them.
One major common goal is to develop efficient operations and logistics through automation
and technology propagation or by modifying strategies and policies (MedMaritime SMART
PORT, 2016; Hamburg Port Authority, 2016b; Port of Rotterdam, 2016). Topics related to
environment and energy have formed other pillars of these initiatives such as implementing
renewable energy, reducing energy consumption, and improving operations to be environmen-
tally friendly (MedMaritime SMART PORT, 2016; Hamburg Port Authority, 2016a; Port
of Rotterdam, 2016). This category includes MedMaritime SMART-PORT (MedMaritime
SMART PORT, 2016), Port of Rotterdam Smart Port (Port of Rotterdam, 2016), Port of
Hamburg Smart Port (Hamburg Port Authority, 2016a,b), Erasmus Smart Port Rotterdam
(World Port Hackathon, 2016), and Port of Amsterdam Smart Port (Port of Amsterdam,
2017; Amsterdam Smart City, 2016).
Smart Port Targeted Initiatives
Smart port targeted initiatives seek to eliminate specific obstacles in ports. These ini-
tiatives are largely focused on special-purpose Information and Communication Technology
(ICT) applications and regulation-based approaches in the setting of smart ports. ICT con-
tributes significantly to the trend toward smart ports. Ports can take advantage of ICT
for improving knowledge sharing and information analysis to increase operations and energy
efficiency as well as environmental sustainability.
The City of Hamburg has adopted the SmartPort Solution by AGT InternationalTM
(AGT International SmartPort Solution, 2013). This solution includes a port-wide Cisco
Wi-Fi real-time locating system (RTLS) which detects RFID tags continuously in the port.
This technology recognizes and traces barges in real time. SmartPort Platform is another
tool which has a distributed architecture and performs data collection of the port sensors,
data visualization, and data analysis. This platform facilitates the processing of big data
volumes from the sensors that register environmental parameters and dynamic parameters
3

about the vessels (Fernández et al., 2016). In the private sector, companies such as Kalmar
Smart Port and Arelsa Company (Kalmar Global, 2018; Arelsa Co., 2016) offer automa-
tion solutions for smart ports. As another instance of technology-dependent solutions, ABB
organization (Lama, 2016) markets shore to ship power (onshore power supply) and other
reliable, green, and efficient electrification solutions.
The Port Authority of Cartagena has adopted the Posidonia SmartPort application to
share instant information about vessel situation, movements, operations, traffic history, and
forecasts (Montesinos, 2016). The Port Authority of Singapore (MPA) has employed mobile
technology and wireless connectivity to improve efficiency, communications, and crew satis-
faction in the Port of Singapore (The Maritime Executive, 2015).
Malaysian and Singaporean ports have implemented Integrated Port Management System
(IPMS) which incorporates multiple ports on a single platform (The Maritime Executive,
2015; Ngcobo, 2015). The Kenya Ports Authority (KPA) has automated processes such as
time management and payroll functions. Moreover, the KPA runs a security management
system that automates all entry and exit points for vehicles and passengers and facilitates
yard management with sensors to gain full transparency on the location and movement of
containers (Magyar, 2015). In addition to adopting existing technologies, the Port of Singa-
pore and the Port of Rotterdam have held hackathons separately to discuss possible future
projects and existing ideas in the area of smart ports (Smart Port Hackathon, 2017; World
Port Hackathon, 2016).
In the context of smart ports, there exist regulation-based approaches from the United
Nations Conference on Trade and Development (UNCTAD), International Maritime Organi-
zation (IMO), and European Union (EU) (The Motorways of the Sea Digital Multi-Channel
Platform, 2015). These legislations aim to improve port sustainability, motivate the im-
plementation of new technologies, and provide standards for assessing port performance.
Similarly, the U.S. Department of Homeland Security introduced the Smart Port Security
Act, which enhances risk-based security measures to prevent threats from reaching the ports
4
(Homeland Security Committee, 2012). Table A.1 shows the overview of smart port practices
grouped into two categories of multipurpose and targeted initiatives (see Appendix A).
Despite the recent emergence of the smart port concept, a unified definition of a smart
port and its associated key activity domains have not been well addressed in the literature.
Therefore, this paper aims to propose a smart port definition and its activity domains based
on the provided literature, and stimulate a path toward smarter ports by providing a formal
definition of smart port and its quantitative measure “Smart Port Index" for port authorities.
Therefore, this paper addresses three research questions:
1. What are a smart port and its activity domains?
2. How are ports performing to meet a typical smart port’s objectives?
3. What are the leading factors of the current smartness state of ports?
The remainder of this paper is organized as follows. The next section defines a smart
port based on the classified literature and identifies its activity domains. Section 3 proposes
a collection of KPIs for ports’ smartness assessment, develops a smart port index (i.e. SPI),
and evaluates major international ports with regard to the definition of a smart port. Note
that there were limitations on data availability and we experienced that not all ports publish
the required data for calculating all KPIs being discussed in this paper. Hence, it was nec-
essary for us to modify the index measurement approach to deal with this limitation for the
numerical experiments. However, this should not affect the development of the SPI index.
Section 4 investigates the effect of region-specific variables on the ports’ performances by
analyzing and decomposing SPI, identifies weaknesses and strengths of each port, and sug-
gests possible solutions to overcome deficiencies they may have. Finally, Section 5 concludes
this paper and provides possible future research directions.
5

2 Smart Port: Definition and Activity Domains
2.1 Smart Port Definition
Sporadic efforts have been made for developing a smart port. However, an internationally
accepted and standard definition for the word “smart" does not exist in the context of ports
and maritime industry. Tracking the genealogy of the word “smart" in similar areas assists
us in the understanding of why this term has emerged.
In the technology setting, smartness refers to the automatic computing principles such as
self-configuration, self-protection, self-healing, and self-optimization (Spangler et al., 2010).
In the urban planning field, smart growth emerged during the 1990s as a potent government-
and society-driven reaction to exacerbating trends in the loss of open space, air pollution,
obliteration of historic places, traffic congestion, and increasing public facilities cost (Nam
and Pardo, 2011). The term “smart growth" refers to an approach (public or private) to
managing development that leads to economic advancement without the congestion and en-
vironmental degradation. Smart City maximizes services to citizens while monitoring and
integrating critical infrastructures, planning preventive maintenance actions, optimizing re-
sources, and monitoring security aspects (Hall et al., 2000). Governments and public agencies
at all levels are embracing the notion of smartness to characterize their new policies aiming
for sustainable development, sound economic growth, and better quality of life for citizens.
Being smart involves strategic directions and is associated with achieving policy success
(Center on Governance, 2003). Smart homes, buildings, airports, hospitals, and ports are
equipped with mobile terminals, embedded devices, sensors, and actuators (Moss Kanter
and Litow, 2009).
Additionally, comparing the application of potential alternatives to the word “smart"
clarifies that it is the right choice to thoroughly describe the concept. Borrowing the word
choice philosophy from the Smart City field (Nam and Pardo, 2011), we can say that the
digital port describes a connected port that combines broadband communications infras-
6

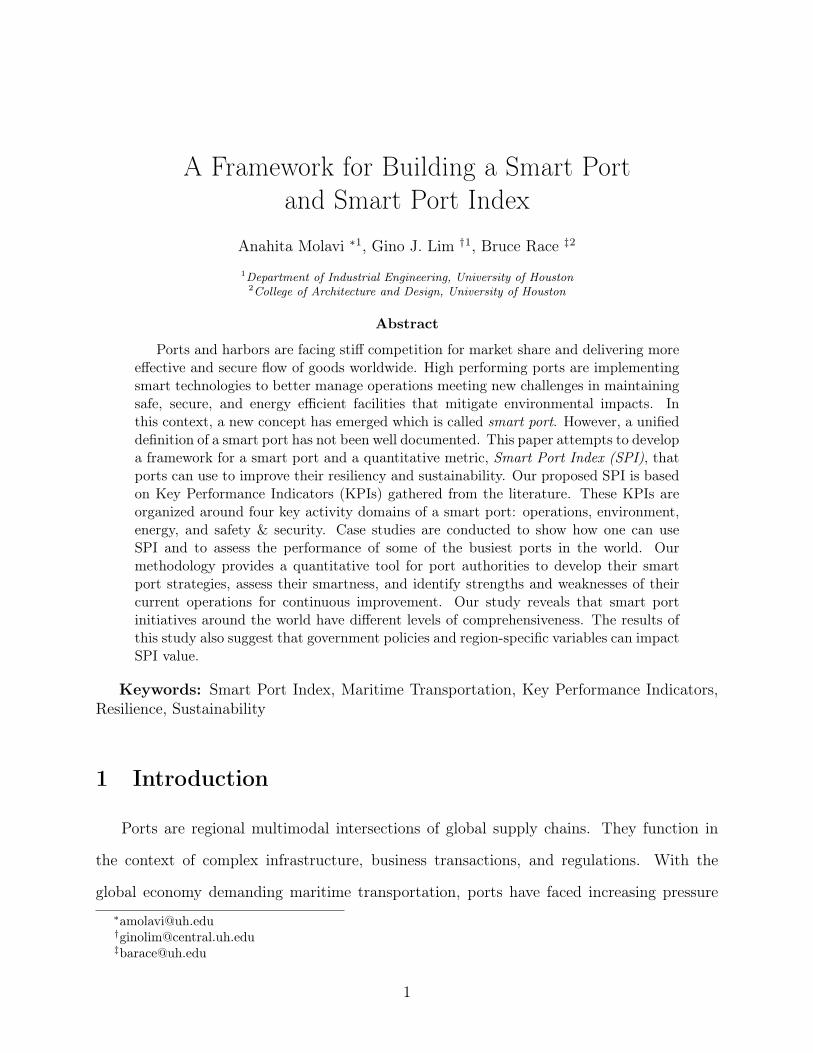
Figure 2.1: Ports development throughout the history (UNCTAD, 1992, 1999; Barros andBarros, 2013; The Motorways of the Sea Digital Multi-Channel Platform, 2015)
tructure, flexible and service-oriented computing infrastructure, and innovative services to
meet demands. An intelligent port has all the infrastructure and info-structure of infor-
mation technology and the most recent technologies in telecommunications, electronic, and
mechanic. A knowledge port is designed to encourage the nurturing of knowledge. A humane
port has multiple opportunities to utilize its human potential and lead creative processes.
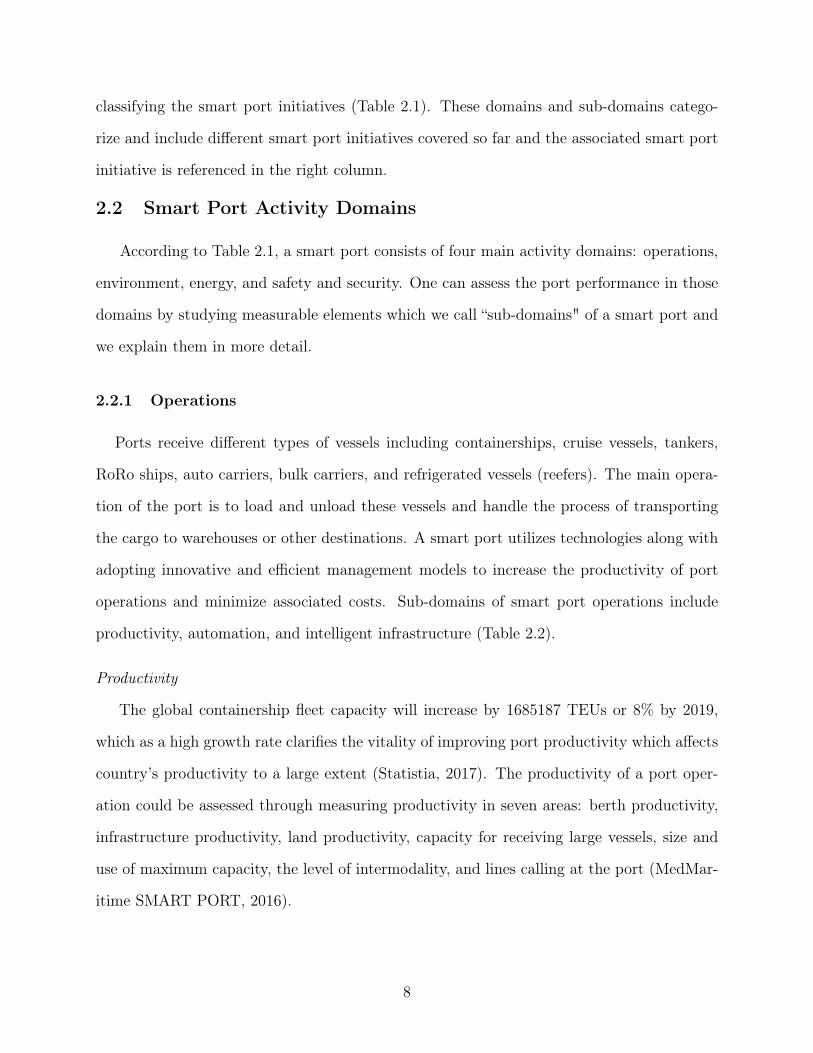
However, the port that we have in mind entails all the above aspects as well as the tra-
ditional port services and specifications (Figure 2.1). A smart port gathers better-educated
individuals, skilled workforces, intelligent infrastructures, and automation to facilitate knowl-
edge development and sharing, optimize the port operations, enhance the port resiliency, lead
a sustainable development, and guarantee safe and secure activities. It is sensible that the
term “smart port" has prevailed among the public and private sectors to describe the trend.
In what follows, we present the activity domains of a smart port that we have identified by
7
classifying the smart port initiatives (Table 2.1). These domains and sub-domains catego-
rize and include different smart port initiatives covered so far and the associated smart port
initiative is referenced in the right column.
2.2 Smart Port Activity Domains
According to Table 2.1, a smart port consists of four main activity domains: operations,
environment, energy, and safety and security. One can assess the port performance in those
domains by studying measurable elements which we call “sub-domains" of a smart port and
we explain them in more detail.
2.2.1 Operations
Ports receive different types of vessels including containerships, cruise vessels, tankers,
RoRo ships, auto carriers, bulk carriers, and refrigerated vessels (reefers). The main opera-
tion of the port is to load and unload these vessels and handle the process of transporting
the cargo to warehouses or other destinations. A smart port utilizes technologies along with
adopting innovative and efficient management models to increase the productivity of port
operations and minimize associated costs. Sub-domains of smart port operations include
productivity, automation, and intelligent infrastructure (Table 2.2).
Productivity
The global containership fleet capacity will increase by 1685187 TEUs or 8% by 2019,
which as a high growth rate clarifies the vitality of improving port productivity which affects
country’s productivity to a large extent (Statistia, 2017). The productivity of a port oper-
ation could be assessed through measuring productivity in seven areas: berth productivity,
infrastructure productivity, land productivity, capacity for receiving large vessels, size and
use of maximum capacity, the level of intermodality, and lines calling at the port (MedMar-
itime SMART PORT, 2016).
8
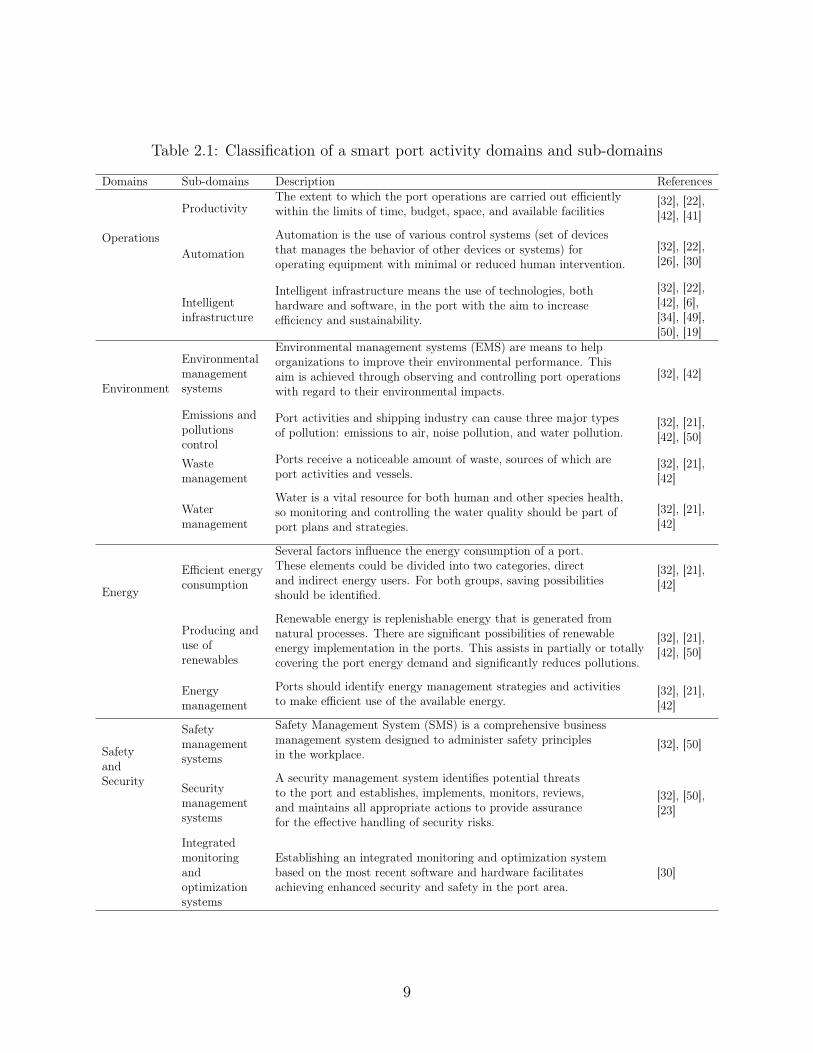
Table 2.1: Classification of a smart port activity domains and sub-domains
Domains Sub-domains Description References
Operations
ProductivityThe extent to which the port operations are carried out efficientlywithin the limits of time, budget, space, and available facilities
[32], [22],[42], [41]
AutomationAutomation is the use of various control systems (set of devicesthat manages the behavior of other devices or systems) foroperating equipment with minimal or reduced human intervention.
[32], [22],[26], [30]
Intelligentinfrastructure
Intelligent infrastructure means the use of technologies, bothhardware and software, in the port with the aim to increaseefficiency and sustainability.
[32], [22],[42], [6],[34], [49],[50], [19]
Environment
Environmentalmanagementsystems
Environmental management systems (EMS) are means to helporganizations to improve their environmental performance. Thisaim is achieved through observing and controlling port operationswith regard to their environmental impacts.
[32], [42]
Emissions andpollutionscontrol
Port activities and shipping industry can cause three major typesof pollution: emissions to air, noise pollution, and water pollution.
[32], [21],[42], [50]
Wastemanagement
Ports receive a noticeable amount of waste, sources of which areport activities and vessels.
[32], [21],[42]
Watermanagement
Water is a vital resource for both human and other species health,so monitoring and controlling the water quality should be part ofport plans and strategies.
[32], [21],[42]
Energy
Efficient energyconsumption
Several factors influence the energy consumption of a port.These elements could be divided into two categories, directand indirect energy users. For both groups, saving possibilitiesshould be identified.
[32], [21],[42]
Producing anduse ofrenewables
Renewable energy is replenishable energy that is generated fromnatural processes. There are significant possibilities of renewableenergy implementation in the ports. This assists in partially or totallycovering the port energy demand and significantly reduces pollutions.
[32], [21],[42], [50]
Energymanagement
Ports should identify energy management strategies and activitiesto make efficient use of the available energy.
[32], [21],[42]
SafetyandSecurity
Safetymanagementsystems
Safety Management System (SMS) is a comprehensive businessmanagement system designed to administer safety principlesin the workplace.
[32], [50]
Securitymanagementsystems
A security management system identifies potential threatsto the port and establishes, implements, monitors, reviews,and maintains all appropriate actions to provide assurancefor the effective handling of security risks.
[32], [50],[23]
Integratedmonitoringandoptimizationsystems
Establishing an integrated monitoring and optimization systembased on the most recent software and hardware facilitatesachieving enhanced security and safety in the port area.
[30]
9

Table 2.2: Operations: smart port activity sub-domains
Smart OperationsProductivity Automation Intelligent infrastructure
Berth productivity Automated stack Integrated informationsystems and software
Infrastructure productivity Automated path HardwareLand productivity Automated railSize and use of maximum capacity Automated liftLines calling at the port Automated trucksCapacity for receiving large vessels Automated quayLevel of Intermodality
Automation
Automatized machinery can replace the human workforce in ports and reduce existing
human errors, safety issues, port congestions, and turnaround time as well as increasing
operations efficiency (MedMaritime SMART PORT, 2016).
Intelligent Infrastructure
Intelligent infrastructure (both hardware and software) in ports can increase efficiency
and sustainability by real-time data collection, processing, and sharing. Information re-
garding traffic flow of both vessels and hinterland transportation vehicles, closure times of
movable bridges and other infrastructure information, the situation at the container ter-
minals and other major operations (e.g., empty container depots), and parking facilities
should be available to port users (Hamburg Port Authority, 2016b). The fast and easy
flow of this information facilitates wise and well-informed decision making by port author-
ities and port customers. This ultimately brings increased productivity, fewer costs, high
market competition ability for the port, less emission, energy efficiency, and green logistics.
With reference to the current smart port’s best practices, implemented intelligent infras-
tructures in the ports are: sensors, GPS/DGPS, RFID/OCR/LPR, GNSS, DGNSS, TOS,
Bluetooth, WLAN, mobile devices, the Cloud, port community systems, port monitor sys-
tem, port road management system, intelligent railway, smart maintenance, vessel traffic
management, parking space management, and gate management.
10

2.2.2 Environment
Ports can be the source of environmental pollution through land and sea transportation
and industrial activities. For the purpose of this research, we focus on the following envi-
ronmental impacts of port activities: emissions to air, noise pollution, water pollution and
consumption, and waste generation. These environmental issues reduce social welfare and
pose a threat to the survival of living creatures; thus, they cause critical challenges for port
managers and menace the ports’ endurance in the future competitive era. Smart ports seek
solutions to existing environmental problems. We can evaluate the port efficiency in this
domain by investigating the port Environmental Management Systems (EMS), pollution re-
duction activities, and water & waste management.
Environmental Management Systems
Environmental management systems (EMS) offer a framework for evaluating, monitoring,
and reducing port environmental impact. The International Organization for Standardiza-
tion (ISO) has developed the most commonly used framework for an EMS, the ISO 14001
standard. According to ISO 14001, the five main stages of an EMS are as follows: com-
mitment and policy, planning, implementation, evaluation, and review (The United States
Environmental Protection Agency, 2016). Two well-known EMS examples include EU Eco-
Management and Audit Scheme (EMAS) and Environmental Review System (PERS). EMAS
was developed by the European Commission as a means for every organization and orga-
nization type to evaluate, report, and improve their environmental performance (European
Commission, 2017). PERS is a port-specific environmental management standard developed
by EcoPorts. PERS incorporates the main requirements of well-known environmental man-
agement standards (e.g., ISO 14001) as well as the specificities of ports (EcoPorts, 2018).
Air Emission Control
The main air pollutants from port activities are CO2, SO2, NOx, Particulate Matter
(PM2.5 and PM10), HC, CO, and VOC. Air pollution damages the natural environment and
11

can cause harm to human health and other living species. Shipping-related particulate mat-
ter (PM) is one of the most dangerous air pollutants and was responsible for approximately
60,000 cardiopulmonary and lung cancer deaths in 2007 (Corbett et al., 2007). In addition,
increasing amounts of greenhouse gases can lead to climate change, ozone layer disruption,
and more acid rain. There exist many solutions to decrease emissions such as implementing
alternative fuels and zero emission technologies for vessels and land transportation means in
ports.
Noise Pollution Reduction
Noise pollution in ports is generated from ferries, ships, industrial activities, shipyard
activities, and auxiliary services. This noise pollution can negatively impact the natural eco-
system and the urban population (Schenone et al., 2014). Hence, effective actions should be
designed and performed for evaluating, monitoring, and reducing noise pollution at ports.
Waste Management
Ports receive a noticeable amount of waste, sources of which are port activities and ves-
sels. Categorization of ship-generated waste has been established by IMO in the MARPOL
73/78 Convention. According to this convention, six major types of wastes are produced
by the vessels: oily waste, bulk chemical waste, noxious substances, packaged form, sewage,
and garbage. The same categories can be considered for grouping the port-generated waste
(Olson, 1994). Each of the mentioned types of waste can have environmentally harmful
effects if action plans are not devised for handling, recycling, reception, and reducing them
to standard amounts.
Water Management
Wastewater from port activities is one of the major environmental concerns since sea-
ports are often situated near residential communities or environmentally sensitive locations.
High organic concentration in wastewater assists the growth of different types of bacteria.
Wastewater assessment and reduction methods should be implemented in order to reduce
12

the amount of pollutants in the water. In addition to wastewater handling, another issue
is the high water consumption of port activities, such as the cooling process. This water is
either drawn directly by the port companies themselves (from surface, ground or rain water)
or supplied by the water companies. Limited sources of water and rising costs have led to
the idea of reducing water consumption.
2.2.3 Energy
The port and its logistics are large consumers of energy. Along with the development
of ports, the rise in the demand for maritime transportation, and the increase in industrial
activities in ports, the demand for energy further increases. Taking into account the limita-
tion of energy sources and port budget, smart port considers approaches to decrease energy
consumption. It also suggests the use of renewable energies to both reduce emissions and
become independent in terms of energy sources (Port of Rotterdam, 2016). The sub-domains
consists of the use and production of renewable energy, efficient energy consumption, and
adopting Energy Management Systems (Table 2.3).
Efficient Energy Consumption
Energy consumers in ports can be divided into two categories: direct and indirect energy
consumers. Direct consumers of energy include the lighting system of the port terminal
area, offices and other facilities, the office buildings, and the facilities of the garage. Indirect
consumers are those with more seasonal consumption patterns. In other words, they depend
on the volume of port activities. Indirect consumers include cranes, the internal fleet of
the port, and the reefers (MedMaritime SMART PORT, 2016). Improving the processes
and equipment to require less energy and avoid energy loss leads to more efficient energy
consumption and lower costs.
Production and Use of Renewables
Possibilities of implementation of renewable energies are huge in the ports. This assists
13

Table 2.3: Energy: smart port activity sub-domains
Smart EnergyEfficient energy consumption Use of renewables Energy management
Energy consumption by containers Wind energy Energy managementsystems
Energy consumption by fleet Solar powerMonitoring andoptimization of energyconsumption
Energy consumption by lighting Biomass energyEnergy consumption by terminalequipment for movement of containers Wave and tidal energy
Energy consumption by officesand companies
Efficient use of solarand electric transportation
covering partially or totally the port energy demand. Sources of renewable energy that can
be developed in ports are wind technology (off-shore or installed in the terminal area for
electric cranes and forklifts), small wind (incorporated in buildings to satisfy the energy
demand of offices, garage facilities, and electric vehicles), photovoltaic technology (incor-
porated in buildings to satisfy the energy demand of offices, garage facilities, and electric
vehicles), biodiesel (to provide fuel to internal fleet), and marine technologies (wave and
tidal energy conversion to electricity for electric cranes and forklifts) (MedMaritime SMART
PORT, 2016).
Energy Management
Energy management systems provide ports with a systematic approach to achieve con-
tinuous improvement in energy performance. In this regard, ISO 50001, an international
standard for energy management systems, specifies the requirements for designing, applying,
maintaining, and enhancing an energy management system. Implementation of ISO 50001,
can result in energy performance improvement and energy costs reduction (International
Maritime Organization, 2016a). In addition to energy management systems, ports can op-
timize energy consumption by continuous monitoring and controlling energy consumption
of different activities. An integrated information processing and visualization system in the
port assists with reaching this goal.
14

2.2.4 Safety and Security
Ports are vulnerable to several safety and security issues, which can potentially cause a
loss in terms of benefits, port reputation, and the efficiency of operations (Fabiano et al.,
2010). Direct attacks by terrorists, utilization of ports as a conduit for the movement of
weapons (Altiok, 2011), natural hazards, and inherent risks in the port activities associated
with safety and security are the prominent issues in this area. For example, ports can be
exposed to both high−frequency low−severity events (occupational risk) and low−frequency
high−severity events (major accident risk) (Vairo et al., 2017; Mokhtari et al., 2012). Smart
port uses solutions such as regulations, standards, employee training, periodic control of fa-
cilities, risk assessment, proper designs, and monitoring systems to detect any security issue,
increase port preparedness, and improve resilience. Overall port performance in this sense is
measurable through exploring port safety management systems, security management sys-
tems, and integrated monitoring and optimization systems.
Safety Management Systems
Safety Management System (SMS) is a systematic and comprehensive process for manag-
ing safety risks and is composed of policy, organizing, designing, applying, assessment, and
improvement. The system also contains manuals, training, and standards. SMS is applicable
to port activities and vessel operations. As another approach to ensure safety at ports, IMO
has developed the International Safety Management Code (ISM). In addition to this code,
IMO requires all international passenger ships, oil tankers, chemical tankers, gas carriers,
bulk carriers, and cargo ships of 500 gross tons or more to implement a SMS.
Security Management Systems
Security management systems identify potential threats to the port and establish, im-
plement, monitor, review, and maintain appropriate actions to effectively handle security
risks. Implementation of a security management system will ensure resilience in the face of
danger and optimization in terms of cost and loss. Ports need to identify both their assets
15
and possible external and internal threats, perform risk analysis and risk management, and
increase the preparedness and awareness of employees. In the meanwhile, steady monitoring
and policy evaluation is required to have an up-to-date security management system. Inter-
national Ship and Port Facility Security Code (ISPS) is introduced by IMO for enhancing
security at the ports.
Integrated Monitoring and Optimization Systems
Establishing an integrated monitoring and optimization system based on the most recent
software and hardware enhances security and safety in the port area. This includes mainly
connecting hardware such as cameras, wireless technology, sensors, RFID tags, and software
for data gathering, visualization, analysis, and optimization. Storing the data and analyzing
it brings several benefits: real-time information sharing among different port sectors, iden-
tification of preventive actions, increased preparedness, effective decision making in the face
of unpredicted events, and hence, the resiliency of the port operations.
3 Smart Port Index (SPI)
In this section, we introduce a methodology to assess the smartness of a port and develop
a rubric as a single index value to capture the port smartness. First, we reviewed the existing
Key Performance Indicators (KPIs) in the literature for evaluating the port performance.
Four indices were found to be important for measuring smart port performance in its activity
domains: operations, energy, environment, and safety and security. Thus, our proposed
SPI is a convex combination of these four indices. The SPI can facilitate early detection
of deficiencies in any of the four measurement areas to make correctional actions, or help
expedite the improvement of port performance. Furthermore, ports can use the SPI to
evaluate themselves and know where they stand in comparison to other ports. They can also
use the outcome measures to develop strategic and operational decisions to stay competitive
in the global market of maritime transportation.
16

Table 3.1: Information on the collected KPIs
Category Study Total number of KPIsMedMaritimeSMARTPORT Anto, P. et al. Maigret, A. et al. Perera, M. A. P. et al.
Operations 3 7 7 3 29Environment 3 7 3 3 27Energy 3 7 3 3 17Safety and Security 3 3 7 7 15
3.1 Key Performance Indicators (KPIs)
The first step toward measuring the SPI is to identify a comprehensive set of KPIs for
quantifying port performance in each smart port activity domain. Tables A.2, A.3, A.4,
and A.5 show the KPIs we collected from the literature for measuring port performance (see
Appendix A). We have adopted KPIs from several sources, as shown in Table 3.1 (Med-
Maritime SMART PORT, 2016; Antão et al., 2016; Maigret, 2014; Perera and Abeysekara,
2016). We borrowed all the 68 KPIs of MedMaritime Smart Port: 26 KPIs related to SOI
sub-domains, 2 KPIs for SSSI, 16 KPIs for quantifying SEgI, and 24 KPIs related to SEnI.
Then, we selected and added the remaining KPIs from other related sources to enhance the
capability of the SPI in measuring all the smart port domains and sub-domains.
3.2 SPI Formulation
The performance of a smart port is quantifiable through four indices we present here:
Smart Operations Index (SOI), Smart Energy Index (SEgI), Smart Environment Index
(SEnI), Smart Safety and Security Index (SSSI). Because the range of values can be quite
different from one KPI to the next, the values must be rescaled so that the KPI values are
comparable in the combined SPI. Standardization and normalization are the two common
approaches for rescaling the data. In normalization, the data is modified to take values
between 0 and 1 (Equation (1)). Normalized data is calculated by Equation (1) in which x
is the original data, xmin is the minimum x value in the data set, and xmax is the maximum
17
x value.
xnormalized =x− xmin
xmax − xmin
(1)
The normalization maps the data to positive values, while standardization may result
in negative values. In this paper, the normalization equation (Equation (1)) is used to
transform the original data. The KPIs can be modified in such a way that if a higher KPI
value is preferred, the normalized value can be used as is. But, if less value for the KPI is
preferred, the KPI value can be multiplied by -1 (see Equation (2)). For instance, higher
values of port productivity (e.g., annual throughput) and lower values of air emission (e.g.,
total annual air emission) are more desirable. So, we keep positive the productivity value
but we multiply the air emission value by -1. As a result, the positive productivity value
increases the total SPI while the negative emission value reduces it. Each of the four indices
(SOI, SEgI, SEnI, and SSSI) is calculated as a function of the relevant KPIs (Equations
(3)-(6)). For instance, in Equation (3), αi’s take positive values and the summation of them
should be equal to 1. Hence, SOI is calculated as the convex combination of the modified
KPIs. Equations (4) through (6) have the same structure as Equation (3). Finally, SPI is
quantified using Equation (7). Note that j refers to the smart port activity domains, i.e.,
j ∈ {1: operations, 2: energy, 3: environment, 4: safety and security}, the rescaled value of
ith KPI of jth category is kij (ni is number of KPIs for measuring port performance in ith
smart port activity domain) and the signed value of ith rescaled KPI of jth category is k′ij.
k′ij =
{−kij, lower values of kij are preferable
kij, higher values of kij are preferable(2)
SOI =
n1∑i=1
αik′1i,
n1∑i=1
αi = 1, αi ≥ 0,∀i = 1, ..., n1 (3)
SEgI =
n2∑i=1
βik′2i,
n2∑i=1
βi = 1, βi ≥ 0,∀i = 1, ..., n2 (4)
18
SEnI =
n3∑i=1
γik′3i,
n3∑i=1
γi = 1, γi ≥ 0,∀i = 1, ..., n3 (5)
SSSI =
n4∑i=1
δik′4i,
n4∑i=1
δi = 1, δi ≥ 0,∀i = 1, ..., n4 (6)
SPI = λ1SOI + λ2SEgI + λ3SEnI + λ4SSSI,
4∑i=1
λi = 1, λi ≥ 0,∀i = 1, 2, 3, 4(7)
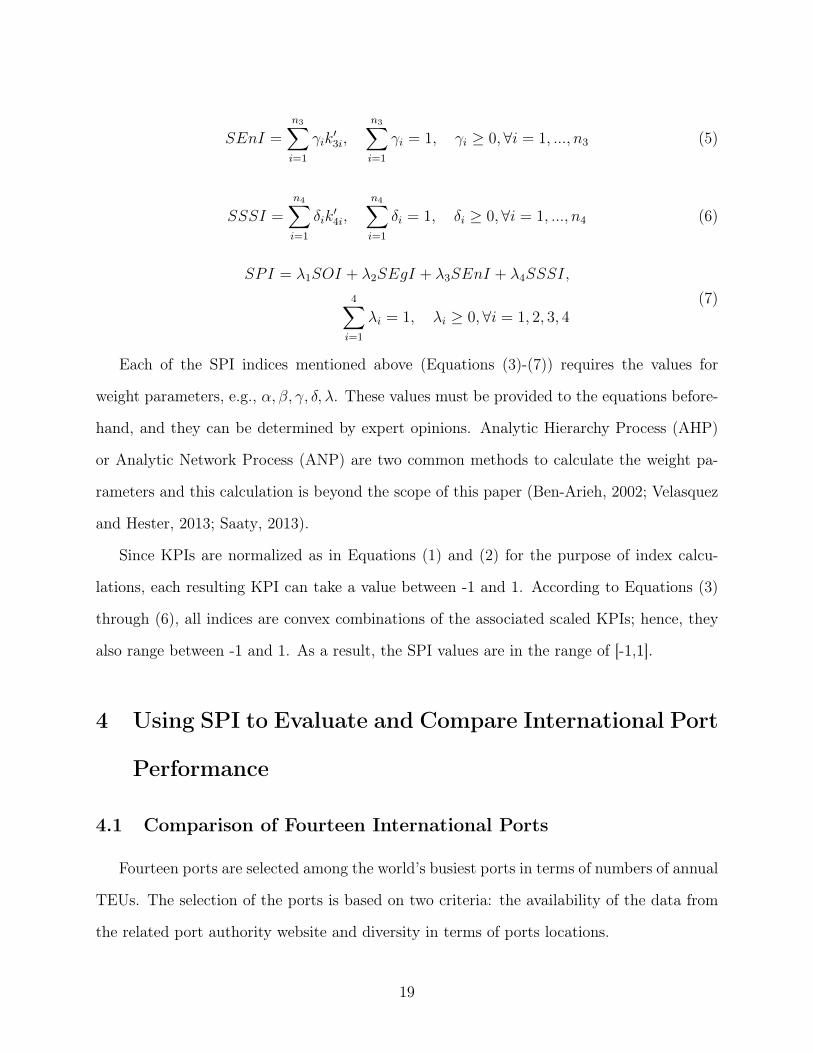
Each of the SPI indices mentioned above (Equations (3)-(7)) requires the values for
weight parameters, e.g., α, β, γ, δ, λ. These values must be provided to the equations before-
hand, and they can be determined by expert opinions. Analytic Hierarchy Process (AHP)
or Analytic Network Process (ANP) are two common methods to calculate the weight pa-
rameters and this calculation is beyond the scope of this paper (Ben-Arieh, 2002; Velasquez
and Hester, 2013; Saaty, 2013).
Since KPIs are normalized as in Equations (1) and (2) for the purpose of index calcu-
lations, each resulting KPI can take a value between -1 and 1. According to Equations (3)
through (6), all indices are convex combinations of the associated scaled KPIs; hence, they
also range between -1 and 1. As a result, the SPI values are in the range of [-1,1].
4 Using SPI to Evaluate and Compare International Port
Performance
4.1 Comparison of Fourteen International Ports
Fourteen ports are selected among the world’s busiest ports in terms of numbers of annual
TEUs. The selection of the ports is based on two criteria: the availability of the data from
the related port authority website and diversity in terms of ports locations.
19

4.1.1 Data Collection and SPI Measurements
We have collected relevant data for fourteen ports from their websites to illustrate the use
of the proposed method. We have experienced that not all ports publish the necessary data
to calculate all KPIs discussed in this paper, but we were able to obtain publicly available
data to compute 8 KPIs (see Appendix, Table A.2, KPIs 1, 3, 5, 7, 9, 11, 22, and 23).
These KPIs are all related to measuring Productivity, SOI. Thus, we modified the index
measurement approach presented in the previous section to quantify other activity domains
as follows: if the port has stated and explained related activities to each smart port activity
domain in the port website, we have assigned the value of 1 to the sub-domain index value,
and for those areas that are not mentioned in the website, we have not assigned any value.
For instance, for measuring SOI, we can calculate the Productivity by KPIs (e.g., annual
throughput (TEU/meter of container quay)), but the data is not available for quantifying
the Automation and Intelligent Infrastructure. So, if the port website mentions ongoing
activities in these two areas, we assign the value of 1 to each. For increasing the preciseness of
this modified approach, we divided Intelligent Infrastructure into two categories of Software
(IIS) and Hardware (IIH). We also divided Integrated Monitoring and Optimization Systems
into two categories of Integrated Monitoring Systems for Safety and Integrated Monitoring
Systems for Security.
There are four categories (n1 = 4) in calculating SOI (Productivity, Automation, IIS,
and IIH ) in Equation (3). By assuming equal weights among these categories, the value
of αi is 1/4, for i ∈ {1, 2, 3, 4}. For computing SEgI (Equation (4)), there are three cate-
gories (i.e., low energy consumption, producing/use of renewables, and energy management);
hence, n2 = 3 and βi = 1/3 for i ∈ {1,2,3}. Categories included in Equation (5) are en-
vironmental management system, emissions and pollution control, waste management, and
water management; n3 = 4 and γi = 1/4 for i ∈ {1,2,3,4}. Regarding safety and security in-
dex quantification (Equation (6)), there are four categories (i.e. safety management system,
security management system, integrated monitoring system for safety, and integrated moni-
20
toring system for security); n4 = 4 and δi = 1/4 for i ∈ {1,2,3,4}. Putting these all together,
the SPI index is calculated as in Equation (7) by assuming equal parameter weights. The
other measurement steps in this example are the same as the approach outlined in Section
3 and SPI values take values in the range of [-1,1].
4.1.2 Effects of Region-Specific Variables on the smartness of the ports
The data analysis in our study has three objectives: to calculate and compare index
values of the selected ports, to analyze why a port received the associated score, and to
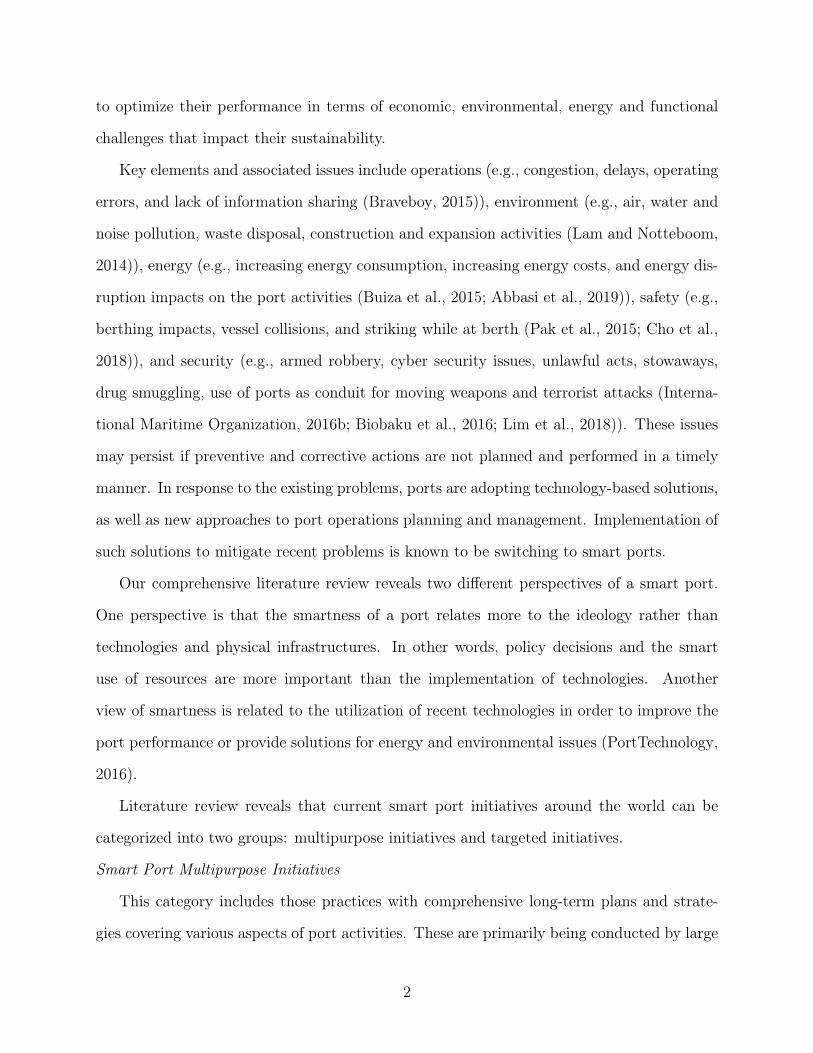
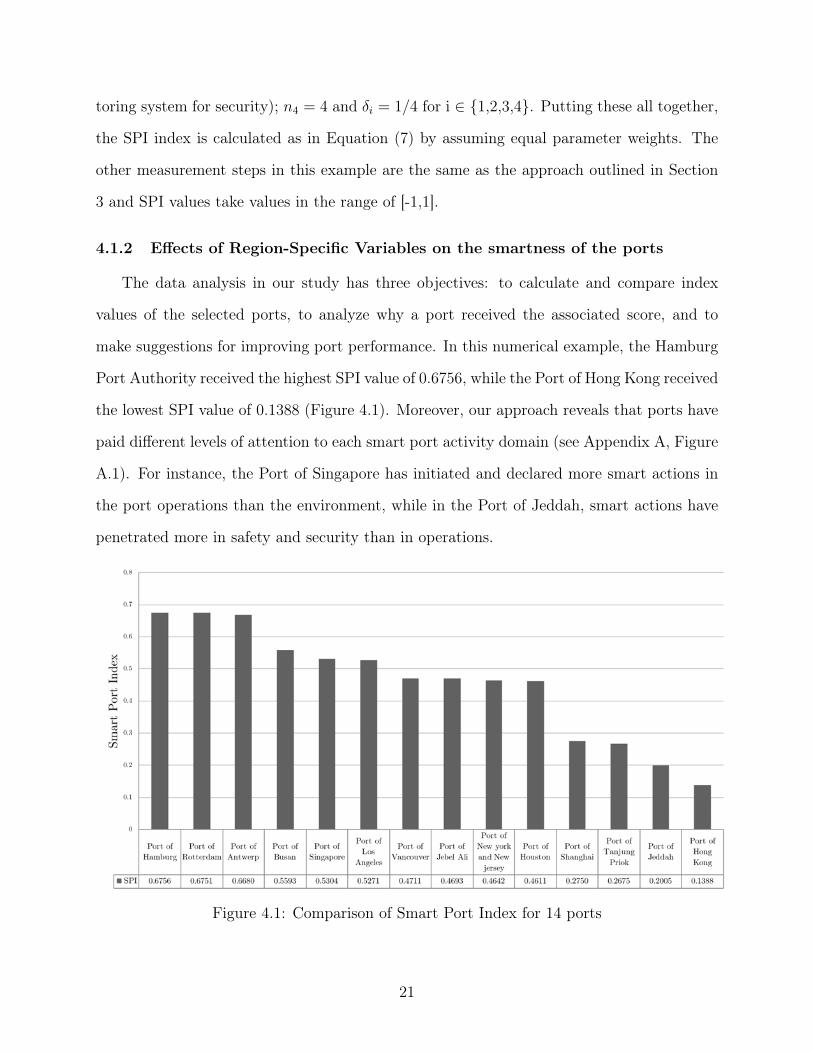
make suggestions for improving port performance. In this numerical example, the Hamburg
Port Authority received the highest SPI value of 0.6756, while the Port of Hong Kong received
the lowest SPI value of 0.1388 (Figure 4.1). Moreover, our approach reveals that ports have
paid different levels of attention to each smart port activity domain (see Appendix A, Figure
A.1). For instance, the Port of Singapore has initiated and declared more smart actions in
the port operations than the environment, while in the Port of Jeddah, smart actions have
penetrated more in safety and security than in operations.
Figure 4.1: Comparison of Smart Port Index for 14 ports
21
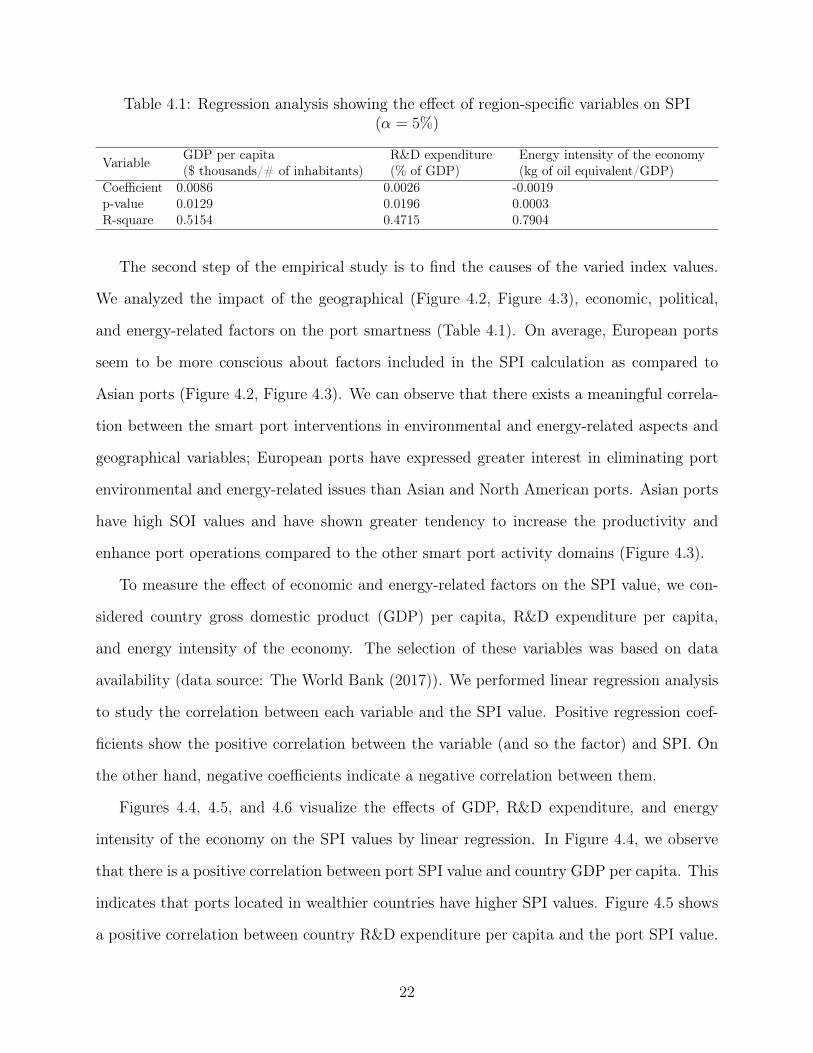
Table 4.1: Regression analysis showing the effect of region-specific variables on SPI(α = 5%)
Variable GDP per capita($ thousands/# of inhabitants)
R&D expenditure(% of GDP)
Energy intensity of the economy(kg of oil equivalent/GDP)
Coefficient 0.0086 0.0026 -0.0019p-value 0.0129 0.0196 0.0003R-square 0.5154 0.4715 0.7904
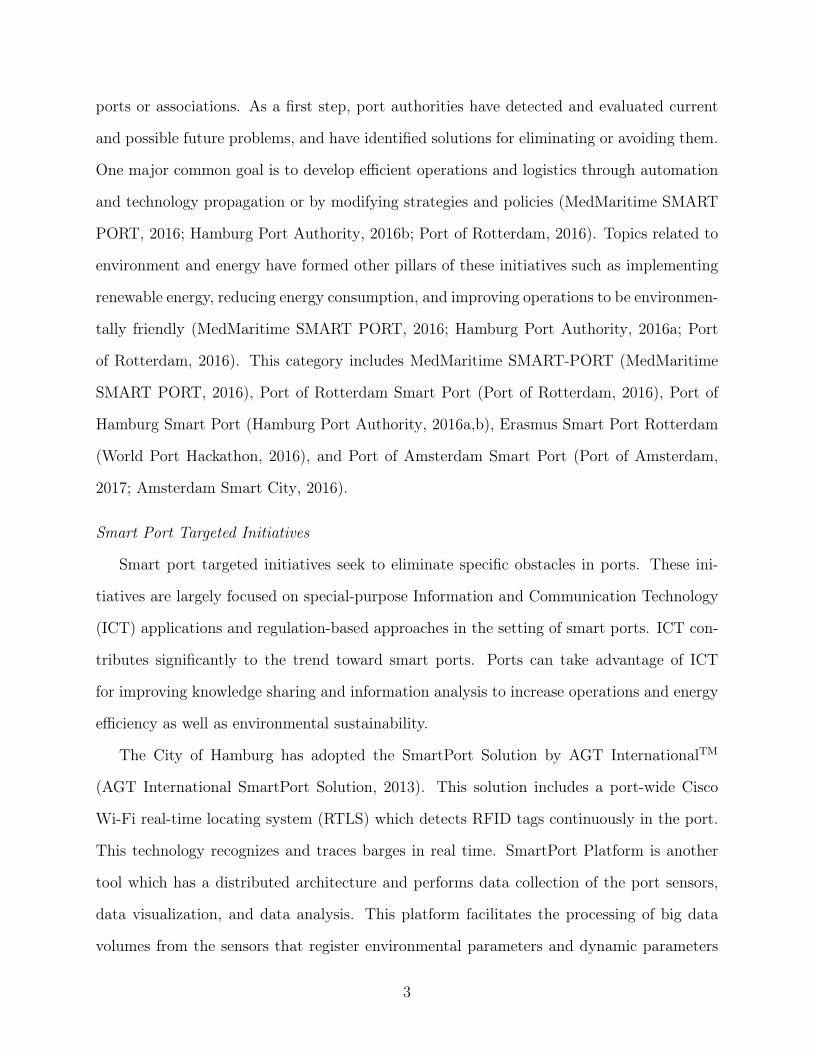
The second step of the empirical study is to find the causes of the varied index values.
We analyzed the impact of the geographical (Figure 4.2, Figure 4.3), economic, political,
and energy-related factors on the port smartness (Table 4.1). On average, European ports
seem to be more conscious about factors included in the SPI calculation as compared to
Asian ports (Figure 4.2, Figure 4.3). We can observe that there exists a meaningful correla-
tion between the smart port interventions in environmental and energy-related aspects and
geographical variables; European ports have expressed greater interest in eliminating port
environmental and energy-related issues than Asian and North American ports. Asian ports
have high SOI values and have shown greater tendency to increase the productivity and
enhance port operations compared to the other smart port activity domains (Figure 4.3).
To measure the effect of economic and energy-related factors on the SPI value, we con-
sidered country gross domestic product (GDP) per capita, R&D expenditure per capita,
and energy intensity of the economy. The selection of these variables was based on data
availability (data source: The World Bank (2017)). We performed linear regression analysis
to study the correlation between each variable and the SPI value. Positive regression coef-
ficients show the positive correlation between the variable (and so the factor) and SPI. On
the other hand, negative coefficients indicate a negative correlation between them.
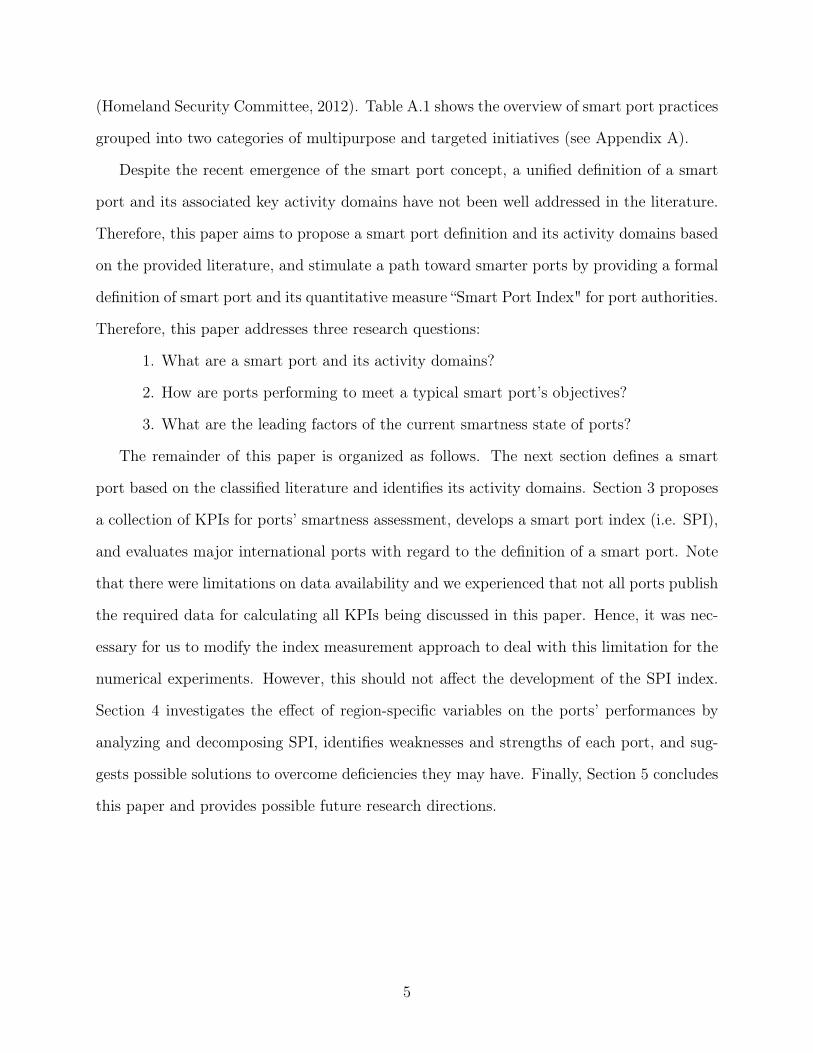
Figures 4.4, 4.5, and 4.6 visualize the effects of GDP, R&D expenditure, and energy
intensity of the economy on the SPI values by linear regression. In Figure 4.4, we observe
that there is a positive correlation between port SPI value and country GDP per capita. This
indicates that ports located in wealthier countries have higher SPI values. Figure 4.5 shows
a positive correlation between country R&D expenditure per capita and the port SPI value.
22

Figure 4.2: SPI by region Figure 4.3: Smart sub-indices by region
We can interpret that if a country is more open to innovation and higher education systems,
then the country’s ports are more interested in the implementation of new technologies and
innovative approaches. Figure 4.6 visualizes a negative correlation between the amount of
energy consumption in the country per GDP and SPI. Higher energy intensity values indicate
that higher industrial output and effort were required for production and service. This means
either the industries in the country are not productive or energy efficient. We can observe
how SPI value reduces as the energy intensity increases in Figure 4.6.
23
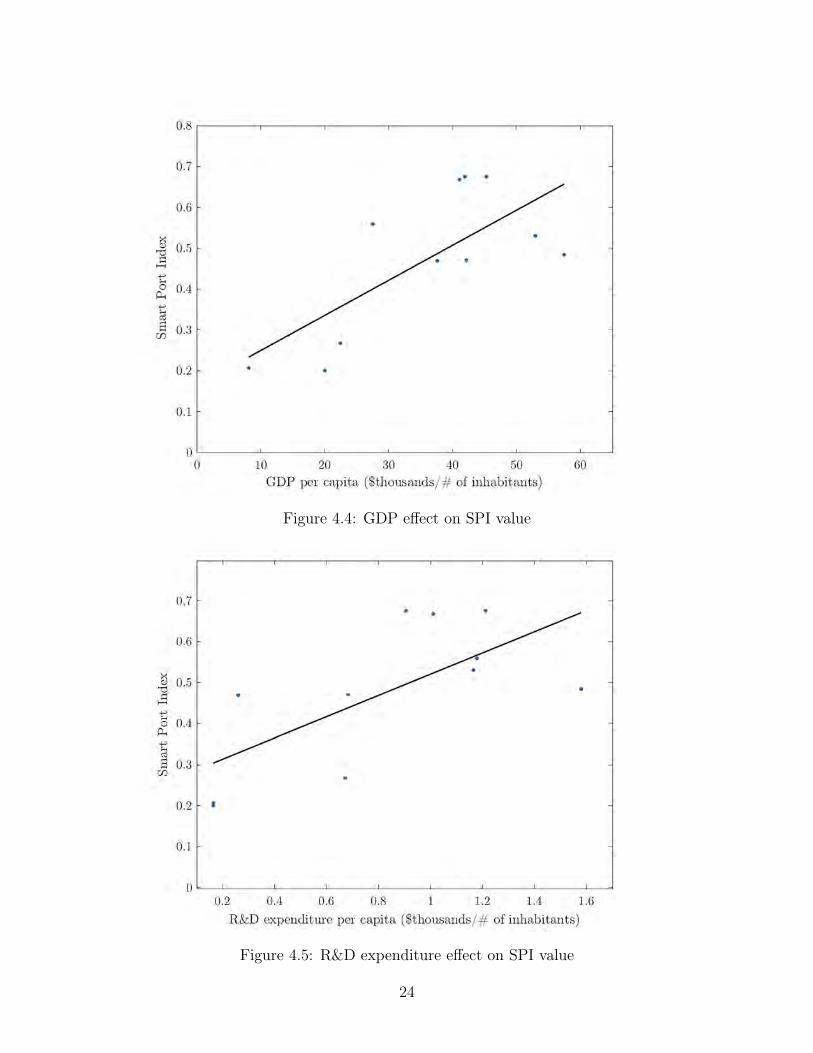
Figure 4.4: GDP effect on SPI value
Figure 4.5: R&D expenditure effect on SPI value
24
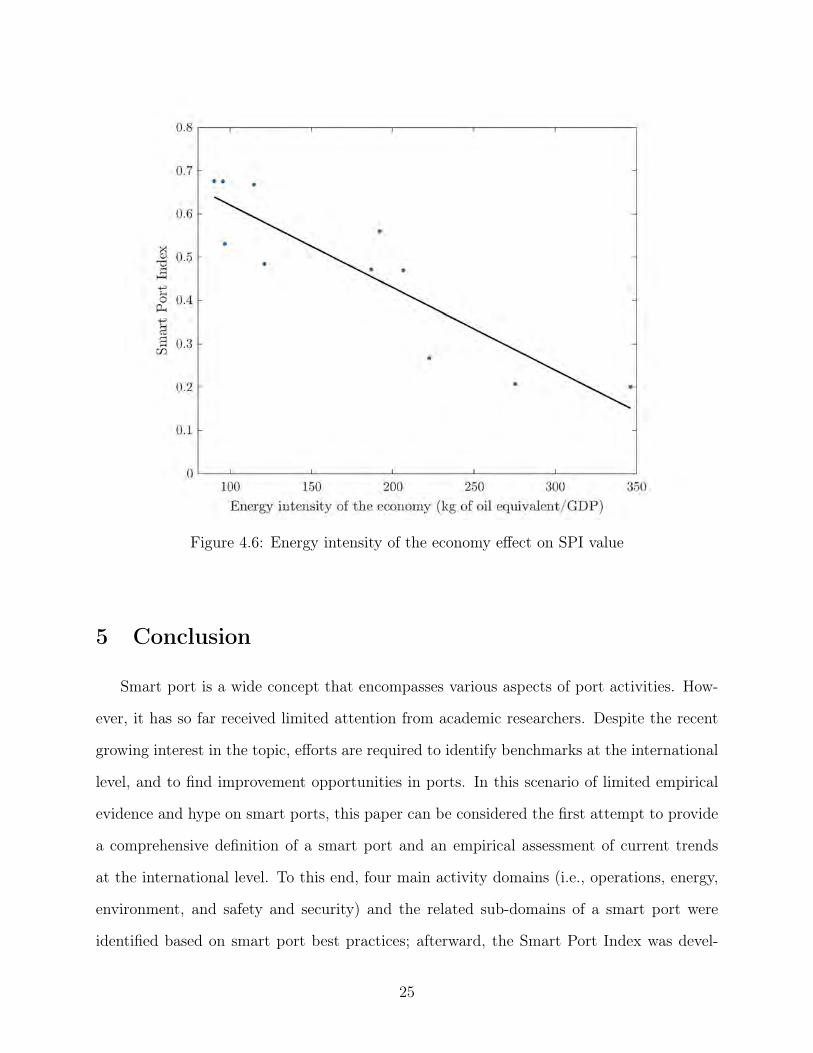
Figure 4.6: Energy intensity of the economy effect on SPI value
5 Conclusion
Smart port is a wide concept that encompasses various aspects of port activities. How-
ever, it has so far received limited attention from academic researchers. Despite the recent
growing interest in the topic, efforts are required to identify benchmarks at the international
level, and to find improvement opportunities in ports. In this scenario of limited empirical
evidence and hype on smart ports, this paper can be considered the first attempt to provide
a comprehensive definition of a smart port and an empirical assessment of current trends
at the international level. To this end, four main activity domains (i.e., operations, energy,
environment, and safety and security) and the related sub-domains of a smart port were
identified based on smart port best practices; afterward, the Smart Port Index was devel-
25
oped as the convex combination of the sub-indices.
Index calculation is achieved mainly through measurement of the KPIs collected from
the literature. The numerical example included the study of 14 ports selected among the
top 100 busiest ports in the world in terms of the total number of annual TEUs. Note that
we have experienced limited availability of data for some KPIs described in this paper. Port
selection criteria were the availability of data given on the ports websites and diversity in
the location of the ports. After index measurements, an analysis was conducted in order to
understand the relationship between the geographical, governmental, economic, and energy-
related variables, and the dependent SPI variable. It was noticed that regional variables and
government policies can affect the port performance and that in general, ports located in
countries that are wealthier, open to innovation, environmentally-friendly, and energy effi-
cient have higher SPI values.
In the process of achieving the above results, the paper explains two issues. First, cur-
rent smart port initiatives have different pillars, some of which overlap. Some of the ports
are conducting multipurpose projects, while the others have targeted special areas such as
ICT penetration into the port operations. It has been noticed that European ports have
relatively comprehensive approaches and they are more conscious about port environmental
and energy aspects in comparison to the other ports. This can be traced back to the en-
vironmental standards that the European Union mandates different organizations to follow
(European Union, 2017). In this study, we attempted to conceptualize a smart port that
includes various aspects of port activities and incorporates important areas of concern such
as the environment or energy.
Secondly, adequate information and data for quantifying ports smartness are not avail-
able. This is due to either port policies and their reluctance to share the detailed information
or the lack of focus on some smart port activity domains. We reduced the impact of this
limitation on the results by selecting ports with the highest level of data availability and
modifying the indices computation approach.
26

For future research, one can investigate other possible activity domains to be included in
the smart port concept such as sustainability, human resources (e.g., knowledgeable employ-
ees, creativity, training opportunities), and institutional aspects (e.g., corporate governance,
harmony with the community, supply chain partnerships). Moreover, if one has access to
more comprehensive data for computing more KPIs, the empirical research can be extended
to enhance the analysis presented in this paper. Furthermore, there is a need to further ex-
plore both the barriers of implementation and impacts of a smart port on the related matters;
for instance, we can target topics such as the impact of smart ports on traditional institu-
tional and human factors and the influence of smart ports on cities and the surrounding
municipalities.
27
References
1. Abbasi, S., Barati, M., and Lim, G. J. (2019). A Parallel Sectionalized Restora-
tion Scheme for Resilient Smart Grid Systems. IEEE Transactions on Smart Grid,
10(2):1660–1670.
2. AGT International SmartPort Solution (2013). Optimizing Port Ecosystems with
IoT Analytics. Retrieved from <https://www.agtinternational.com/wp-content/
uploads/2014/10/AGT_AAG_SmartPrt-2_19oct_15.pdf> (Accessed April 8, 2019).
3. Altiok, T. (2011). Port security/safety, risk analysis, and modeling. Annals of Oper-
ations Research, 187(1):1–3.
4. Amsterdam Smart City (2016). Smart Port: Port of Amster-
dam. Retrieved from <https://amsterdamsmartcity.com/projects/
smart-port-port-of-amsterdam> (Accessed April 8, 2019).
5. Antão, P., Calderón, M., Puig, M., Michail, A., Wooldridge, C., and Darbra, R.
(2016). Identification of Occupational, Health, Safety, Security (OHSS) and Environ-
mental Performance Indicators in Port Areas. Safety Science, 85:266–275.
6. Arelsa Co. (2016). Marinas/Smart Port. Retrieved from http://www.arelsa.com/
visin-empresarial-eng> (Accessed April 8, 2019).
7. Barros, C. F. d. S. and Barros, C. M. (2013). Suitability of Brazilian Ports to Inter-
national Standards of Port Needs: a Case Study in the Port of Salvador. Journal of
Transport Literature, 7(4):23–49.
8. Ben-Arieh, D. (2002). Multi-Criteria Decision Making Methods: A Comparative
Study.
9. Biobaku, T., Lim, G. J., Bora, S., Cho, J., and Parsaei, H. (2016). An Optimal Sonar
28
Placement Approach for Detecting Underwater Threats under Budget Limitations.
Journal of Transportation Security, 9(1):17–34.
10. Braveboy, J. A. (2015). Worldwide Seaport Congestion. Master’s Capstone Thesis.
Master’s thesis, American Public University, Charles Town, WV.
11. Buiza, G., Cepolina, S., Dobrijevic, A., del Mar Cerbán, M., Djordjevic, O., and
González, C. (2015). Current Situation of the Mediterranean Container Ports Re-
garding the Operational, Energy and Environment Areas. International Conference
on Industrial Engineering and Systems Management (IESM). (pp. 530-536). IEEE.
12. Center on Governance (2003). SmartCapital Evaluation Guidelines Report: Per-
formance Measurement and Assessment of SmartCapital, Ottawa Smart Commu-
nity Demonstration Project. University of Ottawa, Ottawa, Canada. Retrieved
from <http://www.christopherwilson.ca/papers/Guidelines_report_Feb2003.
pdf> (Accessed April 8, 2019).
13. Cho, J., Lim, G. J., Biobaku, T., and Kim, S. (2018). LNG Inventory Routing
Problem under Uncertain Weather Condition. International Journal of Production
Economics, 204:18–29.
14. Corbett, J. J., Winebrake, J. J., Green, E. H., Kasibhatla, P., Eyring, V., and Lauer,
A. (2007). Mortality from Ship Emissions: A Global Assessment. Environmental
Science & Technology, 41(24):8512–8518.
15. EcoPorts (2018). Port Environmental Review System (PERS): The Only Port Sec-
tor Specific Environmental Management Standard. Retrieved from <https://www.
ecoports.com/pers> (Accessed April 8, 2019).
16. European Commission (2017). What is EMAS? Retrieved from <http://ec.europa.
eu/environment/emas/index_en.htm> (Accessed April 8, 2019).
29
17. European Union (2017). Environment. Retrieved from <https://europa.eu/
european-union/topics/environment_en> (Accessed April 8, 2019).
18. Fabiano, B., Curro, F., Reverberi, A. P., and Pastorino, R. (2010). Port Safety and
the Container Revolution: A Statistical Study on Human Factor and Occupational
Accidents over the Long Period. Safety Science, 48(8):980–990.
19. Fernández, P., Santana, J. M., Ortega, S., Trujillo, A., Suárez, J. P., Domínguez,
C., Santana, J., and Sánchez, A. (2016). Smartport: A Platform for Sensor Data
Monitoring in a Seaport Based on FIWARE. Sensors, 16(3):417.
20. Hall, R. E., Bowerman, B., Braverman, J., Taylor, J., Todosow, H., and Von Wim-
mersperg, U. (2000). The Vision of a Smart City (No. BNL-67902; 04042). Brookhaven
National Lab., Upton, NY.
21. Hamburg Port Authority (2016a). smartPort Energy. Retrieved from <https://www.
hamburg-port-authority.de/en/hpa-360/smartport/> (Accessed April 8, 2019).
22. Hamburg Port Authority (2016b). smartPort Logistics. Retrieved from <https:
//www.hamburg-port-authority.de/en/hpa-360/smartport/> (Accessed April 8,
2019).
23. Homeland Security Committee (2012). Homeland Security Committee Passes
Smart Port Security Act. Retrieved from <https://www.hstoday.us/channels/
us-coast-guard/house-passes-smart-port-security-act/> (Accessed April 8,
2019).
24. International Maritime Organization (2016a). Energy Management Plans and
Systems. Retrieved from <http://www.imo.org/en/OurWork/Environment/
PollutionPrevention/AirPollution/Documents/Air%20pollution/M6%
20energy%20management%20plan%20and%20system%20final.pdf> (Accessed
April 8, 2019).
30
25. International Maritime Organization (2016b). Maritime Security and
Piracy. Retrieved from <http://www.imo.org/en/OurWork/Security/Pages/
MaritimeSecurity.aspx> (Accessed April 8, 2019).
26. Kalmar Global (2018). Kalmar SmartPort Automation. Retrieved from <https:
//www.kalmarglobal.com/automation/kalmar-smartport/> (Accessed April 8,
2019).
27. Lam, J. S. L. and Notteboom, T. (2014). The Greening of Ports: A Comparison
of Port Management Tools Used by Leading Ports in Asia and Europe. Transport
Reviews, 34(2):169–189.
28. Lama, L. (2016). Shore-to-ship Power and Smart Port So-
lutions. Retrieved from <https://new.abb.com/substations/
port-electrification-and-shore-to-ship-power> (Accessed April 8, 2019).
29. Lim, G. J., Cho, J., Bora, S., Biobaku, T., and Parsaei, H. (2018). Models and Com-
putational Algorithms for Maritime Risk Analysis: A Review. Annals of Operations
Research, 271(2):765–786.
30. Magyar, J. (2015). Becoming a Smart Port. Retrieved from <https:
//www.digitalistmag.com/industries/travel-and-transportation/2015/
08/05/becoming-smart-port-03249293> (Accessed April 8, 2019).
31. Maigret, A. (2014). Sustainability reporting in the port sector. IIIEE Master thesis.
32. MedMaritime SMART PORT (2016). Action Plan towards the SMART
PORT Concept in the Mediterranean Area. Retrieved from <http:
//www.medmaritimeprojects.eu/download/ProjectSmartport/RESERVED_
Folder/D1_1_Smart_port_criteria_Final.pdf> (Accessed April 8, 2019).
31
33. Mokhtari, K., Ren, J., Charles, R., and Wang, J. (2012). Decision Support Frame-
work for Risk Management on Sea Ports and Terminals Using Fuzzy Set Theory and
Evidential Reasoning Approach. Expert Systems with Applications, 39(5):5087–5103.
34. Montesinos, M. (2016). SmartPort: Port Information in Your Hand. Re-
trieved from <https://www.porttechnology.org/technical_papers/smartport_
port_information_in_your_hand#download_article> (Accessed April 8, 2019).
35. Moss Kanter, R. and Litow, S. S. (2009). Informed and Interconnected: A Manifesto
for Smarter Cities. Harvard Business School General Management Unit Working
Paper. (09-141).
36. Nam, T. and Pardo, T. A. (2011). Conceptualizing Smart City with Dimensions of
Technology, People, and Institutions. Proceedings of the 12th Annual International
Digital Government Research Conference: Digital Government Innovation in Chal-
lenging Times. (pp. 282-291). ACM.
37. Ngcobo, L. (2015). TNPA’s Western Cape Ports Now ‘smartPORTS’. Retrieved from
<http://www.transnetnationalportsauthority.net/CorporateAffairs/Press%
20Releases/Archives/Western%20Cape%20ports%20now%20IPMS%20SmartPorts.
pdf> (Accessed April 8, 2019).
38. Olson, P. H. (1994). Handling of Waste in Ports. Marine Pollution Bulletin, 29(6-
12):284–295.
39. Pak, J.-Y., Yeo, G.-T., Oh, S.-W., and Yang, Z. (2015). Port Safety Evaluation from
a Captain’s Perspective: The Korean Experience. Safety Science, 72:172–181.
40. Perera, M. and Abeysekara, B. (2016). Defining KPIs to Measure Eco-Sustainable
Performance at Container Terminals in Sri Lanka. Moratuwa Engineering Research
Conference (MERCon). (pp. 315-320). IEEE.
32

41. Port of Amsterdam (2017). Port of Amsterdam Accelerates Energy Transi-
tion. Retrieved from <https://www.portofamsterdam.com/en/press-release/
port-amsterdam-accelerates-energy-transition> (Accessed April 8, 2019).
42. Port of Rotterdam (2016). Smart Port. Retrieved from <http://smart-port.nl/
en/> (Accessed April 8, 2019).
43. PortTechnology (2016). What is a Smart Port? Retrieved from <https://www.
porttechnology.org/news/what_is_a_smart_port> (Accessed April 8, 2019).
44. Saaty, T. L. (2013). Analytic Network Process. (pp. 64-72). Springer US.
45. Schenone, C., Pittaluga, I., Repetto, S., and Borelli, D. (2014). Noise Pollution
Management in Ports: a Brief Review and The EU MESP Project Experience. Pro-
ceedings of the 21st International Congress on Sound and Vibration, Beijing, China.
(pp. 13-17).
46. Smart Port Hackathon (2017). Smart Port Hackathon. Retrieved from
<https://www.mpa.gov.sg/web/portal/home/media-centre/news-releases/
detail/a25a7b1a-ada1-4787-a734-350ba224450d> (Accessed April 8, 2019).
47. Spangler, W. S., Kreulen, J. T., Chen, Y., Proctor, L., Alba, A., Lelescu, A., and
Behal, A. (2010). A Smarter Process for Sensing the Information Space. IBM Journal
of Research and Development, 54(4):1–13.
48. Statistia (2017). Forecast for Global TEU Capacity of Container Ships
from 2016 to 2020. <https://www.statista.com/statistics/198254/
forecast-for-global-number-of-containership-teus-from-2011/> (Accessed
April 8, 2019).
49. The Maritime Executive (2015). Singapore MPA Unveils Smart Port
33
Initiatives. Retrieved from <http://www.maritime-executive.com/article/
singapore-mpa-unveils-smart-port-initiatives> (Accessed April 8, 2019).
50. The Motorways of the Sea Digital Multi-Channel Platform (2015). Smart
Port. Retrieved from <http://www.onthemosway.eu/wp-content/uploads/2015/
07/1-Smart-Ports-v-2.0.pdf?00cab0> (Accessed April 8, 2019).
51. The United States Environmental Protection Agency (2016). Learn About En-
vironmental Management Systems. Retrieved from <https://www.epa.gov/ems/
learn-about-environmental-management-systems#what-is-an-EMS> (Accessed
April 8, 2019).
52. The World Bank (2017). Retrieved from <https://data.worldbank.org> (Accessed
April 8, 2019).
53. UNCTAD (1992). Port Marketing and the Challenge of the Third Generation Port.
54. UNCTAD (1999). The fourth generation port. UNCTAD Ports Newsletter, 19:9–12.
55. Vairo, T., Quagliati, M., Del Giudice, T., Barbucci, A., and Fabiano, B. (2017). From
Land-to Water-Use-Planning: A Consequence Based Case-Study Related to Cruise
Ship Risk. Safety Science, 97(8):120–133.
56. Velasquez, M. and Hester, P. T. (2013). An Analysis of Multi-Criteria Decision Making
Methods. International Journal of Operations Research, 10(2):56–66.
57. World Port Hackathon (2016). World Port Hackathon. Retrieved from <http://
worldporthackathon.com> (Accessed April 8, 2019).
34

A Appendix
Figure A.1: Comparison of the sub-indices (activity domain indices) for 14 ports, dataunavailability is marked with (-)
35
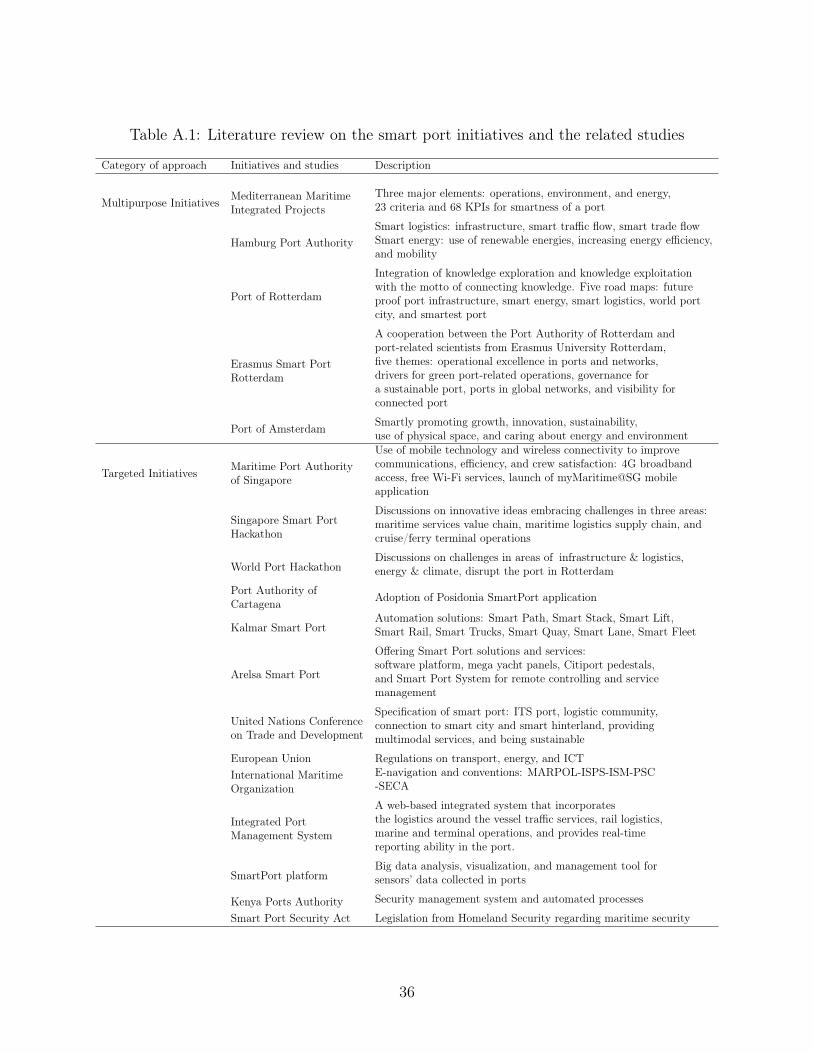
Table A.1: Literature review on the smart port initiatives and the related studies
Category of approach Initiatives and studies Description
Multipurpose Initiatives Mediterranean MaritimeIntegrated Projects
Three major elements: operations, environment, and energy,23 criteria and 68 KPIs for smartness of a port
Hamburg Port AuthoritySmart logistics: infrastructure, smart traffic flow, smart trade flowSmart energy: use of renewable energies, increasing energy efficiency,and mobility
Port of Rotterdam
Integration of knowledge exploration and knowledge exploitationwith the motto of connecting knowledge. Five road maps: futureproof port infrastructure, smart energy, smart logistics, world portcity, and smartest port
Erasmus Smart PortRotterdam
A cooperation between the Port Authority of Rotterdam andport-related scientists from Erasmus University Rotterdam,five themes: operational excellence in ports and networks,drivers for green port-related operations, governance fora sustainable port, ports in global networks, and visibility forconnected port
Port of Amsterdam Smartly promoting growth, innovation, sustainability,use of physical space, and caring about energy and environment
Targeted Initiatives Maritime Port Authorityof Singapore
Use of mobile technology and wireless connectivity to improvecommunications, efficiency, and crew satisfaction: 4G broadbandaccess, free Wi-Fi services, launch of myMaritime@SG mobileapplication
Singapore Smart PortHackathon
Discussions on innovative ideas embracing challenges in three areas:maritime services value chain, maritime logistics supply chain, andcruise/ferry terminal operations
World Port HackathonDiscussions on challenges in areas of infrastructure & logistics,energy & climate, disrupt the port in Rotterdam
Port Authority ofCartagena Adoption of Posidonia SmartPort application
Kalmar Smart PortAutomation solutions: Smart Path, Smart Stack, Smart Lift,Smart Rail, Smart Trucks, Smart Quay, Smart Lane, Smart Fleet
Arelsa Smart Port
Offering Smart Port solutions and services:software platform, mega yacht panels, Citiport pedestals,and Smart Port System for remote controlling and servicemanagement
United Nations Conferenceon Trade and Development
Specification of smart port: ITS port, logistic community,connection to smart city and smart hinterland, providingmultimodal services, and being sustainable
European Union Regulations on transport, energy, and ICTInternational MaritimeOrganization
E-navigation and conventions: MARPOL-ISPS-ISM-PSC-SECA
Integrated PortManagement System
A web-based integrated system that incorporatesthe logistics around the vessel traffic services, rail logistics,marine and terminal operations, and provides real-timereporting ability in the port.
SmartPort platformBig data analysis, visualization, and management tool forsensors’ data collected in ports
Kenya Ports Authority Security management system and automated processes
Smart Port Security Act Legislation from Homeland Security regarding maritime security
36
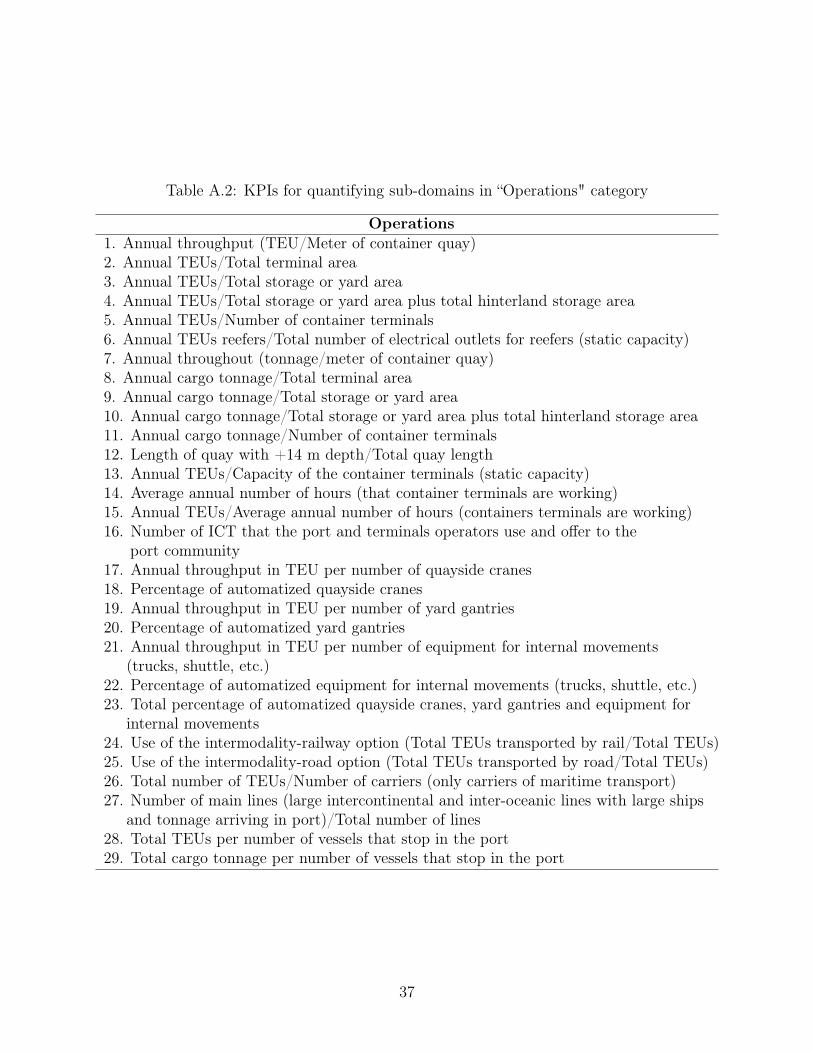
Table A.2: KPIs for quantifying sub-domains in “Operations" category
Operations1. Annual throughput (TEU/Meter of container quay)2. Annual TEUs/Total terminal area3. Annual TEUs/Total storage or yard area4. Annual TEUs/Total storage or yard area plus total hinterland storage area5. Annual TEUs/Number of container terminals6. Annual TEUs reefers/Total number of electrical outlets for reefers (static capacity)7. Annual throughout (tonnage/meter of container quay)8. Annual cargo tonnage/Total terminal area9. Annual cargo tonnage/Total storage or yard area10. Annual cargo tonnage/Total storage or yard area plus total hinterland storage area11. Annual cargo tonnage/Number of container terminals12. Length of quay with +14 m depth/Total quay length13. Annual TEUs/Capacity of the container terminals (static capacity)14. Average annual number of hours (that container terminals are working)15. Annual TEUs/Average annual number of hours (containers terminals are working)16. Number of ICT that the port and terminals operators use and offer to the
port community17. Annual throughput in TEU per number of quayside cranes18. Percentage of automatized quayside cranes19. Annual throughput in TEU per number of yard gantries20. Percentage of automatized yard gantries21. Annual throughput in TEU per number of equipment for internal movements
(trucks, shuttle, etc.)22. Percentage of automatized equipment for internal movements (trucks, shuttle, etc.)23. Total percentage of automatized quayside cranes, yard gantries and equipment for
internal movements24. Use of the intermodality-railway option (Total TEUs transported by rail/Total TEUs)25. Use of the intermodality-road option (Total TEUs transported by road/Total TEUs)26. Total number of TEUs/Number of carriers (only carriers of maritime transport)27. Number of main lines (large intercontinental and inter-oceanic lines with large ships
and tonnage arriving in port)/Total number of lines28. Total TEUs per number of vessels that stop in the port29. Total cargo tonnage per number of vessels that stop in the port
37

Table A.3: KPIs for quantifying sub-domains in “Environment" category
Environment1. Number of environmental management systems based on international standards
(e.g., EMAS or ISO 14001) implemented by port authority and port operators/Totalnumber of terminal operators
2. Total hazardous wastes generated by the terminal operators disaggregated by sourcesper TEUs (Wastes from ships (i.e., MARPOL wastes) are not included.)
3. Total wastes collected in a selective way from all port activities (organic, plastic,paper,wood, electronics, etc.) per total port area. (Wastes from ships (i.e., MARPOLwastes) are not included.)
4. Total wastes generated that are intended to operations of reuse, recycling, andvaporization disaggregated per kind of wastes per total port area (Tons/m2)
5. Total water consumption by all port activities per total port area (m3/m2)6. Total water consumption by terminal operators per TEUs (m3/TEUs)7. Total water consumed by ships per vessels stops (m3/Vessels stops)8. Volume of water consumption that came from reuse operations (in all port area) per
total volume of water consumed (%)9. Total wastewater generated by all port activities per total port area (m3/m2)10. Total wastewater generated by the terminal operators per TEUs (m3/TEUs)11. Total volume of wastewater from all port activities that are treated for reuse per
total volume of wastewater in the port (%)12. Port activities covered by environmental management systems (%)13. Number of waste management plans implemented by port authority and port
operators / Total number of terminal operators14. Port activities covered by waste management plans (%)15. Total wastes generated by all port activities (Tons). Wastes from ships
(i.e., MARPOL wastes) are not included per total port area16. Total wastes generated by terminal operators per TEUs (Tons/TEUs). The wastes
from ships (i.e., MARPOL wastes) are not included.17. Total wastes generated by ships (MARPOL wastes) disaggregated per kind of wastes
and per vessels stops (Tons/Vessels stops)18. Total hazardous wastes generated by all port activities disaggregated by sources per
total port area. Wastes from ships (i.e., MARPOL wastes) are not included.(CO2 equivalents Tons/m2)
19. Lden - noise pollution20. Lnight - noise pollution21. Total leaks and spills (Tons) of polluting substances at sea per vessels stops22. Number of monitoring systems to assess water quality (temperature, salinity, fecal
coliform, etc.) in port area per total quay berth23. Number of monitoring systems to assess air quality in port area per total port area24. Greenhouse gas emissions from all port activities per total port area25. Total annual GHG emissions per TEU26. Total annual air emission27. Amount of recycled waste
38
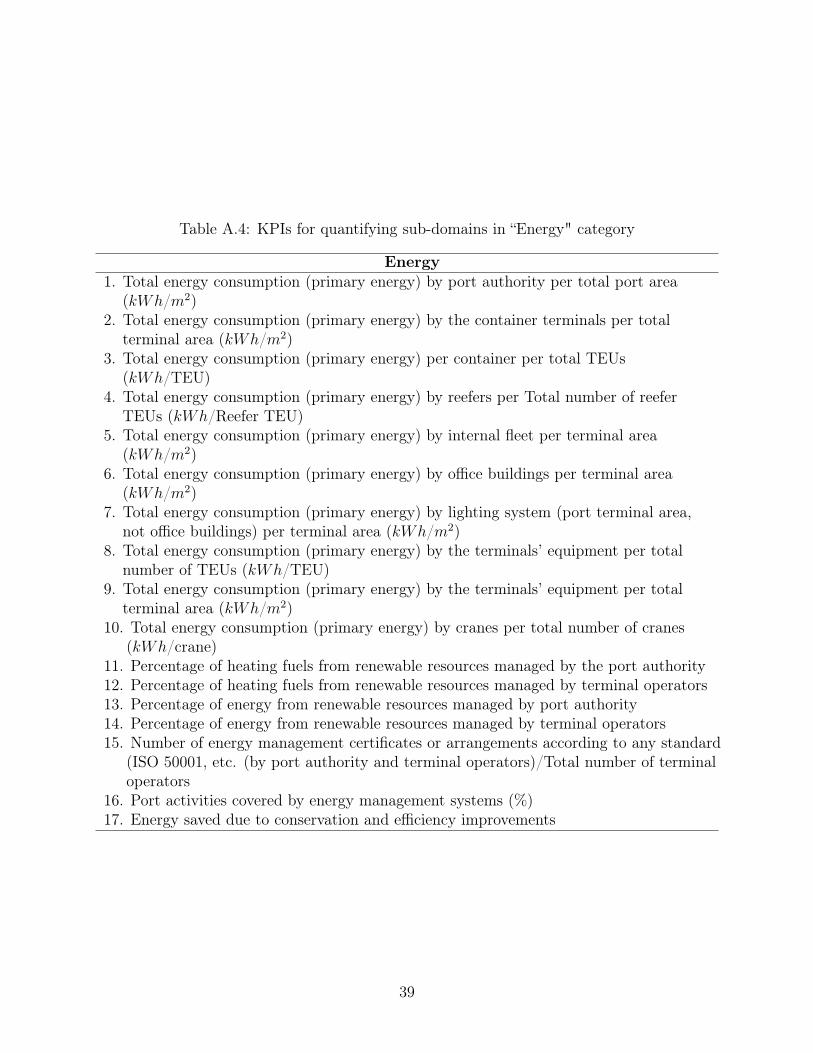
Table A.4: KPIs for quantifying sub-domains in “Energy" category
Energy1. Total energy consumption (primary energy) by port authority per total port area
(kWh/m2)2. Total energy consumption (primary energy) by the container terminals per total
terminal area (kWh/m2)3. Total energy consumption (primary energy) per container per total TEUs
(kWh/TEU)4. Total energy consumption (primary energy) by reefers per Total number of reefer
TEUs (kWh/Reefer TEU)5. Total energy consumption (primary energy) by internal fleet per terminal area
(kWh/m2)6. Total energy consumption (primary energy) by office buildings per terminal area
(kWh/m2)7. Total energy consumption (primary energy) by lighting system (port terminal area,
not office buildings) per terminal area (kWh/m2)8. Total energy consumption (primary energy) by the terminals’ equipment per total
number of TEUs (kWh/TEU)9. Total energy consumption (primary energy) by the terminals’ equipment per total
terminal area (kWh/m2)10. Total energy consumption (primary energy) by cranes per total number of cranes
(kWh/crane)11. Percentage of heating fuels from renewable resources managed by the port authority12. Percentage of heating fuels from renewable resources managed by terminal operators13. Percentage of energy from renewable resources managed by port authority14. Percentage of energy from renewable resources managed by terminal operators15. Number of energy management certificates or arrangements according to any standard
(ISO 50001, etc. (by port authority and terminal operators)/Total number of terminaloperators
16. Port activities covered by energy management systems (%)17. Energy saved due to conservation and efficiency improvements
39

Table A.5: KPIs for quantifying sub-domains in “Safety & Security" category
Safety & Security1. Number of safety and security arrangements and certificates2. Scope of the safety and security arrangements and certificates (port activities covered
by the safety and security management systems)3. Annual number of nautical accidents (significant or incidents in areas under
the jurisdiction of the port authorities)4. Number of failures to comply (port regulations, industry safety standards, etc.)5. Number of spills (nautical or industrial)6. Number of fires and explosions (nautical or industrial)7. Number of foundering8. Investment in safety9. Number of port security incidents (different types of breaches-e.g., access without
authorization, thefts and claims, jobs without authorization, etc.)10. Number of security drills11. Investment in protection (maintenance and investment)12. Compliance with ISPS requirements13. Percentage of employees trained in the organization’s anti-corruption policies
and procedures14. Number of Security meetings (police forces and authorities, private security
and technological measures firms, shipping companies, shipping agents,and foreign consulates)
15. Number of port security inspections
40