”A Floating Cash Machine” - Hugin Onlinereports.huginonline.com/895832/114855.pdf”A Floating...
30
”A ”A Floating Floating Cash Cash Machine Machine ” ” Frontline Presentation NYSE : FRO OSE : FRO Lehman European Oil Company Seminar 17th March 2003
Transcript of ”A Floating Cash Machine” - Hugin Onlinereports.huginonline.com/895832/114855.pdf”A Floating...

”A ”A FloatingFloating Cash Cash MachineMachine””
Frontline PresentationNYSE : FRO OSE : FRO
Lehman European Oil Company Seminar17th March 2003

The Frontline StoryYear Party Acquired Oil Tankers Shares Value USD Mill.1996 Frontline AB 71996 Goldtech 1 Yes Yes 491996 Bilspedition 1 Yes Yes 491996 Seatankers 6 3571997 Hyundai New buildings 10 6501997 London Overseas Freighters 3 Yes Yes 1551998 Seatankers 1 Yes 421998 Alliance Chartering 1998 Independent Tankers 10 7701999 ICB Shipping 8 Yes Yes 2601999 Mosvold Farsund 1 Yes Yes 452000 Wilh. Wilhelmsen 2 Yes Yes 902000 NYK Front Tobago 1 Yes 372000 Golden Ocean Front Tina 1 Yes 742000 Euronav 2 Yes 952000 Golden Ocean Ltd. 13 Yes Yes 9902001 Sasebo New buildings 2 1062001 Hitachi New buildings 3 2242001 Mosvold Shipping 3 Yes Yes 2442001 Bergesen Ships 5 399
Total Ships 80 4 636
Vessel Built Dwt Yard DH dwt
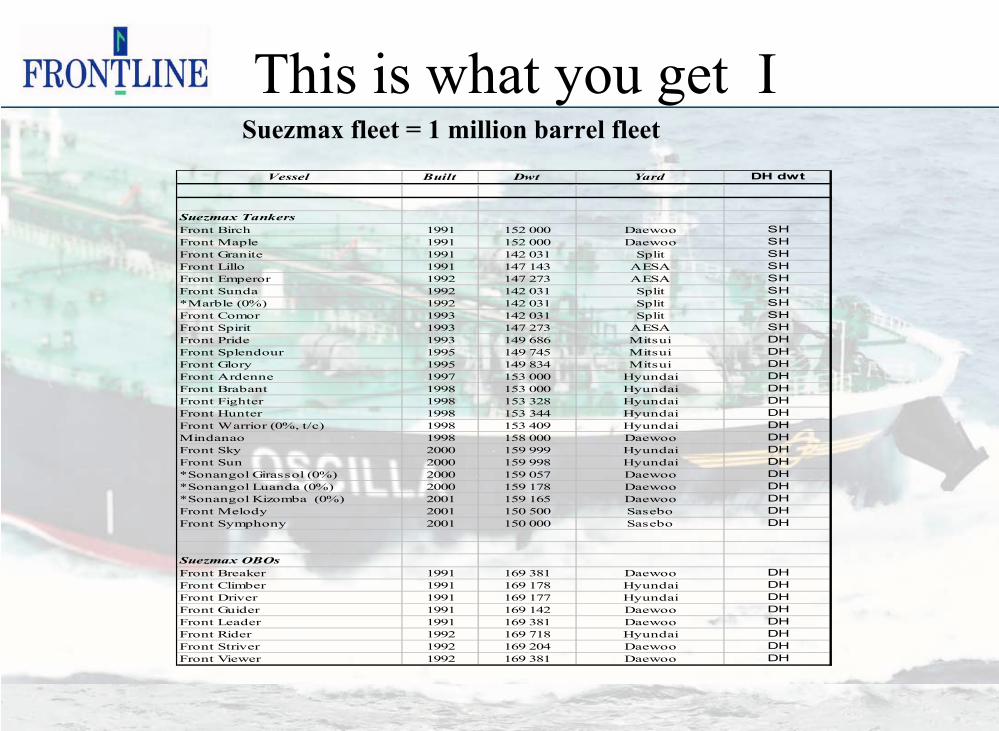
Suezmax TankersFront Birch 1991 152 000 Daewoo SHFront Maple 1991 152 000 Daewoo SHFront Granite 1991 142 031 Split SHFront Lillo 1991 147 143 AESA SHFront Emperor 1992 147 273 AESA SHFront Sunda 1992 142 031 Split SH*Marble (0%) 1992 142 031 Split SHFront Comor 1993 142 031 Split SHFront Spirit 1993 147 273 AESA SHFront Pride 1993 149 686 Mitsui DHFront Splendour 1995 149 745 Mitsui DHFront Glory 1995 149 834 Mitsui DHFront Ardenne 1997 153 000 Hyundai DHFront Brabant 1998 153 000 Hyundai DHFront Fighter 1998 153 328 Hyundai DHFront Hunter 1998 153 344 Hyundai DHFront Warrior (0%, t/c) 1998 153 409 Hyundai DHMindanao 1998 158 000 Daewoo DHFront Sky 2000 159 999 Hyundai DHFront Sun 2000 159 998 Hyundai DH*Sonangol Girassol (0%) 2000 159 057 Daewoo DH*Sonangol Luanda (0%) 2000 159 178 Daewoo DH*Sonangol Kizomba (0%) 2001 159 165 Daewoo DHFront Melody 2001 150 500 Sasebo DHFront Symphony 2001 150 000 Sasebo DH
Suezmax OBOsFront Breaker 1991 169 381 Daewoo DHFront Climber 1991 169 178 Hyundai DHFront Driver 1991 169 177 Hyundai DHFront Guider 1991 169 142 Daewoo DHFront Leader 1991 169 381 Daewoo DHFront Rider 1992 169 718 Hyundai DHFront Striver 1992 169 204 Daewoo DHFront Viewer 1992 169 381 Daewoo DH
Suezmax fleet = 1 million barrel fleet
This is what you get I

VLCC fleet = 2 million barrels fleet
This is what you get IIVessel Built Dwt Yard DH dwt
VLCCsFront Sabang 1990 285 715 Daewoo SHFront Vanadis 1990 285 782 Daewoo SHFront Highness 1991 284 420 Hyundai SHFront Lady 1991 284 420 Hyundai SHFront Lord 1991 284 420 Hyundai SHFront Duke 1992 284 420 Hyundai SHFront Duchess 1993 284 480 Hyundai SHFront Ace 1993 275 546 Hitachi SHFront Tobago (40%) 1993 260 619 IHI SHDundee (50.1%) 1993 302 432 Daewoo DHEdinburgh (50.1%) 1993 302 493 Daewoo DHGolden Stream 1995 275 616 Hitachi SHGolden Fountain (50%) 1995 301 665 Hitachi SHNavix Astral 1996 275 644 Hitachi SHNew Vanguard 1998 300 058 Hitachi DHFront Century (0%, t/c) 1998 311 189 Hyundai DHNew Vista 1998 300 149 Hitachi DHFront Champion (0%, t/c) 1998 311 286 Hyundai DHFront Chief (0%, t/c) 1999 311 224 Hyundai DHNew Circassia (50%) 1999 306 009 MHI DHPacific Lagoon (50%) 1999 305 839 MHI DHFront Commander (0%, t/c) 1999 311 168 Hyundai DHFront Crown (0%, t/c) 1999 311 176 Hyundai DHOpalia 1999 302 193 Kawasaki DHFront Commerce 1999 300 144 Hitachi DHFront Comanche 1999 300 133 Hitachi DHFront Commodore 2000 298 620 Hitachi DHOscilla 2000 302 193 Kawasaki DHFront Tina 2000 298 500 Kawasaki DHIchiban (33.3%) 2000 298 552 Hitachi DHBritish Pioneer (0%, t/c) 2000 307 000 Samsung DHBritish Progress (0%, t/c) 2000 307 000 Samsung DHBritish Purpose (0&, t/c) 2000 307 000 Samsung DHBritish Pride (0%, t/c) 2000 307 000 Samsung DHAriake (33.3%) 2001 298 530 Hitachi DHSakura I (33.3%) 2001 298 530 Hitachi DHFront Eagle 2002 309 064 Samsung DHTanabe (33.3%) 2002 296 000 Hitachi DHFront Serenade 2002 299 152 Hitachi DHHakata (33.3%) 2002 296 000 Hitachi DHFront Stratus 2002 298 500 Hitachi DHFront Falcon 2002 308 000 Samsung DHFront Page 2002 298 500 Hitachi DHHull No. 1412 tbn Front Hawk July 2003 308 000 Samsung DH

Tanker fleet (incl. 100% JVs) in dwt
0
2 000 000
4 000 000
6 000 000
8 000 000
10 000 000
12 000 000
14 000 000
16 000 000
18 000 000
Frontline OSG Teekay Bergesen
Dw
t
Average age of tanker fleet
0,00
5,00
10,00
15,00
20,00
25,00
Frontline OSG Teekay Bergesen
Nu
mb
er o
f ye
ars
A unique fleet in size and age

How are we different ?
• The largest and most modern fleet• Pure crude oil exposure• The lowest operating cost• The lowest administration cost• The highest share liquidity• Pioneer attitude ( Alliance , Tankers , Golden Ocean, BP )• Focus around ROE – Aggressive use of debt.• The highest payout ratio.• Insiders own approximately 50% of the Company.

Profit & Loss 2002
Q4 01 Q4 02 USD million 2 002 2001
109,6 159,4 Net operating revenues 429,0 647,30,8 -1,5 Gain / loss on sale of vessels -4,3 35,6
47,2 51,7 Total expenses 187,1 176,563,1 106,1 Operating profit before depreciation (EBITDA) 237,6 506,532,5 36,2 Depreciation 139,9 121,730,7 69,9 Operating profit (EBIT) 97,7 384,813,2 -2,9 Financial items -90,5 -33,943,9 67,0 Net profit (loss) before min. & taxes 7,2 350,80,2 0,0 Taxes 0,0 0,40,0 0,0 Cumulative effect of change in accounting principle -14,1 32,3
43,7 67,1 Net profit (loss) -6,9 382,7
0,57 0,88 EPS before cumulative effect of change in accounting principle 0,09 4,57Cumulative effect of change in accounting principle -0,18 0,42
0,57 0,88 EPS -0,09 4,99

Balance Sheet
Assets 2002 2 001 Liabilities/Equity 2002 2 001USD millionShort term Short termCash and Bank deposits 100,3 189,3 Short term interest bearing debt 167,8 227,6Marketable securities 0,3 1,2 Other current liabilities 74,6 87,5Other current assets 132,8 87,5
Long term Long termNewbuildings 27,4 102,8 Long term interest bearing debt 1 277,7 1 164,4Vessels and equipment, net 2 638,1 2 514,2 Other long term liabilites 287,7 295,1Associated companies 119,3 109,9 Minority 0,0 6,8Goodwill 0,0 14,0 Stockholder's equity 1 228,2 1 252,4Deferred charges and other assets 17,7 15,0Total assets 3 035,9 3 033,8 Total stockholders' equity and liab. 3 035,9 3 033,8

The MarketThe Market

VLCC TCEs / Suezmax TCEs
0
20
40
60
80
100
jan-
99
mar
-99
mai
-99
jul-9
9
sep-
99
nov-
99
jan-
00
mar
-00
mai
-00
jul-0
0
sep-
00
nov-
00
jan-
01
mar
-01
mai
-01
jul-0
1
sep-
01
nov-
01
jan-
02
mar
-02
mai
-02
jul-0
2
sep-
02
nov-
02
jan-
03
Date
$/da
y
VLCC TCEs Suezmax TCEs
The Recent Developments

The Explanation I
• Start-up August 2002– Low OPEC production – Low inventory levels– VLCC fleet smaller than when market peaked in 2000.
• Development September – October– Increased seasonal demand– Weather shutdown of production US Gulf – Strong growth in Asia ( India, China, Korea, Taiwan)– Japan / Korea nuclear shutdown– Positive refinery margin in US– Rapidly falling oil inventories– Dollar weakened against Won / Yen
• Met by increased OPEC production – Higher Rates

The Explanation II
• The second stage of the recovery November-March– More forward fixing by oil companies – Iraq situation– Venezuela strike– M/T Prestige - accident– Cold weather– High gas prices– Large crack spreads
• Combined these factors have pushed freight market to new highs and oil prices over USD 30 /bbls
The War Case• Historically a war is likely to push freight rates to new highs
created by logistical fleet inefficiencies like increased floating storage, war risk premiums and larger safety margins from the charterer.
• War or no war – we presently have the lowest US oil inventories for 27 years. This will have to be corrected. The only remedy MEG Crude. Strongly positive for Tankers

The Inventory Situation
2,300
2,400
2,500
2,600
2,700
2,800
2,900
Jan Mar Mai Jul Sep Nov
mbl
Source: IEA, DoE
Commercial inventories, OECD
Oil inventories – OECD
5-year high range
5-year low range2003
2002

US Petroleum Stocks – Seriously Low
API crude stocks 1990-2003 (avg. month)
220,000
240,000
260,000
280,000
300,000
320,000
340,000
360,000
380,000
400,000
Jan
Feb
Mar Apr
Mai
Jun
Jul
Aug
Sep
Okt
Nov
Des
Source: API, Bloomberg
1990-02 Max1990-02 Min200220035Y Avg.
12Y range
API gasoline stocks (avg. month)
170,000
180,000
190,000
200,000
210,000
220,000
230,000
240,000
250,000
Jan
Feb
Mar Ap
r
Mai
Jun
Jul
Aug
Sep
Okt
Nov
Des
Source: API, Bloomberg
1990-02 Max1990-02 Min200220035Y Avg.
12Y range
API destilled fuel stocks (avg. month)
80,000
90,000
100,000
110,000
120,000
130,000
140,000
150,000
160,000
Jan
Feb
Mar Apr
Mai
Jun
Jul
Aug
Sep
Okt
Nov
Des
Source: API, Bloomberg
1990-02 Max1990-02 Min200220035Y Avg.
12Y range
US Natural Gas Storage 1994-03
0
500
1000
1500
2000
2500
3000
3500
Jan Feb Mar Apr May Jun Jul Aug Sep Oct Nov DecSource: Bloomberg
9Y High9Y Low9Y Avg200220039Y range
Source: ABG Sundal Collier
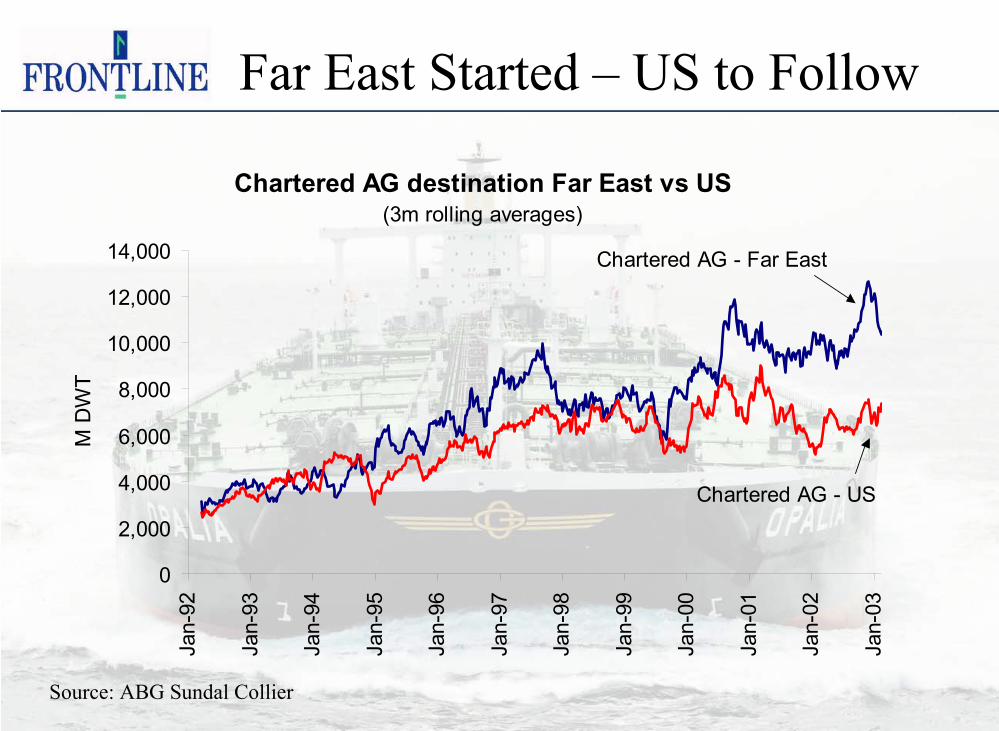
Far East Started – US to Follow
Chartered AG destination Far East vs US(3m rolling averages)
0
2,000
4,000
6,000
8,000
10,000
12,000
14,000
Jan-
92
Jan-
93
Jan-
94
Jan-
95
Jan-
96
Jan-
97
Jan-
98
Jan-
99
Jan-
00
Jan-
01
Jan-
02
Jan-
03
M D
WT
Chartered AG - Far East
Chartered AG - US
Source: ABG Sundal Collier

The proof of rising US crude imports
Chartered AG destination US vs Imported Crude US (API figures) (5W lag)
2,0003,0004,0005,0006,0007,0008,0009,000
10,000
Jan-
02
Feb-
02M
ar-0
2
Apr-0
2
May
-02
Jun-
02
Jul-0
2
Aug-
02
Sep-
02
Oct
-02
Nov
-02
Dec
-02
Jan-
03
Feb-
03M
ar-0
3
7,500
8,000
8,500
9,000
9,500
10,000
US Crude Imports (4w mov avg,'000 bpd, r.h. scale)
Chartered AG dest US (4w mov avg, '000 tonnes, l.h. scale)
US imports are on the rise and the current activity level is consistent with US crude imports above 9mbd. This level must be sustained for up to 22 months to normalize the US oil inventory situation. Current activity levels represent no blip.
Import level required to rebuild US oil stocks by 2004
Source: ABG Sundal Collier
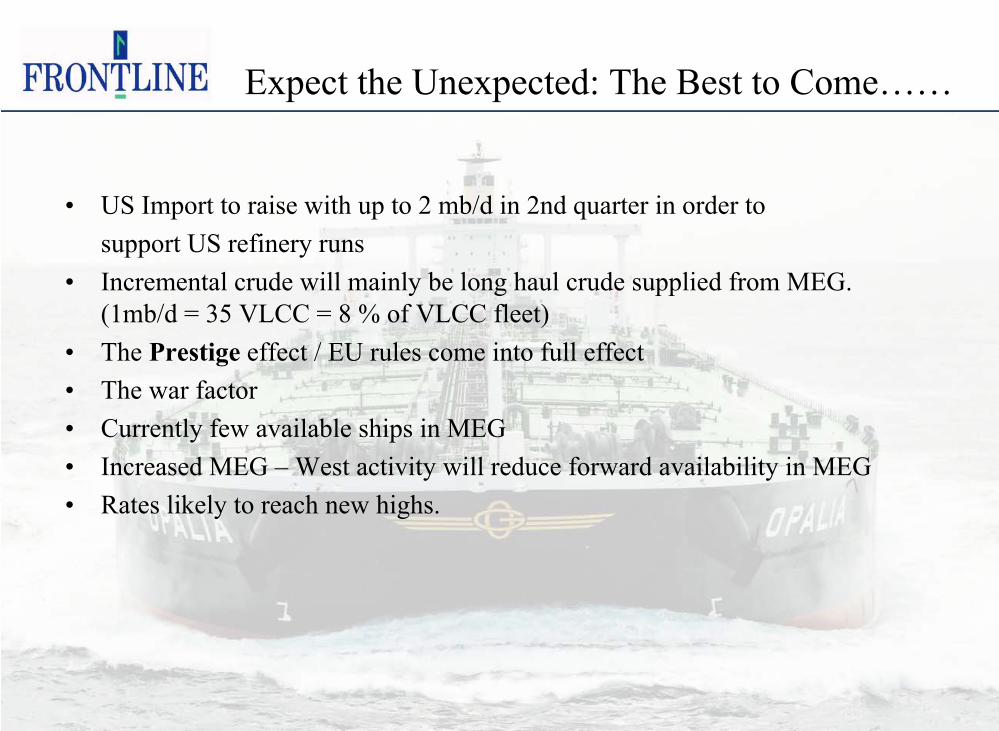
Expect the Unexpected: The Best to Come……
• US Import to raise with up to 2 mb/d in 2nd quarter in order to support US refinery runs
• Incremental crude will mainly be long haul crude supplied from MEG. (1mb/d = 35 VLCC = 8 % of VLCC fleet)
• The Prestige effect / EU rules come into full effect• The war factor• Currently few available ships in MEG• Increased MEG – West activity will reduce forward availability in MEG• Rates likely to reach new highs.

and it may last longer……
• Inventories will have to be rebuilt.• No net VLCC fleet growth 2003 – 2005. (61 old VLCC / 65 NB)• High Gas prices create substitutional demand for oil.• Asian oil import dependent economies strong demand drivers.• Special factors : Weather / Japan Nuclear / Water reservoirs.• Comfortable yard order books and weaker USD put upwards pressure on
NB and second-hand prices.• The long-term after war effects.
– Lower oil price - stimulates demand.– A reduction in the current backwardation favors higher inventories.– An Iraqi stabilization will give higher and more stable Iraqi production.
• Increased activity / firmer rates for long-term T/C market.• Conclusion : It might last longer than people anticipate

The Frontline ArgumentsThe Frontline Arguments
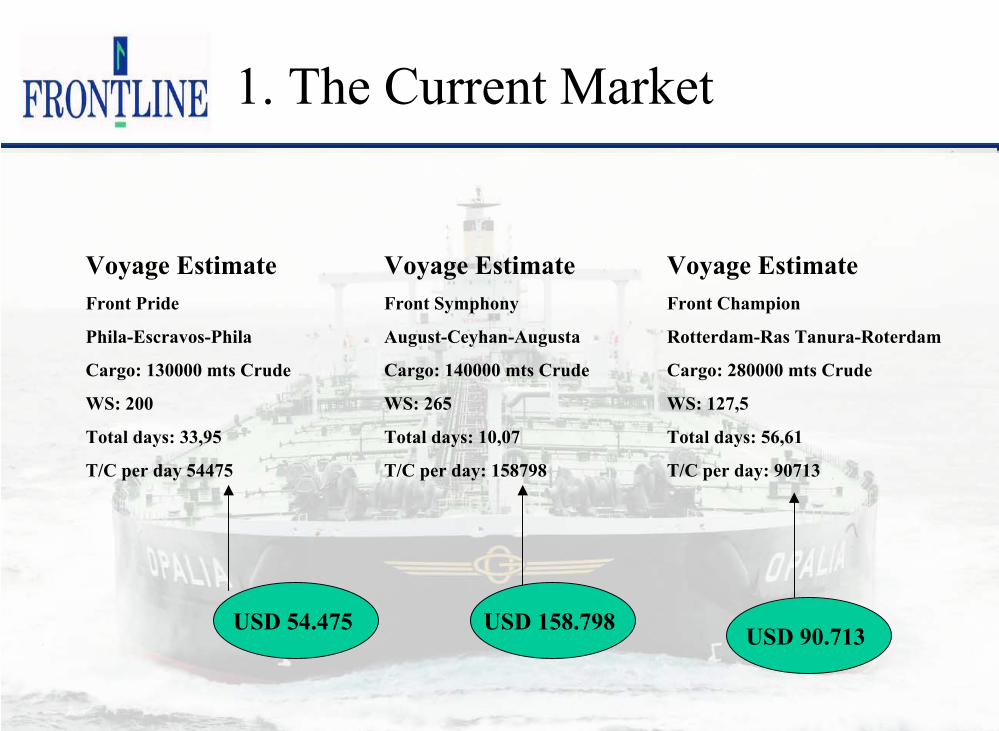
Voyage EstimateFront Pride
Phila-Escravos-Phila
Cargo: 130000 mts Crude
WS: 200
Total days: 33,95
T/C per day 54475
Voyage EstimateFront Symphony
August-Ceyhan-Augusta
Cargo: 140000 mts Crude
WS: 265
Total days: 10,07
T/C per day: 158798
Voyage EstimateFront Champion
Rotterdam-Ras Tanura-Roterdam
Cargo: 280000 mts Crude
WS: 127,5
Total days: 56,61
T/C per day: 90713
USD 54.475 USD 158.798 USD 90.713
1. The Current Market

2. Low Cash Breakeven
0
5 000
10 000
15 000
20 000
25 000
OBO Suezmax VLCC
USD
per d
ay t/cInstalmentsInterestOpex
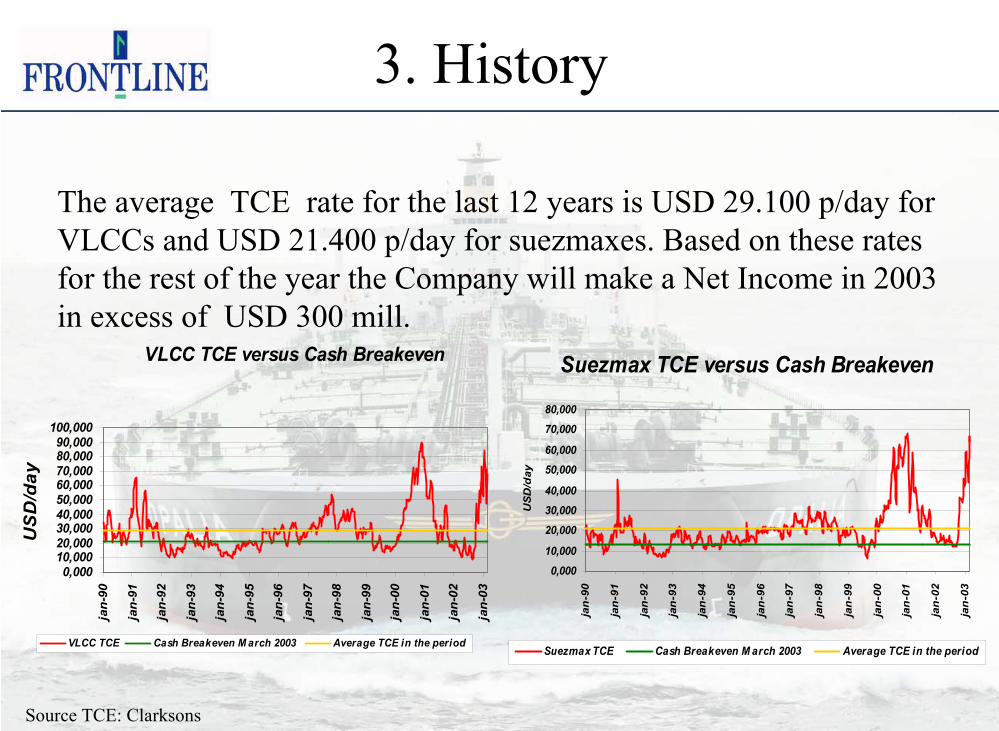
Source TCE: Clarksons
The average TCE rate for the last 12 years is USD 29.100 p/day forVLCCs and USD 21.400 p/day for suezmaxes. Based on these rates for the rest of the year the Company will make a Net Income in 2003 in excess of USD 300 mill.
Suezmax TCE versus Cash Breakeven
0,00010,000
20,00030,00040,000
50,00060,000
70,00080,000
jan
-90
jan
-91
jan
-92
jan
-93
jan
-94
jan
-95
jan
-96
jan
-97
jan
-98
jan
-99
jan
-00
jan
-01
jan
-02
jan
-03
USD
/day
Suezmax TCE Cash Breakeven M arch 2003 Average TCE in the period
VLCC TCE versus Cash Breakeven
0,00010,00020,00030,00040,00050,00060,00070,00080,00090,000
100,000
jan-
90
jan-
91
jan-
92
jan-
93
jan-
94
jan-
95
jan-
96
jan-
97
jan-
98
jan-
99
jan-
00
jan-
01
jan-
02
jan-
03
US
D/d
ay
VLCC TCE Cash Breakeven M arch 2003 Average TCE in the period
3. History

4. The ExposureNAV Development
+/- 10 % in ship prices +/- USD 4 per share
One Quarter TCE 55’/40’ + USD 3 per share
-5,00
0,00
5,00
10,00
15,00
20,00
10 000 20 000 30 000 40 000 50 000 60 000 70 000 80 000 90 000
VLCC Rates ($ per day)
Ear
nin
gs
per
sh
are
($)
Current share price
The Earnings Sensitivity

5. A Changed Company
2000- 2002 2003Vessels 38 72Cash ($ mill.) 65 160 Cap.Ex ($ mill.) 1.700 59 Net Cap Ex. ($ mill.) 700 2Corporate debt ($ mill.) 150 0VLCC B/E ($/day) 24.100 20.900Suezmax B/E ($/day) 18.200 13.600Market Cap ($ mill) 1.900* 870*) May 2001

6. A Dividend Story
• Frontline has a minimum cash requirement in the loan agreements of approximately USD 80 million.
• The management feels that financial flexibility is achieved with a cash position of between USD 150 - 200 million.
• This position is reached in the Q1 -2003.• Total net committed future Cap ex as of 31.03.03 is USD 2 million.• All excess cash flow can be freely distributed to shareholders.• To achieve a 10 % direct yield on the existing market cap Frontline will
need VLCC rates of $24,600, and Suezmax rates of $17,300.• A 20 % yield can be supported with VLCC rates of $28,300 and Suezmax
rates of $21,000.• Remember historic 12 year average T/C rates VLCC 29,100, Suezmax
21,400.

7. Pricing
Shareprice EPS CPS Book/Share P/E P/CF P/BookFRO 11,60 3,25 4,85 16,06 3,6 2,4 0,7OMI 4,47 0,65 1,32 5,69 6,9 3,4 0,8Teekay 38,40 4,60 9,53 35,31 8,3 4,0 1,1
Source : Jefferies Estimate
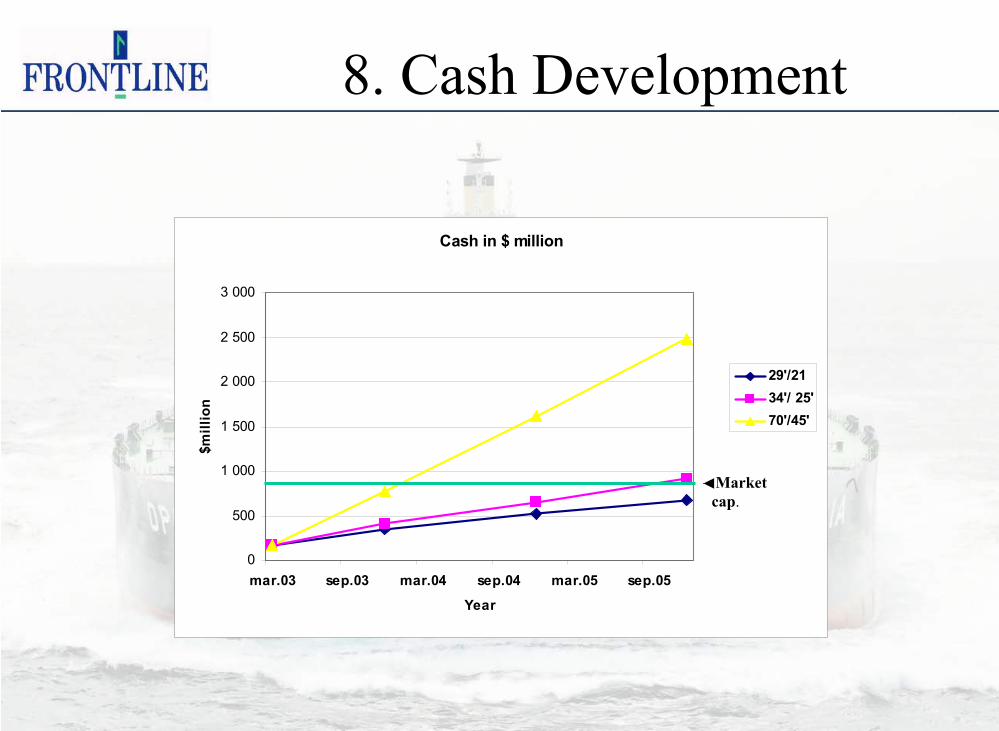
8. Cash Development
Cash in $ million
0
500
1 000
1 500
2 000
2 500
3 000
mar.03 sep.03 mar.04 sep.04 mar.05 sep.05Year
$mill
ion
29'/2134'/ 25'70'/45'
Market cap.

9. A Floating Cash MachineAn illustrative Calculation Exercise
T/C Rates [USD/day] 70 000 45 000
Cash Break Even [USD/day] 20 900 13 600
No of vessels exposed 35 29
Daily Cash Generation [USD] 1 693 950 910 600
Total [USD/day] 2 604 5501. Corporate earnings to be adjusted for charter in / out.2. Daily scheduled debt repayment is close to USD 500.000 per day.3. Current market : VLCC 90.000 USD/day Suez 55.000 USD/day


![Task 1 Strategic PV Analysis and Outreach€¦ · (BAPV, BIPV) Grid-connected centralized [MW] (Ground, floating, agricultural…) Total [MW] 1992 338 187 - 525 1993 423 346 - 769](https://static.fdocuments.us/doc/165x107/5fd08a5b0c749d0f6b2c654b/task-1-strategic-pv-analysis-and-outreach-bapv-bipv-grid-connected-centralized.jpg)