A Five-Coordinate Phosphino/Acetate Iron(II) Scaffold … · ‡Department of Chemistry and...
17
S-1 A Five-Coordinate Phosphino/Acetate Iron(II) Scaffold that Binds N 2 , N 2 H 2 , N 2 H 4 , and NH 3 in the Sixth Site Caroline T. Saouma, ‡ Curtis E. Moore, † Arnold L. Rheingold, † Jonas C. Peters* ,‡ ‡ Department of Chemistry and Chemical Engineering, California Institute of Technology, Pasadena, CA, 91125, U.S.A. † Department of Chemistry and Biochemistry, University of California, San Diego, La Jolla, CA, 92093, U.S.A. Table of Contents Experimental Procedures……………………………………………………………………..…S-2 Chart S1. Plot of 3 J HH vs. N-N bond distance in M 2 (trans-N 2 H 2 ) species…………………... S-11 Figure S1. 1 H NMR spectrum of 1 (THF-d 8 , 25 o C)………………………………………….S-12 Figure S2. Overlay of rRaman spectra of 14 N-2 and 15 N-2…………………………………...S-13 Figure S3. 15 N NMR spectrum (d 8 -THF, -75 o C) of 2………………………………………...S-13 Figure S4. 31 P NMR spectrum (d 8 -THF, -75 o C) of 2……………………...…………………S-13 Figure S5. 31 P NMR spectrum (d 8 -THF, -75 o C) of 3………………………………………...S-14 Figure S6. 1 H NMR spectrum (d 8 -THF, -75 o C) of 15 N-3…………………………………….S-14 Figure S7. 1 H NMR spectrum (d 8 -THF, 0 o C) of 1/ 15 N-2 and 1/ 15 N-3……...………………..S-15 Figure S8. CV of 2 recorded at -35 o C………………………………………………………..S-16 References....…………………………………………………………………………………..S-17
Transcript of A Five-Coordinate Phosphino/Acetate Iron(II) Scaffold … · ‡Department of Chemistry and...

S-1
A Five-Coordinate Phosphino/Acetate Iron(II) Scaffold that Binds N2, N2H2, N2H4, and
NH3 in the Sixth Site
Caroline T. Saouma,‡ Curtis E. Moore,
† Arnold L. Rheingold,
† Jonas C. Peters*
,‡
‡Department of Chemistry and Chemical Engineering, California Institute of Technology, Pasadena, CA, 91125,
U.S.A. †Department of Chemistry and Biochemistry, University of California, San Diego, La Jolla, CA, 92093, U.S.A.
Table of Contents
Experimental Procedures……………………………………………………………………..…S-2
Chart S1. Plot of 3JHH vs. N-N bond distance in M2(trans-N2H2) species…………………... S-11
Figure S1. 1H NMR spectrum of 1 (THF-d8, 25
oC)………………………………………….S-12
Figure S2. Overlay of rRaman spectra of 14
N-2 and 15
N-2…………………………………...S-13
Figure S3. 15
N NMR spectrum (d8-THF, -75 oC) of 2………………………………………...S-13
Figure S4. 31
P NMR spectrum (d8-THF, -75 oC) of 2……………………...…………………S-13
Figure S5. 31
P NMR spectrum (d8-THF, -75 oC) of 3………………………………………...S-14
Figure S6. 1H NMR spectrum (d8-THF, -75
oC) of
15N-3…………………………………….S-14
Figure S7. 1H NMR spectrum (d8-THF, 0
oC) of 1/
15N-2 and 1/
15N-3……...………………..S-15
Figure S8. CV of 2 recorded at -35 oC………………………………………………………..S-16
References....…………………………………………………………………………………..S-17

S-2
General Considerations
All manipulations were carried out using standard Schlenk or glove-box techniques under a
dinitrogen atmosphere. Unless otherwise noted, solvents were deoxygenated and dried by
sparging with Ar followed by passage through an activated alumina column from S.G. Water
(Nashua, N.H.). Nonhalogenated solvents were tested with a standard purple solution of
benzophenone ketyl in THF to confirm effective oxygen and moisture removal. Deuterated
solvents were purchased from Cambridge Isotopes Laboratories, Inc. and were degassed and
stored over activated 3-Å molecular sieves prior to use. Elemental analyses were performed by
Midwest Microlab (Indianapolis, IN).
Caution: All manipulations with anhydrous hydrazine were done at ambient or reduced
temperatures, and the waste disposed of appropriately. Anhydrous hydrazine is both highly toxic
and highly explosive, with an auto-ignition temperature that is highly dependent on the presence
of impurities. Prior to working with anhydrous hydrazine, we encourage others to consult
appropriate sources to familiarize themselves with the dangers. We found “Wiley Guide to
Chemical Incompatibilities” (Pohanish, R. P. and Greene, S. A.; Wiley) to be an excellent
reference for such matters. Though we did not distill our anhydrous hydrazine, a procedure is
described in the literature (Lucien, H. W., J. Chem. Eng. Data, 1962, 7, 541).
Spectroscopic Measurements
Varian 300, 400, and 500 MHz spectrometers were used to record the 1H NMR,
31P
NMR, and 15
N NMR spectra (400 or 500 MHz). 1H chemical shifts were referenced to residual
solvent. 31
P NMR chemical shifts were referenced to 85% H3PO4 at δ = 0 ppm, and 15
N NMR
chemical shifts were referenced to neat C6H515
NO2 (δ = 370 ppm) in comparison to liquid

S-3
ammonia (δ = 0 ppm). MestReNova (6.1.0) was used for NMR data workup, as well as for
simulation of spectra. Solution magnetic moments were measured using Evans method.1
IR measurements were obtained with a KBr solution cell or a KBr pellet using a Bio-Rad
Excalibur FTS 3000 spectrometer controlled by Varian Resolutions Pro software set at 4 cm-1
resolution.
The rRaman samples were prepared by loading solutions into glass capillaries which
were subsequently flame-sealed. For measurements at 77 K, samples were loaded into an NMR
tube, sealed, and placed in a quartz dewar filled with liquid nitrogen for data collection.
Excitation was performed at either 632.8 nm using a HeNe laser (10 mW) or at 514 nm using an
Ar-ion laser. A lens collected the light that scattered at 90o and focused it through a low-pass
filter and into the entrance slit of a SPEX 750M monochromator. The dispersed light was
detected by a LN/CCD array (5 cm-1
resolution), and the spectra recorded using Winspec
(Princeton Instrument) software. Conversion from pixel to wavenumber was done by obtaining
the spectrum of cyclohexane, and deriving the linear plot of pixel versus wavenumber for known
vibrations. All spectra were recorded in THF (room temperature) or Me-THF (77 K), and in
some instances, solvent subtraction or baseline correction was performed.
Optical spectroscopy measurements were taken on a Cary 50 UV-Vis spectrophotometer
using a 1 cm two-window quartz cell sealed with standard ground-glass joints or Teflon plugs.
Measurements at reduced temperatures were accomplished by using a dip-probe that was
immersed into a solution of analyte in a custom-made Schlenk tube under an N2 atmosphere.
Electrochemistry

S-4
Electrochemical measurements were carried out in a glove-box under a dinitrogen
atmosphere in a one-compartment cell using a BAS model 100/W electrochemical analyzer. A
glassy carbon electrode and platinum wire were used as the working and auxillary electrodes,
respectively. The reference electrode was Ag/AgNO3 in THF. Solutions (THF) of electrolyte (0.4
M tetra-n-butylammonium hexafluorophosphate) and analyte were also prepared in a glovebox.
Experiments were conducted at room temperature, and in certain instances, in a drop freezer
maintained at -35 oC. Ferrocene was subsequently added to the samples, and a CV obtained to
allow for referencing versus Fc/Fc+.
X-ray Crystallography Procedures
Low-temperature diffraction data were collected on either a Siemens or Bruker Platform
three-circle diffractometer coupled to a Bruker-AXS Smart Apex CCD detector with graphite-
monochromated Mo or Cu Kα radiation (λ = 0.71073 or 1.54178 Å, respectively), performing φ-
and ω-scans. The structures were solved by direct or Patterson methods using SHELXS2 and
refined against F2 on all data by full-matrix least squares with SHELXL-97.
3 The structures were
refined using established methods.4 All non-hydrogen atoms were refined anisotropically. All
hydrogen atoms (except hydrogen atoms directly attached to the nitrogen atom in 5) were
included into the model at geometrically calculated positions and refined using a riding model.
The isotropic displacement parameters of all hydrogen atoms were fixed to 1.2 times the U value
of the atoms they are linked to (1.5 times for methyl groups). The protons attached to the iron-
bound nitrogen atom of 5 could be located in the difference Fourier synthesis and subsequently
those H atoms were refined semi-freely with the help of distance restraints.
All disorders were refined with the help of similarity restraints on 1-2 and 1-3 distances
and displacement parameters as well as rigid bond restraints for anisotropic displacement

S-5
parameters. All close contacts, both inter and intramolecular, reported by the Platon validation
software5 involve at least one partner from a minor component of a disorder.
The structure of 4 suffers from total molecule disorder, with 18 % of the molecules
translocated along the b-axis of the unit cell. The data was modeled assuming this disorder to
obtain a satisfactory solution.
Starting Materials and Reagents
[PhBPCH2Cy
3]FeMe,6
15N2H4,
7 and Me2Mg
8 were prepared according to literature
methods. Pb(OAc)4 was purchased from Aldrich (99.999+%), purified as described in the
literature,9 and recrystallized from cold THF to afford a white crystalline solid. Acetic acid was
dried according to literature methods.9 All other reagents were purchased from commercial
vendors and used without further purification.
Synthesis of [PhBPCH2Cy
3]Fe(OAc), 1. To a stirring solution of [PhBPCH2Cy
3]FeMe (0.2732 g,
0.3116 mmol) in 16 mL DME, neat anhydrous acetic acid (17.9 L, 0.312 mmol) was added.
The solution immediately changed color from yellow to pale grey/purple. After stirring for 24 h,
the volatiles were removed. The resulting solids were collected on a frit and rinsed with pentanes
to afford analytically pure material (0.2338 g, 81.5 %). A second crop can be isolated by storing
the pentane extract at -35 oC for several days.
1H NMR (THF-d8, 400 MHz, 25
oC) 98.1 (s), 65
(bs), 25.2 (s), 13.9 (s), 12.8 (s), 1.9 (s), 1.2 (s), 0.6 (s), 0.1 (s), -2.6 (s), -7.3 (s), -8.2 (s), -9.0 (s), -
9.7 (s), -16.5 (s), -23.2 (s). Evans Method (C6D6): 4.5 B.M. UV-vis (THF) λmax, nm (ε, M-1
cm-1
):
745 (240), 392 (400). Anal. Calcd. for C53H92BFeO2P3: C 69.12; H 10.07; N 0. Found: C 68.77;
H 9.93; N 0.

S-6
Synthesis of {[PhBPCH2Cy
3]Fe(OAc)}2(-N2), 2. Cooling THF solutions of 1 to -35 oC affords 2.
Pink crystals of 2 suitable for diffraction were grown by cooling a saturated Et2O solution of 1 to
-35 oC in a nitrogen-filled glovebox. The bound N2 in 2 is labile; by Toepler analysis, qualitative
release of N2 was observed when a THF solution of 2 was maintained at -78 oC. In the solid-
state, the bound N2 is also labile, as pink crystals of 2 change color to grey/purple upon exposure
to vacuum. rRaman (514 nm, Me-THF, 77 K) (cm-1
): 2083 (NN). UV-vis (THF, -78 oC) λmax, nm
(ε, M-1
cm-1
): 750 (240), 532 (1200).
Samples of 15
N-2 were prepared by freeze pump thawing solutions of 1/2 and subsequently
exposing 1 to a 15
N atmosphere and cooling the solution to -75 oC.
1H NMR (THF-d8, 400 MHz,
-75 oC) 7.1 (s, 4H), 6.9 (s, 4H), 6.9 (s, 2H), 0 – 2.7 (m, overlap with solvent, 168H).
31P NMR
(THF-d8, 162 MHz, -75 oC) 53.7 (bs, 2P), 44.54 (dt,
2JPP = 71.1 Hz,
2JPN ≈ 15 Hz).
15N NMR
(THF-d8, 40 MHz, -75 oC) 328.6 (d,
2JPN ≈ 15 Hz). rRaman (514 nm, Me-THF, 77 K) (cm
-1):
2010 (NN) (2012 cm-1
predicted for an NN harmonic oscillator).
Synthesis of {[PhBPCH2Cy
3]Fe(OAc)}2(-N2H4), 3. A solution of 1 (0.0356 g, 0.0393 mmol) in
1 mL THF was cooled to – 78 oC, and a solution of anhydrous hydrazine in 1 mL THF (0.68 L,
0.02 mmol) was added dropwise. The solution changed color from pink to purple as 3 was
generated. When the reaction is rigorously maintained at -78 oC, no other species are present by
1H and
31P NMR spectroscopy. The bound hydrazine in 3 is labile, and at -30
oC resonances
ascribed to 1 are observed by 1H NMR spectroscopy. At this temperature 3 is also unstable, and

S-7
resonances ascribed to 4 are observed by 1H NMR spectroscopy. UV-vis (THF, -78
oC) λmax, nm
(ε, M-1
cm-1
): 549 (650).
Samples of 15
N-3 were prepared following an analogous synthetic procedure using 15
N2H4. 1H
NMR (THF-d8, 400 MHz, -75 oC) 7.1 (bs, 4H), 6.88 (t, J = 6.4 Hz, 4H), 6.71 (t, J = 6.1 Hz,
2H), 2.51 (d, 1JNH = 66.0 Hz, NH2, 4H), 0.75 – 2.2 (m, overlap with solvent, 168H), 0.19 (bs,
4H), -0.15 (bs, 3H). 31
P NMR (THF-d8, 162 MHz, -75 oC) d
JPP = 60.3 Hz), 54.51 (dt,
2JPP = 55.9 Hz,
2JPN = 8.2 Hz).
15N NMR (THF-d8, 40 MHz, gHSQCAD, -75
oC) 103.
Synthesis of {[PhBPCH2Cy
3]Fe(OAc)}2(-N2H2), 4. Neat anhydrous hydrazine (0.54 L, 0.017
mmol) was added to a stirring solution of 1 (0.0300 g, 0.0335 mmol) in 1 mL benzene. The
solution immediately changed color from pale grey to dark blue. After stirring for 2 h, the
volatiles were removed. The solids were rinsed with Et2O, and a midnight blue analytically pure
powder of 4 was isolated (0.0236 g, 75.3 %). Crystals suitable for diffraction were grown by the
vapor diffusion of pentane into a dilute benzene solution of 4. Crystals that were grown from
THF/pentane also suffered from total molecule disorder. Complex 4 is stable to vacuum at room
temperature, but upon heating a toluene solution of 4 to 60 oC, transforms to 1 (and 5) over 2 h.
1H NMR (C6D6, 400 MHz, 25
oC) 17.72 (bs, 2H, NH), 7.98 (d, J = 7.2 Hz, 4H), 7.51 (t, J = 7.3
Hz, 4H), 7.25 (t, overlap with solvent, J = 6.9 Hz, 2H), 0.5 – 2.5 (m, 168H). 31
P NMR (C6D6,
162 MHz, 25 oC) 52.7 (d,
2JPP = 60.8 Hz), 34.9 (t,
2JPP = 60.8 Hz). UV-vis (THF) max, nm (,
M-1
cm-1
): 726 (17,700). IR (KBr) (cm-1
): 3244, 748, 446. rRaman (633 nm, THF) (cm-1
): 1299,
1232, 608. Anal. Calcd. for C106H186B2Fe2N2O4P6: C 68.02; H 10.02; N 1.50. Found: C 68.35; H
9.81; N 1.37.

S-8
Samples of 15
N-4 were prepared following an analogous synthetic procedure using 15
N2H4.
1H{
31P} NMR (C6D6, 400 MHz, 25
oC) δ 17.72 (m,
1JNH = -71.0 Hz,
2JNH = -1.1 Hz,
3JHH = 21.0
Hz, 1JNN = 12.0 Hz, 2H, NH). Coupling constants were obtained by simulation of the spectrum.
31P NMR (C6D6, 162 MHz, 25
oC) 52.7 (d,
2JPP = 60.8 Hz), 34.9 (dt,
2JPP = 60.8 Hz,
2JPN ≈ 13
Hz). 15
N NMR (C6D6, 40 MHz, gHSQCAD, 25 oC) 434. IR (KBr) (cm
-1): 3242, 745, 438.
rRaman (633 nm, THF) (cm-1
): 1263, 1223, 603.
Synthesis of [PhBPCH2Cy
3]Fe(OAc)(NH3), 5. Neat anhydrous hydrazine (0.40 L, 0.012 mmol)
was added to a stirring solution of 1 (0.0213 g, 0.0231 mmol) in 1 mL THF. The solution
immediately changed color from pale grey to dark blue. Over the course of stirring for 2 h, a
second color change to purple ensued. The volatiles were removed, the resulting solids extracted
into Et2O, and the Et2O solution was concentrated to dryness. The resulting purple solids were
rinsed with pentane to afford analytically pure material (0.0144 g, 66.0 %). Complex 5 is stable
to vacuum at room temperature, but upon heating to 60 oC, gradually transforms to 1. Crystals
suitable for diffraction were grown by the vapor diffusion of pentane into a benzene solution of
5. UV-vis (THF) λmax, nm (ε, M-1
cm-1
): 745 (150), 550 (440), 395 (240). IR (KBr) (cm-1
): 3365,
3348. Anal. Calcd. for C53H95BFeNO2P3: C 67.87; H 10.21; N 1.49. Found: C 67.66; H 10.07; N
1.63.
Samples of 15
N-5 were prepared following an analogous synthetic procedure using 15
N2H4, or by
addition of 1 atm of 15
NH3 to a THF solution of 1. 1H NMR (THF-d8, 500 MHz, -40
oC) δ 7.12

S-9
(bs, 2H), 6.92 (bs, 2H), 6.76 (bs, 1H), 2.49 (d, 1JNH = 68.0 Hz, NH3, 3H), 0.10 – 2.27 (m, 168H,
overlap with solvent/15
NH3), -0.09 (bs, 3H). 31
P NMR (THF-d8, 202 MHz, -40 oC) 61.89 (d, J
= 56 Hz), 51.09 (t, J = 56 Hz). 15
N NMR (THF-d8, 50 MHz, -40 oC) -21.1 (q,
1JNH = 68.0 Hz).
Reduction Studies of 2. In a typical experiment, 2 was massed out in the glove-box (10 – 20
mg) and transferred to a 25 mL 2-neck round bottom flask fitted with a stir bar. THF was added
(ca. 5 mL), and a 180o ground glass adaptor with a Teflon plug and a rubber septum were
attached. The flask was cooled in the cold-well for 30 min. (maintained at -78 oC with a dry
ice/acetone bath). At this time, reductant and acid (2 or 6 equiv), reductant (1 equiv), or H-atom
donors (2 or 6 equiv) were added dropwise via syringe as THF solutions (for incompatible
acid/reductant combinations, these were added as separate THF solutions). The reaction was
stirred for 24 h, during which time it warmed to RT. At this time, the volatiles were vac-
transferred onto a frozen ethereal solution of HCl (1.0 M; 6 mL), and the residual iron-containing
solids were analyzed by 31
P and 1H NMR spectroscopy. The acidic ethereal solution was stirred
for 45 min at room temperature, and the volatiles were removed. The remaining solids were
analyzed by 1H NMR spectroscopy (d6-DMSO), and ammonium was quantified by integration
against an internal standard of mesitylene (5.0 mM).
Reaction of 4 with oxidants. Solutions of 4 in THF were typically prepared (ca. 10-20 mg in 2-
5 mL THF), to which a solution (or slurry) of oxidant in THF (1 or 2 equiv) was added dropwise.
The reaction stirred for 2 h, the volatiles were removed, and the resulting solids were then
analyzed by 1H and
31P NMR spectroscopy.

S-10
For reactions that were done at -78 oC, a similar protocol was employed; the solutions were
chilled for 30 min. in a cold-well in the glove-box prior to addition of oxidant to 4, and the
solutions were stirred for 30 min at -78 oC prior to warming to RT.
Disproportionation Studies of 1. A similar protocol as that described for the reduction of 2 was
employed, with addition of excess hydrazine instead of reductant and acid.
Thermal Stability Studies. In a typical experiment, an NMR sample of the compound was
prepared in either d8-toluene or d8-THF, and transferred to a re-sealable J.Young NMR tube.
NMR spectra (31
P and 1H) were obtained at room temperature, and the sample was heated for
two hours to 60 oC, and the NMR spectra recorded again. Samples that did not show degradation
were heated for further lengths of time, and the integrity of the sample was monitored by NMR
spectroscopy.
S-11
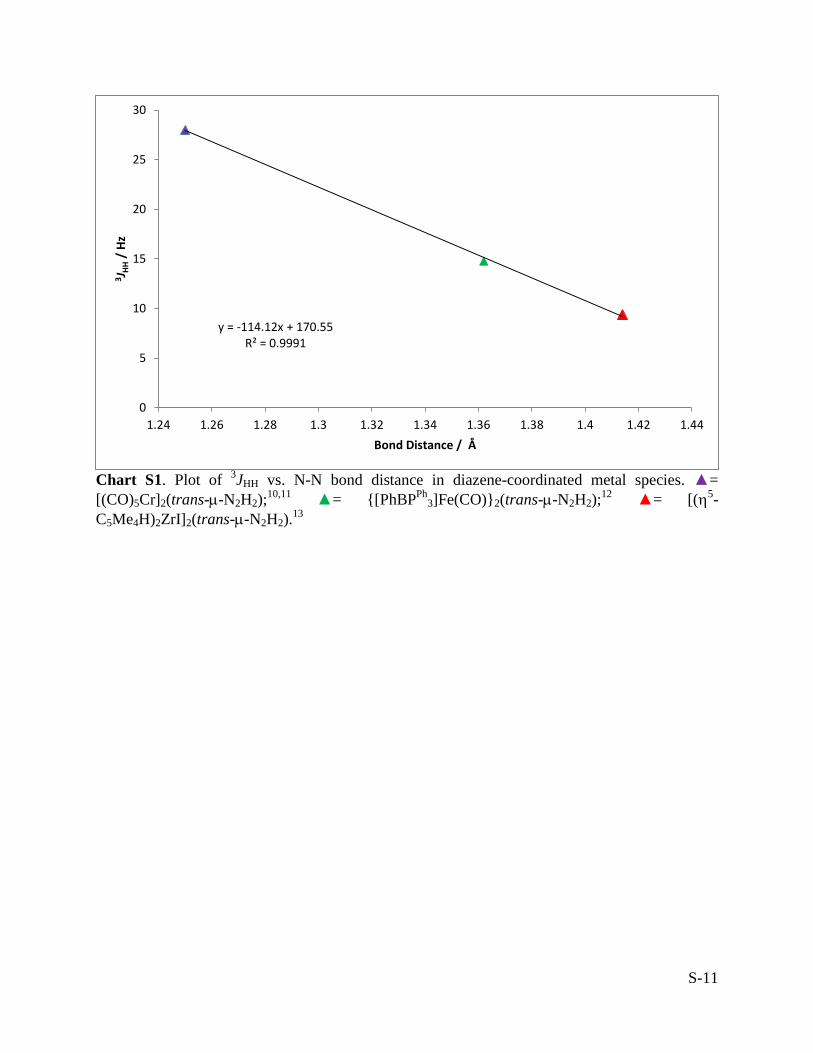
Chart S1. Plot of 3JHH vs. N-N bond distance in diazene-coordinated metal species. ▲=
[(CO)5Cr]2(trans--N2H2);10,11
▲= {[PhBPPh
3]Fe(CO)}2(trans--N2H2);12
▲= [(5-
C5Me4H)2ZrI]2(trans--N2H2).13
y = -114.12x + 170.55 R² = 0.9991
0
5
10
15
20
25
30
1.24 1.26 1.28 1.3 1.32 1.34 1.36 1.38 1.4 1.42 1.44
3 JH
H /
Hz
Bond Distance / Å

S-12
Figure S1. 1H NMR spectrum of 1 (THF-d8, 25
oC), with the inset indicating the peaks between -
10 and 5 ppm.
S-13
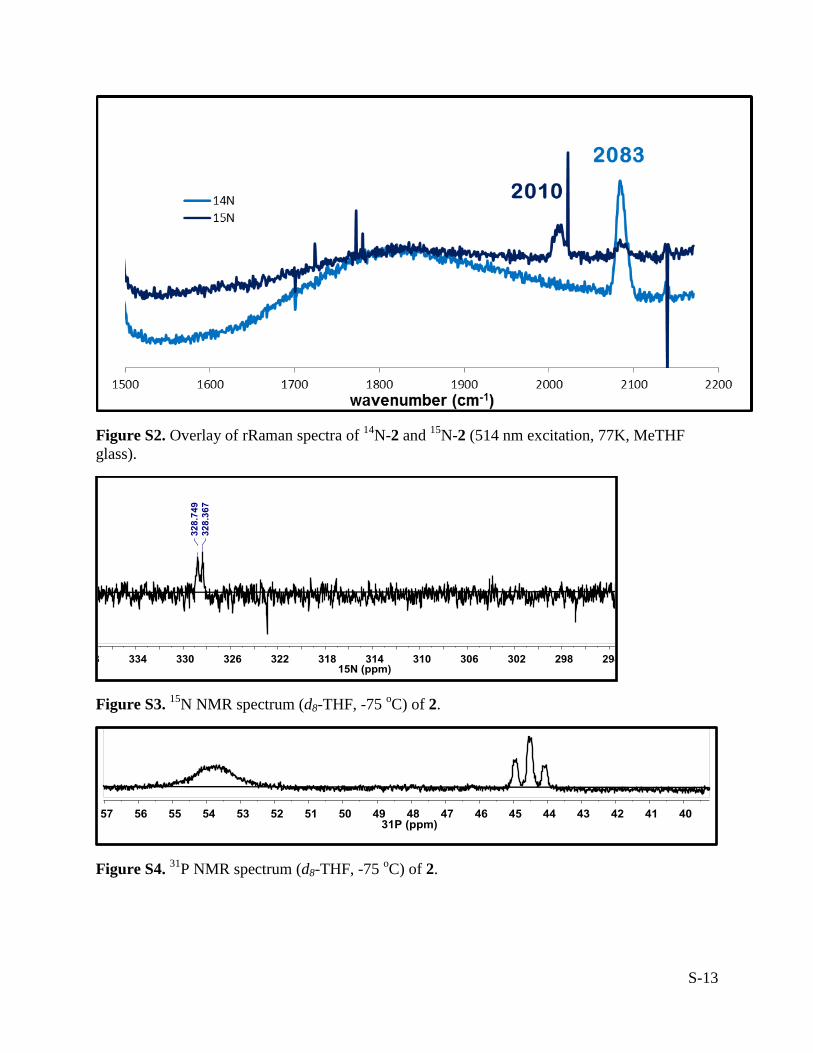
Figure S2. Overlay of rRaman spectra of 14
N-2 and 15
N-2 (514 nm excitation, 77K, MeTHF
glass).
Figure S3. 15
N NMR spectrum (d8-THF, -75 oC) of 2.
Figure S4. 31
P NMR spectrum (d8-THF, -75 oC) of 2.

S-14
Figure S5. 31
P NMR spectrum (d8-THF, -75 oC) of 3.
Figure S6. 1H NMR spectrum (d8-THF, -75
oC) of
15N-3. The doublet marked with an asterix
corresponds to the hydrazine protons.
*

S-15
Figure S7. (top)
1H NMR spectrum (d8-THF, 0
oC) of
15N-2 and 1, indicating the equilibrium
between the two species, and (bottom) 1H NMR spectrum (d8-THF, 0
oC) of
15N-3 and 1,
indicating the equilibrium between the two species. The additional diamagnetic resonances are
ascribed to 4 and 5, which forms at this temperature.

S-16
Figure S8. CV of 2 recorded at -35 oC, externally referenced vs. Fc/Fc
+. Scan rate of 100 mV/s,
with 0.4 M TBA.PF6 in THF. See general considerations for experimental details.

S-17
References:
(1) Schubert, E. M., J. Chem. Educ. 1992, 69, 62.
(2) Sheldrick, G. M., Acta Cryst. 1990, A46.
(3) Sheldrick, G. M., Acta Cryst. 2008, A64.
(4) Müller, P.; Herbst-Irmer, R.; Spek, A. L.; Schneider, T. R.; Sawaya, M. R., Crystal Structure
Refinement: A Crystallographer's Guide to SHELXL. Oxford University Press: Oxford, 2006.
(5) Spek, A. L., L. PLATON A Multipurpose Crystallographic Tool. Utrecht University: Utrecht,
Holland, 2008.
(6) Saouma, C. T.; Müller, P.; Peters, J. C., J. Am. Chem. Soc. 2009, 131, 10358.
(7) Schrock, R. R.; Liu, A. H.; O'Regan, M. B.; Finch, W. C.; Payack, J. F., Inorg. Chem. 1988,
27, 3574.
(8) Tang, H.; Richey, H. G., Organometallics 2001, 20, 1569.
(9) Armarego, W. L. F.; Chai, C. L. L., Purification of Laboratory Chemicals. 5 ed.;
Butterworth-Heinmann: London, 2002.
(10) Smith, M. R.; Cheng, T. Y.; Hillhouse, G. L., J. Am. Chem. Soc. 1993, 115, 8638.
(11) Huttner, G.; Gartzke, W.; Allinger, K., Angew. Chem., Int. Ed. Engl. 1974, 13, 822.
(12) Saouma, C. T.; Kinney, R. A.; Hoffman, B. M.; Peters, J. C., Angew. Chem. Int. Ed. 2011,
50, 3446.
(13) Bernskoetter, W. H.; Pool, J. A.; Lobkovsky, E.; Chirik, P. J., J. Am. Chem. Soc. 2005, 127,
7901.