ICSI-HQ Address: ICSI-CCGRT Address: August, 2021 Mumbai ...
Upload
sylvia-cozzensCategory
view
224download
2
A First Look at Modern Enterprise Traffic
Ruoming Pang, Princeton UniversityMark Allman (ICSI), Mike Bennett (LBNL),
Jason Lee (LBNL), Vern Paxson (ICSI/LBNL),
and Brian Tierney (LBNL)
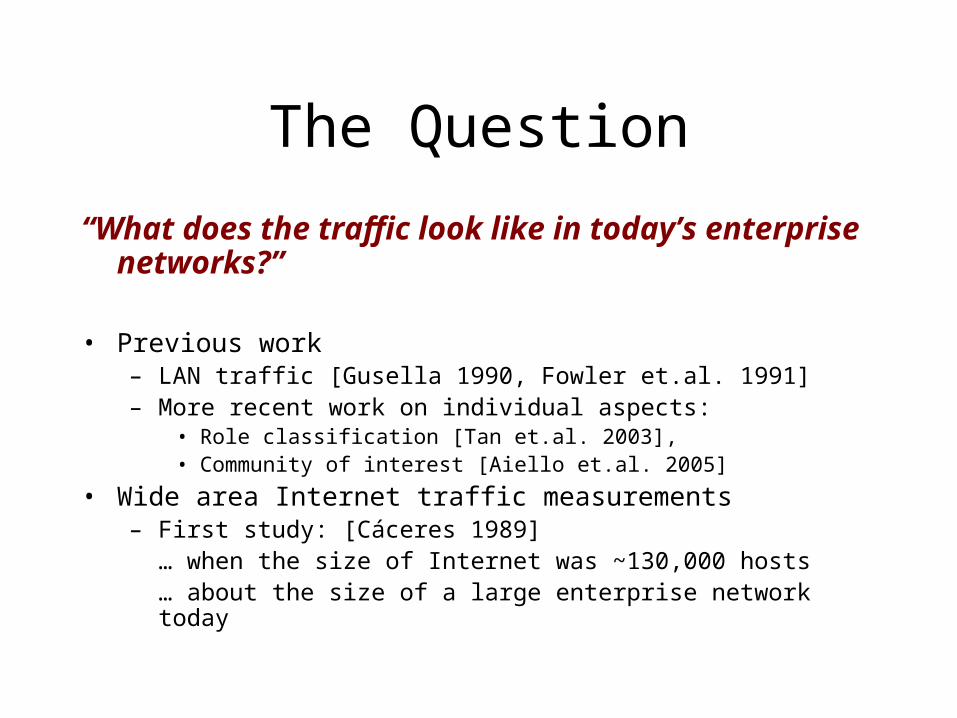
The Question
“What does the traffic look like in today’s enterprise networks?”
• Previous work– LAN traffic [Gusella 1990, Fowler et.al. 1991]– More recent work on individual aspects:
• Role classification [Tan et.al. 2003], • Community of interest [Aiello et.al. 2005]
• Wide area Internet traffic measurements– First study: [Cáceres 1989]
… when the size of Internet was ~130,000 hosts… about the size of a large enterprise network today
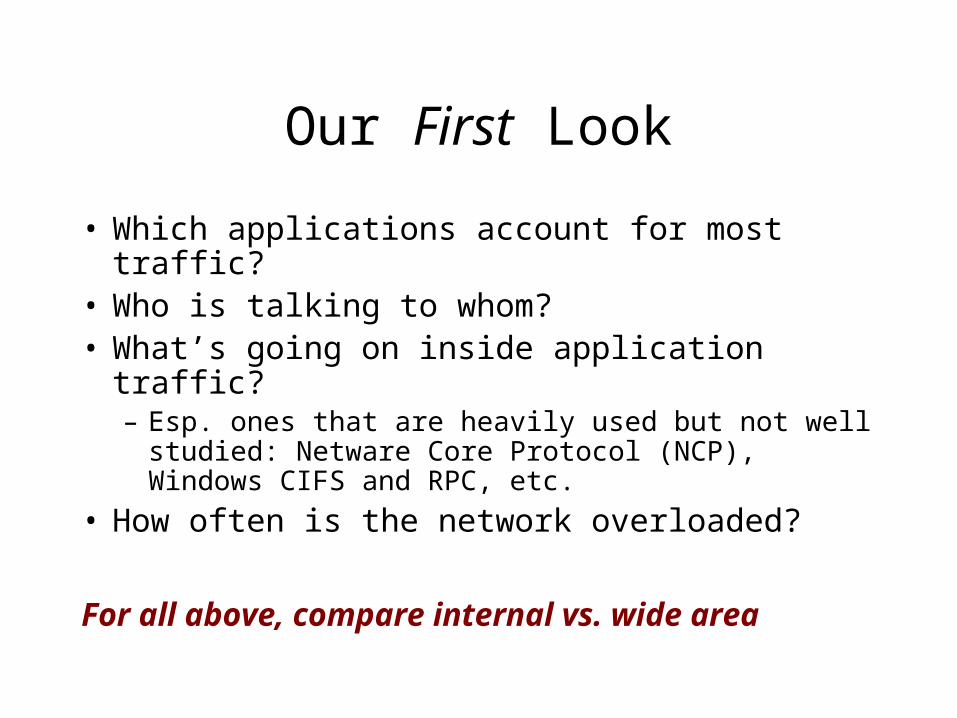
Our First Look
• Which applications account for most traffic? • Who is talking to whom? • What’s going on inside application traffic?
– Esp. ones that are heavily used but not well studied: Netware Core Protocol (NCP), Windows CIFS and RPC, etc.
• How often is the network overloaded?
For all above, compare internal vs. wide area

Trace Collection
• Where: Lawrence Berkeley National Lab (LBNL)– A research institute with a medium-sized enterprise
network
• Caveat: one-enterprise study– “The traffic might look like …”
• How: tapping links from subnets to the main routers
• Caveat: only traffic between subnets

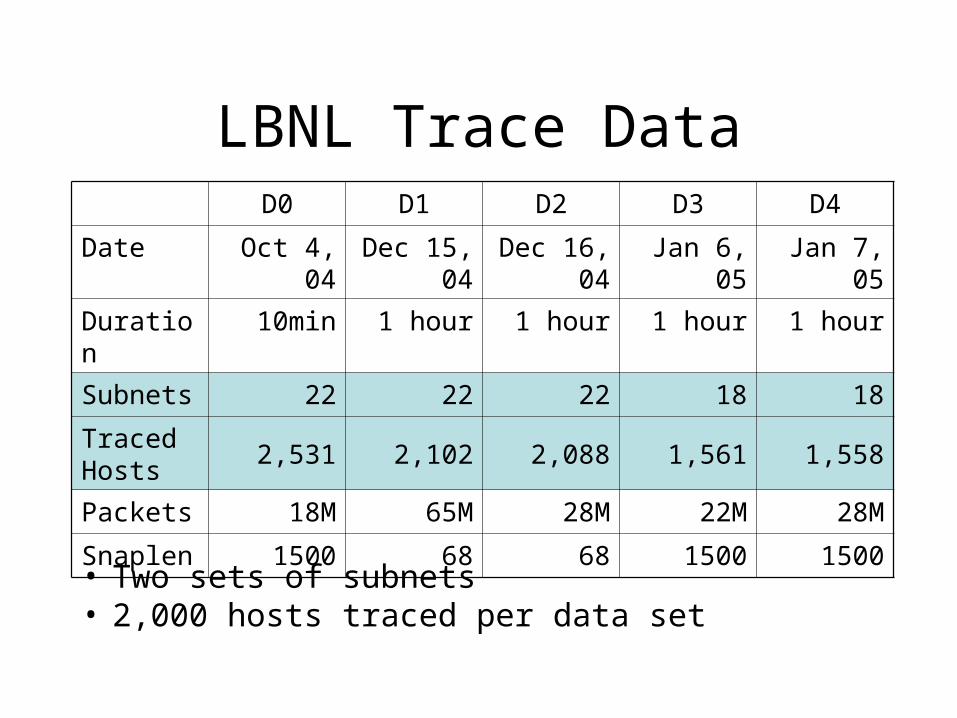
LBNL Trace Data
• Five data sets • Over three months: Oct 2004 -- Jan 2005
D0 D1 D2 D3 D4
Date Oct 4, 04 Dec 15, 04 Dec 16, 04 Jan 6, 05 Jan 7, 05
Duration 10min 1 hour 1 hour 1 hour 1 hour
Subnets 22 22 22 18 18
Traced Hosts
2,531 2,102 2,088 1,561 1,558
Packets 18M 65M 28M 22M 28M
Snaplen 1500 68 68 1500 1500

LBNL Trace Data
• Each trace covers a subnet• Lasts ten minutes or one hour
D0 D1 D2 D3 D4
Date Oct 4, 04 Dec 15, 04 Dec 16, 04 Jan 6, 05 Jan 7, 05
Duration 10min 1 hour 1 hour 1 hour 1 hour
Subnets 22 22 22 18 18
Traced Hosts
2,531 2,102 2,088 1,561 1,558
Packets 18M 65M 28M 22M 28M
Snaplen 1500 68 68 1500 1500
LBNL Trace Data
• Two sets of subnets• 2,000 hosts traced per data set
D0 D1 D2 D3 D4
Date Oct 4, 04 Dec 15, 04 Dec 16, 04 Jan 6, 05 Jan 7, 05
Duration 10min 1 hour 1 hour 1 hour 1 hour
Subnets 22 22 22 18 18
Traced Hosts
2,531 2,102 2,088 1,561 1,558
Packets 18M 65M 28M 22M 28M
Snaplen 1500 68 68 1500 1500

LBNL Trace Data
• Subnets are traced two at a time– With four NIC’s on the tracing machine
D0 D1 D2 D3 D4
Date Oct 4, 04 Dec 15, 04 Dec 16, 04 Jan 6, 05 Jan 7, 05
Duration 10min 1 hour 1 hour 1 hour 1 hour
Subnets 22 22 22 18 18
Traced Hosts
2,531 2,102 2,088 1,561 1,558
Packets 18M 65M 28M 22M 28M
Snaplen 1500 68 68 1500 1500
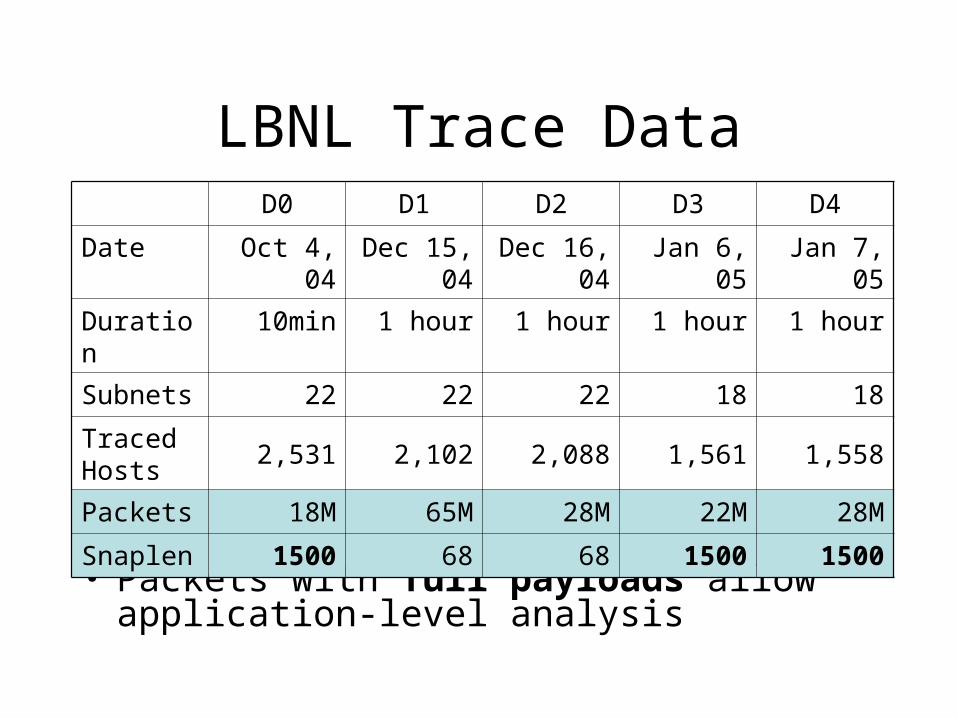
LBNL Trace Data
• Packets with full payloads allow application-level analysis
D0 D1 D2 D3 D4
Date Oct 4, 04 Dec 15, 04 Dec 16, 04 Jan 6, 05 Jan 7, 05
Duration 10min 1 hour 1 hour 1 hour 1 hour
Subnets 22 22 22 18 18
Traced Hosts
2,531 2,102 2,088 1,561 1,558
Packets 18M 65M 28M 22M 28M
Snaplen 1500 68 68 1500 1500
Outline of This Talk
• Traffic breakdown– Which applications are dominant?
• Origins and locality
• Individual application characteristics
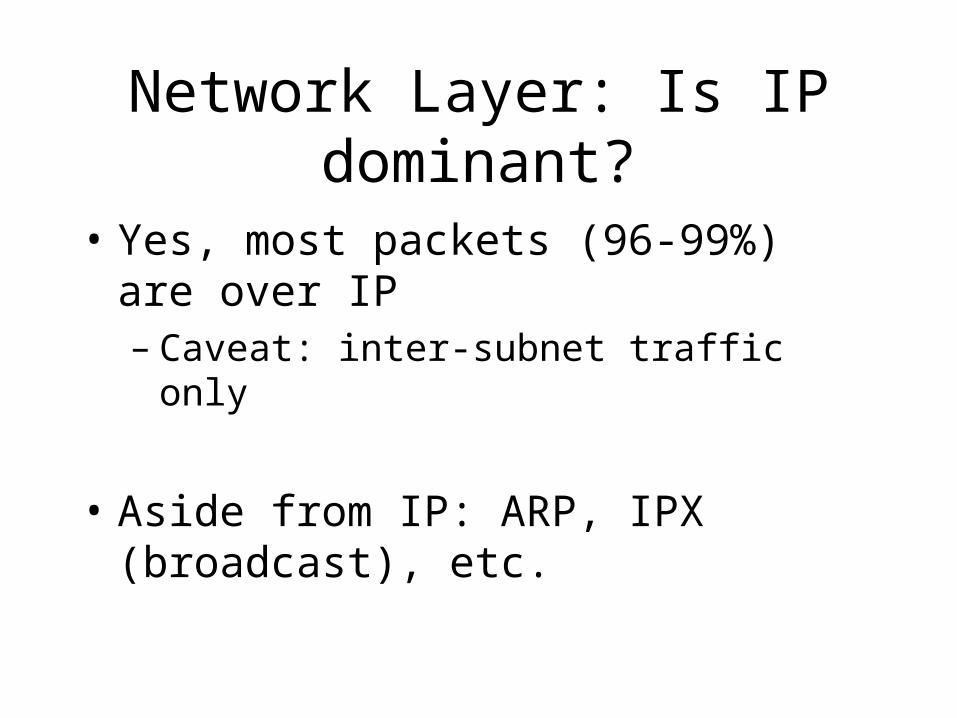
Network Layer: Is IP dominant?
• Yes, most packets (96-99%) are over IP– Caveat: inter-subnet traffic only
• Aside from IP: ARP, IPX (broadcast), etc.

Transport Layer
• Protocols seen:– TCP, UDP, ICMP– Multicast: IGMP, PIM– Encapsulation: IP-SEC/ESP, GRE– IP protocol 224 (?)
• Is UDP used more frequently inside enterprise than over wide area Internet?
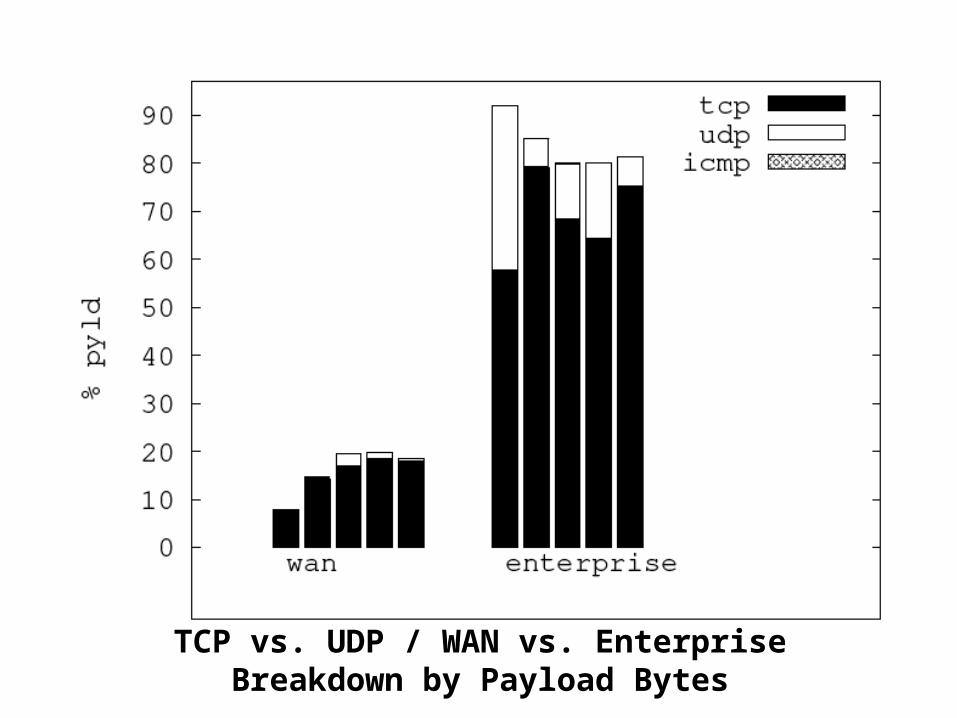
TCP vs. UDP / WAN vs. Enterprise
Breakdown by Payload Bytes

Breakdown of the first data set (D0)
(Bars add up to 100%)
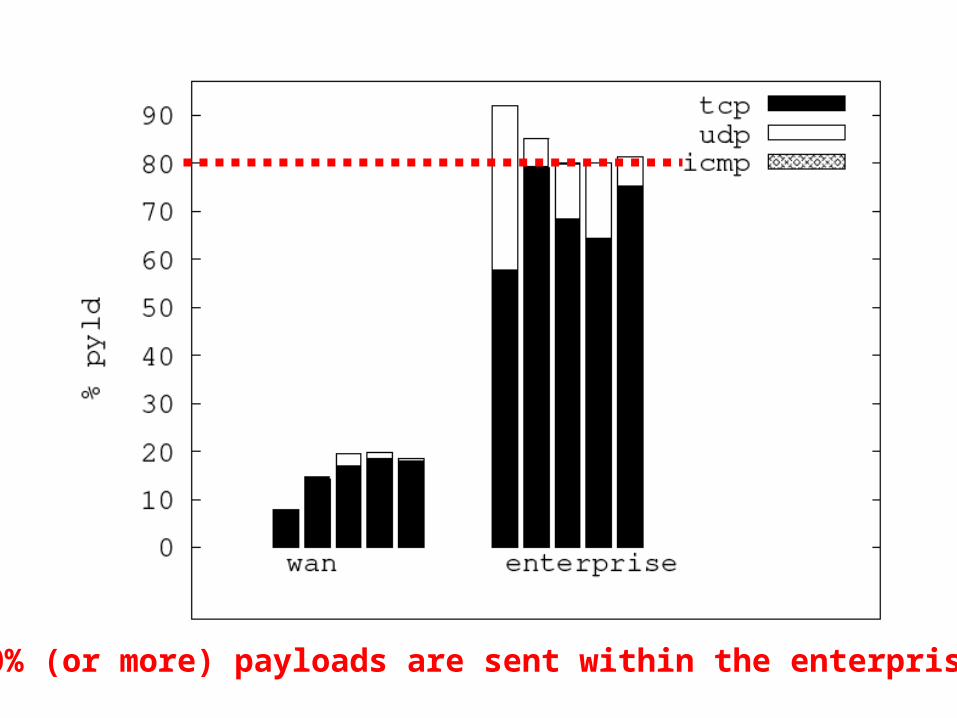
80% (or more) payloads are sent within the enterprise.

Yes, UDP is used more frequently inside the enterprise.

Breakdown by Flows
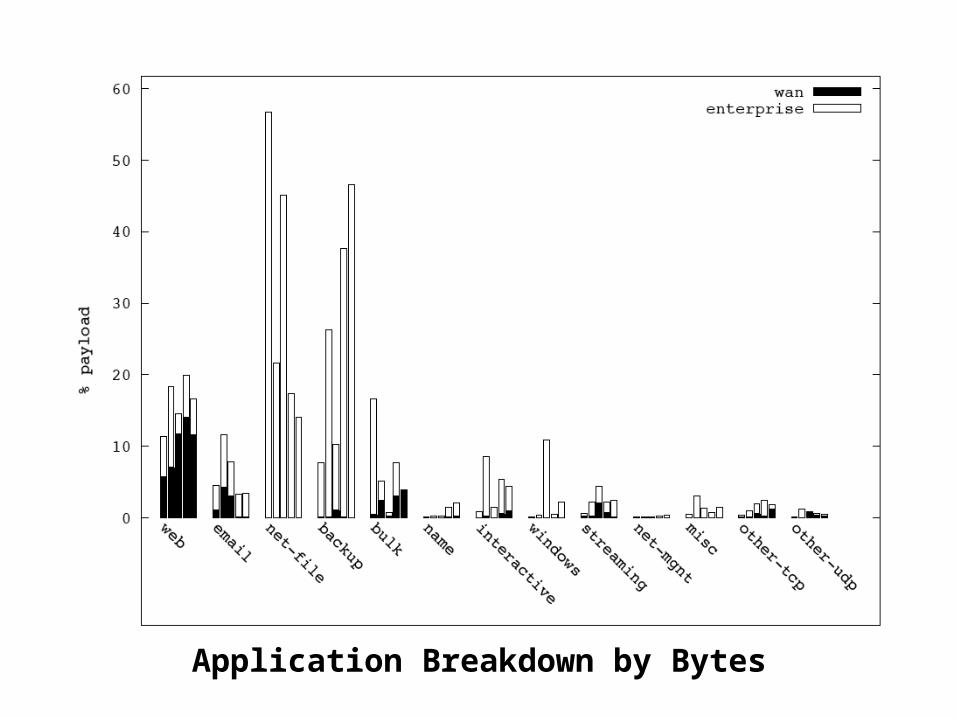
Application Breakdown by Bytes
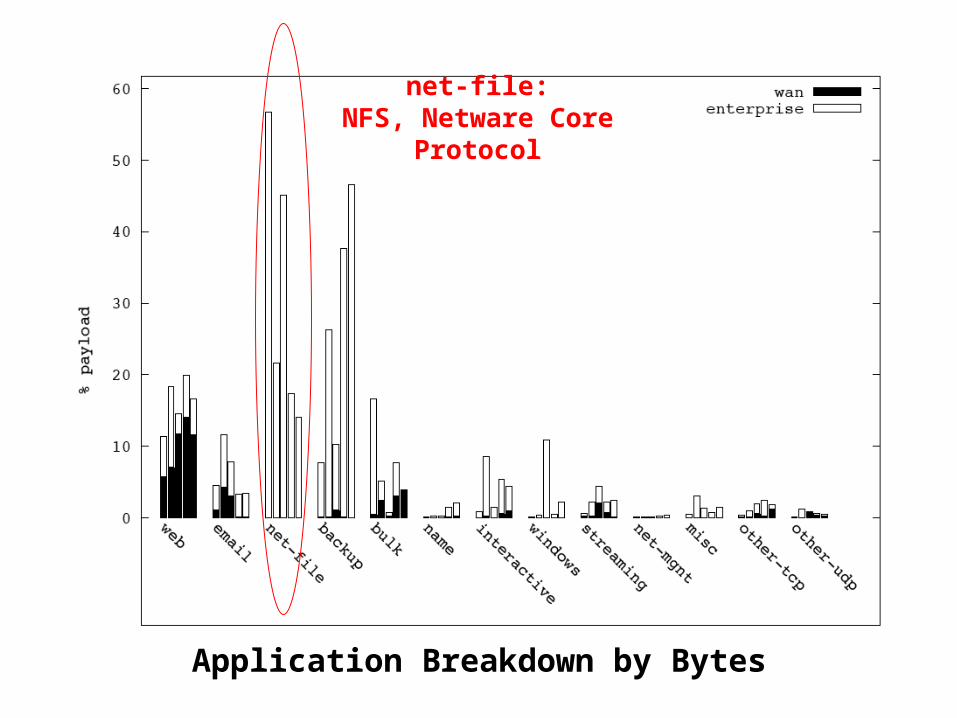
Application Breakdown by Bytes
net-file:NFS, Netware Core Protocol
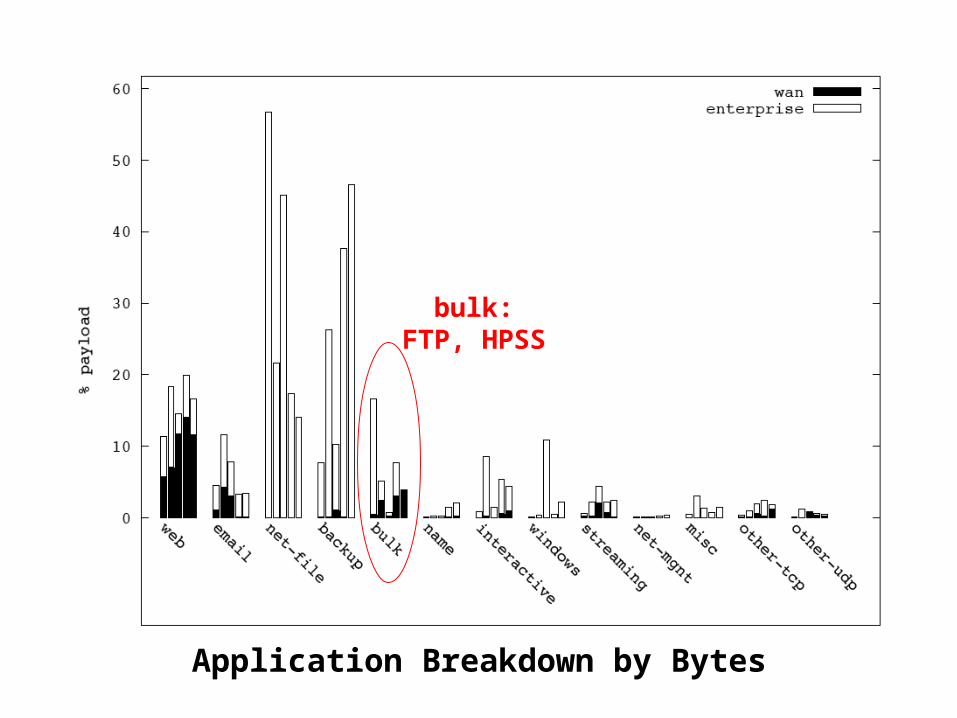
Application Breakdown by Bytes
bulk:FTP, HPSS
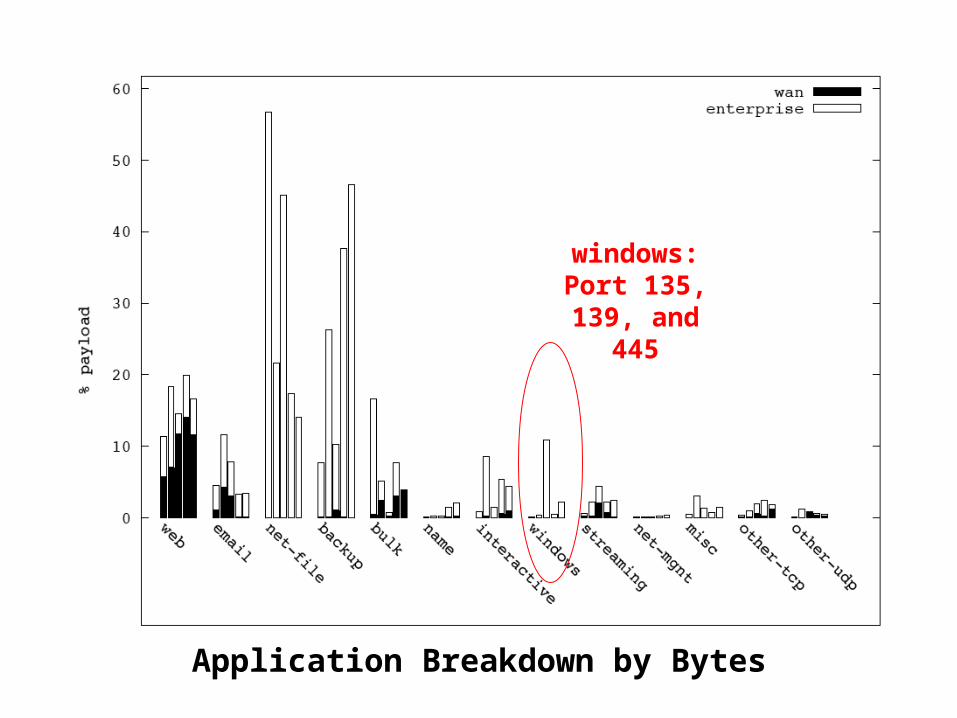
Application Breakdown by Bytes
windows:Port 135,
139, and 445
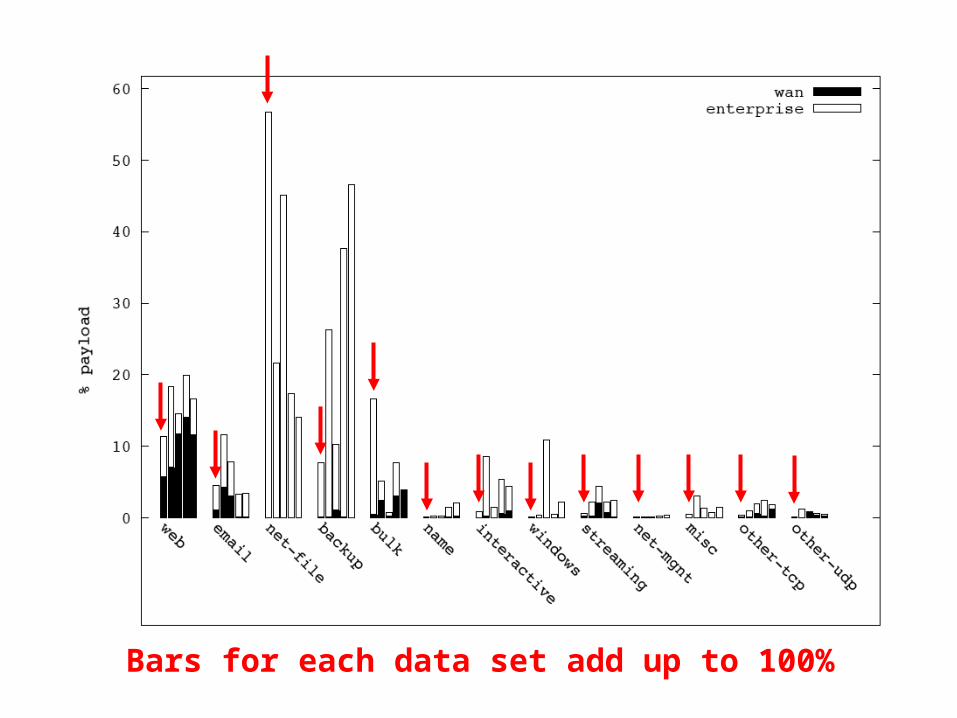
Bars for each data set add up to 100%

Internal Heavy-Weights
net-file:NFSNCP
backup:Dantz
Veritas

WAN Heavy-WeightsWAN ≈ web + email

Breakdown by Flows
name:DNS
WINSmisc:
CalendarCardKey

Summary of Traffic Breakdown
• Internal traffic (vs. wide area)– Higher volume (80% of overall traffic)– A richer set of applications
• Traffic heavy-weights– Internal: network file systems and backup– WAN: web and email

Outline
• Traffic breakdown
• Origins and locality– Fan-in/out distribution
• Individual application characteristics
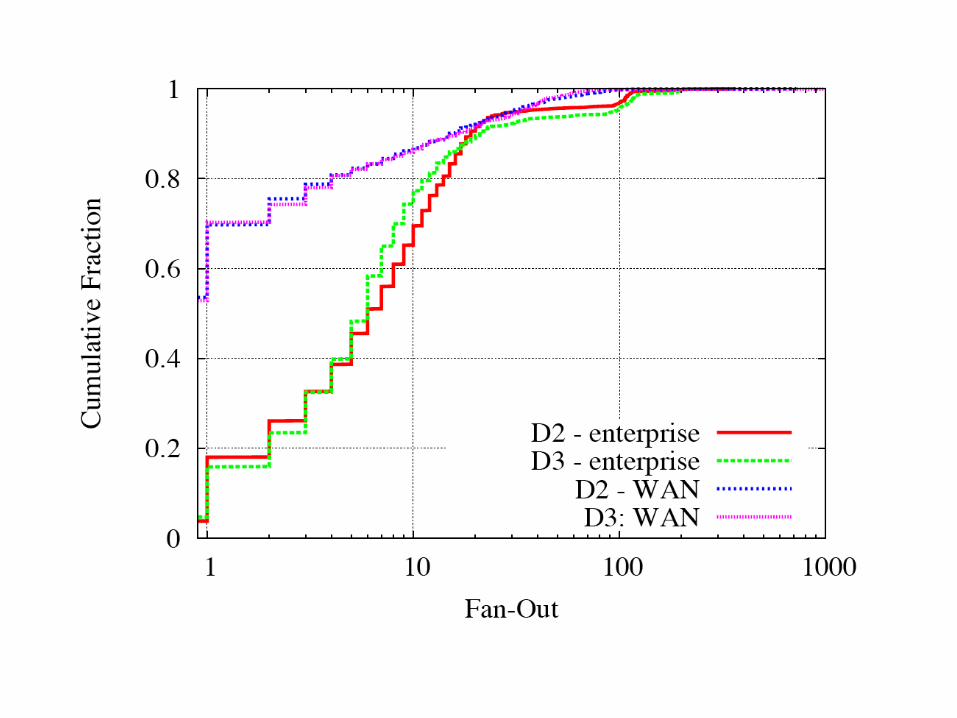

Half of hosts have no wide-area fan-out (in one hour).
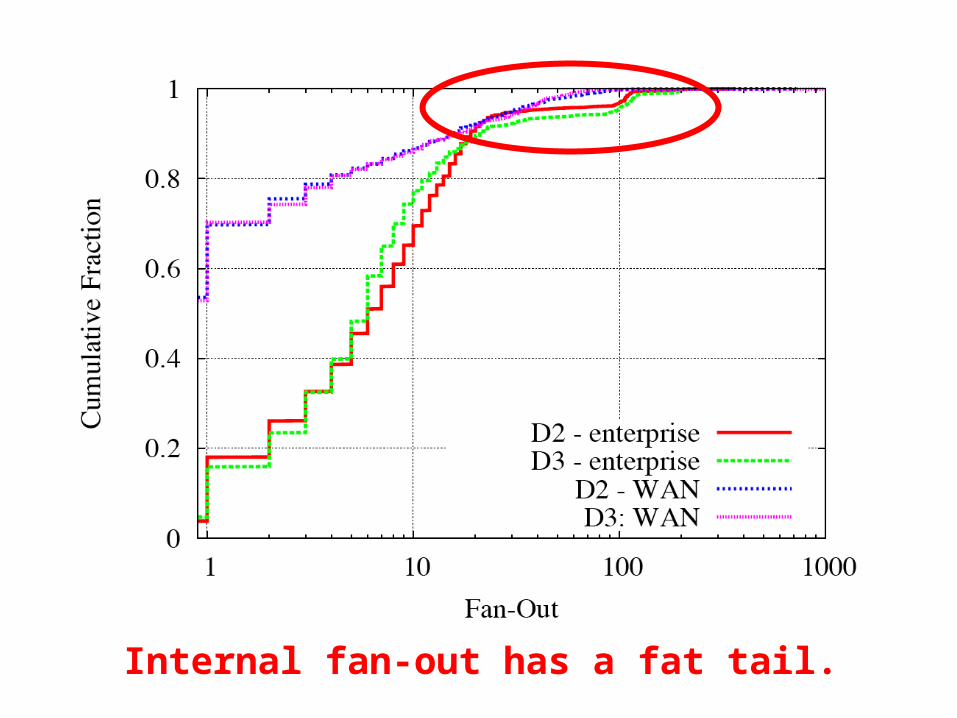
Internal fan-out has a fat tail.

Most hosts have fan-in of no more than 10.
Outline
• Traffic breakdown
• Origins and locality– Fan-in/out distribution
• Individual application characteristics
Example Questions
• Is there a big difference between internal and wide area HTTP traffic?
• How different are DNS and WINS (netbios/ns)?
• What does Windows traffic do?

Internal HTTP traffic
Automated clients vs. the rest:
Requests Bytes
D0 D3 D4 D0 D3 D4
Internal Scanners 20% 49% 19% 0.1% 0.9% 1%
Google Devices 37% 8% 5% 96% 69% 48%
Netware iFolder 1% 0.2% 10% 0.0% 0.0% 9%
All other clients 42% 43% 66% 4% 30% 41%
Automated clients dominate the traffic.

DNS vs. WINS
• Where do queries come from?– DNS: both local and remote; most queries come
from two mail servers– WINS: local clients only; queries are more
evenly distributed among clients
• Failure rate (excluding repeated queries)– DNS: 11-21%– WINS: 36-50% (!)

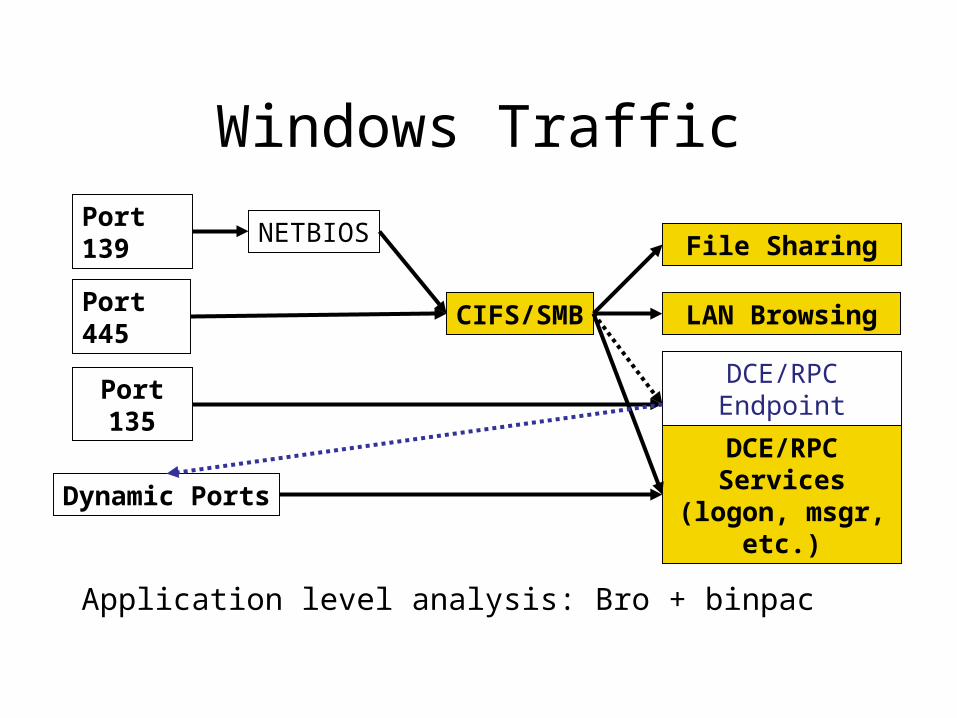
Windows Traffic
Port 139
Port 445
Port 135
Dynamic Ports
CIFS/SMB
NETBIOS
DCE/RPCEndpoint Mapper
File Sharing
DCE/RPC Services(logon, msgr, etc.)
Port numbers don’t tell much…
LAN Browsing
Windows Traffic
Port 139
Port 445
Port 135
Dynamic Ports
CIFS/SMB
NETBIOS
DCE/RPCEndpoint Mapper
File Sharing
DCE/RPC Services(logon, msgr, etc.)
Application level analysis: Bro + binpac
LAN Browsing
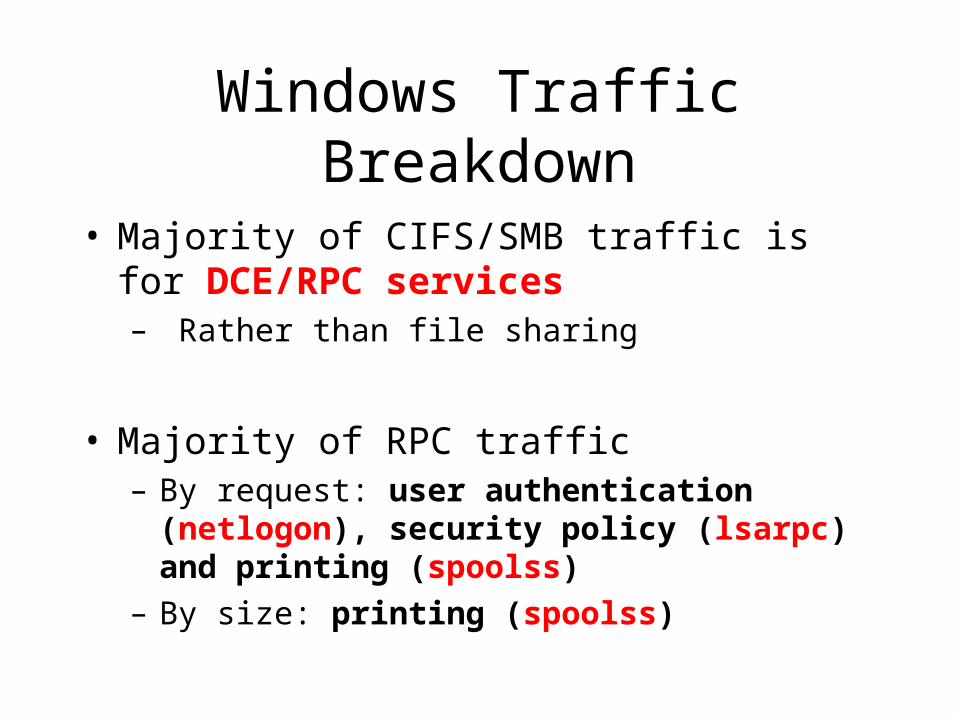
Windows Traffic Breakdown
• Majority of CIFS/SMB traffic is for DCE/RPC services– Rather than file sharing
• Majority of RPC traffic– By request: user authentication (netlogon), security
policy (lsarpc) and printing (spoolss)
– By size: printing (spoolss)
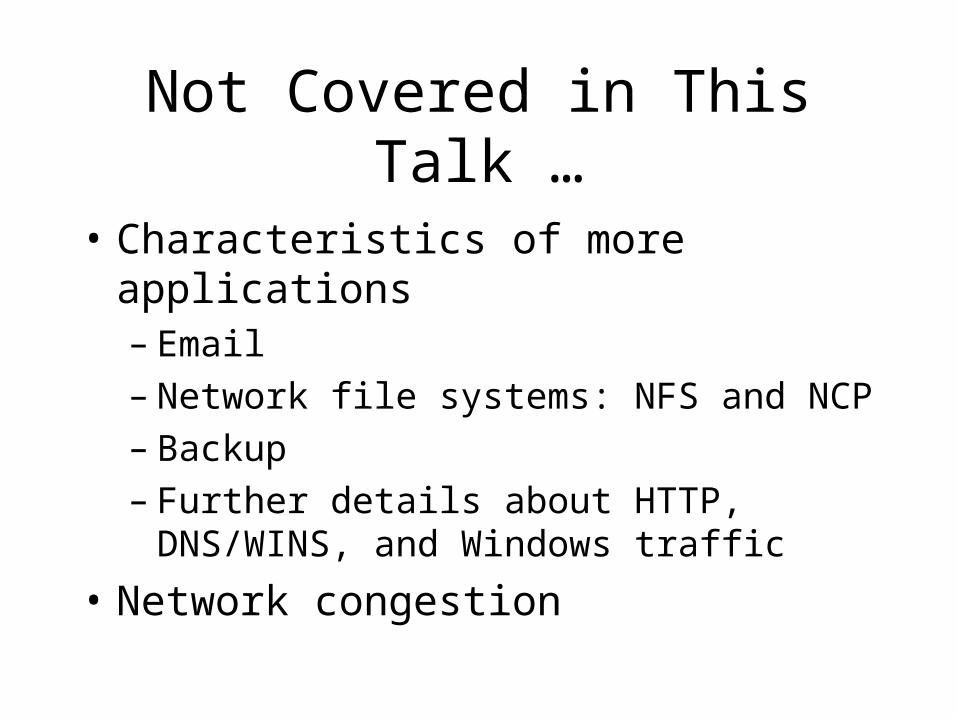
Not Covered in This Talk …
• Characteristics of more applications– Email– Network file systems: NFS and NCP– Backup– Further details about HTTP, DNS/WINS, and
Windows traffic
• Network congestion

Conclusion
• A lot is happening inside enterprise– More packets sent internally than cross border
– A number of applications seen only within the enterprise
• Caveats– One enterprise only
– Inter-subnet traffic
– Hour-long traces
– Subnets not traced all at once
• Header traces released for download!– To come: traces with payloads (HTTP, DNS, …)
The End
To download traces:
http://www.icir.org/enterprise-tracing
(or search for “LBNL tracing”)