
A. FINANCIAL RESULTS FOR THE YEARS ENDED DECEMBER31, … · local distribution grid of the Cagayan...
177
Transcript of A. FINANCIAL RESULTS FOR THE YEARS ENDED DECEMBER31, … · local distribution grid of the Cagayan...


1 | P a g e
MANAGEMENT REPORT
Brief Description of the General Nature and Scope of the Business of the Registrant and its Subsidiaries and Associates
First Gen Corporation (First Gen or the Parent company) is engaged in the business of power generation through the following operating companies:
(i) First Gas Power Corporation (FGPC) which operates the 1,000 MW Santa Rita natural gas-fired power plant;
(ii) FGP Corp. (FGP) which operates the 500 MW San Lorenzo natural gas-fired power plant; and (iii) FG Bukidnon Power Corporation (FG Bukidnon), via First Gen Renewables, Inc. (FGRI), which
operates the 1.6 MW FG Bukidnon mini hydroelectric power plant.
Equity in net earnings from associates include: (i) Energy Development Corporation (EDC), with an aggregate installed capacity of approximately 1,198.8 MW of geothermal power; and (ii) First Gen Hydro Power Corporation (FG Hydro) which operates the newly rehabilitated and upgraded 132 MW Pantabangan-Masiway hydroelectric power plants. The 225 MW Bauang bunker-fired power plant, which operated under Bauang Private Power Corporation (BPPC) under a Build-Operate-Transfer Agreement (BOT) with National Power Corporation (NPC), was turned over to the Government last July 25, 2010. Therefore, BPPC’s equity in net earnings contribution was only until July 31, 2010. First Gen’s 40% economic interest in EDC is indirectly held through Prime Terracota Holdings Corp. (Prime Terracota) and Red Vulcan Holdings Corporation (Red Vulcan), while its interest in FG Hydro is 40% held directly, and 60% held indirectly through EDC. As of December 31, 2010, the Parent company also directly owned 577.5 million shares in EDC. This is equivalent to a 3% economic interest in EDC. The following discussion focuses on the results of operations of First Gen and its power generating companies. As of December 31, 2010, First Gen's ownership interests in these operating companies are indirectly held through intermediate holding companies, with the exception of FG Hydro where First Gen directly holds a 40% interest. First Gas Holdings Corporation (FGHC) was incorporated on February 3, 1995 as a holding company
for the development of gas-fired power plants and other non-power gas related businesses. The company is 60% owned by First Gen and 40% owned by BG Consolidated Holdings (Philippines), Inc. FGHC wholly owns FGPC, the project company of the 1,000 MW Santa Rita Power Plant.
Unified Holdings Corporation (UHC) was incorporated on March 30, 1999 as the holding company of First Gen’s 60% equity share in FGP, the project company of the 500 MW San Lorenzo Power Plant. First Gen owns 100% of UHC.
FGRI, formerly known as First Philippine Energy Corporation, was established on November 29, 1978. It is tasked to develop prospects in the renewable energy market. FGRI has transformed itself from a supplier of solar products and systems to a power service provider in the countryside. First Gen owns 100% of FGRI. FG Bukidnon, a wholly-owned subsidiary of FGRI, was incorporated on February 9, 2005. Upon conveyance of First Gen in October 2005, FG Bukidnon took over the operations and maintenance of the FG Bukidnon hydroelectric power plant (FGBHPP). The run-of-river plant consists of two 800-kW turbine generators that use water from the Agusan River to generate electricity. It is connected to the local distribution grid of the Cagayan Electric Power & Light Company, Inc. (CEPALCO) via the National Grid Corporation of the Philippines (NGCP) line.

2 | P a g e
Prime Terracota was incorporated on October 17, 2007 as the holding company of Red Vulcan. Red Vulcan was incorporated on October 5, 2007 as the holding company for First Gen’s stake in EDC.
On November 22, 2007, First Gen, through Red Vulcan, was declared the winning bidder for Philippine National Oil Company and EDC Retirement Fund’s remaining shares in EDC, which consisted of 6.0 billion common shares and 7.5 billion preferred shares. Such common shares represented 40% economic interest in EDC while the combined common and preferred shares represented 60% of the voting rights in EDC. EDC is the Philippines’ largest producer of geothermal energy, operating 12 geothermal steamfields in the 5 geothermal renewable service contract areas where it is principally involved in the following: (i) the production of geothermal steam for sale to EDC-owned power plants; and (ii) the generation of electricity for sale to NPC and privately-owned distribution utilities. On May 12, 2009, Prime Terracota issued Class “B” voting preferred shares at par value to the Lopez Inc. Retirement Fund (LIRF) and Quialex Realty Corporation (QRC). Prime Terracota is the effective 60% voting / 40% economic owner of EDC through its subsidiary Red Vulcan. Prior to its issuance of preferred shares to LIRF and QRC, Prime Terracota was a wholly-owned subsidiary of First Gen. With the issuance of the preferred shares, First Gen’s voting interest in Prime Terracota is now reduced to 45%, with the balance taken up by LIRF (40%) and QRC (15%). This transaction triggered the deconsolidation of Prime Terracota, Red Vulcan, EDC and FG Hydro (collectively referred to as the Prime Terracota Group) in First Gen’s consolidated financial statements effective May 2009. Thereafter, First Gen’s investment in Prime Terracota is accounted for using the equity method in the consolidated financial statements of First Gen as it still retains significant influence over Prime Terracota through its 45%-voting interest.
FG Hydro was incorporated on March 13, 2006 as a wholly-owned subsidiary of First Gen. On September 8, 2006, FG Hydro emerged as the winning bidder for the then 100 MW Pantabangan and the 12 MW Masiway Hydroelectric Power Plants (PMHEPP). The then 112 MW PMHEPP was transferred to FG Hydro on November 18, 2006, representing the first major generating asset of NPC to be successfully transferred to the private sector. On October 15, 2008, First Gen’s Board of Directors approved the sale of 60% of FG Hydro to EDC and the divestment was completed in November 2008. As a result of the divestment, First Gen’s direct voting and indirect voting interest in FG Hydro after the transaction are 40% and 36%, respectively. Moreover, the completion of the rehabilitation and upgrade project of Pantabangan hydroelectric power plant’s Units 1 and 2 in 2010 increased the power generation capacity of PMHEPP to 132 MW.
First Private Power Corporation (FPPC) was established on November 27, 1992 primarily to engage in power generation. FPPC is 40%-owned by First Gen. FPPC owns a 93.25% interest in BPPC. BPPC was incorporated on February 3, 1993 and operated the Bauang power plant in Payocpoc Sur, Bauang, La Union, a 225 MW bunker-fired power plant which had a BOT with NPC for a period of fifteen (15) years from July 25, 1995 until July 25, 2010. BPPC’s BOT contract with NPC expired last July 25, 2010 and the Bauang power plant was turned-over to NPC on the same date. On November 15, 2010, BPPC and FPPC filed an application to be merged into one entity, with the former as the surviving entity. The application for merger was approved by the Securities and Exchange Commission of the Philippines on December 13, 2010, and the assets and liabilities of FPPC have been transferred to, and absorbed by, BPPC on December 15, 2010, the effectivity date of the merger.

3 | P a g e
In November 2008, First Gen completed the divestment of a 60% controlling stake in FG Hydro to EDC. In May 2009, with the investments of LIRF and QRC in the voting preferred shares of Prime Terracota, First Gen’s voting interest in Prime Terracota was reduced to 45%. Under Philippine Financial Reporting Standards (PFRS), a subsidiary is consolidated from the date on which the parent first achieves control up to the date on which control is lost. The operating results of controlled entities acquired or disposed of during the year are included in the consolidated statement of income from the date of acquisition and up to the date of disposal, as appropriate.
Deconsolidation of Prime Terracota, Red Vulcan, EDC and FG Hydro
As a result of the foregoing transactions, the consolidated financial statements of First Gen contained herein present the financial information of the Prime Terracota Group as follows:
the consolidated statements of income and the consolidated statements of cashflows for the year ended December 31, 2008 reflect the results of operations and cash flows of the Prime Terracota Group under the line item “Discontinued Operations”. However, in the consolidated statements of income and the consolidated statements of cashflows for the year ended December 31, 2009, the results of operations and cash flows of the Prime Terracota Group for the period ended April 30, 2009 is reflected under the line item “Discontinued Operations”. The consolidated statements of income and the consolidated statements of cashflows have been restated, as permitted under PFRS, and do not include the revenue and expense line items of the Prime Terracota Group for comparative purposes; and,
the consolidated statement of financial position as of December 31, 2009 does not consolidate the results of the Prime Terracota Group due to the divestment explained above. Beginning May 2009, First Gen’s investments in Prime Terracota and FG Hydro are shown as part of “Investments in associates” in the consolidated statement of financial position. Subsequent to the deconsolidation, the results of operations for the eight-month period ended December 31, 2009 and for the year ended December 31, 2010 are now accounted for using the equity method of accounting and are reflected in the “Equity in net earnings of associates” account in the consolidated statement of income.
Under PFRS, First Gen’s interests in the Prime Terracota Group are required to be reported under the equity method of accounting from the date on which control was lost, which occurred in May 2009, and restating the consolidated statement of income for the periods when Prime Terracota, Red Vulcan, EDC, and FG Hydro were still controlled and consolidated is permitted so as to provide some form of comparability with the new presentation. MANAGEMENT'S DISCUSSION AND ANALYSIS OF FINANCIAL CONDITION AND RESULTS OF OPERATIONS A. FINANCIAL RESULTS FOR THE YEARS ENDED DECEMBER 31, 2010, 2009 AND 2008
(Amounts in USD thousands) 2010 2009 2008 Statements of Income Data
Revenues $1,244,278 $1,022,116 $1,262,398 Income from continuing operations before income tax
$162,826
$91,157
$124,151
Net income attributable to Equity Holders of the Parent Company
$70,217
$16,754
$14,474
Statements of Financial Position Data 2010 2009 2008
ASSETS
Total current assets $377,889 $346,515 $665,541 Long-term receivables - net of current portion – – 652,831 Investments in associates 1,207,518 1,020,722 20,958 Property, plant and equipment 580,663 562,238 736,262 Intangible assets 17,370 17,972 1,301,651 Deferred income tax assets 3,794 10 71,794 Other noncurrent assets 154,159 213,566 248,840

4 | P a g e
Total Assets $2,341,393 $2,161,023 $3,697,877
LIABILITIES AND EQUITY
Total current liabilities $383,621 $282,566 $996,508 Bonds payable – net of current portion – 277,353 362,978 Long-term debt – net of current portion 729,502 700,324 1,073,285 Derivative liabilities – net of current portion 39,911 25,335 59,861 Retirement liability 722 167 24,899 Deferred income tax liabilities – net 10,479 18,609 30,036 Other noncurrent liabilities 29,189 49,632 131,899
Total Liabilities 1,193,424 1,353,986 2,679,466 Equity attributable to Equity Holders of the Parent Company 989,296 663,034 458,660 Non-controlling Interests 158,673 144,003 559,751
Total Equity 1,147,969 807,037 1,018,411
Total Liabilities and Equity $2,341,393 $2,161,023 $3,697,877
RESULTS OF OPERATIONS
December 2010 vs. December 2009 Results
CONSOLIDATED STATEMENTS OF INCOME Revenues Based on the audited consolidated financial statements for the year ended December 31, 2010, First Gen's revenues increased by $222.1 million or 21.7% to $1,244.3 million in 2010 from $1,022.1 million in 2009. The increase was due to higher revenues from sale of electricity by $159.2 million or 15.8% to $1,169.1 million in 2010 from $1,009.9 million in 2009, which resulted from higher fuel charges during the year as oil prices increased in the world market. Fuel revenues increased by $150.5 million with gas prices averaging at $9.6/GJ (or $10.2/MMBtu) in 2010 versus $8.6/GJ (or $9.1/MMBtu) in 2009. With the scheduled maintenance outage of the Malampaya platform in February and March 2010 and several gas curtailments that were experienced during the year, the Santa Rita and San Lorenzo power plants were required to operate on more expensive liquid fuel. The gas plants’ combined dispatch were slightly higher year-on-year at 82.7% capacity factor in 2010 compared to 82.3% in 2009. Another factor for the increase in total revenues was the mark-to-market (MTM) gain on derivatives in 2010 amounting to $5.4 million, as compared to the $0.9 million MTM loss in 2009. Derivative gains or losses recognized during the year pertain to MTM changes in the valuation of First Gen’s existing Convertible bonds and the call option to purchase EDC shares. First Gen has a call option over an aggregate of 585 million common shares of EDC exercisable up to April 2013 (see Note 13 of First Gen’s audited consolidated financial statements for the year ended December 31, 2010). The equity in net earnings of associates amounting to $47.7 million in 2010 significantly increased by $46.6 million as compared to $1.2 million in 2009 indicating the full year effect of the Prime Terracota Group as an associate. In 2009, equity in net earnings only included the share in net earnings of the Prime Terracota Group from the time of deconsolidation in May 2009 to December 2009. Earnings from the Prime Terracota Group for the periods January to April 2009 is reflected under “Net income from discontinued operations” in the consolidated statements of income for the year ended December 31, 2009.

5 | P a g e
Out of the total dollar increase in equity in net earnings, $39.8 million and $12.0 million are due to the higher equity in net earnings from EDC and FG Hydro, respectively. These were partly offset by the absence of equity in net earnings from BPPC as the Bauang BOT contract with NPC expired last July 2010. On a 12-month year-on-year comparison (adjusting for the attributable earnings from the Prime Terracota Group during the periods January to April 2009), net earnings from EDC is higher only by $21.5 million or 69.4%. The increase is due to higher revenues from Green Core Geothermal, Inc. (Green Core), a subsidiary of EDC which operates the Palinpinon-Tongonan power plants, following its full year operation in 2010 as compared to two months in 2009; net increase in miscellaneous income from the recovery of impairment loss on Input VAT claims amounting to P1,746.8 million, and absence of a deferred tax assets write-down due to implementation of the Renewable Energy (RE) law which amounted to P2,959.2 million in 2009 . Similarly, net earnings from FG Hydro is higher only by $8.4 million or 551.7% due to high WESM prices during the year and high volume of electricity sales during the first quarter of 2010. In addition, lower interest expense at Red Vulcan and Prime Terracota by $7.6 million and $3.2 million, respectively, also contributed to the higher contributions to earnings during the year. Total revenue was further increased by interest income amounting to $8.9 million in 2010, which increased by $1.9 million or 27.9% from $6.9 million in 2009. This resulted from higher ending cash balances at the Parent company level due to the new loans availed during the year and the remaining cash from the Rights Offer. The Parent company also received management fees amounting to $3.9 million in 2010, which improved by $0.4 million or 11.9% from $3.5 million in 2009. Moreover, there were additional reimbursements to cover employee costs of First Gen’s seconded employees that were charged to EDC during the year. Net Income
First Gen’s consolidated net income increased by $26.0 million or 27.4 % to $121.0 million in 2010 from $95.0 million in 2009. The significant change in consolidated net income was a result of the movements of the following items:
Consolidated Net Income
Net income from continuing operations increased by $68.0 million to $121.0 million resulting from:
• higher Equity in net earnings of associates by $46.6 million resulting from the recognition of equity in net earnings of the Prime Terracota Group covering the whole year of 2010 as compared to the eight months recognized in 2009; the higher net earnings from EDC was due to higher revenues from Green Core following its full year operation in 2010 as compared to two months in 2009, net increase in miscellaneous income from the recovery of impairment loss on Input VAT claims, and absence of a deferred tax assets write-down in 2010. Adding to this was the higher net earnings from FG Hydro due to high WESM prices during the year and high volume of electricity sales during the first quarter of 2010. In addition, lower interest expense at Red Vulcan and Prime Terracota by $7.6 million and $3.2 million, respectively, also contributed to the higher contributions to earnings in 2010;
• the recognition of MTM gain on derivatives of $5.4 million in 2010, a reversal from last year’s $0.9 million MTM loss on derivatives. Derivative gains or losses recognized during the year pertain to MTM changes in the valuation of First Gen’s existing Convertible bonds and the call option to purchase EDC shares;
• increased interest income by $1.9 million or 27.9% resulting from higher ending cash balances at
the Parent company level due to the new loans availed during the year and the remaining cash from the Rights Offer;

6 | P a g e
• interest expense and financing charges decreased by $7.9 million due to lower interest expense as a result of scheduled loan repayments of FGPC and FGP. Another factor adding to this decrease is the Parent company’s buy-back of its Convertible bonds and the maturity of the Peso-denominated bond in July 2010. The decrease was, however, partially offset by the higher interest expense at UHC by $2.8 million after recognizing a full year of interest expense on its P5.4 billion loan, which was drawn in March 2009;
• Other revenues were higher by $9.0 million as a result of the recognition of higher consultancy fees and reimbursements to cover employee costs of the First Gen’s seconded employees to EDC; and,
• Lower foreign exchange loss of $5.1 million in 2010 as compared to a $8.7 million foreign
exchange loss recognized in 2009 resulting from the payment of the Peso-denominated bond in July 2010, which reduced First Gen’s exposure to foreign exchange translation.
The increase in net income from continuing operations was offset by the absence of net income from discontinued operations during the year as compared to the amount recognized in 2009 of $42.0 million. This amount pertains to the net income of the Prime Terracota Group from January to April 2009, prior to the deconsolidation. Considering the absence of net income from discontinued operations, First Gen’s consolidated net income increased by $26.0 million or 27.4 % to $121.0 million in 2010 from $95.0 million in 2009.
Of the $121.0 million consolidated net income for the year ended December 31, 2010, net income attributable to the Parent company amounted to $70.2 million, which is $53.5 million or 319.1% higher than the $16.7 million net income attributable to the Parent company in 2009.
Net Income Attributable to Equity Holders of the Parent Company
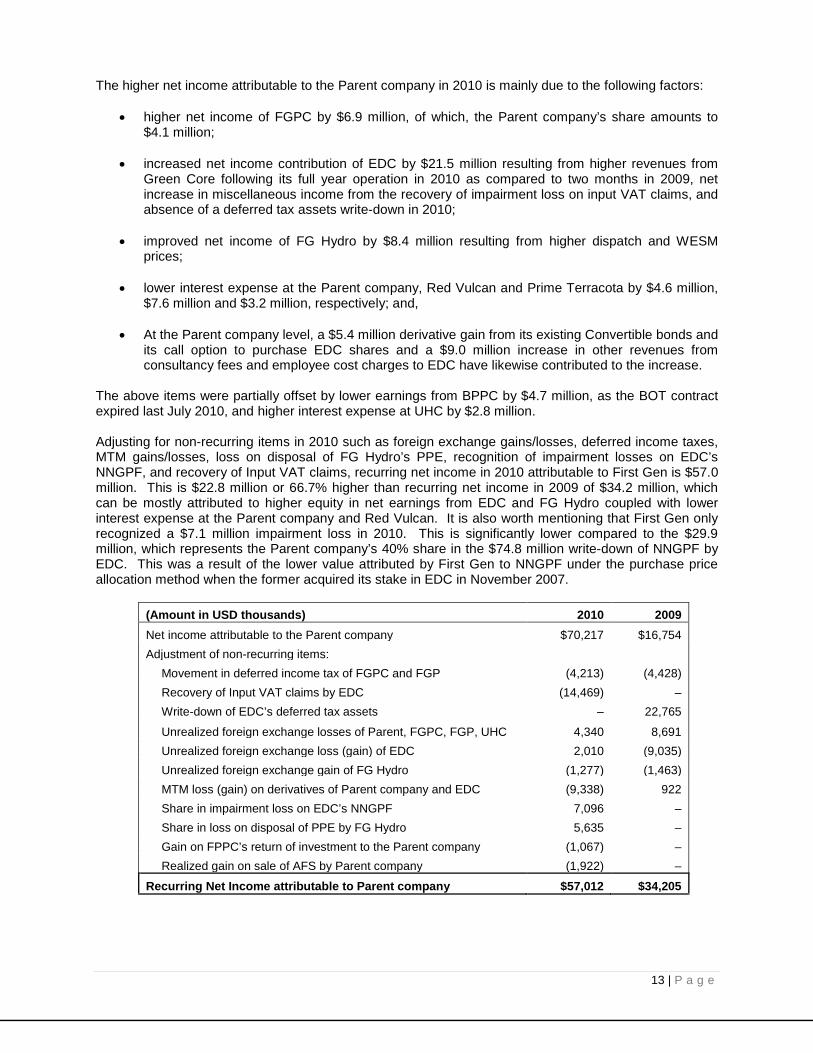
The higher net income attributable to the Parent company in 2010 is mainly due to the following factors:
• higher net income of FGPC by $6.9 million, of which, the Parent company’s share amounts to $4.1 million;
• increased net income contribution of EDC by $21.5 million resulting from higher revenues from Green Core following its full year operation in 2010 as compared to two months in 2009, net increase in miscellaneous income from the recovery of impairment loss on input VAT claims, and absence of a deferred tax assets write-down in 2010;
• improved net income of FG Hydro by $8.4 million resulting from higher dispatch and WESM prices;
• lower interest expense at the Parent company, Red Vulcan and Prime Terracota by $4.6 million, $7.6 million and $3.2 million, respectively; and,
• At the Parent company level, a $5.4 million derivative gain from its existing Convertible bonds and its call option to purchase EDC shares and a $9.0 million increase in other revenues from consultancy fees and employee cost charges to EDC have likewise contributed to the increase.
The above items were partially offset by lower earnings from BPPC by $4.7 million, as the BOT contract expired last July 2010, and higher interest expense at UHC by $2.8 million. Adjusting for non-recurring items in 2010 such as foreign exchange gains/losses, deferred income taxes, MTM gains/losses, loss on disposal of FG Hydro’s PPE, recognition of impairment losses on EDC’s NNGPF, and recovery of Input VAT claims, recurring net income in 2010 attributable to First Gen is $57.0 million. This is $22.8 million or 66.7% higher than recurring net income in 2009 of $34.2 million, which can be mostly attributed to higher equity in net earnings from EDC and FG Hydro, coupled with lower

7 | P a g e
interest expense at the Parent company and Red Vulcan. It is also worth mentioning that First Gen only recognized a $7.1 million impairment loss in 2010. This is significantly lower compared to the $29.9 million, which represents the Parent company’s 40% share in the $74.8 million write-down of NNGPF by EDC. This was a result of the lower value attributed by First Gen to NNGPF under the purchase price allocation method when the former acquired its stake in EDC in November 2007.
(Amount in USD thousands) 2010 2009 Net income attributable to the Parent company $70,217 $16,754 Adjustment of non-recurring items:
Movement in deferred income tax of FGPC and FGP (4,213) (4,428) Recovery of Input VAT claims by EDC (14,469) – Write-down of EDC’s deferred tax assets – 22,765
Unrealized foreign exchange losses of Parent, FGPC, FGP, UHC 4,340 8,691 Unrealized foreign exchange loss (gain) of EDC 2,010 (9,035) Unrealized foreign exchange gain of FG Hydro (1,277) (1,463) MTM loss (gain) on derivatives of Parent company and EDC (9,338) 922 Share in impairment loss on EDC’s NNGPF 7,096 – Share in loss on disposal of PPE by FG Hydro 5,635 – Gain on FPPC’s return of investment to the Parent company (1,067) – Realized gain on sale of AFS by Parent company (1,922) –
Recurring Net Income attributable to Parent company $57,012 $34,205
CONSOLIDATED STATEMENTS OF FINANCIAL POSITION
ASSETS
Major movements in the audited consolidated statements of financial position of First Gen Group from December 31, 2009 to December 31, 2010 resulted in a net increase of $180.4 million or 8.3% in First Gen Group’s consolidated total assets. The net increase is a result of the following major movements: Cash and cash equivalents increased by $75.7 million or 60.3% as a result of the remaining cash
proceeds from the Rights Offer, new loans availed, and cash accumulated from operations during the year.
Investments in associates increased by $186.8 million or 18.3% due to higher accumulated equity in
net earnings of the Prime Terracota Group, additional deposits for future stock subscriptions totaling $53.4 million, and the purchase of EDC shares directly by First Gen.
Other noncurrent assets decreased by $59.4 million or 27.8% as a result of the consumption of Prepaid gas during the latter part of 2010, use of spare parts following the scheduled major maintenance outage of the Santa Rita and San Lorenzo power plants in 2010, and payment by BG of its advances from FGPC in connection with the proceeds from the Santa Rita refinancing. These transactions decreased other noncurrent assets by $20.5 million, $36.5 million, and $5.0 million, respectively.
Receivables decreased by $33.8 million or 27.9% as a result of the early payment received from
Meralco covering the November 2010 billings in December 2010, which was otherwise due in January 2011.

8 | P a g e
LIABILITIES AND EQUITY Total liabilities decreased by $160.6 million or 11.9% to $1,193.4 million as of December 31, 2010 from $1,354.0 million as of December 31, 2009 due to the following major movements: Bonds payable decreased by $172.0 million resulting from the buy-back of Convertible bonds and the
payment of the P5.0 billion bonds by the Parent company amounting to $105.5 million. As of December 31, 2010, the Parent company bought back Convertible bonds with a total face value of $74.0 million for a total settlement amount of $83.2 million.
Other noncurrent liabilities decreased by $20.4 million or 41.2% due to the reduction in unearned revenues following the use of Prepaid gas during the latter part of 2010.
Scheduled principal payments during the year amounting to $21.7 million and $26.4 million were made on FGPC’s and FGP’s loans, respectively.
Deferred income tax liabilities decreased by $8.1 million due to lower deferred income tax liabilities of
FGPC, and FGP’s recognition of deferred income tax assets both resulting from the movements in foreign exchange rate of the Philippine Peso against the U.S. dollar in 2010.
Accounts payable and accrued expenses decreased by $5.8 million or 5.5% resulting from the
payment of FGP’s liquid fuel suppliers in February 2010. This decrease was partially offset by higher operations and maintenance (O&M) fees payable to Siemens Power Operations, Inc. (SPOI) following the effectivity of the new O&M agreement on August 1, 2010 and higher payables to the gas sellers as a result of the increase in gas prices.
The above reduction in liabilities was partly offset by the following movements: Availment of new loans by the Parent company in May 2010 amounting to $72.2 million and $11.4
million (or P500.0 million), which increased total outstanding debt by $83.6 million.
Derivative liabilities increased by $14.6 million due to higher derivative liabilities of FGPC resulting from lower LIBOR rates in 2010 as compared to the previous year. FGPC recognized a derivative liability as it entered into interest rate swap agreements to hedge the interest payments of its debt.
Total equity increased by $340.9 million or 42.2% to $1,148.0 million as of December 31, 2010 as compared to $807.1 million as of December 31, 2009 mainly due to the successful completion of the Rights Offer in January 2010 and income earned during the year. Likewise, equity attributable to equity holders of the Parent company increased to $989.3 million, or 49.2% higher, as compared to $663.0 million in 2009.

9 | P a g e
FIRST GEN MATERIAL CHANGES IN FINANCIAL CONDITION (2010 vs. 2009)
Horizontal and Vertical Analyses of Material Changes for the years ended December 31, 2010 vs. 2009
CONSOLIDATED STATEMENTS OF INCOME
HORIZONTAL ANALYSIS VERTICAL ANALYSIS
(Amounts in U.S. Dollars and in Thousands) Dec. 2010 Dec. 2009 2010 vs. 2009
2010 vs. 2009 2010 2009
REVENUE Sale of electricity 1,169,155 1,009,918 159,237 15.8% 94.0% 98.8% Mark-to-market gain on derivatives 5,395 – 5,395 0.0% 0.4% 0.0% Interest 8,881 6,942 1,939 27.9% 0.7% 0.7% Equity in net earnings of associates 47,729 1,167 46,562 3989.9% 3.8% 0.1% Others 13,118 4,089 9,029 220.8% 1.1% 0.4% TOTAL REVENUES 1,244,278 1,022,116 222,162 21.7% 100.0% 100.0%
Fuel cost (821,467) (669,832) (151,635) 22.6% -66.0% -65.5% Power plant operations & maintenance (40,220) (37,624) (2,596) 6.9% -3.2% -3.7% Depreciation and amortization (54,970) (53,932) (1,038) 1.9% -4.4% -5.3% Staff costs (16,582) (10,625) (5,957) 56.1% -1.3% -1.0% Other administrative expenses (38,664) (37,244) (1,420) 3.8% -3.1% -3.6%
Sub-total (971,903) (809,257) (162,646) 20.1% -78.1% -79.2% Interest expense & financing charges (104,222) (112,089) 7,867 -7.0% -8.4% -11.0% Foreign exchange loss - net (5,114) (8,691) 3,577 -41.2% -0.4% -0.9% Mark-to-market loss on derivatives – (922) 922 -100.0% 0.0% -0.1% Other charges (213) – (213) 0.0% 0.0% 0.0%
Total (1,081,452) (930,959) (150,493) 16.2% -86.9% -91.1%
INCOME FROM CONTINUING OPERATIONS BEFORE INCOME TAX
162,826
91,157 71,669 78.6% 13.1% 8.9%
Provision for (benefit from ) Income Tax Current 48,848 45,492 3,356 7.4% 3.9% 4.5% Deferred (7,022) (7,381) 359 -4.9% -0.6% -0.7%
41,826 38,111 3,715 9.7% 3.4% 3.7%
Net income from continuing operations 121,000 53,046 67,954 128.1% 9.7% 5.2%
Net income from discontinued operations – 41,961 (41,961) -100.0% 0.0% 4.1%
NET INCOME 121,000 95,007 25,993 27.4% 9.7% 9.3%
Attributable to:
Equity holders of the Parent Company 70,217 16,754 53,463 319.1% 5.6% 1.6% Non-controlling Interests 783 78,253 (27,470) -35.1% 4.1% 7.7%
Revenues
Revenues for the year ended December 31, 2010 increased by $222.1 million or 21.7% to $1,244.3 million from $1,022.1 million during 2009. The increase was due to the major movements in revenue items as explained in detail below:

10 | P a g e
Revenue from sale of electricity Revenues from the sale of electricity increased by $159.2 million or 15.8% to $1,169.1 million in 2010 from $1,009.9 million in 2009, as a result of higher fuel charges during 2010 as oil prices increased in the world market. With the scheduled maintenance outage of the Malampaya platform in February and March 2010 and several gas curtailments that were experienced during the year, the Santa Rita and San Lorenzo power plants were required to operate on more expensive liquid fuel. In addition, the price of natural gas in 2010 averaged at $9.6/GJ (or $10.2/MMBtu), 11.7% higher than the average price during 2009 of $8.6/GJ (or $9.1/MMBtu). Santa Rita and San Lorenzo also posted a slightly higher plant dispatch in 2010 at a combined average of 82.7% as compared to 82.3% during the same period last year. Mark-to-market (MTM) gain on derivatives The company recognized a $5.4 million MTM gain on derivative transactions in 2010 as the Company recognized $3.9 million gain on its call option to purchase EDC shares in the market and $1.5 million gain on First Gen’s Convertible bonds. First Gen has a call option over an aggregate of 585 million common shares of EDC exercisable up to April 2013 (see Note 13 of First Gen’s audited consolidated financial statements as of December 31, 2010). This is a reversal of the MTM loss on derivative transactions of $0.9 million that was recognized in 2009, which was classified under “Costs and Expenses” account of the Company’s consolidated statements of income. The gain/(loss) on derivatives results from the change in the price of the Convertible bonds in the market vis-à-vis the put option and from the movement of EDC’s share price in the market vis-à-vis the call option’s exercise price. Interest income Interest income increased by $1.9 million or 27.9% to $8.9 million in 2010 from $6.9 million in 2009 as a result of the higher cash balances at the Parent company after the successful completion of the Rights Offer in January 2010 and new loans availed during the year. Equity in net earnings of associates Equity in net earnings of associates amounting to $47.7 million in 2010 significantly increased by $46.6 million as compared to $1.2 million in 2009 showing the full year effect of Prime Terracota Group as an associate. In 2009, equity in net earnings only included the share in net earnings of the Prime Terracota Group from the time of deconsolidation in May 2009 to December 2009. Earnings from the Prime Terracota Group for the periods January to April 2009 is reflected under “Net income from discontinued operations” in the consolidated statements of income. Out of the total dollar increase in equity in net earnings, $39.8 million and $12.0 million are due to the higher equity in net earnings from EDC and FG Hydro, respectively. These were partly offset by the absence of equity in net earnings from BPPC of $4.7 million in 2009 as the Bauang BOT contract with NPC expired last July 2010. On a 12-month year-on-year comparison (adjusting for the attributable earnings from the Prime Terracota Group during the periods January to April 2009), net earnings from EDC is higher only by $21.5 million or 69.4%. The increase is due to higher revenues from Green Core following its full year operation in 2010 as compared to two months in 2009; net increase in miscellaneous income from the recovery of impairment loss on Input VAT claims amounting to P1,746.8 million and absence of a deferred tax assets write-down amounting to P2,959.2 million recognized in 2009 due to implementation of the RE law. Similarly, net earnings from FG Hydro is higher only by $8.4 million or 551.7% due to high WESM prices during the year and high volume of electricity sales during the first quarter of 2010.

11 | P a g e
Other revenues The $9.0 million increase is mainly due to consultancy fees received by First Gen from EDC, which was adjusted effective September 2009. The three-year consultancy services agreement took effect on September 1, 2008 and will end on August 31, 2011. Adding to the increase is the reimbursements to cover employee costs of the First Gen’s seconded employees that were charged to EDC during the year.
Costs and operating expenses for the year ended December 31, 2010 posted a net increase of $162.6 million or 20.1% to $971.9 million as compared to $809.3 million in 2009 as a result of the following movements:
Costs and Operating Expenses
Fuel cost Fuel charges of Santa Rita and San Lorenzo went up by $151.6 million or 22.6% to $821.5 million in 2010 from $669.9 million in 2009. The higher fuel cost was due to the consumption of liquid fuel during the scheduled Malampaya outage in February and March 2010, and during the gas curtailments that were experienced during the year. Both plants were required to operate using a more expensive liquid fuel during these periods. Moreover, the average price of natural gas increased by 11.7% to $9.6/GJ (or $10.2/MMBtu) in 2010 as compared to the average price in 2009 of $8.6/GJ (or $9.1/MMBtu).
Staff costs Staff costs increased by $6.0 million or 56.1% due to a lower weighted average foreign exchange rate in 2010 (P45.309:$1.00) compared to the rate in 2009 (P47.769:$1.00) that was used to convert the Peso-denominated expenses to its U.S. dollar equivalent. In addition, the amounts for the year ended December 31, 2010 already reflect the salary adjustments that were effected during the year. Other administrative expenses Other administrative expenses increased by $1.4 million or 3.8% in 2010 due to higher professional fees at the Parent company level in connection with various financing activities during the year.
Interest expense and financing charges decreased by $7.9 million or 7.0% to $104.2 million in 2010 from $112.1 million in 2009. Interest expense at FGPC and FGP decreased by $5.9 million due to the lower outstanding debt during the year after the scheduled principal payments were made. The Parent company also recognized lower interest expense by $4.6 million after paying down its P5.0 billion bond which matured in July 2010. This was offset by higher interest expense at UHC by $2.8 million after recognizing a full year interest expense on the P5.4 billion corporate notes, drawn in March 2009.
Interest expense and financing charges
In 2010, the Company recognized a MTM gain on derivative transactions of $5.4 million as compared to the MTM loss on derivative transactions of $0.9 million that was recognized in 2009. This MTM gain pertains to the gains in First Gen’s call option to purchase EDC shares and Convertible bonds, which were included as part of “Revenues” in the consolidated statements of income. The net derivative loss in 2009 was due to the change in the fair values of First Gen’s Convertible bonds.
MTM loss on derivatives
Foreign exchange loss amounted to $5.1 million in 2010. Although the peso appreciated, the foreign exchange loss decreased by $3.6 million or 41.2% compared to $8.7 million recognized in 2009 resulting from the payment of the Peso-denominated bond in July 2010, which reduced First Gen’s exposure to foreign exchange translation.
Foreign exchange loss - net
The First Gen group recognized a higher provision for income tax by $3.7 million or 9.7% to $41.8 million in 2010 as compared to $38.1 million in 2009. The increase was primarily due to the higher current income tax resulting from the full year effect of FGP’s income tax following the expiry of FGP’s income tax holiday in February 2009 and the higher taxable income of FGPC.
Provision for (benefit from) Income Tax

12 | P a g e
First Gen’s consolidated net income increased by $26.0 million or 27.4 % to $121.0 million in 2010 from $95.0 million in 2009. The significant change in consolidated net income was a result of the movements of the following items:
Net Income
Net income from continuing operations increased by $68.0 million to $121.0 million resulting from:
• higher Equity in net earnings of associates by $46.6 million resulting from the recognition of equity in net earnings of the Prime Terracota Group covering the whole year of 2010 as compared to the eight months recognized in 2009; the higher net earnings from EDC due to higher revenues from Green Core following its full year operation in 2010 as compared to two months in 2009, net increase in miscellaneous income from the recovery of impairment loss on Input VAT claims, and absence of a deferred tax assets write-down in 2010. Adding to this was the higher net earnings from FG Hydro due to high WESM prices during the year and high volume of electricity sales during the first quarter of 2010. In addition, lower interest expense at Red Vulcan and Prime Terracota by $7.6 million and $3.2 million, respectively, also contributed to the higher contributions to earnings in 2010;
• the recognition of MTM gain on derivatives of $5.4 million in 2010, a reversal from last year’s $0.9 million MTM loss on derivatives. Derivative gains or losses recognized during the year pertain to MTM changes in the valuation of First Gen’s existing Convertible bonds and the call option to purchase EDC shares;
• increased interest income by $1.9 million or 27.9% resulting from higher ending cash balances at
the Parent company level due to the new loans availed during the year and the remaining cash from the Rights Offer;
• interest expense and financing charges decreased by $7.9 million due to lower interest expense
as a result of scheduled loan repayments of FGPC and FGP. Another factor adding to this decrease is the Parent company’s buy-back of its Convertible bonds and the maturity of the Peso-denominated bond in July 2010. The decrease was, however, partially offset by the higher interest expense at UHC by $2.8 million after recognizing a full year of interest expense on its P5.4 billion loan, which was drawn in March 2009;
• Other revenues were higher by $9.0 million as a result of the recognition of higher consultancy fees and reimbursements to cover employee costs of the First Gen’s seconded employees to EDC; and,
• Lower foreign exchange loss of $5.1 million as compared to a $8.7 million foreign exchange loss
recognized in 2009 resulting from the payment of the Peso-denominated bond in July 2010, which reduced First Gen’s exposure to foreign exchange translation.
The increase in net income from continuing operations was offset by the absence of net income from discontinued operations during the year as compared to the amount recognized in 2009 of $42.0 million. This amount pertains to the net income of the Prime Terracota Group from January to April 2009, prior to the deconsolidation. Considering the absence of net income from discontinued operations, First Gen’s consolidated net income increased by $26.0 million or 27.4 % to $121.0 million in 2010 from $95.0 million in 2009.
Of the $121.0 million consolidated net income for the year ended December 31, 2010, net income attributable to the Parent company amounted to $70.2 million, which is $53.5 million or 319.1% higher than the $16.7 million net income attributable to the Parent company in 2009.
Net Income Attributable to Equity Holders of the Parent Company
13 | P a g e
The higher net income attributable to the Parent company in 2010 is mainly due to the following factors:
• higher net income of FGPC by $6.9 million, of which, the Parent company’s share amounts to $4.1 million;
• increased net income contribution of EDC by $21.5 million resulting from higher revenues from Green Core following its full year operation in 2010 as compared to two months in 2009, net increase in miscellaneous income from the recovery of impairment loss on input VAT claims, and absence of a deferred tax assets write-down in 2010;
• improved net income of FG Hydro by $8.4 million resulting from higher dispatch and WESM prices;
• lower interest expense at the Parent company, Red Vulcan and Prime Terracota by $4.6 million, $7.6 million and $3.2 million, respectively; and,
• At the Parent company level, a $5.4 million derivative gain from its existing Convertible bonds and its call option to purchase EDC shares and a $9.0 million increase in other revenues from consultancy fees and employee cost charges to EDC have likewise contributed to the increase.
The above items were partially offset by lower earnings from BPPC by $4.7 million, as the BOT contract expired last July 2010, and higher interest expense at UHC by $2.8 million. Adjusting for non-recurring items in 2010 such as foreign exchange gains/losses, deferred income taxes, MTM gains/losses, loss on disposal of FG Hydro’s PPE, recognition of impairment losses on EDC’s NNGPF, and recovery of Input VAT claims, recurring net income in 2010 attributable to First Gen is $57.0 million. This is $22.8 million or 66.7% higher than recurring net income in 2009 of $34.2 million, which can be mostly attributed to higher equity in net earnings from EDC and FG Hydro coupled with lower interest expense at the Parent company and Red Vulcan. It is also worth mentioning that First Gen only recognized a $7.1 million impairment loss in 2010. This is significantly lower compared to the $29.9 million, which represents the Parent company’s 40% share in the $74.8 million write-down of NNGPF by EDC. This was a result of the lower value attributed by First Gen to NNGPF under the purchase price allocation method when the former acquired its stake in EDC in November 2007.
(Amount in USD thousands) 2010 2009 Net income attributable to the Parent company $70,217 $16,754 Adjustment of non-recurring items:
Movement in deferred income tax of FGPC and FGP (4,213) (4,428) Recovery of Input VAT claims by EDC (14,469) – Write-down of EDC’s deferred tax assets – 22,765
Unrealized foreign exchange losses of Parent, FGPC, FGP, UHC 4,340 8,691 Unrealized foreign exchange loss (gain) of EDC 2,010 (9,035) Unrealized foreign exchange gain of FG Hydro (1,277) (1,463) MTM loss (gain) on derivatives of Parent company and EDC (9,338) 922 Share in impairment loss on EDC’s NNGPF 7,096 – Share in loss on disposal of PPE by FG Hydro 5,635 – Gain on FPPC’s return of investment to the Parent company (1,067) – Realized gain on sale of AFS by Parent company (1,922) –
Recurring Net Income attributable to Parent company $57,012 $34,205

14 | P a g e
CONSOLIDATED STATEMENTS OF FINANCIAL POSITION Horizontal and Vertical Analyses of Material Changes as of December 31, 2010 and 2009
HORIZONTAL ANALYSIS VERTICAL ANALYSIS
Increase (Decrease)
(Amounts in U.S. Dollars and in Thousands) Dec-10 Dec-09 2010 vs. 2009 (Audited) (Audited) Amount % Dec-10 Dec-09 ASSETS Current Assets Cash and cash equivalents $201,251 $125,531 $75,720 60.3% 8.6% 5.8% Receivables 87,503 121,334 (33,831) -27.9% 3.7% 5.6% Inventories 51,013 65,072 (14,059) -21.6% 2.2% 3.0% Other current assets 38,122 34,578 3,544 10.2% 1.6% 1.6% Total Current Assets 377,889 346,515 31,374 9.1% 16.1% 16.0% Noncurrent Assets Investments in associates 1,207,518 1,020,722 186,796 18.3% 51.6% 47.2% Property, plant and equipment 580,663 562,238 18,425 3.3% 24.8% 26.0%
Intangible assets 17,370 17,972 (602) -3.3% 0.7% 0.8% Deferred income tax assets 3,794 10 3,784 37840.0% 0.2% 0.0% Other noncurrent assets 154,159 213,566 (59,407) -27.8% 6.6% 9.9% Total Noncurrent Assets 1,963,504 1,814,508 148,996 8.2% 83.9% 84.0%
TOTAL ASSETS $2,341,393 $2,161,023 $180,370 8.3% 100.0% 100.0%
LIABILITIES AND EQUITY Current Liabilities Accounts payable and accrued expenses $98,698 $104,451 ($5,753) -5.5% 4.2% 4.8% Income tax payable 5,253 7,543 (2,290) -30.4% 0.2% 0.3% Due to related parties 6,709 6,711 (2) 0.0% 0.3% 0.3% Convertible bonds redeemed 83,134 – 83,134 0.0% 3.6% 0.0% Convertible bonds not redeemed 130,149 – 130,149 0.0% 5.6% 0.0% Current portion of long-term debt 59,678 46,499 13,179 28.3% 2.5% 2.2% Philippine peso-denominated bonds – 107,984 (107,984) -100.0% 0.0% 5.0%
Obligations to Gas Sellers on Annual Deficiency – 9,378 (9,378) -100.0% 0.0% 0.4%
Total Current Liabilities 383,621 282,566 101,055 35.8% 16.4% 13.1%
Noncurrent Liabilities Convertible bonds – 277,353 (277,353) -100.0% 0.0% 12.8% Long-term debt – net of current portion 729,502 700,324 29,178 4.2% 31.2% 32.4% Derivative liabilities 39,911 25,335 14,576 57.5% 1.7% 1.2% Retirement liability 722 167 555 332.3% 0.0% 0.0% Deferred income tax liabilities – net 10,479 18,609 (8,130) -43.7% 0.4% 0.9%
Other noncurrent liabilities 29,189 49,632 (20,443) -41.2% 1.2% 2.3%
Total Noncurrent Liabilities 809,803 1,071,420 (261,617) -24.4% 34.6% 49.6%
TOTAL LIABILITIES 1,193,424 1,353,986 (160,562) -11.9% 51.0% 62.7% Equity Attributable to Equity Holders of the Parent Redeemable preferred stock 14,585 13,561 1,024 7.6% 0.6% 0.6% Common stock 74,697 45,915 28,782 62.7% 3.2% 2.1% Additional paid-in capital 590,193 320,455 269,738 84.2% 25.2% 14.8% Deposits for future stock subscriptions – 93,318 (93,318) -100.0% 0.0% 4.3%

15 | P a g e
Accumulated share in other comprehensive losses of associates (21,006) (78,516) 57,510 -73.2% -0.9% -3.6% Cumulative translation adjustments (16,309) (9,642) (6,667) 69.1% -0.7% -0.4% Retained earnings 400,123 330,930 69,193 20.9% 17.1% 15.3% Cost of common stock held in treasury (52,987) (52,987) – 0.0% -2.3% -2.5%
989,296 663,034 326,262 49.2% 42.3% 30.7%
Non-controlling Interests 158,673 144,003 14,670 10.2% 6.8% 6.7%
Total Equity 1,147,969 807,037 340,932 42.2% 49.0% 37.3%
TOTAL LIABILITIES AND EQUITY $2,341,393 $2,161,023 $180,370 8.3% 100.0% 100.0% Cash and cash equivalents This account consists mainly of cash on hand and in banks. Cash equivalents include cash investments with original maturities of less than three months. Cash and cash equivalents increased by $75.7 million or 60.3% to $201.2 million as of December 31, 2010 as compared to $125.5 million as of December 31, 2009. The increase is mainly due to accumulated cash from operations and the higher cash balances at the Parent company level due to the remaining proceeds from the Rights Offer that was completed in January 2010 and new loans availed during the year. Adding to the increase is the higher ending cash balances at FGPC and FGP since payments from Meralco for the November 2010 billing were received early, which were otherwise due in January 2011. Receivables Receivables decreased by $33.8 million or 27.9% to $87.5 million as of December 31, 2010 from $121.3 million as of December 31, 2009. The decrease mainly resulted from the early payment received from Meralco covering the November 2010 billings. Receivables from Meralco as of December 31, 2009 still include the November 2009 billings which were paid by Meralco in January 2010. Inventories The decrease in this account by $14.1 million or 21.6% was due to the use of liquid fuel during the scheduled 30-day maintenance outage of the Malampaya gas plant which started in February 2010. Other current assets This account increased by $3.5 million or 10.2% primarily due to higher balance of current maturing receivables from BG during the year and higher prepaid expenses. Investments in associates This account, which increased by $186.8 million or 18.3%, mainly includes the accumulated equity in net earnings of the Prime Terracota Group, the additional deposits for future stock subscription totaling to $53.4 million, and the cost of the EDC shares that were purchased directly by the Parent company through an ordinary block sale in the Philippine Stock Exchange (PSE). As of December 31, 2010, First Gen has a 3% direct ownership in EDC. It is worth mentioning that on April 19, 2010, First Gen executed a call option agreement over an aggregate 585 million common shares of stock in EDC within a period of three years or up to April 2013. Property, plant, and equipment – net This account slightly increased by $18.4 million or 3.3% mainly due to the prepaid major spare parts that were reclassified from “Other noncurrent assets” account as a result of the scheduled major maintenance outages of the Santa Rita and San Lorenzo power plants that were completed during the year. This increase was partially offset by the depreciation expenses for the year. Intangible assets This account decreased by $0.6 million or 3.3% due to amortization of FGP’s “Pipeline rights” for the year.

16 | P a g e
Deferred income tax assets This account increased by $3.8 million as a result of appreciation of the Philippine Peso against the U.S. dollar (i.e. from P46.20 in December 2009 to P43.84 in December 2010). In the case of FGP, this appreciation has led to higher difference between the carrying values of non-monetary assets and their related tax bases as of December 31, 2010 which resulted to a higher deferred income tax asset. Other noncurrent assets This account decreased by $59.4 million or 27.8% due to the consumption of Prepaid gas by FGPC and FGP during the latter part of 2010. Moreover, the cost of spare parts pertaining to turbine blades of the Santa Rita and San Lorenzo power plants, which were previously capitalized under “Prepaid major spare parts” account were now reclassified under “Property, plant, and equipment” account as these parts were used during the gas plant’s scheduled major maintenance outages during the year. Accounts payable and accrued expenses This account decreased by $5.8 million or 5.5% due to lower net trade payables of FGPC and FGP during the year. In February 2010, FGP settled its payments with its liquid fuel suppliers. This decrease was partially offset by the increase in FGPC’s O&M fees payable to SPOI following the effectivity of the new Operations O&M agreement on August 1, 2010. The increase in gas prices during the year likewise resulted in higher payables to the gas sellers. Income tax payable Income tax payable decreased by $2.3 million or 30.4% which resulted from higher creditable withholding taxes applied against the income tax payables of FGPC and FGP in 2010. Obligations to Gas Sellers on Annual Deficiency The $9.4 million decrease in this account pertains to the settlement of the Annual Deficiency claims for Contract Year 2006. The original balance of $9.4 million has been reduced to $2.1 million following the final settlement of the gas dispute which took effect in June 2010. Convertible bonds redeemed This account pertains to the total put value of the Convertible bonds that will be redeemed in February 2011. On February 11, 2011, holders of the First Gen’s Convertible bonds amounting to $72.5 million exercised their option to require the Parent company to redeem the Convertible bonds at a price of 115.6% of the face value. The total put value amounting to $83.8 million (with a face value of $72.5 million and carrying value of $83.1 million) was paid on February 11, 2011. Convertible bonds not redeemed After the redemption on February 11, 2011 as explained above, this account pertains to the carrying value of the unredeemed Convertible bonds amounting to $130.1 million (with face value of $113.5 million) which will now have a maturity date of February 11, 2013. As compared to the $277.4 million value in December 2009, the carrying value of the Convertible bonds decreased due to the buy-back of Convertible bonds during the year, with a face value of $74.0 million, by the Parent company for a total settlement amount of $83.2 million. Philippine peso-denominated bonds The decrease in this account pertains to the final maturity of the P5.0 billion bond, which matured on July 30, 2010. Derivative liabilities This account increased by $14.6 million or 57.5% due to higher derivative liabilities of FGPC resulting from lower LIBOR rates in 2010 as compared to the previous year. FGPC recognized a derivative liability as it entered into interest rate swap agreements to hedge the interest payments of its debt. Retirement liability The $0.6 million increase in this account was due to the effect of the revised actuarial valuation report across the First Gen group during the year.

17 | P a g e
Deferred income tax liabilities – net The decrease of $8.1 million or 43.7% was due to lower deferred tax liabilities of FGPC and FGP, as a result of the movements in foreign exchange rate of the Philippine Peso against the U.S. dollar (i.e. from P46.20 in December 2009 to P43.84 in December 2010). Other noncurrent liabilities – net of current portion This account decreased by $20.4 million or 41.2% resulting from the use of Prepaid gas by the gas plants during the latter part of 2010, which led to the decrease in “Unearned revenues” account by $20.5 million, though partially offset by the accretion of the asset retirement obligation amounting to $0.1 million. The settlement of the outstanding dispute with the gas sellers covering the Annual Deficiency claims for 2006 has likewise led to lower ending balances for this account. Redeemable preferred stock The $1.0 million or 7.6% increase in this account pertains to the stock dividends on Series “E” preferred shares that were declared in 2010. Common stock The $28.8 million or 62.7% increase in common stock was due to the Rights Offer that was successfully completed in January 2010. Additional paid-in capital The $269.7 million or 84.2% increase in this account pertains to the proceeds from the Rights Offer in excess of the par value of the stocks issued, net of transaction costs. Accumulated share in other comprehensive losses of associates The Company recognized a reduction in equity amounting to $21.0 million as of December 2010, which was $57.5 million or 73.2% lower compared to the $78.5 million in 2009. This account reflects First Gen’s share in the translation of the peso-denominated balances of the Prime Terracota Group into U.S. Dollar, which is First Gen’s functional currency, effective May 2009. The reduction in this amount is due to the appreciation of the Philippine peso against the U.S. dollar from P46.20 in December 2009 to P43.84 in December 2010. Cumulative translation adjustments This contra-equity account increased by $6.7 million or 69.1% to reflect First Gen’ share in the translation of the peso-denominated balances of the subsidiaries and the unfavorable movements in the MTM valuation of FGPC’s and FGP’s interest rate swaps. As noted above, the appreciation of the Philippine peso against the U.S. dollar and the lower LIBOR rates in 2010 as compared to the previous year has led to the change in this account. Retained earnings First Gen’s retained earnings increased by $69.2 million or 20.9% resulting from the earnings accumulated during the year. The increase was partially offset by the $1.0 million stock dividend to the Parent company’s preferred shareholders. Non-controlling Interests This account increased by $14.7 million or 10.2% as a result of higher earnings, net of dividends received, from FGPC and FGP accumulated during the year.

18 | P a g e
FIRST GEN MATERIAL CHANGES IN FINANCIAL CONDITION (2009 vs. 2008)
Horizontal and Vertical Analyses of Material Changes for the years ended December 31, 2009 vs. 2008
CONSOLIDATED STATEMENTS OF INCOME
HORIZONTAL ANALYSIS VERTICAL ANALYSIS
(Amounts in USD thousands) Dec 2009 (Audited)
Dec. 2008 (Audited)
2009 vs. 2008
2009 vs. 2008 2009 2008
REVENUE Sale of electricity $1,009,918 $1,212,016 ($202,098) -16.7% 98.8% 6.0% Interest 6,942 9,079 (2,137) -23.5% 0.7% 0.7% Equity in net earnings of associates 1,167 3,530 (2,363) -66.9% 0.1% 0.3% Mark-to-market gain on derivatives -net – 12,190 (12,190) -100.0% 0.0% 1.0% Foreign exchange gains - net – 24,011 (24,011) -100.0% 0.0% 1.9% Others 4,089 1,572 2,517 159.9% 0.4% 0.1% TOTAL REVENUES 1,022,116 1,262,398 (240,282) -19.0% 100.0% 100.0% Fuel cost (669,832) (863,874) 194,042 -22.5% -65.5% -68.4% Depreciation and amortization (53,932) (54,026) 94 -0.2% -5.3% -4.3% Power plant operations & maintenance (37,624) (37,320) (304) 0.8% -3.7% -3.0% Staff costs (10,625) (12,027) 1,402 -11.7% -1.0% -1.0% Other administrative expenses (37,244) (49,263) 12,019 -24.4% -3.6% -3.9%
Sub-total (809,257) (1,016,510) 207,253 -20.4% -79.2% -80.5% Interest expense & financing charges (112,089) (121,417) 9,328 -7.7% -11.0% -9.6% Foreign exchange loss - net (8,691) – (8,691) 0.0% -0.9% 0.0% Mark-to-market loss on derivatives - net (922) – (922) 0.0% -0.1% 0.0% Other charges – (320) 320 -100.0% 0.0% 0.0%
Total (930,959) (1,138,247) 207,288 -18.2% -91.1% -90.2%
INCOME FROM CONTINUING OPERATIONS BEFORE INCOME TAX 91,157 124,151 (32,994) -26.6% 8.9% 9.8% Provision for (benefit from ) income tax
Current 45,492 31,448 14,044 44.7% 4.5% 2.5% Deferred (7,381) 18,472 (25,853) -140.0% -0.7% 1.5%
38,111 49,920 (11,809) -23.7% 3.7% 4.0%
Net income from continuing operations 53,046 74,231 (21,185) -28.5% 5.2% 5.9% Net income from discontinued operations 41,961 19,237 22,724 118.1% 4.1% 1.5%
NET INCOME $95,007 $93,468 $1,539 1.6% 9.3% 7.4%
Attributable to: Equity holders of the Parent Company $16,754 $14,474 $2,280 15.8% 1.6% 1.1% Non-controlling Interests 78,253 78,994 (741) -0.9% 7.7% 6.3%
Revenues decreased by 19.0% or $240.3 million to $1,022.1 million in 2009 from $1,262.4 million in 2008. The decrease was due to the major movements in revenue items as explained in detail below:
Revenues

19 | P a g e
Revenue from sale of electricity Revenues from the sale of electricity decreased by $202.1 million or 16.7% to $1,009.9 million in 2009 from $1,212.0 million in 2008, which resulted from lower fuel charges during the year as oil prices declined in the world market. Fuel revenues decreased by $199.4 million with gas prices averaging at $8.6/GJ (or $9.1/MMBtu) in 2009 versus $11.6/GJ (or $12.3/MMBtu) in 2008. The gas plants’ combined dispatch was marginally higher at 82.2% capacity factor in 2009 compared to 81.6% in 2008, making Santa Rita and San Lorenzo the highest dispatched in the Luzon grid. Mark-to-market (MTM) gain on derivatives The $12.2 million decrease in this account pertains to the non-recurring MTM gain on derivative transactions of First Gen that was recognized in 2008. The Company recognized a MTM loss on derivative transactions of $0.9 million in 2009, which was classified under “Costs and Expenses” account of the Company’s audited consolidated statements of income. Interest income Interest income decreased by 23.5% or $2.1 million to $6.9 million in 2009 from $9.1 million in 2008 as a result of lower interest income on Annual Deficiency by $2.8 million following scheduled Annual Deficiency payments by FGPC and FGP to the Gas Sellers. In addition, the Parent company and FGP recorded lower interest income from its cash balances by $1.7 million and $0.7 million, respectively. These were partly offset by higher interest income of FGPC by $3.1 million due to interest earned on advances made to its non-controlling shareholder. Equity in net earnings of associates Equity in net earnings of associates decreased by $2.4 million with the deconsolidation effective May 2009. Beginning May 2009, equity in net earnings of associates include the combined share in net earnings from the deconsolidated subsidiaries; namely, Prime Terracota, Red Vulcan, EDC, and FG Hydro. The combined amount from the deconsolidated subsidiaries from May 2009 to December 2009 is a net loss of $3.5 million due to interest expenses at Red Vulcan and Prime Terracota, which offset earnings from EDC. Earnings from the deconsolidated subsidiaries for the periods January to April 2009 and the whole year of 2008 are reflected under “Net income from discontinued operations” in the consolidated statements of income. Prior to the deconsolidation, equity in net earnings only included share in net earnings from BPPC. The lower earnings from the deconsolidated subsidiaries, reflected in equity in net earnings of associates, were offset by the higher share in net earnings of BPPC by $1.2 million in 2009. Foreign exchange gains - net No unrealized foreign exchange gain was recognized in 2009 as compared to a $24.0 million foreign exchange gain recognized in 2008. The foreign exchange gain in 2008 was mainly due to the unrealized foreign exchange gain on the Peso bond as a result of the depreciation of the Philippine Peso against the US dollar. The Company recognized unrealized foreign exchange loss of $8.7 million in 2009 which was included as part of “Costs and Expenses” in the consolidated statements of income. Other revenues The $2.5 million increase in Other revenues in 2009 pertains to consultancy fees received by First Gen from EDC, which started in September 2008.
Costs and operating expenses for the year ended December 31, 2009 posted a net decrease of $207.3 million or 20.4% to $809.3 million as compared to $1,016.5 million in 2008 as a result of the following movements:
Costs and Operating Expenses
Fuel cost Fuel cost decreased by $194.0 million or 22.5% in 2009 due to lower gas prices in 2009.

20 | P a g e
Staff costs Staff costs decreased by $1.4 million or 11.7% due to a lower provision for retirement expenses in 2009 and higher weighted average foreign exchange rate in 2009 (P47.769:$1.00) compared to the rate in 2008 (P43.970:$1.00) that was used to convert the Peso-denominated expenses to its US dollar equivalent. Other administrative expenses Other administrative expenses decreased by $12.0 million or 24.4% in 2009 due to lower professional fees by $4.3 million and lower taxes and licenses by $6.7 million at the Parent company level. The higher professional fees and taxes and licenses in 2008 pertain to underwriting fees, legal fees, and documentary stamp taxes associated with various loans availed during the previous year. Taxes and licenses in 2008 also include the capital gains tax on the sale of First Gen’s 60% stake in FG Hydro.
Interest expense and financing charges decreased by $9.3 million or 7.7% to $112.1 million in 2009 from $121.4 million in 2008. The decrease was due to a decrease in interest expense on loans of the Parent company and FGP by $19.2 million and $3.0 million, respectively, after paying down debt during the year. In addition, interest expense on Annual Deficiency payable to the gas sellers decreased by $2.8 million following the scheduled payments made on the Payment Deferral Agreement. These were partly offset by higher interest expense in FGPC after the refinancing of its loans in November 2008 and the issuance of UHC’s P5.4 billion corporate notes, which increased interest and financing expense by $7.4 million and $6.9 million, respectively.
Interest expense and financing charges
The Company recognized an unrealized foreign exchange loss of $8.7 million in 2009 pertaining to unrealized foreign exchange loss on UHC’s P5.4 billion corporate notes and the Parent company’s Peso bond as a result of the appreciation of the Philippine Peso against the U.S. dollar.
Foreign exchange loss – net
The Company recognized a MTM loss on derivative transactions of $0.9 million in 2009 as compared to the MTM gain on derivative transactions of $12.2 million recognized in 2008, which was included as part of “Revenues” in the consolidated statements of income. The derivative loss was due to the change in the fair value of First Gen’s Convertible bonds.
MTM loss on derivatives
The Company recognized a lower provision for income tax by $11.8 million or 23.7% of $38.1 million in 2009 as compared to 2008. The decrease was primarily due to the recognition of a benefit from deferred income tax of $7.4 million in 2009 versus an $18.5 million provision that was recognized in 2008 resulting from the movements in foreign exchange rate of the Philippine Peso against the U.S. dollar. The benefit from deferred income tax was partly offset by higher current income tax of FGP by $13.5 million due to the expiry of its income tax holiday in February 2009.
Provision for (benefit from) Income Tax
First Gen’s consolidated net income increased by $1.5 million or 1.6% to $95.0 million in 2009 from $93.5 million in 2008. Of the total net income in 2009, $53.0 million is net income from continuing operations and $42.0 million pertains to the net income from January to April 2009 of the recently deconsolidated subsidiaries of First Gen. The relatively flat change in consolidated net income was a result of the offsetting movements of the following items:
Net Income
• Net income from discontinued operations which pertains to the net income of the Prime Terracota
Group for the months of January to April in 2009 and January to December in 2008 increased by $22.7 million in 2009. This is mainly due to lower interest expense at Red Vulcan level after reducing debt in 2009 and foreign exchange gains of EDC during the year.
• Administrative expenses were lower in 2009 by $13.4 million due to lower provision for retirement expenses, and lower professional fees and tax expenses. The Company incurred higher professional fees and tax expenses in 2008 from underwriting fees, legal fees, and documentary stamp taxes associated with various loans availed in 2008.

21 | P a g e
• The Company recognized lower provision for income tax by $11.8 million in 2009 as a result of changes in deferred tax liabilities due to the appreciation of the Philippine peso against the U.S. dollar in 2009.
• Interest expense and financing charges decreased by $9.3 million due to lower interest expense at the Parent company level as a result of the Company’s debt reduction program.
• Other revenues were higher by $2.5 million as a result of the recognition of consultancy fees from EDC.
The above gains were offset by the following: • First Gen group incurred a foreign exchange loss of $8.7 million in 2009, in contrast with the
foreign exchange gain of $24.0 million recognized in 2008. • The Parent company incurred a loss on derivative liabilities of $0.9 million resulting from the
change in the fair value of the Convertible bonds. This is a reversal of the MTM gain on derivative liabilities recognized in 2008 of $12.2 million.
• A $6.4 million gain was recognized in 2008 pertaining to monetized banked gas as compared to in 2009.
• Equity in net earnings decreased by $2.4 million due to the recognition in this account of Red Vulcan and Prime Terracota’s interest expense covering the months of May to December 2009.
• Interest income decreased by $2.1 million mainly due to lower interest on cash at the Parent company.
• Capacity charges slightly decreased by $2.3 million or 1.0% due to lower NDC of Santa Rita and San Lorenzo as a result of normal plant degradation.
Of the $95.0 million consolidated net income in 2009, net income attributable to the Parent company amounted to $16.8 million, $2.3 million or 15.8% higher than the $14.5 million net income attributable to the Parent company in 2008.
Adjusting for non-recurring items in 2009 such as foreign exchange gains/losses, deferred income taxes, and the write-down of EDC’s deferred tax assets, recurring net income in 2009 attributable to First Gen is $34.2 million. This is $15.5 million or 83.2% higher than recurring net income in 2008 of $18.7 million, which can be mostly attributed to lower interest expense at the Parent company and Red Vulcan.
(Amount in USD thousands) 2009 2008 Net income attributable to the Parent company $16,754 $14,474 Adjustment of non-recurring items:
Movement in deferred income tax of FGPC and FGP (4,428) 11,083 Monetized banked gas – (6,369) Arbitration gain of EDC – (32,515) Write-down of EDC’s deferred tax assets 22,765 – Unrealized foreign exchange losses (gains) of the
Parent company, FGPC, FGP, UHC 8,690 (23,999) Unrealized foreign exchange loss (gain) EDC (9,035) 70,378 Unrealized foreign exchange loss (gain) of FG Hydro (1,463) 5,658 MTM loss (gain) on derivatives of Parent company and EDC 922 (20,036)
Recurring Net Income attributable to Parent company $34,205 $18,674

22 | P a g e
CONSOLIDATED STATEMENTS OF FINANCIAL POSITION Horizontal and Vertical Analyses of Material Changes as of December 31, 2009 and 2008
HORIZONTAL ANALYSIS
VERTICAL ANALYSIS
Increase (Decrease)
Dec-09 Dec-08 2009 vs. 2008
(Amounts in USD Thousands) (Audited) (Audited) Amount % Dec-09 Dec-08 ASSETS
Current Assets Cash and cash equivalents $125,531 $229,647 ($104,116) -45.3% 5.8% 6.2%
Receivables 121,334 244,996 (123,662) -50.5% 5.6% 6.6% Inventories 65,072 76,206 (11,134) -14.6% 3.0% 2.1% Available-for-sale (AFS) financial assets – 14,194 (14,194) -100.0% 0.0% 0.4% Derivative asset – 12,923 (12,923) -100.0% 0.0% 0.3% Other current assets 34,578 49,508 (14,930) -30.2% 1.6% 1.3%
346,515 627,474 (280,959) -44.8% 16.0% 17.0%
Noncurrent assets held for sale – 38,067 (38,067) -100.0% 0.0% 1.0% Total Current Assets 346,515 665,541 (319,026) -47.9% 16.0% 18.0% Noncurrent Assets
Investments in associates 1,020,722 20,958 999,764 4770.3% 47.2% 0.6% Property, plant and equipment 562,238 736,262 (174,024) -23.6% 26.0% 19.9% Intangible assets 17,972 1,301,651 (1,283,679) -98.6% 0.8% 35.2% Deferred income tax assets 10 71,794 (71,784) -100.0% 0.0% 1.9% Long-term receivables - net of current portion – 652,831 (652,831) -100.0% 0.0% 17.7% Other noncurrent assets 213,566 248,840 (35,274) -14.2% 9.9% 6.7% Total Noncurrent Assets 1,814,508 3,032,336 (1,217,828) -40.2% 84.0% 82.0%
TOTAL ASSETS $2,161,023 $3,697,877 ($1,536,854) -41.6% 100.0% 100.0%
LIABILITIES AND EQUITY Current Liabilities Loans payable $– $200,461 ($200,461) -100.0% 0.0% 5.4%
Accounts payable and accrued expenses 104,451 231,216 (126,765) -54.8% 4.8% 6.3% Income tax payable 7,543 1,836 5,707 310.8% 0.3% 0.0% Due to related parties 6,711 7,056 (345) -4.9% 0.3% 0.2% Obligations to Gas Sellers on Annual Deficiency 9,378 36,696 (27,318) -74.4% 0.4% 1.0% Current portion of:
Bonds payable 107,984 – 107,984 0.0% 5.0% 0.0% Long-term debt 46,499 518,101 (471,602) -91.0% 2.2% 14.0%
Derivative liabilities – 1,142 (1,142) -100.0% 0.0% 0.0%
Total Current Liabilities 282,566 996,508 (713,942) -71.6% 13.1% 26.9%
Noncurrent Liabilities Bonds payable – net of current portion 277,353 362,978 (85,625) -23.6% 12.8% 9.8% Long-term debt – net of current portion 700,324 1,073,285 (372,961) -34.7% 32.4% 29.0% Derivative liabilities - net of current portion 25,335 59,861 (34,526) -57.7% 1.2% 1.6% Retirement and other post-retirement liability 167 24,899 (24,732) -99.3% 0.0% 0.7% Deferred income tax liabilities – net 18,609 30,036 (11,427) -38.0% 0.9% 0.8%
Other noncurrent liabilities 49,632 131,899 (82,267) -62.4% 2.3% 3.6%
Total Noncurrent Liabilities 1,071,420 1,682,958 (611,538) -36.3% 49.6% 45.5%
TOTAL LIABILITIES 1,353,986 2,679,466 (1,325,480) -49.5% 62.7% 72.5%
Equity Attributable to Equity Holders of the Parent Company

23 | P a g e
Redeemable preferred stock 13,561 9,572 3,989 41.7% 0.6% 0.3% Common stock 45,917 20,624 25,293 122.6% 2.1% 0.6% Additional paid-in capital 320,453 319,530 923 0.3% 14.8% 8.6%
Deposits for future stock subscriptions 93,318 – 93,318 0.0% 4.3% 0.0%
Accumulated share in other comprehensive losses of associates (78,516) – (78,516) 0.0% -3.6% 0.0% Cumulative translation adjustments (9,642) (136,645) 127,003 -92.9% -0.4% -3.7% Accumulated unrealized gain on AFS financial assets – 382 (382) -100.0% 0.0% 0.0% Equity reserve – (28,383) 28,383 -100.0% 0.0% -0.8% Retained earnings 330,930 354,137 (23,207) -6.6% 15.3% 9.6% Cost of preferred and common stock held in treasury (52,987) (80,557) 27,570 -34.2% -2.5% -2.2%
663,034 458,660 204,374 44.6% 30.7% 12.4%
Non-controlling Interests 144,003 559,751 (415,748) -74.3% 6.7% 15.1%
Total Equity 807,037 1,018,411 (211,374) -20.8% 37.3% 27.5%
$2,161,023 $3,697,877 ($1,536,854) -41.6% 100.0% 100.0%
Cash and cash equivalents This account consists mainly of cash on hand and in banks. Cash equivalents include cash investments with original maturities of less than three months. Cash and cash equivalents decreased by 45.3% or $104.1 million to $125.5 million as of December 31, 2009 as compared to $229.6 million as of December 31, 2008. The decrease is mainly due to the higher cash balances of FGPC and FGP as of December 31, 2008 since payments to Gas Sellers on the November 2008 fuel charges were already made in January 2009. The decrease in this account was also due to the deconsolidation of cash and cash equivalents of EDC and FG Hydro amounting to $16.3 million and $3.9 million, respectively, as of December 31, 2008. Receivables Receivables decreased by 50.5% or $123.7 million to $121.3 million as of December 31, 2009 from $245.0 million as of December 31, 2008 after the deconsolidation of EDC’s and FG Hydro’s receivables amounting to $154.8 million. The decrease was partly offset by the higher trade receivables from FGPC and FGP by $28.5 million. Receivables from Meralco as of December 31, 2009 still include the November 2009 billings which were paid by Meralco in January 2010. Available-for-sale (AFS) financial assets The $14.2 million decrease in AFS financial assets was due to the deconsolidation of EDC. This account previously included EDC’s investments in dollar-denominated ROP bonds. Inventories The decrease in this account by 14.6% or $11.1 million was due to the deconsolidation of EDC’s inventories amounting to $32.2 million as of December 31, 2008. This was partly offset by higher fuel inventory of Santa Rita and San Lorenzo by $21.1 million due to liquid fuel purchases made during the year in preparation for the scheduled maintenance outage of the Malampaya gas plant in February 2010. Derivative asset The decrease of $12.9 million was primarily due to the deconsolidation of EDC and FG Hydro in May 2009. The balance in 2008 includes EDC’s freestanding derivative transactions, particularly the range bonus forward contracts and the foreign currency forward contracts; and FG Hydro’s embedded foreign currency options on the contract with Andritz Hydro, GmbH for the Pantabangan Refurbishment and Upgrade Project (PRUP). Other current assets The net decrease in other current assets by 30.2% or $14.9 million was primarily due to the deconsolidation of EDC’s current assets amounting to $12.6 million and the application of prepaid taxes against various taxes totaling to $4.8 million.

24 | P a g e
Noncurrent assets held for sale This account pertains to the land owned by EDC in Fort Bonifacio to be sold to PNOC. The $38.1 million balance as of December 2008 was deconsolidated effective May 2009. Long-term receivables – net of current portion This account decreased by 100.0% or $652.8 million resulting from the deconsolidation of EDC’s concession receivables and other long-term receivables amounting to $652.8 million as of December 2008. Investments in associates The $999.8 million increase in this account pertains to the investment cost of First Gen in FG Hydro and Prime Terracota. With the deconsolidation effective May 2009, the investments in Prime Terracota and FG Hydro are now recognized as part of “Investments in associates” account in the consolidated statement of financial position. Property, plant, and equipment – net This account decreased by 23.6% or $174.0 million mainly due to the deconsolidation of FG Hydro’s and EDC’s property, plant, and equipment amounting to $87.2 million and $40.2 million, respectively. The decrease in the gas plants’ property, plant, and equipment by $46.5 million due to depreciation expenses also contributed to the decrease in this account. Intangible assets This account decreased by 98.6% or $1,283.7 million to $18.0 million due to the decrease in recognized goodwill by $953.8 million, which pertained to the acquisition of FG Hydro and EDC that were no longer taken up after the deconsolidation. Furthermore, intangible assets of EDC and FG Hydro that were identified during the acquisition amounting to $283.0 million and $46.3 million, respectively, were already deconsolidated from the December 2009 consolidated statements of financial position. Deferred income tax assets This account decreased by $71.8 million as a result of the deconsolidation of EDC’s deferred tax assets. Other noncurrent assets This account decreased by 14.2% or $35.3 million mainly due to the deconsolidation of EDC’s noncurrent assets amounting to $32.5 million. Furthermore, the Prepaid gas account decreased by $24.0 million due to the consumption of banked gas by FGPC and FGP during the latter part of the year. These were partly offset by the capitalization of turbine blades of the gas plants during the year, which increased Other noncurrent assets by $23.5 million. Loans payable This account decreased by 100.0% or $200.5 million resulting from the full payment of short-term loans at the Parent company amounting to $119.4 million. In addition, $38.9 million of loans payable of Prime Terracota and $42.1 million of EDC were deconsolidated from this account. Accounts payable and accrued expenses This account decreased by 54.8% or $126.8 million due to the deconsolidation of EDC’s accounts payable amounting to $95.5 million as of December 31, 2008. In addition, FGPC also had higher trade payables by $41.0 million on December 31, 2008 as a result of the accrual of the November and December 2008 billings of the Gas Sellers, which were both paid in January 2009, versus only one month of outstanding payables reflected as of December 31, 2009. The above decreases were partially offset by the accrual of payables to the liquid fuel supplier totaling to $21.5 million. Income tax payable Income tax payable increased by $5.7 million resulting from higher taxes payable of FGPC and FGP due to the expiration of FGP’s Income Tax Holiday (ITH) incentive in February 2009.

25 | P a g e
Obligations to gas sellers The 74.4% or $27.3 million decrease in this account pertains to the payments made to the gas sellers on the Payment Deferral Agreements (PDA). As of December 31, 2009, the obligations to gas sellers under the PDA were already settled in full. Current portion of bonds payable This account increased by $108.0 million which is mainly a reclassification to current portion of the Peso bond that will mature in July 2010. Current portion of long-term debt This account decreased by 91.0% or $471.6 million due to the deconsolidation of EDC’s and Red Vulcan’s current portion of long-term debt amounting to $173.5 million and $291.7 million, respectively, as of December 31, 2008. In addition, FGPC’s current portion of long-term debt decreased by $8.6 million following its scheduled principal payments. Derivative liabilities The $1.1 million decrease in this account pertains to the deconsolidation of EDC’s derivative liability. Bonds payable This account decreased by 23.6% or $85.6 million resulting from the reclassification of First Gen’s Peso bond to current portion, partially offset by the $18.9 million increase in the balance of Convertible bonds due to the accretion of debt issuance costs. Long-term debt – net of current portion This account decreased by 34.7% or $373.0 million due to the deconsolidation of EDC’s loans amounting to $439.3 million as of December 31, 2008, and the reduction in FGPC’s and FGP’s long-term debt by $21.7 million and $26.4 million, respectively, after their scheduled principal payments. These were partly offset by the issuance of UHC’s P5.4 billion ($112.5 million) three-year corporate notes in March 2009. Derivative liabilities – net of current portion This account decreased by 57.7% or $34.5 million due to the decrease in the fair value of FGPC’s derivative liability in relation to the hedged portion of its loans availed in November 2008. Retirement and other post-retirement liability The 99.3% or $24.7 million decrease was due to the deconsolidation of EDC’s retirement and other post-retirement liability account. Deferred income tax liabilities The decrease of 38.0% or $11.4 million was mainly due to the appreciation of the Philippine peso against the U.S. dollar (i.e. from P=47.52 as of December 31, 2008 to
P=46.20 as of December 31, 2009).
Other noncurrent liabilities This account decreased by 62.4% or $82.3 million resulting from the deconsolidation of FG Hydro’s noncurrent portion of Deferred Payment Facility with PSALM amounting to $51.7 million and EDC’s noncurrent liabilities amounting to $6.6 million. Furthermore, unearned revenues of FGPC and FGP decreased by $24.0 million resulting from the consumption of banked gas by the gas plants during the latter part of 2009. Redeemable preferred stock The 41.7% or $4.0 million increase in this account pertains to the property dividends to First Gen’s preferred stockholder in 2009 in order to maintain its percentage voting interest following the stock dividend declaration to the Company’s common shares.

26 | P a g e
Common stock The 122.6% or $25.3 million increase in common stock was due to the conversion of a portion of FPHC’s deposit for future stock subscription amounting $16.8 million to 807.5 million common shares as part of FPHC’s rights offering subscription. In addition, First Gen declared a 50% stock dividend in September 2009, which further contributed to the increase in common stock in 2009. Deposits for future stock subscriptions In August 2009, the Company received from FPHC $110.1 million as deposits for future stock subscription. In December 2009, $16.8 million of the deposits was converted to 807.5 million common shares. The $93.3 million remaining balance of the deposits as of December 31, 2009 were fully utilized to subscribe to FPHC’s pro-rata share in First Gen’s stock rights offering which was successfully completed in January 2010. Accumulated share in other comprehensive losses of associates The Company recognized a reduction in equity amounting to $78.5 million in 2009 to reflect First Gen’s share in the translation of the peso-denominated balances of the Prime Terracota Group into U.S. Dollar, which is First Gen’s functional currency, effective May 2009. Cumulative translation adjustments This account decreased by 92.9% or $127.0 million due to deconsolidation of Prime Terracota Group in May 2009. This account previously included the translation of the peso-denominated balances of the Prime Terracota Group into U.S. Dollar. With the deconsolidation, this account will now only include the translation of the peso-denominated balances of the subsidiaries and First Gen’s share in the effect of the translation. The peso-balances of the Prime Terracota Group are now shown as part of “Accumulated share in other comprehensive losses of associates” account in the consolidated statement of financial position as noted above. Equity reserve In November 2008, First Gen completed its divestment of its 60% stake in FG Hydro in favor of EDC. As a result, First Gen recognized a loss in dilution of $28.4 million, which was recorded as equity reserve in the equity section of the 2008 consolidated statement of financial position. The decrease in this account was mainly due to the deconsolidation of FG Hydro from First Gen effective May 2009. Retained earnings First Gen’s retained earnings decreased by 6.6% or $23.2 million resulting from the 50% stock and 50% property dividends declared in September 2009, partly offset by the earnings accumulated during the year. Cost of preferred and common stock held in treasury The 34.2% or $27.6 million decrease was due to the property dividends declared by First Gen to its voting preferred shareholder in conjunction with the 50% stock dividends declared to common shares in order to maintain the percentage voting interest of the preferred shareholder. Non-controlling Interests This account decreased by 74.3% or $415.7 million as a result of the deconsolidation of EDC and FG Hydro effective May 2009.

27 | P a g e
DISCUSSION OF MAJOR SUBSIDIARIES AND ASSOCIATES
FGPC
As of and for the years ended December 31
(in USD thousands) 2010 (Audited)
2009 (Audited)
Revenues 782,035 689,510 Operating income 155,834 149,193 Net income 78,104 71,192 Total assets 812,816 838,657 Debt – net of debt issuance costs 475,163 494,734 Other liabilities 135,661 148,336 Total equity 201,992 195,587
December 2010 vs. December 2009 Results FGPC's revenues for 2010 increased to $782.0 million or 13.4% higher than last year’s $689.5 million on account of higher fuel charges which was mainly driven by the increase in average gas prices (from $9.1/MMBtu in 2009 to $10.1/MMBtu in 2010), the consumption of liquid fuel due to the scheduled maintenance outage of the Malampaya platform and several gas curtailments by the Gas Sellers that were experienced by the Santa Rita plant during the year, and higher actual NDC of 1,043.3 MW in 2010 from 1,036.0 MW in 2009. Operating income increased by $6.6 million or 4.5% due to lower administrative expenses and the supplemental charges related to the professional fees incurred during the GSPA arbitration was collected from Meralco. FGPC posted a net income of $78.1 million, which is $6.9 million or 9.7% higher than last year’s $71.2 million. The increase was mainly due to lower finance charges as a result of continuous pay down of long term debt. ASSETS FGPC’s total assets as of December 31, 2010 stood at $812.8 million, about $25.8 million or 3.1% lower as compared to last year’s $838.7 million due to the following factors:
• decrease in Advances to shareholders due to the scheduled payments; • consumption of liquid fuel inventory as a result of the Malampaya outage; • decrease in receivables from Meralco on 2006 Annual Deficiency resulting from the final
settlement of the dispute in June 2010; • decrease in the Prepaid gas account as a result of the banked gas usage during the latter part of
2010 amounting to $18.8 million; and • full year depreciation and amortization of fixed assets.
LIABILITIES AND EQUITY FGPC’s total liabilities amounted to $610.8 million lower by $32.3 million as compared to $643.1 million, primarily due to the scheduled payments of loans, final settlement of the Obligations to gas sellers relating to the 2006 Annual deficiency, and the use of banked gas which led to lower balances of the “Unearned revenues” account. These decreases were partly offset by the increase in derivative liabilities due to the unfavorable movements in the MTM valuation of FGPC’s derivative instruments.

28 | P a g e
Total equity was higher by 3.2% or $6.4 million to $202.0 million as compared to $195.6 million in December 2009. The increase in equity resulted from higher earnings during the year and lower cash dividend payments in comparison to the previous year. This was partially offset by the increase in the “Accumulated other comprehensive loss” account due to the unfavorable movements in the MTM valuation of FGPC’s derivative instruments. FGP Corp.
As of and for the years ended December 31
(in USD thousands) 2010 (Audited)
2009 (Audited)
Revenues 401,249 335,200 Operating income 73,061 74,822 Net income 52,049 52,251 Total Assets 365,504 380,710 Debt – net of debt issuance costs 114,044 139,159 Other Liabilities 46,615 67,151 Total Equity 204,845 174,400
December 2010 vs. December 2009 Results Total revenues for the year ended December 31, 2010 posted a 19.7% or $66.0 million increase to $401.2 million. The increase in revenues was primarily attributable to increase in average gas prices from $9.1/MMBtu in 2009 to $10.3/MMBtu in 2010 and higher average plant dispatch of 83.2% in 2010 from 80.2% in 2009. These increases were partly offset by slightly lower actual NDC of 523.9 MW in 2010 from 525.49 MW in 2009. On the other hand, operating income decreased by $1.8 million from last year’s $74.8 million due to higher variable O&M costs in 2010 resulting from the new O&M Agreement of FGP Corp. with SPOI. The 0.4% or $0.2 million slight decrease in net income to $52.0 million in 2010 from last year’s $52.2 million was primarily due to the full year provision for current income tax as compared to last year’s ten-month provision for current income tax. Note that FGP’s income tax holiday incentive ended on February 28, 2009. ASSETS FGP’s total assets as of December 2010 stood at $365.5 million, about $15.2 million or 4.0% lower than last year’s level of $380.7 million due to:
• consumption of liquid fuel inventory as a result of the Malampaya outage; • decrease in receivables from Meralco on 2006 Annual Deficiency resulting from the final
settlement of the dispute in June 2010; • decrease in the Prepaid gas account as a result of the banked gas usage during the latter part of
2010 amounting to $6.4 million; and • full year depreciation and amortization of fixed assets.
LIABILITIES AND EQUITY As of December 2010, total liabilities decreased by $45.6 million or 22.1% to $160.7 million from last year’s $206.3 million. The continuous pay down of San Lorenzo’s debt, payment of liquid fuel purchased last December 2009, final settlement of the Obligations to gas sellers relating to the 2006 Annual deficiency, and use of banked gas which led to lower balances of the “Unearned revenues” account, resulted in a reduction of FGP’s total liabilities. Total equity increased by 17.5%, or $30.4 million to $204.8 million in 2010 as compared to $174.4 million in 2009. The increase in equity was brought about by lower cash dividend payments in comparison to last year and income earned.

29 | P a g e
FG Bukidnon
December 2010 vs. December 2009 FG Bukidnon’s revenues, operating income and net income for the year ended December 31, 2010 decreased compared to last year due to relatively lower plant dispatch and lower water supply level.
Total assets as of December 31, 2010 increased by P14.2 million or 9.5% due to accumulation of cash from operations. Total liabilities as of December 31, 2010 also increased by P6.9 million or 35.3% due to accrual of additional liability for the use of transmission line and the set-up of retirement liability for 2010. Total equity likewise increased by P7.2 million or 5.6% mainly due to income earned during the year.
(in USD thousands)
BPPC
As of and for the period ended July
31, 2010* (Audited)
As of and for the year ended December 31,
2009** (Audited)
Revenues 10,091 20,369 Net income (loss) (708) 12,579 Total Assets 35,916 60,873 Other Liabilities 4,058 7,249 Total Equity 31,858 53,624
* Following the expiration of the Co-operation Period, BPPC turned-over the 225MW Bauang power plant to NPC on July 26, 2010 to mark the end of the Build-Operate-Transfer Agreement.
** Excluding provision for real property taxes because this has a corresponding receivable from NPC.
July 2010 vs. December 2009 BPPC turned-over the power plant to NPC on July 26, 2010 to mark the end of the 15-year Co-operation Period under the Project Agreement. Through a Deed of Transfer executed between BPPC and NPC, BPPC transferred to NPC all its rights, titles and interests in the power plant, free of liens created by BPPC, without any compensation. Operating revenues for the seven-month period in 2010 was reported at $10.1 million as compared to the operating revenues for the full year in 2009 of $20.4 million. However, resulting net loss of $0.7 million in 2010 was due to provisions for possible losses on input VAT and inventory write-offs totaling about US$2.6 million. Total assets decreased by $25.1 million with the full amortization of Financial Asset under IFRIC 12. Other liabilities of $4.6 million as of July 2010 represent remaining accounts/accrued payables and income tax payable.
As of and for the years ended December 31 (in PHP thousands)
2010 (Audited)
2009 (Audited)
Operating revenues 38,112 40,782 Operating income 8,007 15,901 Net income 7,252 13,424 Total Assets 163,673 149,490 Total Current Liabilities 17,935 11,968 Other Liabilities 8,630 7,666 Total Equity 137,108 129,856

30 | P a g e
Total equity decreased by $21.9 million due to the partial capital return and dividends paid during the year.
Following is the condensed consolidated financial information of EDC:
EDC (through Red Vulcan)
December 2010 vs. December 2009 Net income increased by 30.9% or P1,038.1 million to P4,395.1 million in 2010 from P3,357.0 million in 2009. The favorable variance was primarily attributed to the following: • Increase in revenues by P2,834.7 million mainly due to Green Core’s higher revenues with its full
year operation in 2010 as compared to two months in 2009; • One-time write-down in 2009 of the P2,959.2 million of deferred tax assets due to the implementation
of RE Law while there was none in 2010; • A P1,746.8 million net increase in miscellaneous income mainly due to the P1,638.9 million recovery
of impairment loss on Input VAT claims; and • A P635.8 million turnaround in derivatives gains from a P198.8 million loss in 2009 due to the P437.0
million gain in 2010 arising from the full settlement of Miyazawa II loan. These were offset by: • Higher provision of allowance for impairment of NNGPF’s assets by P3,041.0 million from P3,390.0
million in 2010 compared to P349.0 million in 2009; • Higher depreciation expenses by P2,233.6 resulting from reclassification of service concession
receivables to property, plant and equipment as the Company no longer applied IFRIC 12 commencing October 23, 2009; and
• A P1,305.1 million turnaround from the P1,291.3 million foreign exchange gains in 2009 to the P13.8 million foreign exchange losses in 2010.
In terms of recurring net income generated in 2010, it slightly decreased by 0.5% or P38.3 million to P7,237.8 million from P7,276.1 million in 2009.
The unfavorable variance was primarily due to the following: • P1,344.2 million increase in operating expenses due to higher depreciation with the
reclassification of financial asset to property, plant and equipment following the scope-out from IFRIC 12;
• P932.3 million increase in net financial expense due to the full year recognition of interest expense in 2010 of the Fixed Rate Corporate Notes (FRCN) and Peso public bonds. These were issued in the second half of 2009. Additional interest expense was recognized by EDC for the US$175.0 million syndicated term-loan facility, which was availed in June 2010; and
• P384.5 million foreign exchange loss, which was a turnaround from the realized foreign exchange gain position in 2009.
As of and for the years ended December 31
(Amounts in PHP millions) 2010
(Audited)
2009 (Audited, as
restated) Revenues 24,901.6 22,066.90 Foreign exchange gains (losses) - net (13.8) 1,291.2 Income before income tax 5,172.3 7,267.5 Net income 4,395.1 3,357.0 Recurring net income 7,237.8 7,276.1 Total assets 81,303.6 84,763.6 Total liabilities 49,064.6 54,443.1 Total equity 32,239.0 30,320.6

31 | P a g e
These were offset by P2,622.7 million increase in total revenue mainly from electricity sales with the full year operations of Green Core and increased sales volume of FG Hydro, net of income taxes. Cash and cash equivalents decreased by 45.1% or P5,063.00 million to P6,157.9 million as of December 31, 2010 from the P11,220.9 million December 31, 2009 balance. The decrease was primarily accounted for by the following:
• P19,250.3 million settlement of the Miyazawa II loan, PNOC on-lent loans, PSALM’s staple financing on FG Hydro’s acquisition of PMHEPP and regular debt servicing;
• P5,789.8 million combined capital expenditures of both FG Hydro and EDC • P2,496.3 million payment of cash dividend; • P1,279.7 million payment for acquisition of Bacon-Manito Geothermal Power Plants; • P452.9 million payment to First Gen by FG Hydro for the settlement of cash advance.
The decrease was partly offset by internal cash generation (P10,798.5 million), proceeds from US$175.0 million syndicated term-loan facility (P8,058.8 million) for Parent company and FG Hydro’s loan from local banks (P5,000.0 million) and the interest income received on investments (P321.5 million).
EDC’s consolidated long-term debt decreased by P6,258.6 million or 13.2% to P41,205.9 million in 2010 from P47,464.5 million in 2009. The net decrease resulted from the full settlement of P11,092.0 million of JPY 22 billion Miyazawa II loan which matured in June 2010, full payment of FG Hydro’s deferred payment facility with PSALM amounting to P2,299.0 million, and payment of P4,212.2 million PNOC on-lent loans. These decreases were partly offset by the new loans availed during the year, particularly the $175M syndicated term loan facility and a P5,000.0 million loan availed by FG Hydro from PNB and Allied Bank.
FG Hydro
December 2010 vs. December 2009 FG Hydro generated revenues of P2,139.5 million for the year ended December 31, 2010, 71.6% higher than revenues of P1,247.2 million for the same period in 2009. The favorable variance was mainly on account of the combined effects of higher dispatch due to increased irrigation requirements and the 10 MW increase in power generation capacity on account of the completion of the rehabilitation of Pantabangan’s Unit 1, and significantly higher spot prices in the WESM driven by power supply shortage in the first quarter. The favorable variance was partly offset, however, by increased depreciation, plant operation and maintenance expenses, staff costs and higher accrued taxes. Loss on disposal of machineries and equipment replaced for Pantabangan’s Unit 2 was also higher at P359.2 million compared to P273.6 million loss for Pantabangan’s Unit 1 in December 2009. Overall, FG Hydro posted a net income of
As of and for the years ended December 31
(in PHP thousands) 2010
(Audited) 2009
(Audited) Operating revenues 2,139,536 1,247,178 Operating income 1,413,513 652,340 Net income 704,552 114,069 Total current assets 1,581,556 378,446 Total noncurrent assets 7,434,560 7,239,401 Total current liabilities 516,920 1,884,357 Other noncurrent liabilities 4,570,241 1,909,087 Total equity 3,928,955 3,824,403

32 | P a g e
P704.6 million for the year ended December 31, 2010, 517.7% better than the P114.1 million reported income for the same period in 2009. Total assets as of December 31, 2010 stood at P9,016.1 million, 18.4% higher than the 2009 level of P7,617.8 million. The favorable variance was mainly due to higher cash balance generated from operations and from the proceeds of the Company’s Peso loan, net of debt service and dividend payments, and capital expenditures resulting from the Pantabangan refurbishment and upgrade project. As of December 31, 2010, total liabilities stood at P5,087.2 million, 34.1% higher than the 2009 level of P3,793.4 million. The net increase in liabilities was mainly due to the refinancing of the USD denominated liability with PSALM with a P5.0 billion peso loan availed from PNB and Allied Bank. The increase in long-term debt was also partly offset by the payment of advances from related parties. Total equity as of December 31, 2010 of P3,929.0 million is 2.7%% higher compared to the December 2009 level of P3,824.4 million.
Key Performance Indicators
First Gen Consolidated 2010 2009 Current ratio 0.99 1.23 Return on assets (%) 5.17% 4.40% Long-term debt plus noncurrent liabilities / Equity ratio (times) 0.94 1.52
Debt ratio 50.97% 62.65% Interest-bearing debt-to-equity ratio (times) 0.87 1.40
FGPC (Santa Rita) 2010 2009 Current ratio 2.03 1.97 Return on assets (%) 9.61% 8.49% Long-term debt plus noncurrent liabilities / Equity ratio (times) 2.47 2.73
Debt ratio 75.15% 76.68%
Interest-bearing debt-to-equity ratio (times) 2.35 2.56
Debt-to-equity ratio (times) 3.02 3.29

33 | P a g e
FGP (San Lorenzo) 2010 2009 Current ratio 1.67 1.50 Return on assets (%) 14.24% 13.72% Long-term debt plus noncurrent liabilities / Equity ratio (times) 0.49 0.74
Debt ratio 43.96% 54.19% Interest-bearing debt-to-equity ratio (times) 0.56 0.80 Debt-to-equity ratio (times) 0.78 1.18
FG Bukidnon 2010 2009 Current ratio 4.62 5.24 Return on assets (%) 4.43% 8.98% Debt ratio 16.23% 13.13% Debt-to-equity ratio (times) 0.19 0.15
EDC 2010 2009 Current Ratio 1.97 0.90 Debt-to-Equity Ratio 1.28 1.57 Net Debt-to-Equity Ratio 1.09 1.20 Return on Assets (%) 5.3% 4.4% Return on Equity (%) 14.1% 11.4%
FG Hydro (Pantabangan-Masiway) 2010 2009 Current ratio 3.06 0.29 Return on assets 7.81% 1.50% Long-term debt plus noncurrent liabilities / Equity ratio (times) 1.23 0.62
Debt ratio 56.42% 49.80% Interest-bearing debt-to-equity ratio (times) 1.23 0.95 Debt-to-equity ratio (times) 1.29 0.99
BPPC (Bauang) July 2010* 2009** Current ratio 8.72 12.41 Return on assets -1.97% 20.66% Long-term debt plus noncurrent liabilities / Equity ratio – 4.99% Debt ratio 11.30% 11.91% Debt-to-equity ratio (times) 0.13 0.14 * Following the expiration of the Co-operation Period, BPPC turned-over the 225MW Bauang power plant to NPC
on July 26, 2010 to mark the end of the BOT Agreement. ** Excluding provision for real property taxes because this has a corresponding receivable from NPC.

34 | P a g e
Key Performance Indicators Details
Current Ratio Calculated by dividing current assets over current liabilities. This ratio measures the company's ability to pay short-term obligations.
Return on Assets Calculated by dividing net income over total assets. This ratio measures how the company utilizes its resources to generate profits.
Long-term Debt Plus Noncurrent Liabilities / Equity Ratio (times)
Calculated by dividing long-term debt and noncurrent liabilities over total stockholders' equity. This ratio measures the company's financial leverage.
Debt Ratio Calculated by dividing total liabilities over total assets. This ratio measures the percentage of funds provided by the creditors to the projects.
Interest-bearing debt-to-equity ratio (percentage)
Calculated by dividing total interest-bearing debt over total equity. This ratio measures the percentage of funds provided by the lenders/creditors.
Debt-to-equity ratio (percentage) Calculated by dividing total liabilities over total equity. This ratio measures the percentage of funds provided by the lenders/creditors.
Net Debt-to-Equity Ratio
Calculated by dividing the total interest-bearing debts less cash & cash equivalents over total equity. This measures the company’s financial leverage and stability. A negative net debt-to-equity ratio means that the total cash and cash equivalents exceeds interest-bearing liabilities.
FIRST GEN CORPORATION AND SUBSIDIARIES AGING OF RECEIVABLES Amounts in U.S. Dollars and in Thousands
Current More than 90 days past due
More than 120 days past due Total
Trade $71,305 – – $71,305
Due from related parties 14,917 – – 14,917
Others 1,281 – – 1,281 87,503 – – 87,503
Less: allowance for doubtful accounts – – – – $87,503 – – $87,503

35 | P a g e
The following table sets out the aggregate fees billed and paid for each of the last three (3) fiscal years for professional services rendered by SyCip Gorres Velayo & Co.:
INFORMATION ON INDEPENDENT AUDITORS
AUDIT FEES (in P= 2010 ) 2009 2008
Audit and Audit-Related Fees 6,593,254.48 5,160,916.32 5,187,241.64 Tax Fees 670,047.26 2,481,946.88 1,655,673.60 All Other Fees1 5,201,049.28 4,742,931.20 19,092,444.05
12,464,351.02 12,385,794.40 25,935,359.29
Under the existing policies of the First Gen Audit Committee, the Audit Committee shall: [i] ensure that the fees charged by the external auditors are commensurate with their reputation, level of expertise, and required scope of work, and in accordance with current industry standards; [ii] regularly review and assess their fees and quality of work performed; [iii] determine the necessity of the external auditors performing non-audit work for any relevant year, and review and approve/ratify fees charged for such non-audit services which shall be covered by a written agreement separate and distinct from the agreement for audit services; and [iv] review and consider the rotation, every five (5) years, of the external auditor or handling partner.
First Gen’s common shares were listed with the Philippine Stock Exchange, Inc. on February 10, 2006. The high and low stock prices for 2009, 2010, and the 1st quarter of 2011 are indicated below:
MARKET INFORMATION
High Low 2011
1Q (as of March 24, 2011) 12.60 10.76 2010
4Q 14.32 11.30
3Q 14.18 9.24
2Q 12.00 9.30
1Q 11.25 8.70
2009
4Q 11.79 9.37
3Q 12.27 8.18
2Q 10.34 7.64
1Q 10.55 4.31
The closing price of First Gen’s common shares as of March 24, 2011 was P=
11.98 per share.
As of March 8, 2011, there were 368 stockholders of record and 3,362,614,360 common shares issued and outstanding.
1For services relating to due diligence for proposed acquisitions/various financing activities, preparation of agreed-upon procedures report for the Company’s application for the increase in authorized capital stock, due diligence for the stock rights offering, due diligence for the convertible bond offering, and conduct of seminars.

36 | P a g e
The top 20 stockholders of First Gen as of March 8, 2011 are as follows:
Nationality Stockholder No. of Shares Percentage 1 Filipino FIRST PHILIPPINE HOLDINGS CORPORATION (COMMON) 2,224,989,159 46.05% 4F Benpres Bldg. Exchange Road, Pasig City
FIRST PHILIPPINE HOLDINGS CORPORATION (PREFERRED) 1,468,553,892 30.40% 4F Benpres Bldg. Exchange Road, Pasig City 2 Others PCD NOMINEE CORPORATION 750,771,725 15.54%
37F Enterprise Bldg. Ayala Ave., Makati City 3 Filipino PCD NOMINEE CORPORATION 351,675,288 7.27%
37F Enterprise Bldg. Ayala Ave., Makati City 4 Filipino PETER D. GARRUCHO, JR. 6,807,004 .14%
C/O FGEN 5 Filipino OSCAR M. LOPEZ 6,546,933 .14%
C/O FGEN 6 Filipino FEDERICO R. LOPEZ 5,675,811 .12%
C/O FGEN 7 Filipino FRANCIS GILES B. PUNO 1,800,001 .04%
C/O FGEN 8 Filipino RICHARD B. TANTOCO 1,768,681 .04%
C/O FGEN 9 Filipino ERNESTO B. RUFINO, JR. 1,552,328 .03%
C/O STSI 10 Filipino ARTHUR A. DE GUIA 1,422,160 .03% C/O FPHC 4F Benpres Bldg. Exchange Road, Pasig City 11 Filipino EMMANUEL P. SINGSON 1,402,534 .03% 12 Filipino PUNO, FRANCIS GILES B. &/OR MA. PATRICIA D. PUNO 1,105,800 .02% 23 Aries St. Bel-Air 3, Makati City 13 Filipino MANUEL SANTIAGO &/OR ELLA SANTIAGO 900,000 .02% 14 Filipino NESTOR H. VASAY 450,000 .01% C/O FGEN 15 Filipino M.J. SORIANO TRADING, INC. 423,480 .01% 16 Filipino MONINA D. LOPEZ 264,738 .01% 17 Filipino CROSLO HOLDINGS CORPORATION 250,000 .01% 18 Filipino PERLA R. CATAHAN 245,460 .01% 19 Filipino CONSUELO R. LOPEZ 235,050 .00%

37 | P a g e
20 Filipino RICHARD P. DIFUNTORUM 207,380 .00% Total Top 20 4,827,047,424 99.91% Other Stockholders 4,120,828 0.09% Total Issued and Outstanding Shares 4,831,168,252 100.00%
DIVIDENDS
The board of directors may declare dividends on common and preferred shares out of the Company’s unrestricted retained earnings. On August 15, 2007, the board of directors declared a cash dividend in the amount of: (i) P= 2.50 per share on all outstanding common shares in favor of stockholders of record as of September 7, 2007, with payment date of September 14, 2007; and (ii)
P= 0.05 per share on all outstanding preferred shares in favor of stockholders of record as of September 7, 2007, with payment date of September 13, 2007.
On March 30, 2009, the board of directors of First Gen approved the declaration of a 50% stock dividend on First Gen’s common shares to be taken from unissued common shares, and a 50% property dividend on First Gen’s preferred shares to be taken from treasury preferred shares. The Philippine SEC approved on August 27, 2009 the issuance of $8.4 million (P=405.0 million) common shares consisting of 405,000,000 common shares with a par value of
P=1.00 per share, to cover the stock dividends declared by the board of directors on March 30, 2009 and ratified by the company’s stockholders on May 13, 2009. Record and payment dates of the common stock dividends were set at September 11, 2009 and October 7, 2009, respectively. The Philippine SEC’s approval was pursuant to the Amended Rules Governing Pre-emptive and other Subscription Rights and Declaration of Stock or Cash Dividends of Corporations whose securities are registered under the SRC or listed in the PSE.
On September 23, 2009, the Philippine SEC approved First Gen’s declaration of a 50% property dividend consisting of 177,619,000 preferred shares, to be taken from treasury preferred shares and amounting to $7.6 million (P=
680.3 million), in favor of First Gen’s preferred stockholder of record as of May 13, 2009.
On October 5, 2009, the board of directors of First Gen approved the declaration of a property dividend on First Gen’s preferred shares to be taken from the remaining 467,143,000 treasury preferred shares, and a stock dividend of 375,000,000 million Series “E” preferred shares to be taken from First Gen’s unrestricted retained earnings. The board of directors likewise approved the reduction in the dividend rate of Series “A” to “D” preferred shares from P0.05 to P0.02 per share. The above matters were approved by the stockholders during the special stockholders’ meeting held on November 20, 2009, and by the Philippine SEC on November 26, 2009. The property dividends were taken from the remaining 467,143,000 preferred shares held in treasury amounting to $20.0 million (P=
1,787.1 million), and paid to First Gen’s preferred stockholder of record as of November 20, 2009.
On December 7, 2009, the Philippine SEC approved First Gen’s declaration of stock dividends consisting of 375,000,000 Series “E” preferred shares amounting to $4.0 million (P=
187.5 million) in favor of the preferred stockholder of record as of December 7, 2009.
On March 8, 2010 and May 12, 2010, First Gen’s board of directors and stockholders, respectively, approved the declaration of a stock dividend on Series “E” preferred shares consisting of 93,553,892 shares to be taken from the company’s unrestricted retained earnings. On June 2, 2010, First Gen submitted to the Philippine SEC a notice of declaration of stock dividend on Series “E” preferred stocks. On January 26, 2011, the board of directors approved the declaration of cumulative cash dividends on the Series “B” preferred shares amounting to $1.8 million (P=77.8 million) to be taken from the company’s unrestricted retained earnings. The cash dividends have a record date of February 9, 2011 and a payment date of March 7, 2011. In the same meeting, the board of directors approved the dividend rate of Series “E” preferred shares at P= 0.01 per share.
38 | P a g e
SALE OF UNREGISTERED / EXEMPT SECURITIES
Executive Stock Option Plan. In its Resolution No. 445 dated August 29, 2002, the Philippine SEC held that First Gen’s issuance of 452,285 shares of stock pursuant to its Executive Stock Option Plan (“ESOP”) is exempt from the registration requirements under Section 10.2 of the Securities Regulation Code (“SRC”). As a result of the company’s restructuring in May 2005, the Philippine SEC set aside Resolution No. 445 and issued on November 29, 2005 Resolution No. 372 to reflect adjustments in the number of allocated shares from 452,285 to 18,091,400 and subscription price from P= 528.00 to
P= 13.20. The number of shares awarded was likewise adjusted from 409,756 shares to 15,856,800 shares.
Following the 50% stock dividend on common shares which was approved by the Philippine SEC on August 27, 2009, further adjustments were made. The number of shares allocated was increased from 18,091,400 to 27,137,100 shares, the subscription price per share was reduced from P= 13.20 to
P= 8.80, and the number of shares awarded was increased from 15,856,800 to 23,785,200 shares. In Resolution No. 010 dated January 11, 2010, the SEC confirmed the continuing exemption of the subject ESOP shares from the registration requirements of the SRC.
As of December 31, 2010, of the 23,785,200 shares awarded, a total of 22,555,608 shares have vested, out of which 21,182,573 shares have been exercised. A total of 1,373,035 shares remain vested and unexercised while a total of 1,229,592 shares have been forfeited. Employee Stock Purchase Plan. The SEC, in Resolution No. 272 dated August 30, 2005, held that First Gen’s issuance of 113,071 shares of stock pursuant to its Employee Stock Purchase Plan (“ESPP”) is exempt from the registration requirements under Section 10.2 of the SRC. No issuance of shares under the ESPP has been made to date. The corporate governance structures of First Gen are managed and driven by its board of directors which is composed of individuals of proven competence and integrity. Fully aware of their duties and obligations as directors of a publicly-listed company, the directors make every effort to ensure that the company is able to respond to the needs of its officers, employees, customers and partners, as well as government and the public in general. Having set forth the company’s goals, the board is responsible for guiding the company in fulfilling its economic targets and governance aspirations.
CORPORATE GOVERNANCE
The board of directors of First Gen consists of nine (9) members, including two (2) Independent Directors, all of whom are elected by the company’s qualified stockholders during the annual stockholders’ meeting held on the 2nd Wednesday of May of each year. Independent Directors Tony Tan Caktiong and Cezar P. Consing have neither interest nor relationship with First Gen that may hinder their independence from the company or its management, or interfere with the exercise of independent judgment in carrying out their responsibilities. To ensure the company’s compliance with the principles of good corporate governance, the members of the board have been selected as members of the standing committees pursuant to the Manual on Corporate Governance. These are the Risk Management Committee, Nomination and Governance Committee, Compensation and Remuneration Committee, and Audit Committee. The creation of the Risk Management Committee was approved by the board of directors on March 8, 2010. The committee is chaired by Director Peter D. Garrucho Jr., with Directors Elpidio L. Ibañez and Francis Giles B. Puno as members. The committee is tasked to oversee the formulation, establishment and implementation of an enterprise risk management (ERM) system; review and assess First Gen’s ERM policy, processes, strategies, methods and activities and recommend revisions thereto for approval by the board; understand and set clear directions for the management of the Corporation’s strategic and critical risks; and provide management the support and resources necessary to manage the risks to the Corporation.

39 | P a g e
On April 8, 2010, the company submitted to the Philippine SEC its revised Manual on Corporate Governance. Among the changes introduced in the amended manual was the constitution of a Nomination and Governance Committee, to be composed of at least three (3) members, one (1) of whom shall be an Independent Director. The committee is responsible for the following: review and evaluate the qualifications of all persons nominated to the board and other appointments that require board approval; ensure, through a managed and effective system consistent with the corporation’s By-laws, that each board election will result in a mix of proficient directors, each of whom will be able to add value and bring prudent judgment to the board; assess the effectiveness of the board’s processes and procedures in the election or replacement of directors; review the recommendations of the Compliance Officer in relation to the Manual on Corporate Governance as well as other corporate governance rules and regulations and endorse the same to the board for its approval; review, as may be necessary, the charters of all board committees and recommend any changes to the board for its approval; and perform such other tasks or duties as may be requested or delegated by the board. The Nomination and Governance Committee judiciously passes upon the qualifications of nominees to the board, and makes sure that a board election will result in a mix of proficient directors, each of whom will be able to add value and bring prudent judgment to the board of directors. The committee is presently composed of Chairman Federico R. Lopez, Director Richard B. Tantoco, and Independent Director Tony Tan Caktiong. The Compensation and Remuneration Committee is composed of the Chairman of the board and two (2) members, one (1) of whom shall be an Independent Director. The committee shall have powers and functions over the compensation and remuneration of the corporate officers other than the Chairman, whose compensation and remuneration shall be determined by the Vice-Chairman or President and two (2) directors, one of whom shall be an Independent Director. The committee ensures that their compensation of the company’s directors and officers is consistent with the Corporation’s culture, strategy, and the business environment in which it operates.
The Audit Committee is headed by Independent Director Cezar P. Consing, with Director Elpidio L. Ibañez and Independent Director Tony Tan Caktiong as members. Pursuant to the company’s Manual on Corporate Governance, the committee is tasked to perform the following functions: assist the board in the performance of its oversight responsibility for the financial reporting process, system of internal control, audit process, and monitoring of compliance with applicable laws, rules and regulations; provide oversight over management’s activities in managing credit, market, liquidity, operational, legal and other risks of the corporation; review the annual internal audit plan to ensure its conformity with the objectives of the corporation; prior to the commencement of the audit, discuss with the external auditor the nature, scope and expenses of the audit, and ensure proper coordination if more than one audit firm is involved in the activity to secure proper coverage and minimize duplication of efforts; organize an internal audit department and consider the appointment of an independent internal auditor and the terms and conditions of its engagement and removal; monitor and evaluate the adequacy and effectiveness of the company’s internal control system, including financial reporting control and information technology security; review the reports submitted by the internal and external auditors; review the quarterly, half-year and annual financial statements before their submission to the board, with particular focus on: [i] any change/s in accounting policies and practices; [ii] major judgmental areas; [iii] significant adjustments resulting from the audit; [iv] going concern assumptions; [v] compliance with accounting standards; and [vi] compliance with tax, legal and regulatory requirements; evaluate and determine the non-audit work, if any, of the external auditor, and review periodically the non-audit fees paid to the external auditor; establish and identify the reporting line of the internal auditor to enable him to properly fulfill his duties and responsibilities; check all financial reports of the corporation against its compliance with both the internal financial management handbook and pertinent accounting standards, including regulatory requirements; perform interface functions with the internal and external auditors; and ensure the establishment of a transparent financial management controls system that aims to ensure the integrity of the system. The Audit Committee may request information, data and clarification from the officers of the corporation in the performance of their duties and responsibilities. Among the measures undertaken to comply with leading practices on good corporate governance, the board of directors and stockholders, in separate meetings held in March and May 2009, respectively,

40 | P a g e
approved amendments to the corporation’s By-laws providing for the general responsibility of the board of directors; providing for the election and qualification of independent directors; prescribing additional qualifications and disqualifications of directors, such as disqualification on the grounds of violation of the SRC, the Corporation Code, and rules administered by the Bangko Sentral ng Pilipinas and the SEC, insolvency, analogous acts committed in another jurisdiction, commission of other acts deemed prejudicial, inimical, or causing undue injury to the corporation, its subsidiaries or affiliates, and gross negligence or bad faith committed as an officer or director of another company; and finally, providing that the board of directors shall be governed by the Manual on Corporate Governance. The amendments were approved by the SEC on August 24, 2009, and now form part of the company’s By-laws. To further ensure compliance with the principles and policies of good corporate governance, Senior Vice President Victor B. Santos Jr. serves as the company's Compliance Officer. Mr. Santos is responsible for monitoring compliance by the corporation with the Manual on Corporate Governance and the rules and regulations of regulatory agencies, including reporting the occurrence of any violation, reporting such violation to the board, recommending the imposition of appropriate disciplinary actions on the responsible parties, and adopting measures to prevent a repetition of the violation; appearing before the SEC when summoned on matters relating to the Manual on Corporate Governance; issuing a certification in January of each year on the extent of the corporation’s compliance with the Manual on Corporate Governance for the preceding year, and, if any deviations are found, explaining the reasons for such deviation; and recommending to the board the review of the Manual on Corporate Governance. First Gen, through its board of directors and senior management, continues to search for ways and means to improve its corporate governance. Firmly believing that corporate governance is a necessary component of sound business management, the company regularly reviews its existing policies and programs with the intention of further elevating the level of accountability of the company’s directors, officers, and employees. Efforts to enhance and develop the company’s corporate governance structures have resulted in amendments to the company’s By-laws and Manual on Corporate Governance. As First Gen sets its sights on playing an even greater role in the power industry, it will continue to diligently exert every effort necessary to achieve its corporate governance goals and aspirations.

AUDITED CONSOLIDATET)FINANCIAL STATEMENTS

First Gsnt Gen Corporat ion
, Ach.qa Rod cd^e erakoAwnw,l@ P6b, Msko Manita. phtippi.rs
/ Fd : +63 (46314691/ f f i& . tg€n conph
March 16,2011
SECUzuTIES AND EXCHANGE COMMISSIONSEC Building, EDSA GreenhillsMandaluyong City, Metro Manila
The management of First Gen Corporation (the Company) is responsible for all informationand representations contained in the consolidateci financial statements as of December 31,2010 and 2009 and for each of the three years in the period ended December 31, 2010. Theconsolidated financial statements have been prepared in accordance with PhilippineFinancial Reporting Standards and reflect amounts that are based on the best estimates mclinformed judgment of management with an appropriate consideration to materiality.
In this regard, management maintains a system of accounting and reporting which providesfor the necessary internal controls to ensure that transactions are properly authorized andrecorded, assets are safeguarded against unauthorized use or disposition and liabilities arerecognized. The management likewise discloses to the company's audit committee and toits extemal auditor: (i) all significant deficiencies in the design or operation of internal
that could adversely affect its ability to record, process, and report financial data;ii) material weaknesses in the internal controls; and (iii) any fraud that involves
or other ernployees who exercise significant roles in internal conkols.
Board of Directors reviews the consolidated financial statements before suoh statementsre approved and submitted to the stockholders of the Company.
yCip, Gorres, Velayo & Co., the independent auditr:rs appointed by the stockholders, haveined the consolidated financial statements of the Cornpanv in accordance with
hilippine Standards on Auditing and have expressed their opinion on the faimess ofion upon completion of such examination, in their report to the Stockholders and
Board of Directors,
red under oath by the following:
€-*-t; L.- )-- ",ederico R. Lopez j
&mzFrancis Giles B. PunoPresident and Chief Operating Officerand
icer & 'lreasurer

IFIAR 2 5 2OII
UBSCRIBED AND swoRN To before me this day of March 201r, affiantsxhibited to me their cclmmunity Tax certificate Nos, as foilows:
CTC No. Date/Place IssuedFederico R. Lopez 12177914 January 24,20fi / pasig cityFrancis Giles B. Puno 12177921 January 24,2011 / pasig cityEmmanuel P. singson 10594765 February 14,zTrlleuezon city
eries of 2011.

First Gen Corporation and Subsidiaries
Consolidated Financial Statements December 31, 2010 and 2009 and Years Ended December 31, 2010, 2009 and 2008 (In U.S. Dollars) and Independent Auditors’ Report SyCip Gorres Velayo & Co.

*SGVMC311282*
INDEPENDENT AUDITORS’ REPORT The Stockholders and the Board of Directors First Gen Corporation We have audited the accompanying consolidated financial statements of First Gen Corporation and Subsidiaries, which comprise the consolidated statements of financial position as at December 31, 2010 and 2009, and the consolidated statements of income, statements of comprehensive income, statements of changes in equity and statements of cash flows for each of the three years in the period ended December 31, 2010, and a summary of significant accounting policies and other explanatory information.
Management’s Responsibility for the Consolidated Financial Statements
Management is responsible for the preparation and fair presentation of these consolidated financial statements in accordance with Philippine Financial Reporting Standards, and for such internal control as management determines is necessary to enable the preparation of consolidated financial statements that are free from material misstatement, whether due to fraud or error.
Auditors’ Responsibility
Our responsibility is to express an opinion on these consolidated financial statements based on our audits. We conducted our audits in accordance with Philippine Standards on Auditing. Those standards require that we comply with ethical requirements and plan and perform the audit to obtain reasonable assurance about whether the consolidated financial statements are free from material misstatement.
An audit involves performing procedures to obtain audit evidence about the amounts and disclosures in the consolidated financial statements. The procedures selected depend on the auditor’s judgment, including the assessment of the risks of material misstatement of the consolidated financial statements, whether due to fraud or error. In making those risk assessments, the auditor considers internal control relevant to the entity’s preparation and fair presentation of the consolidated financial statements in order to design audit procedures that are appropriate in the circumstances, but not for the purpose of expressing an opinion on the effectiveness of the entity’s internal control. An audit also includes evaluating the appropriateness of accounting policies used and the reasonableness of accounting estimates made by management, as well as evaluating the overall presentation of the consolidated financial statements.
We believe that the audit evidence we have obtained is sufficient and appropriate to provide a basis for our audit opinion.
SyCip Gorres Velayo & Co. 6760 Ayala Avenue 1226 Makati City Philippines
Phone: (632) 891 0307 Fax: (632) 819 0872 www.sgv.com.ph BOA/PRC Reg. No. 0001 SEC Accreditation No. 0012-FR-2
A member firm of Ernst & Young Global Limited

*SGVMC311282*
- 2 -
Opinion
In our opinion, the consolidated financial statements present fairly, in all material respects, the financial position of First Gen Corporation and Subsidiaries as of December 31, 2010 and 2009, and their financial performance and their cash flows for each of the three years in the period ended December 31, 2010 in accordance with Philippine Financial Reporting Standards. SYCIP GORRES VELAYO & CO. Martin C. Guantes Partner CPA Certificate No. 88494 SEC Accreditation No. 0325-AR-1 Tax Identification No. 152-884-272 BIR Accreditation No. 08-001998-52-2009, June 1, 2009, Valid until May 31, 2012 PTR No. 2641530, January 3, 2011, Makati City March 16, 2011

*SGVMC311282*
FIRST GEN CORPORATION AND SUBSIDIARIES CONSOLIDATED STATEMENTS OF FINANCIAL POSITION (Amounts in U.S. Dollars and in Thousands) December 31 2010 2009
ASSETS Current Assets Cash and cash equivalents (Notes 6, 16, 27 and 28) $201,251 $125,531 Receivables (Notes 7, 17, 21, 27, 28 and 29) 87,503 121,334 Inventories (Note 8) 51,013 65,072 Other current assets (Notes 9, 13, 16, 27, 28 and 29) 38,122 34,578 Total Current Assets 377,889 346,515
Noncurrent Assets Investments in associates (Notes 4, 5 and 10) 1,207,518 1,020,722 Property, plant and equipment (Notes 11, 16 and 29) 580,663 562,238 Goodwill and Intangible assets (Note 12) 17,370 17,972 Deferred income tax assets - net (Note 25) 3,794 10 Other noncurrent assets (Notes 9, 13, 16, 17, 24, 27, 28 and 29) 154,159 213,566 Total Noncurrent Assets 1,963,504 1,814,508
TOTAL ASSETS $2,341,393 $2,161,023
LIABILITIES AND EQUITY Current Liabilities Accounts payable and accrued expenses (Notes 14, 27, 28 and 29) $98,698 $104,451 Income tax payable 5,253 7,543 Due to related parties (Notes 21, 27 and 28) 6,709 6,711 Convertible bonds subsequently redeemed (Notes 15, 27, 28 and footnote below) 83,134 – Convertible bonds not redeemed (Notes 15, 27, 28 and footnote below) 130,149 – Current portion of long-term debt (Notes 9, 11, 16, 27 and 28) 59,678 46,499 Philippine peso-denominated bonds (Notes 15, 27 and 28) – 107,984 Obligations to Gas Sellers on Annual Deficiency (Notes 17, 23, 27, 28 and 29) – 9,378 Total Current Liabilities 383,621 282,566
Noncurrent Liabilities Convertible bonds (Notes 15, 27, 28 and footnote below) – 277,353 Long-term debt - net of current portion (Notes 9, 11, 16, 27 and 28) 729,502 700,324 Derivative liabilities (Notes 16, 27 and 28) 39,911 25,335 Retirement liability (Note 24) 722 167 Deferred income tax liabilities - net (Note 25) 10,479 18,609 Other noncurrent liabilities (Notes 17 and 18) 29,189 49,632 Total Noncurrent Liabilities 809,803 1,071,420 Total Liabilities 1,193,424 1,353,986 Note: On February 11, 2011, holders of the convertible bonds (CB) amounting to $72.5 million exercised their option to require the
Parent Company to redeem the CBs at a price of 115.6% of the face value. The total put value amounting to $83.8 million (with a face value of $72.5 million and carrying value of $83.1 million) was paid on February 11, 2011. After February 11, 2011, the unredeemed CBs with a carrying value of $130.1 million as of December 31, 2010 will now have a maturity date of February 11, 2013 and will be reclassified as part of noncurrent liabilities in 2011.
(Forward)

*SGVMC311282*
- 2 -
December 31 2010 2009
Equity Attributable to Equity Holders of the Parent Company (Notes 19 and 20)
Redeemable preferred stock $14,585 $13,561 Common stock 74,697 45,915 Additional paid-in capital 590,193 320,455 Deposits for future stock subscriptions (Note 19) – 93,318 Accumulated share in other comprehensive losses of associates
(Notes 4 and 10) (21,006) (78,516) Cumulative translation adjustments (Note 28) (16,309) (9,642) Retained earnings (Note 10) 400,123 330,930 Cost of common stock held in treasury (Note 19) (52,987) (52,987) 989,296 663,034 Non-controlling Interests 158,673 144,003 Total Equity 1,147,969 807,037
TOTAL LIABILITIES AND EQUITY $2,341,393 $2,161,023 See accompanying Notes to Consolidated Financial Statements.

*SGVMC311282*
FIRST GEN CORPORATION AND SUBSIDIARIES CONSOLIDATED STATEMENTS OF INCOME (Amounts in U.S. Dollars and in Thousands, Except Per Share Data) Years Ended December 31 2010 2009 2008 REVENUE Sale of electricity (Note 29) $1,169,155 $1,009,918 $1,212,016 Interest (Notes 6 and 22) 8,881 6,942 9,079 Equity in net earnings of associates (Note 10) 47,729 1,167 3,530 Mark-to-market gain on derivatives - net (Note 28) 5,395 – 12,190 Foreign exchange gains - net – – 24,011 Others (Notes 13 and 21) 13,118 4,089 1,572 1,244,278 1,022,116 1,262,398 COSTS AND EXPENSES Fuel cost (Notes 8 and 29) (821,467) (669,832) (863,874) Depreciation and amortization (Notes 11, 12 and 23) (54,970) (53,932) (54,026) Power plant operations and maintenance (Note 29) (40,220) (37,624) (37,320) Staff costs (Notes 20, 23 and 24) (16,582) (10,625) (12,027) Other administrative expenses (Notes 21 and 23) (38,664) (37,244) (49,263) Interest expense and financing charges
(Notes 15, 16, 17, 18, 23 and 28) (104,222) (112,089) (121,417) Foreign exchange loss - net (5,114) (8,691) – Mark-to-market loss on derivatives - net (Note 28) – (922) – Others (213) – (320) INCOME FROM CONTINUING OPERATIONS
BEFORE INCOME TAX 162,826 91,157 124,151 PROVISION FOR (BENEFIT FROM) INCOME TAX
(Note 25) Current 48,848 45,492 31,448 Deferred (7,022) (7,381) 18,472 41,826 38,111 49,920 NET INCOME FROM CONTINUING OPERATIONS 121,000 53,046 74,231 NET INCOME FROM DISCONTINUED
OPERATIONS (Note 4) – 41,961 19,237 NET INCOME $121,000 $95,007 $93,468
Net income attributable to: Equity holders of the Parent Company $70,217 $16,754 $14,474 Non-controlling interests 50,783 78,253 78,994 $121,000 $95,007 $93,468
Basic/Diluted Earnings Per Share for Net Income Attributable to Equity Holders of the Parent Company (Note 26) $0.021 $0.013 $0.012
Basic/Diluted Earnings Per Share for Net Income from Continuing Operations Attributable to Equity Holders of the Parent Company (Note 26) $0.021 $0.003 $0.023
Basic/Diluted Earnings (Loss) Per Share for Net Income from Discontinued Operations Attributable to Equity Holders of the Parent Company (Note 26) $– $0.010 ($0.011)
See accompanying Notes to Consolidated Financial Statements.

*SGVMC311282*
FIRST GEN CORPORATION AND SUBSIDIARIES CONSOLIDATED STATEMENTS OF COMPREHENSIVE INCOME (Amounts in U.S. Dollars and in Thousands) Years Ended December 31 2010 2009 2008
NET INCOME $121,000 $95,007 $93,468 OTHER COMPREHENSIVE INCOME (LOSS) Share in other comprehensive income of associates (Note 10) 57,510 64,273 – Exchange gains (losses) on foreign currency translation 191 (60,022) (255,453) Net gains (losses) on cash flow hedge - net of tax (Note 28) (11,416) 24,813 (41,336) Unrealized gain on available-for-sale (AFS) financial assets - net of tax – 1,081 481 46,285 30,145 (296,308) TOTAL COMPREHENSIVE INCOME (LOSS) $167,285 $125,152 ($202,840)
Total comprehensive income (loss) attributable to: Equity holders of the Parent Company $121,060 $64,859 ($173,862) Non-controlling interests 46,225 60,293 (28,978) $167,285 $125,152 ($202,840) See accompanying Notes to Consolidated Financial Statements.

*SGVMC311282*
FIRST GEN CORPORATION AND SUBSIDIARIES CONSOLIDATED STATEMENTS OF CHANGES IN EQUITY FOR THE YEARS ENDED DECEMBER 31, 2010, 2009 AND 2008 (Amounts in U.S. Dollars and in Thousands, Except Per Share Amount)
Equity Attributable to Equity Holders of the Parent Company (Notes 19 and 20)
Capital Stock Deposits for
AccumulatedShare in Other
Comprehensive Cumulative
Accumulated Unrealized
Gain on AFS
Cost of Capital Stock Held in Treasury
Redeemable Additional Future Stock Income (Losses) Translation Financial Equity Retained Redeemable Redeemable Preferred Common Paid-in Subscriptions of Associates Adjustments Assets Reserve Earnings Preferred Common Preferred Common Stock Stock Capital (Note 19) (Notes 4 and 10) (Note 28) (Note 13) (Note 2) (Note 10) Stock Stock Subtotal Stock Stock
BALANCES AT DECEMBER 31, 2009 $13,561 $45,915 $320,455 $93,318 ($78,516) ($9,642) $– $– $330,930 $– ($52,987) $663,034 $144,003 $807,037 Total comprehensive income (loss) – – – – 57,510 (6,667) – – 70,217 – – 121,060 46,225 167,285 Proceeds from Stock Rights Offering (Notes 1 and 19) – 28,781 180,285 – – – – – – – – 209,066 – 209,066 Transaction costs on Stock Rights Offering – – (3,874) – – – – – – – – (3,874) – (3,874) Exercise of stock options (Note 19) – 1 9 – – – – – – – – 10 – 10 Conversion of deposits to additional paid-in capital (Note 19) – – 93,318 (93,318) – – – – – – – – – – Preferred stock dividends (Note 19) 1,024 – – – – – – – (1,024) – – – – – Dividends of subsidiaries – – – – – – – – – – – – (31,555) (31,555)
BALANCES AT DECEMBER 31, 2010 $14,585 $74,697 $590,193 $– ($21,006) ($16,309) $– $– $400,123 $– ($52,987) $989,296 $158,673 $1,147,969
BALANCES AT DECEMBER 31, 2008 $9,572 $20,624 $319,530 $– $– ($136,645) $382 ($28,383) $354,137 ($27,570) ($52,987) $458,660 $559,751 $1,018,411 Total comprehensive income (loss) – – – – 64,273 (16,600) 432 – 16,754 – – 64,859 60,293 125,152 Deconsolidation of discontinued operations (Note 4) – – – – (142,789) 143,603 (814) 28,383 – – – 28,383 (422,192) (393,809) Deposits for future stock subscriptions (Note 19) – – – 110,091 – – – – – – – 110,091 – 110,091 Exercise of stock options (Note 19) – 116 925 – – – – – – – – 1,041 – 1,041 Conversion of deposits to common stocks (Note 19) – 16,773 – (16,773) – – – – – – – – – – Stock dividends (Note 19): Common stock - 50% – 8,402 – – – – – – (8,402) – – – – – Preferred stock 3,989 – – – – – – – (31,559) 27,570 – – – – Dividends of subsidiaries – – – – – – – – – – – – (53,849) (53,849)
BALANCES AT DECEMBER 31, 2009 $13,561 $45,915 $320,455 $93,318 ($78,516) ($9,642)
$–
$– $330,930 $– ($52,987) $663,034 $144,003 $807,037
(Forward)

*SGVMC311282*
- 2 -
Equity Attributable to Equity Holders of the Parent Company (Notes 19 and 20)
Capital Stock Deposits for
AccumulatedShare in Other
Comprehensive Cumulative
Accumulated Unrealized
Gain on AFS
Cost of Capital Stock Held in Treasury
Redeemable Additional Future Stock Income (Losses) Translation Financial Equity Retained Redeemable Non- Preferred Common Paid-in Subscriptions of Associates Adjustments Assets Reserve Earnings Preferred Common controlling Stock Stock Capital (Note 19) (Notes 4 and 10) (Note 28) (Note 13) (Note 2) (Note 10) Stock Stock Subtotal Interests Total
BALANCES AT DECEMBER 31, 2007 $9,572 $20,623 $319,487 $– $– $51,884 $189 $– $339,663 ($27,570) ($52,987) $660,861 $688,720 $1,349,581 Total comprehensive income (loss) – – – – – (188,529) 193 – 14,474 – – (173,862) (28,978) (202,840) Exercise of stock options (Note 19) – 1 8 – – – – – – – – 9 – 9 Share-based payments (Note 19) – – 35 – – – – – – – – 35 – 35 Impact of sale of First Gen Hydro Power Corporation (Note 2) – – – – – – – (28,383) – – – (28,383) 28,383 – Dividends of subsidiaries – – – – – – – – – – – – (128,374) (128,374)
BALANCES AT DECEMBER 31, 2008 $9,572 $20,624 $319,530 $– $– ($136,645) $382 ($28,383) $354,137 ($27,570) ($52,987) $458,660 $559,751 $1,018,411 See accompanying Notes to Consolidated Financial Statements.

*SGVMC311282*
FIRST GEN CORPORATION AND SUBSIDIARIES CONSOLIDATED STATEMENTS OF CASH FLOWS (Amounts in U.S. Dollars and in Thousands) Years Ended December 31 2010 2009 2008
CASH FLOWS FROM OPERATING ACTIVITIES Income from continuing operations before income tax $162,826 $91,157 $124,151 Income from discontinued operations before income tax
(Note 4) – 61,500 42,703 Income before income tax 162,826 152,657 166,854 Adjustments for: Equity in net earnings of associates (Note 10) (47,729) (1,167) (3,530) Interest expense and financing charges (Note 23)
Continuing operations 104,222 112,089 121,417 Discontinued operations – 26,173 82,270
Net unrealized foreign exchange losses (gains) Continuing operations 5,075 5,928 (20,314) Discontinued operations – (26,904) 178,294
Depreciation and amortization (Note 23) Continuing operations 54,970 53,932 54,026 Discontinued operations – 10,731 37,881
Mark-to-market loss (gain) on derivatives - net (Note 28) Continuing operations (5,395) 922 (12,190) Discontinued operations – 5,162 (18,411)
Interest income (Note 22) Continuing operations (8,881) (6,942) (9,079) Discontinued operations – (9,895) (13,596)
Income before working capital changes 265,088 322,686 563,622 Decrease (increase) in: Receivables 31,253 (40,642) 70,621 Concession receivables – (18,144) 76,510 Other long-term receivables - net – 10,655 (15,456) Inventories 14,059 (19,225) 13,471 Other current assets (4,504) 1,920 (12,479) Increase (decrease) in: Accounts payable and accrued expenses (2,316) 22,457 (114,675) Retirement and other post-retirement liability 555 (340) (2,185) Royalty fee payable – (7,914) (8,979) Cash generated from operations 304,135 271,453 570,450 Interest received 3,024 16,942 20,794 Income taxes paid (53,078) (40,228) (86,408) Net cash provided by operating activities 254,081 248,167 504,836
CASH FLOWS FROM INVESTING ACTIVITIES Collections from (advances to) non-controlling shareholder
(Notes 9 and 13) 8,275 10,297 (99,017) Collection of receivables from Meralco on Annual Deficiency
(Note 17) 2,275 19,119 48,495
(Forward)

*SGVMC311282*
- 2 - Years Ended December 31 2010 2009 2008 Cash disposed of - discontinued operations (Note 4) $– ($164,817) $– Additions to: Investments in associates (Note 10) (103,635) (119,278) – Property, plant and equipment (Note 11) (19,438) (9,621) (27,295) Intangible assets (Note 12) – (5,930) (19,618) Other noncurrent assets (16,986) (45,527) (39,410) Proceeds from sale of (additional investments in) AFS financial assets – (986) 14,243 Cash dividends received from associates (Note 10) 5,377 5,691 15,665 Proceeds from disposal of property and equipment 74 77 30 Return of investments in associates (Note 10) 16,701 3,261 – Net cash used in investing activities (107,357) (307,714) (106,907)
CASH FLOWS FROM FINANCING ACTIVITIES Proceeds from: Common Stock Rights Offering - net of transaction
costs (Note 19) 205,192 – – Availment of long-term debt - net of debt issuance
costs (Note 16) 82,585 195,185 485,135 Exercise of stock options (Note 2) 10 1,041 9 Deposits for future stock subscriptions (Note 19) – 110,091 – Availment of loans – 18,949 295,298 Issuance of convertible bonds - net of debt
issuance costs (Note 15) – – 256,074 Payments of: Philippine peso-denominated bonds (108,228) – – Buy-back of convertible bonds (Note 15) (83,233) – – Interest expense and financing charges (83,043) (90,427) (120,202) Long-term debt (Note 16) (50,994) (74,020) (598,389) Dividends to non-controlling shareholder
of subsidiaries (31,555) (53,849) (128,374) Obligations to Gas Sellers on Annual Deficiency
(Note 17) (2,031) (27,064) (30,082) Loans payable – (121,167) (530,715) Obligations to power plant contractors – (1,635) (6,226) Deferred payment facility with PSALM (Note 4) – – (8,525) Payments to related parties (161) (1,107) (1,066) Proceeds from (payments of) other noncurrent liabilities 9 (953) (1,153) Net cash used in financing activities (71,449) (44,956) (388,216)
EFFECT OF FOREIGN EXCHANGE RATE CHANGES ON CASH AND CASH EQUIVALENTS 445 387 1,762
NET INCREASE (DECREASE) IN CASH AND CASH EQUIVALENTS 75,720 (104,116) 11,475
CASH AND CASH EQUIVALENTS AT BEGINNING OF YEAR 125,531 229,647 218,172
CASH AND CASH EQUIVALENTS AT END OF YEAR (Note 6) $201,251 $125,531 $229,647
See accompanying Notes to Consolidated Financial Statements.

*SGVMC311282*
FIRST GEN CORPORATION AND SUBSIDIARIES NOTES TO CONSOLIDATED FINANCIAL STATEMENTS (Amounts in U.S. Dollars and in Thousands, Unless Otherwise Stated) 1. Corporate Information
First Gen Corporation (the Parent Company or First Gen) is incorporated in the Philippines and registered with the Philippine Securities and Exchange Commission (SEC) on December 22, 1998. The Parent Company and its subsidiaries (collectively referred to as First Gen Group) are involved in the power generation business. All subsidiaries (see Note 2) are incorporated in the Philippines.
The common stocks of the Parent Company are currently listed and traded on the First Board of the Philippine Stock Exchange, Inc. (PSE). First Gen is considered a public company under Section 17.2 of the Securities Regulation Code (SRC). On January 22, 2010, the Parent Company has successfully completed the Stock Rights Offering (the Rights Offering) of 2,142,472,791 rights shares in the Philippines at the proportion of 1.756 rights shares for every one existing common stock held as of the record date December 29, 2009 at the offer price of P=7.00 per rights share. The total proceeds from the Rights Offering amounted to P=15.0 billion ($319.2 million). As of March 16, 2011, First Philippine Holdings Corporation (FPHC) directly owns 66.2% of the common stocks of First Gen and 100% of First Gen’s voting preferred stocks. FPHC is the ultimate parent company of First Gen.
The registered office address of the Parent Company is 3rd Floor, Benpres Building, Exchange Road corner Meralco Avenue, Pasig City.
The consolidated financial statements of First Gen Group were reviewed, approved and authorized for issuance by the Board of Directors (BOD) on March 16, 2011.
2. Summary of Significant Accounting and Financial Reporting Policies
Basis of Preparation The consolidated financial statements have been prepared on a historical cost basis, except for derivative financial instruments that have been measured at fair value. The consolidated financial statements are presented in United States (U.S.) dollar, which is the Parent Company’s functional currency, and are rounded to the nearest thousands, except when otherwise indicated. Statement of Compliance The consolidated financial statements of First Gen Group have been prepared in compliance with Philippine Financial Reporting Standards (PFRS) as issued by the Philippine Financial Reporting Standards Council and adopted by the Philippine SEC.
Significant Accounting and Financial Reporting Policies
The accounting policies adopted are consistent with those of the previous financial year, except for the adoption of the following revised, amended and improved PFRS and Philippine Interpretations effective beginning January 1, 2010: § Revised PFRS 3, Business Combinations, introduces significant changes in the accounting for
business combinations occurring after this date. Changes affect the valuation of non-controlling interest, the accounting for transaction costs, the initial recognition and subsequent

- 2 -
*SGVMC311282*
measurement of a contingent consideration and business combinations achieved in stages. These changes will impact the amount of goodwill recognized, the reported results in the period that an acquisition occurs and future reported results. Adoption of this amended standard has no material impact on the consolidated financial statements as First Gen Group did not have any business combination in 2010.
§ Amendments to PAS 27, Consolidated and Separate Financial Statements, require that a
change in the ownership interest of a subsidiary (without loss of control) is accounted for as a transaction with owners in their capacity as owners. Therefore, such transactions will no longer give rise to goodwill, nor will it give rise to a gain or loss. Furthermore, the amended standard changes the accounting for losses incurred by the subsidiary as well as the loss of control of a subsidiary. Adoption of this amended standard has no material impact on the consolidated financial statements as First Gen Group did not have any change in the ownership interest in a subsidiary without the loss of control.
Adoption of the following changes in standards and Philippine Interpretation based on International Financial Reporting Interpretations Committee (IFRIC) interpretations did not have any significant impact on the consolidated financial statements.
§ Amendments to PFRS 2, Share-based Payment - Group Cash-settled Share-based Payment
Transactions § Amendments to PAS 39, Financial Instruments: Recognition and Measurement - Eligible
Hedged Items § Philippine Interpretation IFRIC 17, Distributions of Non-cash Assets to Owners Improvements to PFRSs In May 2008 and April 2009, the International Accounting Standards Board (IASB) issued omnibus amendments to the following standards, primarily with a view of removing inconsistencies and clarify wording. The adoption of the following amendments resulted in changes to accounting policies but did not have significant impact on the financial position and performance of First Gen Group. § PFRS 2, Share-based Payment § PFRS 5, Noncurrent Assets Held for Sale and Discontinued Operations § PFRS 8, Operating Segments § PAS 1, Presentation of Financial Statements § PAS 7, Statement of Cash Flows § PAS 17, Leases § PAS 36, Impairment of Assets § PAS 38, Intangible Assets § PAS 39, Financial Instruments: Recognition and Measurement § Philippine Interpretation IFRIC 9, Reassessment of Embedded Derivatives § Philippine Interpretation IFRIC 16, Hedges of a Net Investment in a Foreign Operation
Basis of Consolidation Basis of consolidation starting January 1, 2010 The consolidated financial statements comprise the financial statements of the Parent Company and its subsidiaries as of December 31 each year. Subsidiaries are fully consolidated from the date control is transferred to First Gen Group or the Parent Company and cease to be consolidated from the date control is transferred out of First Gen

- 3 -
*SGVMC311282*
Group or the Parent Company. The financial statements of the subsidiaries are prepared for the same reporting year as the Parent Company, using consistent accounting policies for like transactions and other events with similar circumstances. All significant intra-group balances, transactions, income and expenses and profits and losses resulting from intra-group transactions are eliminated in full on consolidation. Losses within a subsidiary are attributed to the non-controlling interest (formerly known as minority interest) even if that results in a deficit balance.
A change in the ownership interest of a subsidiary, without a loss of control, is accounted for as an equity transaction. If First Gen Group loses control over a subsidiary, it derecognizes the carrying amounts of the assets (including goodwill) and liabilities of the subsidiary, carrying amount of any non-controlling interest (including any attributable components of other comprehensive income recorded in equity), and recognizes the fair value of the consideration received, fair value of any investment retained, and any surplus or deficit recognized in the consolidated statement of income. First Gen Group also reclassifies the Parent Company’s share of components previously recognized in other comprehensive income to profit or loss or retained earnings, as appropriate. Basis of consolidation prior to January 1, 2010 The above-mentioned requirements were applied on a prospective basis. The following differences, however, are carried forward in certain instances from the previous basis of consolidation: § Losses incurred by First Gen Group were attributed to the non-controlling interest until the
balance was reduced to nil. Any further excess losses were attributed to the Parent Company, unless the non-controlling interest had a binding obligation to cover these. Losses prior to January 1, 2010 were not reallocated between non-controlling interests and the equity holders of the Parent Company.
§ Upon loss of control, First Gen Group accounted for the investment retained at its proportionate share of net asset value at the date control was lost. The carrying values of such investments as of January 1, 2010 have not been restated.
Non-controlling Interests Non-controlling interests represent the portion of profit or loss and net assets not held by First Gen Group. For 2010 and 2009, the non-controlling interests arise from the profits or losses and net assets not held by First Gen Group in First Gas Holdings Corporation (FGHC) and Subsidiaries, FGP Corp. (FGP) and First NatGas Power Corporation (FNPC). For 2008, the non-controlling interests arise from the profits or losses and net assets not held by First Gen Group in FGHC and Subsidiaries, FGP, FNPC, Prime Terracota Holdings Corp. (Prime Terracota), Energy Development Corporation (EDC) and First Gen Hydro Power Corporation (FG Hydro). Non-controlling interests are presented separately in the consolidated statement of income and within equity in the consolidated statement of financial position, separate from equity attributable to equity holders of First Gen. Acquisitions of non-controlling interests are accounted as an equity transaction in the consolidated statement of changes in equity.

- 4 -
*SGVMC311282*
Subsidiaries The following is a list of the companies on which the Parent Company has control:
Percentage of Voting Interest 2010 2009 2008 First Gen Renewables, Inc. (FGRI) 100 100 100 Unified Holdings Corporation (Unified) 100 100 100 AlliedGen Power Corporation (AlliedGen) 100 100 100 First Gen Luzon Power Corp. (FG Luzon) 100 100 100 First Gen Visayas Hydro Power Corporation (FG Visayas) 100 100 100 First Gen Mindanao Hydro Power Corporation (FG Mindanao) 100 100 100 First Gen Geothermal Power Corporation (FG Geothermal) 100 100 100 First Gen Energy Solutions Inc. (FG Energy) 100 100 100 First Gen Premier Energy Corp. (FG Premier) 100 100 100 First Gen Prime Energy Corporation (FG Prime) 100 100 100 First Gen Visayas Energy, Inc. (FG Visayas Energy) 100 100 100 FG Bukidnon Power Corp. (FG Bukidnon)1 100 100 100 Northern Terracotta Power Corp. (Northern Terracotta)2 100 – – FGHC 60 60 60 FGP3 60 60 60 FNPC4 60 60 60 First Gas Power Corporation (FGPC)5 60 60 60 First Gas Pipeline Corporation (FG Pipeline)5 60 60 60 FGLand Corporation (FG Land)5 60 60 60 First Gen Northern Energy Corp. (FGNEC)6 – 100 100 Prime Terracota7 – – 100 Red Vulcan Holdings Corporation (Red Vulcan)8 – – 100 EDC9 – – 60 FG Hydro10 – – 76 1Through FGRI 2On September 7, 2010, Northern Terracotta was incorporated and registered with the Philippine SEC. As
of March 16, 2011, Northern Terracotta has not yet started its commercial operations. 3Through Unified
4Through AlliedGen 5Through FGHC 6On March 17, 2010, FGNEC executed a Subscription Agreement with Metro Pacific Investments
Corporation (MPIC) and Ayala Corporation (AC). This equity transaction has led to the deconsolidation of FGNEC since the Parent Company’s interest in FGNEC has been reduced to 33%.
7On May 12, 2009, Prime Terracota issued Class “B” voting preferred stocks to Quialex Realty Corp. (QRC) and Lopez Inc. Retirement Fund (LIRF). With the issuance of the voting preferred stocks, the Parent Company’s voting interest in Prime Terracota has been reduced to 45%.
8Through Prime Terracota 9Through Red Vulcan which owns common stocks representing 40% economic benefit, and voting and non-
participating preferred stocks of EDC. The combined common and preferred stocks represent 60% voting interest in EDC.
10Direct voting and indirect voting interest by the Parent Company in FG Hydro is 40% and 36%, respectively, while its effective economic interest is 64% as of December 31, 2008.
All of the foregoing subsidiaries are incorporated in the Philippines. As of December 31, 2010 and 2009, AlliedGen, FNPC, FG Luzon, FG Visayas, FG Mindanao, FG Geothermal, FG Premier, FG Prime, FG Visayas Energy and Northern Terracotta have not started commercial operations.

- 5 -
*SGVMC311282*
In 2009, the investments in Prime Terracota Group (the parent company of Red Vulcan), including FG Hydro, were deconsolidated resulting from equity transactions of the subsidiary that reduced First Gen Group’s voting interest to 45% (see Note 4). Divestment of First Gen’s 60% Equity Stake in FG Hydro § On October 16, 2008 (the “First Closing Date”), First Gen (as “Seller”), EDC (as “Buyer”)
and FG Hydro (collectively referred to as “Parties”), executed a Share Purchase and Investment Agreement (SPIA) for the divestment of First Gen’s 60% equity stake in FG Hydro. FG Hydro owns and operates the newly upgraded and rehabilitated 132 Megawatt (MW) Pantabangan-Masiway Hydro-Electric Power Plant (PAHEP/MAHEP) in Pantabangan, Nueva Ecija. PAHEP/MAHEP was acquired by FG Hydro on September 8, 2006 as a part of National Power Corporation’s (NPC) asset privatization.
§ Pursuant to the terms and conditions of the SPIA, the following transactions constituted the
divestment: a. EDC subscribed to 101,281,942 newly issued common stocks of FG Hydro on the First
Closing Date; b. First Gen sold 249,287,223 common stocks of its holdings in FG Hydro to EDC on
November 17, 2008 (the “Second Closing Date”); and c. First Gen shall subscribe to 500,000 preferred stocks of FG Hydro.
§ Consistent with the SPIA, the acquisition by EDC was through a combination of primary
issuance by FG Hydro of up to 17% interest and sale of secondary stocks by First Gen of up to 43% interest in FG Hydro. Further, FG Hydro returned to First Gen the deposits for future stock subscriptions amounting to $13.0 million (P=648.0 million).
§ On October 20, 2008, the Parties executed a First Supplement to the SPIA whereby the
issuance of the preferred stocks to First Gen shall be deferred pending finalization of the features of the preferred stocks. As of March 16, 2011, the Parties have agreed to amend the features of the preferred stocks covered by the First Supplement to the SPIA. With this amendment, FG Hydro has yet to submit its application to amend its Articles of Incorporation to the Philippine SEC.
§ On the Second Closing Date, First Gen completed the divestment of its 60% equity stake in
FG Hydro in favor of EDC for a total consideration of $85.2 million (P=4.3 billion).
§ As a result of the divestment, First Gen’s direct and indirect voting interests in FG Hydro were 40% and 36%, respectively, and its effective economic interest was 64%. The Parent Company recognized a $28.4 million equity reserve which was recorded in the “Equity Reserve” account in the equity section of the 2008 consolidated statement of financial position.
§ FG Hydro was subsequently deconsolidated on May 12, 2009 due to the dilution of First
Gen’s controlling interest over Prime Terracota.

- 6 -
*SGVMC311282*
Business Combination and Goodwill Business combinations starting January 1, 2010 Business combinations are accounted for using the acquisition method. The cost of an acquisition is measured as the aggregate of the consideration transferred, measured at fair value on acquisition date and the amount of any non-controlling interest in the acquiree. For each business combination, the acquirer measures the non-controlling interest in the acquiree either at fair value or at its proportionate share in the acquiree’s identifiable net assets. Acquisition-related costs incurred are expensed and included in general and administrative expenses.
When First Gen Group acquires a business, it assesses the financial assets and financial liabilities assumed for appropriate classification and designation in accordance with the contractual terms, economic circumstances and pertinent conditions as at the acquisition date. This includes the separation of embedded derivatives in host contracts by the acquiree.
If the business combination is achieved in stages, the acquisition date fair value of the acquirer’s previously held equity interest in the acquiree is remeasured to fair value at the acquisition date and any gain or loss on remeasurement is recognized in the consolidated statement of income.
Any contingent consideration to be transferred by the acquirer is recognized at fair value at the acquisition date. Subsequent changes to the fair value of the contingent consideration, which is deemed to be an asset or liability, is recognized in accordance with PAS 39 either in the consolidated statement of income or as a change to other comprehensive income. If the contingent consideration is classified as equity, it is not be remeasured until it is finally settled within equity. Goodwill is initially measured at cost being the excess of the aggregate of the consideration transferred and the amount recognized for non-controlling interest over the net identifiable assets acquired and liabilities assumed. If this consideration is lower than the fair value of the net assets of the subsidiary acquired, the difference is recognized in the consolidated statement of income. After initial recognition, goodwill is measured at cost less any accumulated impairment losses. For the purpose of impairment testing, goodwill acquired in a business combination is, from the acquisition date, allocated to each of the First Gen Group’s cash-generating units that are expected to benefit from the combination, irrespective of whether other assets or liabilities of the acquiree are assigned to those units.
Where goodwill forms part of a cash-generating unit and part of the operation within that unit is disposed of, the goodwill associated with the operation disposed of is included in the carrying amount of the operation when determining the gain or loss on disposal of the operation. Goodwill disposed of in this circumstance is measured based on the relative values of the operation disposed of and the portion of the cash-generating unit retained.
Business combinations prior to January 1, 2010 Business combinations were accounted for using the purchase method. Transaction costs directly attributable to the acquisition formed part of the acquisition costs. The non-controlling interest was measured at the proportionate share of the acquiree’s identifiable net assets. This involved recognizing identifiable assets and liabilities of the acquired business initially at fair value. If the acquirer’s interest in the net fair value of the identifiable assets and liabilities exceeds the cost of the business combination, the acquirer shall (a) reassess the identification and measurement of the acquiree’s identifiable assets and liabilities and the measurement of the cost of the combination; and (b) recognize immediately in the consolidated statement of income any excess remaining after that reassessment. When a business combination involves more than one exchange transaction, each exchange transaction shall be treated separately using the cost of the transaction and fair

- 7 -
*SGVMC311282*
value information at the date of each exchange transaction to determine the amount of any goodwill associated with that transaction. This results in a step-by-step comparison of the cost of the individual investments with First Gen Group’s interest in the fair value of the acquiree’s identifiable assets, liabilities and contingent liabilities at each exchange transaction. The fair values of the acquiree’s identifiable assets, liabilities and contingent liabilities may be different on the date of each exchange transaction. Any adjustments to those fair values relating to previously held interests of First Gen Group is a revaluation to be accounted for as such and presented separately as part of equity. If the revaluation relates directly to an identifiable fixed asset, the revaluation will be transferred directly to retained earnings when the asset is derecognized in whole through disposal or as the asset concerned is depreciated or amortized.
The goodwill from investments in subsidiaries is included as a noncurrent asset item under the “Goodwill and Intangible assets” account in the consolidated statement of financial position. The goodwill on investment in associates is included in the carrying amount of the related investment.
Cash and Cash Equivalents Cash includes cash on hand and in banks. Cash equivalents are short-term, highly liquid investments that are readily convertible with original maturities of three months or less and that are subject to an insignificant risk of change in value.
Financial Instruments Date of recognition Financial instruments within the scope of PAS 39 are recognized in the consolidated statement of financial position when First Gen Group becomes a party to the contractual provisions of the instrument. Purchases or sales of financial assets that require delivery of assets within the time frame established by regulation or convention in the marketplace are recognized using trade date accounting. Derivatives are also recognized on a trade date basis.
Initial recognition of financial instruments All financial instruments are initially recognized at fair value. The initial measurement of financial instruments includes transaction costs, except for financial instruments at fair value through profit or loss (FVPL). First Gen Group classifies its financial assets in the following categories: financial assets at FVPL, held-to-maturity (HTM) investments, available-for-sale (AFS) financial assets, and loans and receivables. Financial liabilities are classified as either financial liabilities at FVPL or loans and borrowings. The classification depends on the purpose for which the investments were acquired and whether they are quoted in an active market. Management determines the classification of its instruments at initial recognition and, where allowed and appropriate, re-evaluates such designation at every financial reporting date.
Determination of fair value The fair value for financial instruments traded in active markets at financial reporting date is based on their quoted market price or dealer price quotations (bid price for long positions and ask price for short positions), without any deduction for transaction costs. When current bid and ask prices are not available, the price of the most recent transaction provides evidence of the current fair value as long as there has not been a significant change in economic circumstances since the time of the transaction. For all other financial instruments not traded in an active market, the fair value is determined by using appropriate valuation techniques.
“Day 1” difference Where the transaction price in a non-active market is different from the fair value of other observable current market transactions in the same instrument or based on a valuation technique whose variables include only data from observable market, First Gen Group recognizes the

- 8 -
*SGVMC311282*
difference between the transaction price and fair value (a “Day 1” difference) in the consolidated statement of income, unless it qualifies for recognition as some other type of asset. In cases where data which is not observable are used, the difference between the transaction price and model value is only recognized in the consolidated statement of income when the inputs become observable or when the instrument is derecognized. For each transaction, First Gen Group determines the appropriate method of recognizing the “Day 1” difference amount.
Financial assets and liabilities at FVPL Financial assets and liabilities at FVPL include financial assets and liabilities held for trading purposes and financial assets and liabilities designated upon initial recognition as at FVPL.
Financial assets and liabilities are classified as held for trading if these are acquired for the purposes of selling and repurchasing in the near term.
Derivatives, including any separated embedded derivatives, are also classified under financial assets or liabilities at FVPL, unless these are designated as hedging instruments in an effective hedge.
Financial assets or liabilities may be designated by management on initial recognition as at FVPL when any of the following criteria are met:
§ the designation eliminates or significantly reduces the inconsistent treatment that would otherwise arise from measuring the assets or liabilities or recognizing gains or losses on them on a different basis;
§ the assets and liabilities are part of a group of financial assets, liabilities or both which are managed and their performance evaluated on a fair value basis, in accordance with a documented risk management or investment strategy; or
§ the financial instrument contains an embedded derivative, unless the embedded derivative does not significantly modify the cash flows or it is clear, with little or no analysis, that it would not be separately recorded.
Financial assets and liabilities at FVPL are recorded in the consolidated statement of financial position at fair value. Subsequent changes in fair value are recognized in the consolidated statement of income. Interest earned or incurred is recorded as interest income or expense, respectively, while dividend income is recorded as other income when the right to receive payment has been established.
Classified under financial liabilities at FVPL are the embedded derivatives on the Parent Company’s convertible bonds as of December 31, 2010 and 2009 (see Notes 15, 27 and 28).
These derivatives were not designated as hedging instruments by First Gen Group and do not qualify as effective accounting hedges.
HTM investments HTM investments are quoted non-derivative financial assets with fixed or determinable payments and fixed maturities for which First Gen Group’s management has the positive intention and ability to hold to maturity. Where First Gen Group sells other than an insignificant amount of HTM investments, the entire category would be tainted and reclassified as AFS financial assets. After initial measurement, these investments are subsequently measured at amortized cost using the effective interest method, less any impairment in value. Amortized cost is calculated by taking

- 9 -
*SGVMC311282*
into account any discount or premium on acquisition and fees that are integral parts of the effective interest rate. Gains and losses are recognized in the consolidated statement of income when the HTM investments are derecognized and impaired, as well as through the amortization process. The effects of restatement on foreign currency-denominated HTM investments are also recognized in the consolidated statement of income.
First Gen Group has no HTM investments as of December 31, 2010 and 2009.
Loans and receivables Loans and receivables are non-derivative financial assets with fixed or determinable payments and fixed maturities that are not quoted in an active market. They are not entered into with the intention of immediate or short-term resale and are not classified or designated as AFS financial assets or financial assets at FVPL. Loans and receivables are classified as current assets if maturity is within 12 months from financial reporting date. Otherwise, these are classified as noncurrent assets.
After initial measurement, loans and receivables are subsequently measured at amortized cost using the effective interest method, less allowance for impairment. Amortized cost is calculated by taking into account any discount or premium on acquisition and fees that are an integral part of the effective interest rate. Gains and losses are recognized in the consolidated statement of income when the loans and receivables are derecognized and impaired, as well as through the amortization process.
Classified under loans and receivables are cash and cash equivalents, receivables and advances to non-controlling shareholder, as of December 31, 2010 and 2009 (see Notes 6, 7, 9, 13, 21, 27 and 28).
AFS financial assets AFS financial assets are those non-derivative financial assets which are designated as such or do not qualify to be classified in any of the three preceding categories. These are purchased and held indefinitely, and may be sold in response to liquidity requirements or changes in market conditions. AFS financial assets are classified as current assets if management intends to sell these financial assets within 12 months from financial reporting date. Otherwise, these are classified as noncurrent assets.
After initial measurement, AFS financial assets are subsequently measured at fair value, with unrealized gains and losses being recognized as other comprehensive income (losses) until the investment is derecognized or until the investment is determined to be impaired, at which time the cumulative gain or loss previously reported as other comprehensive income (loss) is recognized in the consolidated statement of income. First Gen Group uses the specific identification method in determining the cost of securities sold. Unquoted equity securities and investment in proprietary membership shares are carried at cost, net of impairment. Accounting for the movement in equity is presented in the consolidated statement of changes in equity.
Classified under AFS financial assets are investments in proprietary membership shares as of December 31, 2010 and 2009 (see Notes 13, 27 and 28).
Loans and borrowings Financial liabilities are classified in this category if these are not held for trading or not designated as at FVPL upon the inception of the liability. These include liabilities arising from operations or borrowings. Loans and borrowings are classified as current liabilities if maturity is within 12 months from financial reporting date. Otherwise, these are classified as noncurrent liabilities.

- 10 -
*SGVMC311282*
Loans and borrowings are initially recognized at fair value of the consideration received, less directly attributable transaction costs. After initial recognition, such loans and borrowings are subsequently measured at amortized cost using the effective interest method. Amortized cost is calculated by taking into account any related issue costs, discount or premium. Gains and losses are recognized in the consolidated statement of income when the liabilities are derecognized, as well as through the amortization process.
Debt issuance costs incurred in connection with availments of long-term debt and issuances of bonds are deferred and amortized using the effective interest method over the term of the loans and bonds. Debt issuance costs are included in the measurement of the related long-term debt and bonds payable and are allocated accordingly to the respective current and noncurrent portions.
Classified under loans and borrowings are accounts payable and accrued expenses, due to related parties, bonds payable and long-term debt as of December 31, 2010 (see Notes 14, 15, 16, 21, 27 and 28). Classified under loans and borrowings are accounts payable and accrued expenses, due to related parties, bonds payable, long-term debt and obligations to Gas Sellers on Annual Deficiency as of December 31, 2009 (see Notes 14, 15, 16, 17, 21, 27 and 28).
Derivative Financial Instruments and Hedge Accounting First Gen Group enters into derivative and hedging transactions, primarily interest rate swaps, as needed, for the sole purpose of managing the risks that are associated with First Gen Group’s borrowing activities or as required by the lenders in certain cases.
Derivative financial instruments (including bifurcated embedded derivatives) are initially recognized at fair value on the date on which a derivative contract is entered into and are subsequently remeasured at fair value. Derivatives are carried as assets when the fair value is positive and as liabilities when the fair value is negative. Any gain or loss arising from changes in fair value on derivatives that do not qualify for hedge accounting is taken directly to the consolidated statement of income for the current year under the “Mark-to-market gain (loss) on derivatives” account.
For purposes of hedge accounting, derivatives can be designated either as cash flow hedges or fair value hedges depending on the type of risk exposure it hedges.
At the inception of a hedge relationship, First Gen Group formally designates and documents the hedge relationship to which First Gen Group opts to apply hedge accounting and the risk management objective and strategy for undertaking the hedge. The documentation includes identification of the hedging instrument, the hedged item or transaction, the nature of the risk being hedged and how the entity will assess the hedging instrument’s effectiveness in offsetting the exposure to changes in the hedged item’s fair value or cash flows attributable to the hedged risk. Such hedges are expected to be highly effective in achieving offsetting changes in fair value or cash flows and are assessed on an ongoing basis that they actually have been highly effective throughout the financial reporting periods for which they were designated.
First Gen Group accounts for its interest rate swap agreements as cash flow hedges of the floating rate exposure of its long-term debt (see Note 28).
First Gen Group has no derivatives that are designated as fair value hedges as of December 31, 2010 and 2009.
Cash flow hedges Cash flow hedges are hedges of the exposure to variability in cash flows that are attributable to a particular risk associated with a recognized asset, liability or a highly probable forecast transaction

- 11 -
*SGVMC311282*
and could affect the consolidated statement of income. The effective portion of the gain or loss on the hedging instrument is recognized as other comprehensive income (loss) in the “Cumulative translation adjustments” account in the consolidated statement of financial position while the ineffective portion is recognized as “Mark-to-market gain (loss) on derivatives” in the consolidated statement of income.
Amounts taken to other comprehensive income (loss) are transferred to the consolidated statement of income when the hedged transaction affects profit or loss, such as when hedged financial income or expense is recognized or when a forecast sale or purchase occurs. Where the hedged item is the cost of a non-financial asset or liability, the amounts taken to other comprehensive income (loss) are transferred to the initial carrying amount of the non-financial asset or liability.
If the forecast transaction is no longer expected to occur, amounts previously recognized in other comprehensive income (loss) are transferred to the consolidated statement of income. If the hedging instrument expires or is sold, terminated or exercised without replacement or rollover, or if its designation as a hedge is revoked, amounts previously recognized in other comprehensive income (loss) remain in equity until the forecast transaction occurs. If the related transaction is not expected to occur, the amount is recognized in the consolidated statement of income.
Embedded derivatives An embedded derivative is a component if a hybrid (combined) instrument that also includes a non-derivative host contract with the effect that some of the cash flows of the combined instrument vary in away similar to a stand-alone derivative. Embedded derivatives are bifurcated from their host contracts, when the following conditions are met: (a) the entire hybrid contracts (composed of both the host contract and the embedded derivative) are not accounted for as financial assets at FVPL; (b) when their economic risks and characteristics are not closely related to those of their respective host contracts; and (c) a separate instrument with the same terms as the embedded derivative would meet the definition of a derivative.
First Gen Group assesses whether embedded derivatives are required to be separated from the host contracts when First Gen Group first becomes a party to the contract. Reassessment only occurs if there is a change in the terms of the contract that significantly modifies the cash flows that would otherwise be required.
Embedded derivatives that are bifurcated from the host contracts are accounted for either as financial assets or financial liabilities at FVPL. Changes in fair values are included in the consolidated statement of income.
Derecognition of Financial Assets and Liabilities Financial assets A financial asset (or, where applicable, a part of a financial asset or part of a group of financial assets) is derecognized when:
§ the right to receive cash flows from the asset has expired;
§ First Gen Group retains the right to receive cash flows from the asset, but has assumed an obligation to pay them in full without material delay to a third party under a “pass-through” arrangement; or

- 12 -
*SGVMC311282*
§ First Gen Group has transferred its right to receive cash flows from the asset and either (a) has transferred substantially all the risks and rewards of the asset, or (b) has neither transferred nor retained the risks and rewards of the asset but has transferred the control of the asset.
Where First Gen Group has transferred its right to receive cash flows from an asset or has entered into a “pass-through” arrangement, and has neither transferred nor retained substantially all the risks and rewards of the asset nor transferred control of the asset, the asset is recognized to the extent of First Gen Group’s continuing involvement in the asset. Continuing involvement that takes the form of a guarantee over the transferred asset is measured at the lower of the original carrying amount of the asset and the maximum amount of consideration that First Gen Group could be required to repay.
Financial liabilities A financial liability is derecognized when the obligation under the liability is discharged or cancelled or has expired. Where an existing financial liability is replaced by another from the same lender on substantially different terms, or the terms of an existing liability are substantially modified, such exchange or modification is treated as a derecognition of the original liability and the recognition of a new liability, and the difference in the respective carrying amounts is recognized in the consolidated statement of income.
Impairment of Financial Assets First Gen Group assesses at each financial reporting date whether there is objective evidence that a financial asset or group of financial assets is impaired. A financial asset or a group of financial assets is deemed to be impaired if, and only if, there is objective evidence of impairment as a result of one or more events that has or have occurred after the initial recognition of the asset (an incurred “loss event”) and that loss event has an impact on the estimated future cash flows of the financial asset or the group of financial assets that can be reliably estimated. Objective evidence of impairment may include indications that the borrower or a group of borrowers is experiencing significant financial difficulty, default or delinquency in interest or principal payments, the probability that they will enter bankruptcy or other financial reorganization and where observable data indicate that there is measurable decrease in the estimated future cash flows, such as changes in arrears or economic conditions that correlate with defaults.
For loans and receivables carried at amortized cost, First Gen Group first assesses whether an objective evidence of impairment (such as the probability of insolvency or significant financial difficulties of the debtor) exists individually for financial assets that are individually significant, or collectively for financial assets that are not individually significant. If there is an objective evidence that an impairment loss has been incurred, the amount of loss is measured as the difference between the asset’s carrying value and the present value of the estimated future cash flows (excluding future credit losses that have not been incurred). If First Gen Group determines that no objective evidence of impairment exists for an individually assessed financial asset, whether significant or not, it includes the asset in a group of financial assets with similar credit risk characteristics and collectively assesses for impairment. Those characteristics are relevant to the estimation of future cash flows for groups of such assets by being indicative of the debtors’ ability to pay all amounts due according to the contractual terms of the assets being evaluated. Assets that are individually assessed for impairment and for which an impairment loss is, or continues to be, recognized are not included in a collective assessment for impairment.
The carrying value of the asset is reduced through the use of an allowance account and the amount of loss is charged to the consolidated statement of income. If in case the receivable has proven to have no realistic prospect of future recovery, any allowance provided for such receivable is written off against the carrying value of the impaired receivable. Interest income continues to be

- 13 -
*SGVMC311282*
recognized based on the original effective interest rate of the asset. If, in a subsequent year, the amount of the estimated impairment loss decreases because of an event occurring after the impairment was recognized, the previously recognized impairment loss is reduced by adjusting the allowance account. Any subsequent reversal of an impairment loss is recognized in the consolidated statement of income, to the extent that the carrying value of the asset does not exceed its amortized cost at reversal date.
AFS financial assets For AFS financial assets, First Gen Group assesses at each financial reporting date whether there is objective evidence that a financial asset or group of financial assets is impaired.
In the case of equity investments classified as AFS, a significant or prolonged decline in the fair value of the investments below its cost is considered an objective evidence of impairment. “Significant” is evaluated against the original cost of the investment and “prolonged” against the period in which the fair value has been below its original cost. Where there is evidence of impairment, the cumulative loss, measured as the difference between the acquisition cost and the current fair value, less any impairment loss on that financial asset previously recognized in other comprehensive income (loss), is removed from other comprehensive income (loss) and recognized in the consolidated statement of income. Impairment losses on equity investments are not reversed through the consolidated statement of income. Increases in fair value after impairment are recognized directly in other comprehensive income (loss).
In the case of debt instruments classified as AFS, impairment is assessed based on the same criteria as financial assets carried at amortized cost. Future interest income is based on the reduced carrying amount and is accrued based on the rate of interest used to discount future cash flows for the purpose of measuring impairment loss. Such accrual is recorded as part of the “Interest income” in the consolidated statement of income. If, in a subsequent year, the fair value of a debt instrument increases and that increase can be objectively related to an event occurring after the impairment loss was recognized in the consolidated statement of income, the impairment loss is reversed through the consolidated statement of income.
Offsetting Financial Instruments Financial assets and financial liabilities are offset with the net amount reported in the consolidated statement of financial position if, and only if, there is a currently enforceable legal right to offset the recognized amounts and there is an intention to settle on a net basis, or to realize the asset and settle the liability simultaneously. This is not generally the case with master netting agreements, and the related assets and liabilities are presented at gross amounts in the consolidated statement of financial position.
Inventories Inventories are carried at the lower of cost and net realizable value (NRV). Cost of fuel inventories is determined using the weighted average cost method, while the costs for spare parts and supplies are determined using the moving average method. The NRV for fuel inventories of FGP and FGPC is the fuel cost charged to Manila Electric Company (Meralco), under the respective Power Purchase Agreements (PPA) of FGP and FGPC with Meralco [see Note 29(a)], which is based on weighted average cost of actual fuel consumed. NRV for spare parts and supplies is the current replacement cost.
Prepaid Taxes Prepaid taxes (included in the “Other current assets” account in the consolidated statement of financial position) are carried at cost less any impairment in value. Prepaid taxes consist mainly of tax credits that can be used by First Gen Group in the future. Tax credits represent unapplied or

- 14 -
*SGVMC311282*
unsold certificates for claims from input value-added tax (VAT) credits received from the Bureau of Internal Revenue (BIR) and the Bureau of Customs (BOC). Such tax credits may be used for payment of internal revenue taxes or customs duties, or sold to third parties.
Investments in Associates An associate is an entity over which First Gen Group has significant influence but not control, generally accompanying a shareholding of between 20% and 50% of the voting rights.
The following is a list of the companies on which the Parent Company has significant influence:
Percentage of Voting Interest 2010 2009 2008First Gen Northern Energy Corp. (FGNEC) 1 33 – –First Private Power Corporation (FPPC)2 – 40 40Bauang Private Power Corporation (BPPC)2 37 – –Prime Terracota3 45 45 –FG Hydro4 40 40 –1 The equity transaction between MPIC, AC and the Parent Company in March 2010 has led to the
deconsolidation of FGNEC since the Parent Company’s interest in FGNEC has been reduced to 33% from 100%.
2 FPPC has 93.25% voting and economic interest in BPPC. By virtue of the merger, FPPC transferred its assets and liabilities at their carrying values to BPPC on December 15, 2010 (see Note 10).
3 In May 2009, investments in Prime Terracota and FG Hydro were deconsolidated resulting from equity transactions of Prime Terracota that reduced First Gen Group’s voting interest to 45% (see Note 4). As of December 31, 2010 and 2009, Prime Terracota’s subsidiaries include the following companies:
Percentage of Ownership 2010 2009
Red Vulcan 100 100 EDC 60 60 EDC Drillco Corporation 60 60 First Luzon Geothermal Energy Corporation (FL Geothermal) 60 60 Green Core Geothermal Inc. (GCGI) 60 60 Bac-Man Geothermal Inc. (BGI) 60 – Unified Leyte Geothermal Energy Inc. (ULGEI) 60 – EDC Wind Energy Holdings, Inc. 60 – EDC Burgos Wind Power Corporation 60 – EDC Chile Limitada 60 –
4 Direct voting and indirect voting interest by the Parent Company in FG Hydro is 40% and 36%, respectively, while its effective economic interest is 64% as of December 31, 2008.
Under the equity method, such investments in associates are carried in the consolidated statement of financial position at cost plus post-acquisition changes in First Gen Group’s share in net assets of the associate. First Gen Group’s share in its associates’ post-acquisition profits or losses is recognized in the consolidated statement of income, and its share in post-acquisition movements in the associates’ other comprehensive income (loss) and equity items is recognized directly in the consolidated statement of comprehensive income. The cumulative post-acquisition movements are adjusted against the carrying amount of the investment. When First Gen Group’s share in losses of an associate equals or exceeds its interest in the associate, including any other unsecured receivables, First Gen Group does not recognize further losses, unless it has incurred obligations or made payments on behalf of the associates.

- 15 -
*SGVMC311282*
Unrealized intercompany profits or losses arising from the transactions with the associates are eliminated to the extent of First Gen Group’s interest in the associates. Goodwill relating to associates are included in the carrying amount of the investment and is not amortized or separately tested for impairment.
Included under the investments in associates are the Parent Company’s deposits for future stock subscriptions to its associates. Such deposits represent nonrefundable advances to the associates and will be settled by the exchange of a fixed number of the associates’ equity instruments.
The reporting dates of the associates and First Gen Group are identical and the associates’ accounting policies conform to those used by First Gen Group for like transactions and events in similar circumstances.
Property, Plant and Equipment Property, plant and equipment, except land, are stated at cost less accumulated depreciation, amortization and impairment in value, if any. Land is stated at cost less any impairment in value.
The initial cost of property, plant and equipment consists of the purchase price including import duties, borrowing costs (during the construction period) and other costs directly attributable to bring the asset to its working condition and location for its intended use. Cost also includes the cost of replacing part of such property, plant and equipment when the recognition criteria are met and the estimated present value of the cost of dismantling and removing the asset and restoring the site.
Expenditures incurred after the property, plant and equipment have been put into operation, such as repairs and maintenance, are normally charged to the consolidated statement of income in the year the costs are incurred. In situations where it can be clearly demonstrated that the expenditures have resulted in an increase in the future economic benefits expected to be obtained from the use of an item of property, plant and equipment beyond its originally assessed standard of performance, the expenditures are capitalized as additional costs of property, plant and equipment.
First Gen Group divided the power plant assets into significant parts. Each part of an item of property, plant and equipment with a cost that is significant in relation to the total cost of the item is depreciated and amortized separately. Depreciation and amortization are computed using the straight-line method over the following estimated useful lives of the assets:
Asset Type Number of Years Buildings and other structures 5-25 Machinery and equipment 2-25 Transportation equipment 5 Furniture, fixtures and office equipment 3-10 Leasehold improvements 5 or lease term with no renewal option,
whichever is shorter
The useful lives and depreciation and amortization method are reviewed at each financial reporting date to ensure that the years and method of depreciation and amortization are consistent with the expected pattern of economic benefits from items of property, plant and equipment.
An item of property, plant and equipment is derecognized upon disposal or when no future economic benefits are expected from its use. Any gain or loss arising from derecognition of the assets (calculated as the difference between the net disposal proceeds and carrying amount of the asset) is credited to or charged against current operations.

- 16 -
*SGVMC311282*
Prepaid Gas Prepaid gas (included in the “Other noncurrent assets” account in the consolidated statement of
financial position) consists of payments to Gas Sellers for unconsumed gas, net of any adjustment. The prepaid gas is recoverable in the form of future gas deliveries in the order that it arose and can be consumed within a 10-year period. The terms and conditions on the payment and recovery of outstanding prepaid gas are covered by the respective Settlement Agreements (SA) and Payment Deferral Agreements (PDA) of FGP and FGPC (see Note 17).
If it should be determined at some future date that the likelihood of any amount of gas usage or delivery is remote, then the relevant amount deemed no longer realizable will be written off from the consolidated statement of income.
Impairment of Non-financial Assets Property, plant and equipment, intangible assets, prepaid gas and prepaid major spare parts At each financial reporting date, First Gen Group assesses whether there is any indication that its non-financial assets may be impaired. When an indicator of impairment exists, First Gen Group makes a formal estimate of an asset’s recoverable amount. The recoverable amount is the higher of an asset’s fair value less costs to sell and its value in use. Recoverable amount is determined for an individual asset, unless the asset does not generate cash inflows that are largely independent from other assets or groups of assets, in which case the recoverable amount is assessed as part of the cash-generating unit to which it belongs. Where the carrying amount of an asset (or cash-generating unit) exceeds its recoverable amount, the asset (or cash-generating unit) is considered impaired and is written down to its recoverable amount. In assessing value in use, the estimated future cash flows are discounted to their present value using a pre-tax discount rate that reflects current market assessment of the time value of money and the risks specific to the asset (or cash-generating unit). An impairment loss is recognized in the consolidated statement of income in the year in which it arises.
An assessment is made at each financial reporting date as to whether there is any indication that previously recognized impairment losses may no longer exist or may have decreased. If such indication exists, First Gen Group estimates the asset’s or cash-generating unit’s recoverable amount. A previously recognized impairment loss is reversed only if there has been a change in the assumptions used to determine the asset’s recoverable amount since the last impairment loss was recognized. The reversal is limited so that the carrying amount of the asset does not exceed its recoverable amount, nor exceed the carrying amount that would have been determined, net of depreciation, had no impairment loss been recognized for the asset in prior years. Such reversal is recognized in the consolidated statement of income.
Goodwill Goodwill is reviewed for impairment annually or more frequently, if events or changes in circumstances indicate that the carrying value may be impaired.
Impairment is determined for goodwill by assessing the recoverable amount of the cash-generating unit (or group of cash-generating units) to which the goodwill relates. Where the recoverable amount of the cash-generating unit (or group of cash-generating units) is less than the carrying amount of the cash-generating unit (or group of cash-generating units) to which goodwill has been allocated, an impairment loss is recognized immediately in the consolidated statement of income. Impairment loss relating to goodwill cannot be reversed for subsequent increases in its recoverable amount in future years. First Gen Group performs its annual impairment test of goodwill as of December 31 of each year.

- 17 -
*SGVMC311282*
Investments in associates First Gen Group determines whether it is necessary to recognize an impairment loss on its investments in associates. First Gen Group determines at each financial reporting date whether there is any objective evidence that the investments in associates are impaired. If this is the case, First Gen Group calculates the amount of impairment as being the difference between the recoverable value of the associate and the carrying amount of investment and recognizes the amount of impairment loss in the consolidated statement of income.
Research and Development Costs Research costs are expensed as incurred. Development expenditures incurred on an individual project are carried forward when its future recoverability can reasonably be regarded as assured. Any expenditure carried forward is amortized in line with the expected future revenue from the related project. Otherwise, development costs are expensed as incurred.
The carrying value of development costs is reviewed for impairment annually when the asset is not yet in use or more frequently when an indication of impairment arises during the reporting year.
Intangible Assets Intangible assets acquired separately are measured on initial recognition at cost. The cost of intangible assets acquired in a business combination is the fair value as of the date of acquisition. The intangible assets arising from the business combination are recognized initially at fair values. Following initial recognition, intangible assets are carried at cost less accumulated amortization and any impairment losses. Internally generated intangible assets, excluding capitalized development costs, are not capitalized and expenditures are reflected in the consolidated statement of income in the year the expenditure is incurred.
The useful lives of intangible assets are assessed to be either finite or indefinite. Intangible assets with finite lives are amortized using the straight-line method over the estimated useful economic life, and assessed for impairment whenever there is an indication that the intangible asset may be impaired. The amortization period and method for an intangible asset with a finite useful life are reviewed at least each financial reporting date. Changes in the expected useful life or the expected pattern of consumption of future economic benefits embodied in the said intangible asset is accounted for by changing the amortization period or method, as appropriate, and are treated as changes in accounting estimates. The amortization expense on intangible assets with finite lives is recognized in the consolidated statement of income in the expense category consistent with the function of the intangible asset.
Intangible assets with indefinite useful lives are tested for impairment annually, either individually or at the cash generating unit level. Such intangibles are not amortized. The useful life of an intangible asset with an indefinite life is reviewed annually to determine whether the indefinite life assessment continues to be supportable. If not, the change in the useful life assessment from indefinite to finite is made prospectively.
Gains or losses arising from derecognition of an intangible asset are measured as the difference between the net disposal proceeds, if any, and the carrying amount of the asset and are recognized in the consolidated statement of income in the year the asset is derecognized.
As of December 31, 2010 and 2009, First Gen Group’s intangible asset with finite life pertains to pipeline rights that are being amortized for 22 years.

- 18 -
*SGVMC311282*
Unearned Revenue Unearned revenue (included in the “Other noncurrent liabilities” account in the consolidated statement of financial position) represents payments received from Meralco which corresponds to the unconsumed gas in connection with the respective SAs and PDAs of FGP and FGPC (see Note 17). Such can be realized in case the actual gas consumed by the power plants in generating electricity to Meralco exceed their respective Take-or-Pay Quantities (TOPQ) at any given year.
Provisions Provisions are recognized when First Gen Group has a present obligation (legal or constructive) as a result of a past event, it is probable that an outflow of resources embodying economic benefits will be required to settle the obligation and a reliable estimate can be made of the amount of the obligation. Where First Gen Group expects some or all of the provision will be reimbursed, for example, under an insurance contract, the reimbursement is recognized as a separate asset but only when the reimbursement is virtually certain. The expense relating to any provision is recognized in the consolidated statement of income, net of any reimbursement. If the effect of the time value of money is material, provisions are determined by discounting the expected future cash flows at a pre-tax rate that reflects current market assessment of the time value of money and, where appropriate, the risks specific to the liability. Where discounting is used, the increase in the provision due to passage of time is recognized under the “Interest expense and financing charges” account in the consolidated statement of income.
FGP, FGPC and FG Bukidnon recognized provisions arising from legal and/or constructive obligations associated with the cost of dismantling and removing an item of property, plant and equipment and restoring the site where it is located. The obligation of FGP, FGPC and FG Bukidnon occurs either when the asset is acquired or as a consequence of using the asset for the purpose of generating electricity during a particular year. A corresponding asset is recognized as property, plant and equipment. Dismantling costs are provided at the present value of expected costs to settle the obligation using estimated cash flows. The cash flows are discounted at a current pre-tax rate that reflects the risks specific to the dismantling liability. The unwinding of the discount is expensed as incurred and recognized in the consolidated statement of income as an accretion under the “Interest expense and financing charges” account in the consolidated statement of income. The estimated future costs of dismantling are reviewed annually and adjusted, as appropriate. Changes in the estimated future costs or in the discount rate applied are added to or deducted from the cost of the asset.
Contingencies Contingent liabilities are not recognized in the consolidated financial statements but are disclosed in the notes to consolidated financial statements unless the possibility of an outflow of resources embodying economic benefits is remote. Contingent assets are not recognized but are disclosed in the notes to consolidated financial statements when an inflow of economic benefits is probable.
Retirement Benefits The Parent Company and certain of its subsidiaries have distinct, funded, noncontributory, defined benefit retirement plans. The plans cover all permanent employees, each administered by its respective retirement committee.
The cost of providing benefits under the defined benefit retirement plans is determined using the projected unit credit method. Under this method, the current service cost is the present value of retirement benefits obligation in the future with respect to services rendered in the current year.

- 19 -
*SGVMC311282*
Actuarial gains and losses arising from experience adjustments and changes in actuarial assumptions are credited to or charged against the consolidated statement of income when the net cumulative unrecognized actuarial gains and losses at the end of previous year exceeded 10% of the higher between the defined benefit obligation and the fair value of plan assets at that date. These gains or losses are recognized over the expected average remaining working lives of the employees participating in the plans.
Past service costs are recognized immediately as an expense in the consolidated statement of income, unless the changes to the retirement plans are conditional on the employees remaining in service for a specified period of time (the vesting period). In this case, the past service costs are amortized on a straight-line basis over the vesting period.
The defined benefit liability is the aggregate of the present value of the defined benefit obligation and actuarial gains and losses not recognized, reduced by past service costs not yet recognized and the fair value of plan assets on which the obligations are to be settled directly. The present value of the defined benefit obligation is determined by discounting the estimated future cash outflows using interest rate on government bonds that have terms that will approximate the terms of the related retirement obligation upon maturity. The value of any asset is restricted to the sum of any past service cost not yet recognized and the present value of any economic benefits available in the form of refunds from the plans or reductions in the future contributions to the plans. Share-based Payment Transactions Certain employees (including senior executives) of First Gen Group, FPHC and an associate of the Parent Company receive remuneration in the form of share-based payment transactions, whereby employees render services in exchange for shares or rights over shares (“equity-settled transactions”).
The cost of equity-settled transactions with employees is measured by reference to the fair value of the stock options at grant date. The fair value is determined using the Black-Scholes-Merton model, further details of which are provided in Note 20 to the consolidated financial statements. In valuing equity-settled transactions, no account is taken to any performance conditions, other than conditions linked to the price of the stocks of the Parent Company (“market conditions”), if applicable.
The cost of equity-settled transactions is recognized, together with a corresponding increase in equity, over the period in which the performance and/or service conditions are fulfilled, ending on the date on which the relevant employees become fully entitled to the award (the “vesting date”). The cumulative expense recognized for equity-settled transactions at each financial reporting date until the vesting date reflects the extent to which the vesting period has expired and the Parent Company’s best estimate of the number of equity instruments that will ultimately vest. The charge or credit for a year represents the movement in cumulative expense recognized as of the beginning and end of that year.
No expense is recognized for awards that do not ultimately vest, except for awards where vesting is conditional upon a market condition, which are treated as vesting irrespective of whether or not the market condition is satisfied, provided that all other performance conditions are satisfied.
Where the terms of an equity-settled award are modified, an expense, as a minimum, is recognized as if the terms had not been modified. An expense is recognized for any increase in the value of the transactions as a result of the modification, as measured on the date of modification.

- 20 -
*SGVMC311282*
Where an equity-settled award is cancelled, it is treated as if it had vested on the date of cancellation, and any expense not yet recognized for the award is recognized immediately. However, if a new award is substituted for the cancelled award, and designated as a replacement award on the date that it is granted, the cancelled and new awards are treated as if they were modifications of the original award, as described in the previous paragraph.
The dilutive effect of outstanding options is reflected as additional share dilution in the computation of earnings per share attributable to the equity holders of the Parent Company (see Note 26).
Income Tax Current income tax Current income tax assets and liabilities for the current and prior years are measured at the amount expected to be recovered from or paid to the tax authority. The tax rates and tax laws used to compute the amount are those that have been enacted or substantively enacted as at financial reporting date. Deferred income tax Deferred income tax is provided, using the balance sheet liability method, on all temporary differences at financial reporting date between the tax bases of assets and liabilities and their carrying amounts for financial reporting purposes. Deferred income tax liabilities are recognized for all taxable temporary differences. Deferred income tax assets are recognized for all deductible temporary differences, carryforward benefits of unused tax credits from the excess of minimum corporate income tax (MCIT) over the regular corporate income tax (RCIT) and unused net operating loss carryover (NOLCO), to the extent that it is probable that sufficient future taxable income will be available against which the deductible temporary differences and carryforward benefits of unused tax credits from MCIT and unused NOLCO can be utilized. Deferred income tax, however, is not recognized on temporary differences that arise from the initial recognition of an asset or liability in a transaction that is not a business combination and, at the time of the transaction, affects neither the accounting income nor taxable income. First Gen Group does not recognize deferred income tax assets and deferred income tax liabilities that will reverse during the income tax holiday (ITH) period.
The carrying amount of deferred income tax assets is reviewed at each financial reporting date and reduced to the extent that it is no longer probable that sufficient future taxable income will become available to allow all or part of the deferred income tax asset to be utilized. Unrecognized deferred income tax assets are reassessed at each financial reporting date and are recognized to the extent that it has become probable that sufficient future taxable income will allow the deferred income tax assets to be recovered.
Deferred income tax assets and liabilities are measured at the income tax rates that are applicable to the year when the asset is realized or the liability is settled, based on tax rates and tax laws that have been enacted or substantively enacted as at financial reporting date.
Deferred income tax liabilities are not provided on nontaxable temporary differences associated with investments in domestic subsidiaries and associates.
Current and deferred income tax relating to items recognized directly in equity is also recognized in the consolidated statement of changes in equity and not in the consolidated statement of income.

- 21 -
*SGVMC311282*
Deferred income tax assets and liabilities are offset, if a legally enforceable right exists to offset current income tax assets against current income tax liabilities and deferred income taxes relate to the same taxable entity and the same tax authority.
Leases The determination of whether an arrangement is, or contains a lease is based on the substance of the arrangement and requires an assessment of whether the fulfillment of the arrangement is dependent on the use of a specific asset or assets and the arrangement conveys a right to use the asset. A reassessment is made after inception of the lease only if one of the following applies:
a. there is a change in contractual terms, other than a renewal or extension of the arrangement; b. a renewal option is exercised or extension granted, unless that term of the renewal or
extension was initially included in the lease term; c. there is a change in the determination of whether fulfillment is dependent on a specified
asset; or d. there is a substantial change to the asset.
Where a reassessment is made, lease accounting will commence or cease from the date when the change in circumstances gave rise to the reassessment for scenarios a, c or d above, and at the date of renewal or extension period for scenario b.
Leases where the lessor retains substantially all the risks and benefits of ownership of the assets are classified as operating leases. Operating lease payments are recognized as expense in the consolidated statement of income on a straight-line basis over the lease terms.
Capital Stock, Stock Rights and Additional Paid-in Capital Capital stock is measured at par value and is classified as equity for all stocks issued. When First Gen Group issues more than one class of stock, a separate account is maintained for each class of stock and the number of stocks issued.
Stock rights that are given pro-rata to all of the existing owners of the same class of First Gen’s non-derivative equity instruments in order to acquire a fixed number of its own equity instruments for a fixed amount in any currency are classified as equity instrument.
When the stocks are sold at premium, the difference between the proceeds and the par value is credited to the “Additional paid-in capital” account. When stocks are issued for a consideration other than cash, the proceeds are measured by the fair value of the consideration received. In case the stocks are issued to extinguish or settle the liability of First Gen Group, the stocks shall be measured either at the fair value of the stocks issued or fair value of the liability settled, whichever is more reliably determinable.
Direct costs incurred related to the issuance of new capital stock, such as underwriting, accounting and legal fees, printing costs and taxes are shown in equity as deduction, net of tax, from the proceeds, when the stocks are sold at premium, otherwise such are expensed as incurred.
Deposits for Future Stock Subscriptions Deposits for future stock subscriptions represent the amount received that will be applied as payment in exchange for a fixed number of the Parent Company’s own equity instruments, and presented in the equity section of the consolidated statement of financial position.

- 22 -
*SGVMC311282*
Treasury Stocks Acquired treasury stocks are accounted for at weighted average cost and shown as a deduction in the equity section of the consolidated statement of financial position. No gain or loss is recognized in the consolidated statement of income on the purchase, sale, issue or cancellation of the Parent Company’s own equity instruments. Upon reissuance of treasury stocks, the “Cost of common stocks held in treasury” account is credited at cost. The excess of proceeds from reissuance over the cost of treasury stocks is credited to the “Additional paid-in capital” account. However, if the cost of treasury stocks exceeds the proceeds from reissuance, such excess is debited to the “Additional paid-in capital” account but only to the extent of previously set-up additional paid-in capital for the same class of stock. Otherwise, this is debited against the “Retained earnings” account.
Retained Earnings The amount included in retained earnings includes profit or loss attributable to First Gen Group’s equity holders and reduced by dividends on capital stock. Dividends on capital stock are recognized as a liability and deducted from equity when they are declared by the Parent Company’s BOD. Dividends for the year that are approved after the financial reporting date are dealt with as an event after the financial reporting date.
Retained earnings may also include the effect of changes in accounting policies as may be required by the standards’ transitional provisions.
Dividends on Preferred and Common Stocks First Gen Group may pay dividends in cash or by the issuance of shares of stock. Cash and property dividends are subject to the approval of the BOD, while stock dividends are subject to approval by the BOD, at least two-thirds of the outstanding capital stock of the shareholders at a shareholders’ meeting called for such purpose, and by the Philippine SEC. First Gen Group may declare dividends only out of its unrestricted retained earnings.
Cash and property dividends on preferred and common stocks are recognized as liability and deducted from equity when declared. Stock dividends are treated as transfers from retained earnings to additional paid-in capital.
Revenue Recognition Revenue is recognized when it is probable that the economic benefits associated with the transaction will flow to First Gen Group and the amount of the revenue can be measured reliably.
The following specific recognition criteria must also be met before revenue is recognized:
Revenue from sale of electricity Revenue from sale of electricity (in the case FGP and FGPC) is based on the respective PPAs of FGP and FGPC. The PPAs qualify as leases on the basis that FGP and FGPC sell all of its output to Meralco. This agreement calls for a take-or-pay arrangement where payment is made principally on the basis of the availability of the power plant and not on actual deliveries of electricity generated. This arrangement is determined to be operating leases where a significant portion of the risks and benefits of ownership of the assets are retained by FGP and FGPC.
Revenue from sale of electricity is composed of fixed capacity fees, fixed and variable operating and maintenance fees, fuel, wheeling and pipeline charges, and supplemental fees. The portion related to the fixed capacity fees is considered as operating lease component and the same fees are recognized on a straight-line basis, based on the actual Net Dependable Capacity (NDC) tested or

- 23 -
*SGVMC311282*
proven, over the terms of the respective PPAs. Variable operating and maintenance fees, fuel, wheeling and pipeline charges and supplemental fees are recognized monthly based on the actual energy delivered.
Interest income Interest income is recognized as interest accrues based on effective interest rate.
Equity in net earnings (losses) of associates First Gen Group recognizes its share in the net income (losses) of associates proportionate to the equity in the economic shares of such associate, in accordance with the equity method of accounting for investments. If an associate has outstanding cumulative preferred stocks that are held by parties other than the investor and classified as equity, First Gen Group computes its share in profits or losses after adjusting for the dividends on such shares, whether or not the dividends have been declared.
Expense Recognition Expenses are decreases in economic benefits during the accounting period in the form of outflows or decrease of assets or incurrence of liabilities that result in decreases in equity, other than those relating to distributions to equity participants, and are recognized when these are incurred.
Borrowing Costs Borrowing costs are capitalized if they are directly attributable to the acquisition, construction or production of qualifying assets until such time that the assets are substantially ready for their intended use or sale, which necessarily takes a substantial period of time. Capitalization of borrowing costs commences when the activities to prepare the asset are in progress and expenditures and borrowing costs are being incurred. Borrowing costs are capitalized until the asset is substantially ready for its intended use. If the resulting carrying amount of the asset exceeds its recoverable amount, an impairment loss is recognized in the consolidated statement of income. All other borrowing costs are expensed in the year they occur.
Foreign Currency Transactions The consolidated financial statements are presented in U.S. dollar, which is the Parent Company’s functional and presentation currency. Each entity in First Gen Group determines its own functional currency and items included in the financial statements of each entity are measured using that functional currency. Transactions in foreign currencies are initially recorded using the weighted average functional currency rate prevailing at transaction date. Monetary assets and liabilities denominated in foreign currencies are restated using the functional currency rate of exchange at financial reporting date. All differences are taken to the consolidated statement of income. Nonmonetary items that are measured at historical cost in a foreign currency are translated using the exchange rates as at the dates of the transaction. Nonmonetary items measured at fair value in a foreign currency are translated using the weighted average exchange rates as at the date when the fair value was determined.
The functional currency of all the subsidiaries, except Unified, FGP, FGHC and FGPC, is the Philippine peso. As at financial reporting date, the assets and liabilities of these subsidiaries are translated into the presentation currency of the Parent Company (the U.S. dollar) at the closing rate of exchange ruling at financial reporting date and, their statements of income are translated at the monthly weighted average exchange rates for the year. The exchange differences arising on the translation are taken to other comprehensive income (loss) as a separate component of equity as part of the “Cumulative translation adjustments” account. Upon disposal of any of these subsidiaries, the deferred cumulative amount recognized in equity relating to that particular subsidiary will be recognized in the consolidated statement of income proportionate to the equity interest disposed.

- 24 -
*SGVMC311282*
Earnings Per Share (EPS) Attributable to the Equity Holders of the Parent Basic EPS is computed by dividing net income (less cumulative preferred dividends, if any, whether declared or not) for the year attributable to common shareholders by the weighted average number of common stocks outstanding during the year, with retroactive adjustments for any stock dividends declared and stock split.
Diluted EPS is calculated in the same manner, adjusted for the effects of: (a) conversion of convertible bonds; and (b) stocks to be issued to executives (officers and senior managers) and employees under the Parent Company’s Executive Stock Option Plan (ESOP) and Employee Stock Purchase Plan (ESPP), respectively, which are assumed to be exercised at the date of grant.
Where the EPS effect of the stocks to be issued to executives and employees under the Parent Company’s ESOP and ESPP, and the possible conversion of convertible bonds would be anti-dilutive, the basic and diluted EPS are stated at the same amount.
Segment Reporting For purposes of management reporting, First Gen Group’s operating businesses are organized and managed separately on a per company basis, with each company representing a strategic business segment. First Gen’s identified operating segments, which are consistent with the segments reported to the BOD which is First Gen’s Chief Operating Decision Maker (CODM). Financial information on the operating segment is presented in Note 5.
Events After the Financial Reporting Date Any event after the financial reporting date that provides additional information about First Gen Group’s position at financial reporting date (adjusting event) is reflected in the consolidated financial statements. Events after financial reporting date that are not adjusting events, if any, are disclosed, in the notes to consolidated financial statements, when material.
Future Changes in Accounting Policies First Gen Group will adopt the following standards and interpretations, when these become effective, and as these are applicable. Except as otherwise indicated, First Gen Group does not expect the adoption of these revised and amended PFRS and Philippine Interpretations to have significant impact on its consolidated financial statements. Effective in 2011 § Amendment to Philippine Interpretation IFRIC 14, Prepayments of a Minimum Funding
Requirement, applies in the limited circumstances when an entity is subject to minimum funding requirements and makes an early payment of contributions to cover those requirements. The amendment permits such an entity to treat the benefit of such an early payment as an asset.
§ Philippine Interpretation IFRIC 19, Extinguishing Financial Liabilities with Equity Instruments, provides guidance on how to account for the extinguishment of a financial liability by the issue of equity instruments. These transactions are often referred to as debt for equity swaps.
§ Revised PAS 24, Related Party Disclosures, was revised in response to concerns that the previous disclosure requirements and the definition of a “related party” were too complex and difficult to apply in practice, especially in environments where government control is pervasive. The revised standard addresses these concerns by providing a partial exemption for government-related entities and by simplifying the definition of a related party and removing inconsistencies.

- 25 -
*SGVMC311282*
Improvements to PFRS The omnibus amendments to PFRS issued in May 2010 were issued primarily with a view to remove inconsistencies and to clarify wording. The amendments are effective for annual periods beginning January 1, 2011, except as otherwise stated. First Gen Group has not yet adopted the following amendments and anticipates that these changes will have no material effects on the financial statements. § PFRS 3, Business Combinations (Revised) § PFRS 7, Financial Instruments: Disclosures § PAS 1, Presentation of Financial Statements § PAS 27, Consolidated and Separate Financial Statements § Philippine Interpretation IFRIC 13, Customer Loyalty Programmes
Effective in 2012
§ Philippine Interpretation IFRIC 15, Agreements for the Construction of Real Estate, covers accounting for revenue and associated expenses by entities that undertake the construction of real estate directly or through subcontractors. This interpretation requires that revenue on construction of real estate be recognized only upon completion, except when such contract qualifies as construction contract to be accounted for under PAS 11, Construction Contracts, or involves rendering of services in which case revenue is recognized based on stage of completion. Contracts involving provision of services with the construction materials and where the risks and reward of ownership are transferred to the buyer on a continuous basis, will also be accounted for based on stage of completion.
§ Amendments to PFRS 7, Financial Instruments - Disclosures - Transfers of Financial Assets, allows users of financial statements to improve their understanding of transfer transactions of financial assets (for example, securitizations), including understanding the possible effects of any risks that may remain with the entity that transferred the assets. The amendments also require additional disclosures if a disproportionate amount of transfer transactions are undertaken around the end of a reporting period.
§ Amendments to PAS 12, Income Taxes - Deferred Tax: Recovery of Underlying Assets,
provides a practical solution to the problem of assessing whether recovery of an asset will be through use or sale. It introduces a presumption that recovery of the carrying amount of an asset will, normally, be through sale.
Effe ctive in 2013
§ PFRS 9, Financial Instruments, reflects the first phase of the work on the replacement of PAS 39. In subsequent phases, hedge accounting and derecognition will be addressed. The completion of this project is expected early 2011. The adoption of the first phase of PFRS 9 will have an effect on the classification and measurement of First Gen Group’s financial assets. First Gen Group will quantify the effect in conjunction with the other phases, when issued, to present a comprehensive picture.
3. Significant Accounting Judgments and Estimates
The preparation of the consolidated financial statements in accordance with PFRS requires First Gen Group to make judgments and estimates that affect the reported amounts of assets, liabilities, income and expenses and disclosure of contingent assets and contingent liabilities. However, future events may occur which will cause the assumptions used in arriving at the estimates to

- 26 -
*SGVMC311282*
change. The effects of any change in estimates are reflected in the consolidated financial statements as they become reasonably determinable.
Judgments and estimates are continually evaluated and are based on historical experience and other factors, including expectations of future events that are believed to be reasonable under the circumstances.
In the process of applying First Gen Group’s accounting policies, management has made the following judgments and estimates which have the most significant effect on the amounts recognized in the consolidated financial statements:
Judgments a. Determining functional currency
The Parent Company, Unified, FGP, FGPC, FGHC and an associate, FPPC and its subsidiary, BPPC, have determined that their functional currency is the U.S. dollar. The U.S. dollar is the currency of the primary economic environment in which the Parent Company and foregoing subsidiaries and associate operate. It is the currency that mainly influences the sale of services and the costs of providing services. All other subsidiaries have determined the Philippine peso to be their functional currency. Thus, the accounts of such subsidiaries were translated to U.S. dollar for the purposes of consolidation to First Gen Group.
b. Operating leases The respective PPAs of FGP and FGPC qualify as leases on the basis that FGP and FGPC sell all of their output to Meralco and these agreements call for a take-or-pay arrangement where payment is made principally on the basis of the availability of the power plants and not on actual deliveries of electricity generated. These arrangements are determined to be operating leases where a significant portion of the risks and benefits of ownership of the assets are retained by FGP and FGPC. Accordingly, the power plant assets are recorded as part of the cost of property, plant and equipment and the fixed capacity fees billed to Meralco are recorded as operating revenue on a straight-line basis over the applicable terms of the PPAs.
c. Classification of financial instruments First Gen Group exercises judgment in classifying a financial instrument, or its component parts, on initial recognition as either a financial asset, a financial liability or an equity instrument in accordance with the substance of the contractual arrangement and the definition of a financial asset, a financial liability or an equity instrument. The substance of a financial instrument, rather than its legal form, governs its classification in the consolidated statement of financial position.
d. Discontinued operations A discontinued operation is a component of First Gen Group’s business that represents a separate major line of business or geographical area of operations that has been disposed of or is held for sale, or is a subsidiary acquired exclusively with a view to resale. Classification as a discontinued operation occurs upon disposal or when the operation meets the criteria to be classified as held for sale. When an operation is classified as a discontinued operation, the comparative consolidated statements of income and consolidated statements of cash flows are restated, as if the operation had been discontinued from the start of the comparative periods, so as to provide some form of comparability with the new presentation.
On May 12, 2009, the BOD of Prime Terracota approved and issued voting preferred stocks to QRC and LIRF. Due to the said equity transaction, First Gen is deemed to have lost control over Prime Terracota since First Gen’s voting interest in Prime Terracota has been reduced to

- 27 -
*SGVMC311282*
approximately 45% and has lost control over the BOD of Prime Terracota. In addition, the loss of control is treated as a deemed sale transaction in accordance with the Amended PFRS 5 (see Note 4).
Estimates a. Impairment losses on receivables
First Gen Group reviews its receivables at each financial reporting date to assess whether an allowance for impairment should be recognized in the consolidated statement of income. In particular, judgment by management is required in the estimation of the amount and timing of future cash flows when determining the level of allowance required. Such estimates are based on assumptions on a number of factors and actual results may differ, resulting in future changes to the allowance.
First Gen Group maintains an allowance for impairment losses at a level that management considers adequate to provide for potential uncollectability of its trade and other receivables, certain advances and its receivables arising from service concession arrangements. First Gen Group evaluates specific balances where management has information that certain amounts may not be collectible. In these cases, First Gen Group uses judgment, based on available facts and circumstances, and on a review of the factors that affect the collectability of the accounts including, but not limited to, the age and status of the receivables, collection experience, past loss experience and, in the case of receivables arising from service concession arrangements, the expected net cash inflows from the concession. The review is made by management on a continuing basis to identify accounts to be provided with allowance. These specific reserves are re-evaluated and adjusted as additional information received affects the amount estimated.
In addition to specific allowance against individually significant receivables, First Gen Group also makes a collective impairment allowance against exposures which, although not specifically identified as requiring a specific allowance, have a greater risk of default than when originally granted. Collective assessment of impairment is made on a portfolio or group basis after performing a regular review of age and status of the portfolio or group of accounts relative to historical collections, changes in payment terms, and other factors that may affect ability to collect payments.
No impairment loss was recognized for each of the three years in the period ended December 31, 2010. Receivables and advances to non-controlling shareholder, aggregately, are carried at $184.7 million and $221.1 million as of December 31, 2010 and 2009, respectively (see Notes 7, 9 and 13).
b. Impairment of AFS financial assets First Gen Group considers AFS financial assets as impaired when there has been a significant or prolonged decline in the fair value of such investments below their cost or where other objective evidence of impairment exists. The determination of what is “significant” or “prolonged” requires judgment. First Gen Group treats “significant” generally as 20% or more and “prolonged” as greater than twelve months. In addition, First Gen Group evaluates other factors, including normal volatility in stock price for quoted equities and future cash flows and discount factors for unquoted equities in determining the amount to be impaired.
No impairment loss on AFS financial assets was recognized for each of the three years in the period ended December 31, 2010. AFS financial assets are carried at $0.7 million and $0.5 million as of December 31, 2010 and 2009, respectively (see Note 13).

- 28 -
*SGVMC311282*
c. Recognition of deferred income tax assets The carrying amounts of deferred income tax assets at each financial reporting date are reviewed and are reduced to the extent that there is no longer sufficient future taxable income available to allow all or part of the deferred income tax assets to be utilized. First Gen Group’s assessment on the recognition of deferred income tax assets on deductible temporary differences, carryforward benefits of MCIT and NOLCO is based on the forecasted taxable income of the following reporting year. This forecast is based on First Gen Group’s past results and future expectations on revenue and expenses. As of December 31, 2010 and 2009, the amount of deferred income tax assets recognized in the consolidated statements of financial position amounted to $16.0 million and $11.8 million, respectively. First Gen Group also has deductible temporary differences, carryforward benefit of unused NOLCO and excess MCIT totaling $193.3 million and $227.4 million as of December 31, 2010 and 2009, respectively, for which no deferred income tax asset was recognized (see Note 25).
d. Present value of defined benefit obligation The cost of defined benefit retirement plans is determined using the projected unit credit method of actuarial valuation. An actuarial valuation involves making assumptions. These include the determination of the discount rates, expected rates of return on assets, future salary increases and medical trend rates. In accordance with PAS 19, past service costs, experience adjustments and effects of changes in actuarial assumptions are deemed to be amortized over the average remaining working lives of employees. While the assumptions are reasonable and appropriate, significant differences in First Gen Group’s actual experience or significant changes in the assumptions may materially affect the retirement benefit obligation. Due to the long-term nature of these plans, such estimates are subject to significant uncertainty.
The expected rate of return on plan assets was based on the average historical premium of the fund assets. The assumed discount rates were determined using the market yields on Philippine government bonds with terms consistent with the expected employee benefit payout as at financial reporting date. The details of assumptions used in the calculation of First Gen Group’s retirement benefits are presented in Note 24.
As of December 31, 2010 and 2009, the present value of defined benefit obligation of First Gen Group amounted to $9.7 million and $4.7 million, respectively (see Note 24). Unrecognized cumulative actuarial gains as of December 31, 2010 and unrecognized cumulative actuarial losses as of December 31, 2009 amounted to $0.3 million and $2.6 million, respectively (see Note 24).
e. Impairment of non-financial assets Property, plant and equipment, intangible assets, prepaid gas and prepaid major spare parts
First Gen Group assesses impairment on these non-financial assets whenever events or changes in circumstances indicate that the carrying amount of an asset may not be recoverable. The factors that First Gen Group considers important which could trigger an impairment review include the following:
§ significant under-performance relative to expected historical or projected future operating results;
§ significant changes in the manner of use of the acquired assets or the strategy for overall business; and
§ significant negative industry or economic trends.

- 29 -
*SGVMC311282*
First Gen Group recognizes an impairment loss whenever the carrying amount of an asset exceeds its recoverable amount. The recoverable amount is computed using the value in use approach. Recoverable amount is estimated for an individual asset or, if it is not possible, for the cash-generating unit to which the asset belongs.
No impairment loss was recognized in the consolidated statements of income for each of the three years in the period ended December 31, 2010. The aggregate carrying values of the non-financial assets subjected to impairment testing amounted to $647.2 million and $686.4 million as of December 31, 2010 and 2009, respectively (see Notes 11, 12 and 13).
Goodwill First Gen Group performs impairment review on goodwill, annually or more frequently, if events or changes in circumstances indicate that the carrying value may be impaired. This requires an estimation of the value in use of the cash-generating units to which goodwill is allocated. Estimating the value in use requires First Gen Group to make an estimate of the expected future cash flows from the cash-generating units and discounts such cash flows using weighted average cost of capital to calculate the present value of those future cash flows (see Note 12).
No impairment loss on goodwill was recognized in the consolidated statements of income for each of the three years in the period ended December 31, 2010. The carrying values of goodwill as of December 31, 2010 and 2009 amounted to $9.1 million (see Notes 4 and 12).
Investments in associates Impairment review of investment in associates is performed when events or changes in circumstances indicate that the carrying value exceeds its fair value. Management has determined that there are no events or changes in circumstances for each of the three years in the period ended December 31, 2010 that may indicate that the carrying value of investments in associates may not be recoverable. The carrying values of First Gen Group’s investments in associates amounted to $1,207.5 million and $1,020.7 million as of December 31, 2010 and 2009, respectively (see Notes 4 and 10).
f. Estimation of useful lives of property, plant and equipment and intangible assets First Gen Group estimated the useful lives of property, plant and equipment and intangible assets based on the years over which the assets are expected to be available for use and on the collective assessment of industry practices, internal technical evaluation and experience with similar assets. The estimated useful lives of property, plant and equipment and intangible assets are reviewed at each financial reporting date and updated, if expectations differ from previous estimates due to physical wear and tear, technical or commercial obsolescence and legal or other limits in the use of these assets. However, it is possible that future financial performance could be materially affected by changes in the estimates brought about by changes in the factors mentioned above. The amounts and timing of recording the depreciation and amortization of property, plant and equipment and intangible assets for any year would be affected by changes in these factors and circumstances. A reduction in the estimated useful lives of the property, plant and equipment and intangible assets would increase the recorded depreciation and amortization and decrease the noncurrent assets.
There is no change in the estimated useful lives of property, plant and equipment and intangible assets during the year. The aggregate carrying values of property, plant and equipment as of December 31, 2010 and 2009 amounted to $580.7 million and $562.2 million, respectively (see Note 11). The carrying values of intangible assets as of December 31, 2010 and 2009 amounted to $8.3 million and $8.9 million, respectively (see Note 12).

- 30 -
*SGVMC311282*
g. Estimation of asset retirement obligations Under their respective Environmental Compliance Certificate (ECC) issued by the Department of Environmental and Natural Resources (DENR), FGP and FGPC have legal obligations to dismantle their power plant assets at the end of their useful lives. FG Bukidnon, on the other hand, has a contractual obligation under the lease agreement with PSALM to dismantle its power plant assets at the end of the useful lives. The asset retirement obligations recognized represent the best estimate of the expenditures required to dismantle the power plants at the end of their useful lives. Such cost estimates are discounted using a pre-tax rate that reflects the current market assessment of the time value of money and the risks specific to the liability. Each year, the asset retirement obligations are increased to reflect the accretion of discount and to accrue an estimate for the effects of inflation, with the charges being recognized under the “Interest expense and financing charges” account in the consolidated statement of income. While it is believed that the assumptions used in the estimation of such costs are reasonable, significant changes in these assumptions may materially affect the recorded expense or obligations in future years.
Asset retirement obligations amounted to $1.1 million and $1.0 million as of December 31, 2010 and 2009, respectively (see Note 18).
h. Fair values of financial instruments First Gen Group carries certain financial assets and liabilities at fair value, which requires extensive use of accounting estimates and judgment. While significant components of fair value measurement were determined using verifiable objective evidence (i.e., foreign exchange rates, interest rates, volatility rates), the amount of changes in fair value would differ if First Gen Group utilized different valuation methodologies and assumptions. Any changes in fair value of these financial assets and liabilities would affect the consolidated statement of income and equity.
Where the fair values of certain financial assets and financial liabilities recorded in the consolidated statement of financial position cannot be derived from active markets, they are determined using internal valuation techniques using generally accepted market valuation models. The inputs to these models are taken from observable markets where possible, but where this is not feasible, estimates are used in establishing fair values. Judgments include considerations of liquidity and model inputs such as correlation and volatility for longer dated derivatives.
The fair values of First Gen Group’s financial instruments are presented in Note 28 to the consolidated financial statements.
i. Legal contingencies and regulatory assessments First Gen Group is involved in various legal proceedings and regulatory assessments as discussed in Note 29 to the consolidated financial statements. First Gen Group’s estimate of probable costs for the assessments and resolution of these claims and cases have been developed in consultation with external counsels handling the defense in these claims and cases and is based upon thorough analysis of potential results.
First Gen Group, in consultation with its external counsels, does not believe that these proceedings will have a material adverse effect on the consolidated financial statements. It is possible, however, that future financial performance could be materially affected by changes in the estimates or the effectiveness of management’s strategies relating to these proceedings.

- 31 -
*SGVMC311282*
4. Discontinued Operations
On May 12, 2009, the BOD of Prime Terracota approved and issued 16,000,000 Class “B” preferred stocks with a par value of one peso (P=1.00) per share to QRC and 44,000,000 Class “B” preferred stocks with a par value of one peso (P=1.00) per share to LIRF, which stocks shall be entitled to cumulative dividends of P=0.10 per share per annum, payable at the end of each quarter from the time of their issuance or at such times as may be determined by the BOD of Prime Terracota, subject to the availability of unrestricted retained earnings.
Based on the above transactions, First Gen is deemed to have lost control over Prime Terracota since First Gen’s voting interest in Prime Terracota has been reduced to approximately 45% and has lost control over the BOD of Prime Terracota. In addition, the loss of control is treated as a deemed sale transaction in accordance with the Amended PFRS 5.
The results of operations of Prime Terracota and subsidiaries (major subsidiaries include Red Vulcan and EDC) for the four-month period ended April 30, 2009 and for the year ended December 31, 2008 are summarized below.
2009
(Four Months) 2008
(One Year) Revenue $163,721 $525,059 Costs and expenses:
Power plant operations and maintenance (56,246) (77,792) Depreciation and amortization (10,731) (37,881) Staff costs (17,689) (55,529) Other administrative expenses (14,035) (62,203) Interest expense and financing charges (26,173) (82,270) Foreign exchange gains (losses) - net 27,815 (185,092) Mark-to-market gains (losses) on derivatives (5,162) 18,411
Income before income tax 61,500 42,703 Provision for income tax (19,539) (23,466) Net income from discontinued operations $41,961 $19,237 Attributable to: Equity holders of the Parent Company $12,474 ($14,114) Non-controlling interests 29,487 33,351 $41,961 $19,237
The net cash provided by Prime Terracota and its subsidiaries for the four-month period ended April 30, 2009 and for the year ended December 31, 2008 are as follows:
2009
(Four Months) 2008
(One Year) Net cash provided by operating activities $158,029 $320,084 Net cash provided by (used in) investing activities (80,921) 62,535 Net cash provided by (used in) financing activities 67,542 (442,655) EFFECT OF FOREIGN EXCHANGE RATE CHANGES
ON CASH AND CASH EQUIVALENTS 20 517 NET INCREASE (DECREASE) IN CASH AND
CASH EQUIVALENTS 144,670 (59,519) CASH AND CASH EQUIVALENTS AT BEGINNING
OF PERIOD 20,147 79,666 CASH AND CASH EQUIVALENTS
AT END OF PERIOD $164,817 $20,147

- 32 -
*SGVMC311282*
5. Operating Segment Information Operating segments are components of First Gen Group that engage in business activities from which they may earn revenues and incur expenses, whose operating results are regularly reviewed by First Gen Group’s CODM to make decisions about how resources are to be allocated to the segment and assess their performances, and for which discrete financial information is available. For purposes of management reporting, First Gen Group’s operating businesses are organized and managed separately on a per company basis, with each company representing a strategic business segment. First Gen’s identified operating segments, which are consistent with the segments reported to the BOD, which is the CODM of First Gen, are as follows: • FGPC, which operates the 1,000 MW combined cycle, natural gas-fired Santa Rita power
plant, and where the Parent Company has a 60% equity interest through FGHC; • FGP, which operates the 500 MW combined cycle, natural gas-fired San Lorenzo power plant,
and where the Parent Company has a 60% equity interest through Unified; • EDC, which operates 12 geothermal steamfields in the 5 geothermal renewable service
contract areas. The Parent Company has 3.08% direct economic interest and 40% indirect economic interest (through Prime Terracota) in EDC. The Parent Company has 45% voting interest in Prime Terracota, which in turn, has 60% voting interest in EDC through Red Vulcan; and,
• FG Hydro, which operates the newly upgraded and rehabilitated 132 MW PAHEP/MAHEP, and where the Parent Company has a 40% direct economic interest.
Management monitors the operating results of its business units separately for the purpose of making decisions about resource allocation and performance assessment. Segment revenue and segment expenses are measured in accordance with PFRS. The classification of segment revenue is consistent with the consolidated statements of income. Segment expenses pertain to the costs and expenses presented in the consolidated statements of income excluding interest expense and financing charges, depreciation and amortization expense and income taxes which are managed on a per company basis.
First Gen has only one geographical segment as all of its assets are located in the Philippines. First Gen Group operates and derives principally all of its revenue from domestic operations. Thus, geographical business information is not required.
Revenue is recognized to the extent that it is probable that economic benefits will flow to First Gen Group and that the revenue can be reliably measured. Substantially all of the segment revenues of FGP and FGPC are derived from Meralco, the sole customer of FGP and FGPC; while 69.4% of EDC’s segment revenues are derived from NPC.
Financial information on the business segments are summarized as follows: Year Ended December 31, 2010
FGPC FGP EDC FG Hydro Others Discontinued Operations
Eliminating Entries1 Total
Segment revenue $782,035 $401,249 $536,013 $49,883 $144,792 $– ($669,694) $1,244,278 Segment expenses (592,573) (309,117) (289,767) (16,613) (140,767) – 426,577 (922,260) Segment results 189,462 92,132 246,246 33,270 4,025 – (243,117) 322,018 Interest expense and
financing charges (46,328) (9,013) (58,817) (9,796) (75,280) – 95,012 (104,222) Depreciation and
amortization (35,335) (19,285) (14,305) (8,428) (13,221) – 35,604 (54,970) Income before income tax 107,799 63,834 173,124 15,046 (84,476) – (112,501) 162,826 Provision for income tax (29,825) (11,684) (29,559) 367 785 – 28,090 (41,826) Net income (loss) $77,974 $52,150 $143,565 $15,413 ($83,691) $– ($84,411) $121,000
1Pertains to revenue and expenses of Prime Terracota, Red Vulcan, EDC and FG Hydro for the year ended December 31, 2010.

- 33 -
*SGVMC311282*
Year Ended December 31, 2009
FGPC FGP EDC FG Hydro Others Discontinued
Operations1 Eliminating
Entries2 Total Segment revenue $689,685 $335,200 $468,514 $28,492 $37,476 ($191,536) ($345,715) $1,022,116 Segment expenses (507,803) (240,407) (250,541) (6,715) (37,196) 93,132 184,592 (764,938) Segment results 181,882 94,793 217,973 21,777 280 (98,404) (161,123) 257,178 Interest expense and financing
charges (49,861) (11,815) (50,429) (7,326) (87,978) 26,173 69,147 (112,089) Depreciation and amortization (33,531) (20,043) (23,638) (11,949) (358) 10,731 24,856 (53,932) Income from continuing
operations before income tax 98,490 62,935 143,906 2,502 (88,056) (61,500) (67,120) 91,157
Net income from discontinued operations – – – – – 41,961 – 41,961
Provision for income tax (27,297) (10,684) (67,955) (136) (782) 19,539 49,204 (38,111) Net income (loss) $71,193 $52,251 $75,951 $2,366 ($88,838) $– ($17,916) $95,007
1Pertains to revenue and expenses of Prime Terracota, Red Vulcan, EDC and FG Hydro for the four-month period ended April 30, 2009. 2Pertains to revenue and expenses of Prime Terracota, Red Vulcan, EDC and FG Hydro for the period May 1, 2009 to December 31, 2009.
Year Ended December 31, 2008
FGPC FGP EDC FG Hydro Others Discontinued
Operations1 Eliminating
Entries Total Segment revenue $811,156 $409,955 $510,946 $32,524 $41,287 ($543,470) $– $1,262,398 Segment expenses (633,283) (309,291) (363,515) (16,074) (21,256) 380,615 – (962,804) Segment results 177,873 100,664 147,431 16,450 20,031 (162,855) – 299,594 Interest expense and
financing charges (44,009) (15,506) (37,970) (8,088) (98,114) 82,270 – (121,417) Depreciation and amortization (33,591) (20,018) (31,220) (6,661) (418) 37,882 – (54,026) Income from continuing
operations before income tax 100,273 65,140 78,241 1,701 (78,501) (42,703) – 124,151
Income from discontinued operations – – – – – 19,237 – 19,237
Provision for income tax (45,861) (3,871) (23,994) 527 (187) 23,466 – (49,920) Net income (loss) $54,412 $61,269 $54,247 $2,228 ($78,688) $– $– $93,468
1Pertains to revenue and expenses of Prime Terracota, Red Vulcan, EDC and FG Hydro for the year ended December 31, 2008. Other financial information of the business segments are as follows:
As of December 31, 2010
FGPC FGP EDC FG Hydro Others Discontinued
Operations1 Eliminating
Entries2 Total Current assets $204,014 $98,834 $466,062 $44,130 $206,318 ($510,192) ($131,277) $377,889 Noncurrent assets 608,802 266,670 1,436,217 161,361 1,333,371 (1,597,578) (245,339) 1,963,504 Total assets $812,816 $365,504 $1,902,279 $205,491 $1,539,689 ($2,107,770) ($376,616) $2,341,393 Current liabilities $100,603 $59,188 $161,702 $12,158 $501,493 ($173,860) ($277,663) $383,621 Noncurrent liabilities 510,221 101,370 853,213 103,854 198,212 (957,067) – 809,803 Total liabilities $610,824 $160,558 $1,014,915 $116,012 $699,705 ($1,130,927) ($277,663) $1,193,424
1Pertains to assets and liabilities of Prime Terracota, Red Vulcan, EDC and FG Hydro as of December 31, 2010. 2Pertains to intercompany assets and liabilities eliminated upon consolidation.
As of December 31, 2009
FGPC FGP EDC FG Hydro Others Discontinued
Operations1 Eliminating
Entries2 Total Current assets $182,064 $117,052 $438,498 $10,224 $184,797 ($448,722) ($137,398) $346,515 Noncurrent assets 658,197 265,299 1,112,140 151,388 1,412,792 (1,263,529) (521,779) 1,814,508 Total assets $840,261 $382,351 $1,550,638 $161,612 $1,597,589 ($1,712,251) ($659,177) $2,161,023 Current liabilities $93,121 $78,588 $397,596 $30,459 $402,643 ($428,054) ($291,787) $282,566 Noncurrent liabilities 551,552 129,363 479,608 46,736 390,506 (526,345) – 1,071,420 Total liabilities $644,673 $207,951 $877,204 $77,195 $793,149 ($954,399) ($291,787) $1,353,986
1Pertains to assets and liabilities of Prime Terracota, Red Vulcan, EDC and FG Hydro as of December 31, 2009. 2Pertains to intercompany assets and liabilities eliminated upon consolidation.

- 34 -
*SGVMC311282*
6. Cash and Cash Equivalents
This account consists of:
2010 2009 Cash on hand and in banks (see Note 16) $68,051 $25,098 Short-term deposits (see Note 16) 133,200 100,433 $201,251 $125,531
Cash in banks earn interest at the respective bank deposit rates ranging from 0.12% to 3.22% and 0.12% to 3.50% as of December 31, 2010 and 2009, respectively. Short-term deposits are made for varying periods of up to three months depending on the immediate cash requirements of First Gen Group, and earn interest at the respective short-term deposits rates. For the years ended December 31, 2010, 2009 and 2008, total interest income earned amounted to $2.9 million, $0.7 million and $5.2 million, respectively (see Note 22).
7. Receivables
This account consists of:
2010 2009 Trade [see Note 29(a)] $71,305 $89,486 Due from related parties (see Note 21) 14,917 20,151 Receivables from Meralco on Annual Deficiency
[(see Notes 17 and 29(f)] – 10,503 Others (see Note 21) 1,281 1,194 $87,503 $121,334
Trade receivables are noninterest-bearing and are generally on 30-day credit term, while other receivables are comprised mainly of receivables from employees, contractors and suppliers, which are collectible upon demand.
No allowance for impairment losses was recorded as of December 31, 2010 and 2009.
8. Inventories
This account consists of:
2010 2009 Fuel inventories $50,964 $65,028 Spare parts and supplies 49 44 $51,013 $65,072
Inventories as of December 31, 2010 and 2009 are carried at cost. The amounts of fuel inventories recognized as expense are $49.6 million in 2010, $22.5 million in 2009 and $12.4 million in 2008, which are recognized as part of the “Fuel cost” account in the consolidated statements of income.

- 35 -
*SGVMC311282*
9. Other Current Assets This account consists of:
2010 2009 Prepaid taxes $15,351 $15,779 Prepaid expenses 15,394 15,493 Current portion of advances to non-controlling
shareholder (see Notes 13, 16, 21, 27 and 28) 5,656 3,162 Current portion of option assets (see Notes 13 and 28) 1,566 – Others 155 144 $38,122 $34,578
Prepaid taxes consist mainly of tax credits that may be used by the operating subsidiaries of First Gen Group in the future.
Prepaid expenses consist mainly of prepaid insurance and creditable withholding tax certificates.
10. Investments in Associates
Investments in associates consist of:
2010 2009 Shares of stock - at equity Prime Terracota $193,299 $43,985 FG Hydro 20,717 19,929
BPPC/FPPC – 16,701 FGNEC – –
214,016 80,615 Deposits for future stock subscriptions 993,502 940,107 $1,207,518 $1,020,722
Further information relating to the investments in shares of stock are summarized below:
2010 2009 Acquisition costs: Balance at beginning of year $236,100 $19,962
Additional investment 50,240 – Return of investments (16,701) (3,261) Deconsolidation of discontinued operations (see Note 4) – 219,399 Balance at end of year 269,639 236,100 Accumulated equity in net earnings (losses): Balance at beginning of year (11,705) 996 Equity in net earnings for the year 47,729 1,167 Cash dividends (5,377) (5,691)
Deconsolidation of discontinued operations (see Note 4) – (8,177)
Balance at end of year 30,647 (11,705)
(Forward)
- 36 -
*SGVMC311282*
2010 2009 Equity reserve in Prime Terracota ($65,264) ($65,264) Share in other comprehensive income (losses)
of associates: Balance at beginning of year (78,516) – Share in other comprehensive income of associates for the year 57,510 64,273 Deconsolidation of discontinued operations
(see Note 4) – (142,789) Balance at end of year (21,006) (78,516)
$214,016 $80,615
Deposits for future stock subscriptions The deposits for future stock subscriptions amounting to $993.5 million and $940.1 million in 2010 and 2009, respectively, pertains to the deposits that were invested by the Parent Company in Prime Terracota. As disclosed in Note 4 to the consolidated financial statements (Discontinued Operations), the Parent Company’s investment in Prime Terracota, which includes the deposits for future stock subscription, was deconsolidated effective May 2009.
Movements of deposits for future stock subscriptions as of December 31, 2010 and 2009 are as follows:
2010 2009 Balance at beginning of year $940,107 $– Additions for the year 53,395 119,278 Deconsolidation of discontinued operations (see Note 4) –
820,829
Balance at end of year $993,502 $940,107
BPPC/FPPC On October 14, 2010, the BOD and stockholders of BPPC and FPPC approved a Plan of Merger where FPPC shall be merged into and be part of BPPC, and its separate corporate existence shall cease by operation of law. Subsequently, on December 13, 2010, the Philippine SEC approved the Certificate of Filing of the Articles and Plan of Merger. On December 15, 2010, the effective date of the Merger, FPPC transferred its assets and liabilities at their carrying values to BPPC.
Pursuant to the Articles of Merger, BPPC issued common stock to holders of FPPC common stock upon the surrender and cancellation of common stock of FPPC.
The merger was accounted for in accordance with the pooling of interest method where the identifiable assets acquired and liabilities assumed from FPPC are recognized at their carrying values and will be accounted for prospectively.
Prior to merger, proceeds from the return of the Parent Company’s investment in FPPC have exceeded the cost of the investment. Such excess totaling to $1.1 million is recorded under the “Others” account in the 2010 consolidated statement of income.
As of December 31, 2010, the investment in BPPC amounted to nil.

- 37 -
*SGVMC311282*
FGNEC On March 17, 2010, the Parent Company’s interest in FGNEC has been reduced from 100% to 33% and, thus, FGNEC started to be accounted for as an associate (see Note 2). The Parent Company’s share of losses in FGNEC for the period from March 17, 2010 to December 31, 2010 has exceeded the Parent Company’s cost of investment. As such, the investment in FGNEC amounted to nil as of December 31, 2010. Undistributed net earnings of associates As of December 31, 2010 and 2009, the undistributed net earnings of FG Hydro amounted to $6.2 million and $1.2 million, respectively. Such undistributed net earnings of FG Hydro, which were included in the retained earnings, are not currently available for dividend distribution unless declared by the investee.
Following are the consolidated financial information of First Gen Group’s associates as of December 31, 2010 and 2009:
As of December 31, 2010 For the year ended December 31, 2010
Current assets
Noncurrent assets
Current liabilities
Noncurrent liabilities Equity
Deposits for future stock
subscriptions Revenues
Net income
(loss) Prime Terracota* $367,508 $2,489,268 $116,072 $1,160,019 $1,580,685 $993,492 $689,827 $132,240 FG Hydro 44,130 161,361 12,158 103,855 89,478 10 47,888 15,413 BPPC 6,672 10 350 – 6,332 – 10,091 (199) FGNEC 10 – 399 – (389) – – (333)
As of December 31, 2009 For the year ended December 31, 2009
Current
assets Noncurrent
assets Current
liabilities Noncurrent
liabilities Equity
Deposits for future stock
subscriptions Revenues Net
income Prime Terracota* $440,865 $2,551,326 $460,909 $1,099,983 $1,431,299 $940,097 $524,746 $56,348 FG Hydro 8,135 156,705 40,762 41,322 82,756 10 28,491 2,365 FPPC 59,093 49,165 5,952 47,711 54,595 – 20,369 12,587
*Includes Red Vulcan and EDC and its subsidiaries
For the period May 1 through December 31, 2009, net loss attributable to equity holders of Prime Terracota and net loss of FG Hydro amounted to $2.1 million and $3.3 million, respectively.
11. Property, Plant and Equipment
Movements in the account are as follows:
2010
Land
Buildings and Other Structures
Machinery and
Equipment Transportation
Equipment
Furniture, Fixtures and
Office Equipment
Leasehold Improvements Total
Cost Balance at beginning of year $18,952 $385,318 $571,675 $2,176 $4,122 $959 $983,202 Additions – 49 18,658 564 158 9 19,438 Reclassification of prepaid major
spare parts (see Note 13) – – 53,333 – – – 53,333 Disposals – – – (246) (4) – (250) Foreign exchange adjustments 5 94 22 4 8 4 137 Balance at end of year 18,957 385,461 643,688 2,498 4,284 972 1,055,860
(Forward)

- 38 -
*SGVMC311282*
2010
Land
Buildings and Other Structures
Machinery and
Equipment Transportation
Equipment
Furniture, Fixtures and
Office Equipment
Leasehold Improvements Total
Accumulated Depreciation and Amortization
Balance at beginning of year $– $112,308 $302,828 $1,244 $3,645 $939 $420,964 Depreciation and amortization – 10,811 42,951 341 265 – 54,368 Disposals – – – (172) (4) – (176) Foreign exchange adjustments – 23 5 3 6 4 41 Balance at end of year – 123,142 345,784 1,416 3,912 943 475,197 Net Book Value $18,957 $262,319 $297,904 $1,082 $372 $29 $580,663
2009
Land
Buildings and Other Structures
Machinery and
Equipment Transportation
Equipment
Furniture, Fixtures and
Office Equipment
Leasehold Improvements
Surplus Assets
Available- for-Sale Total
Cost Balance at beginning of year $33,462 $423,314 $649,559 $2,695 $5,814 $957 $20 $1,115,821 Additions – 525 8,497 359 240 – – 9,621 Disposals – – – (240) (29) – – (269) Deconsolidation of
discontinued operations (see Note 4) (14,264) (37,944) (84,847) (628) (1,874) – (20) (139,577)
Foreign exchange adjustments (246) (577) (1,534) (10) (29) 2 – (2,394) Balance at end of year 18,952 385,318 571,675 2,176 4,122 959 – 983,202 Accumulated Depreciation
and Amortization Balance at beginning of year – 103,876 269,643 1,244 3,859 937 – 379,559 Depreciation and amortization – 11,166 43,515 386 455 – – 55,522 Disposals – – – (163) (29) – – (192) Deconsolidation of
discontinued operations (see Note 4) – (2,700) (10,165) (243) (632) – – (13,740)
Foreign exchange adjustments – (34) (165) 20 (8) 2 – (185) Balance at end of year – 112,308 302,828 1,244 3,645 939 – 420,964 Net Book Value $18,952 $273,010 $268,847 $932 $477 $20 $– $562,238
No borrowing costs were capitalized for the years ended December 31, 2010 and 2009.
Property, plant and equipment with net book values of $575.6 million and $557.3 million as of December 31, 2010 and 2009, respectively, have been pledged as security for long-term debt (see Note 16).
12. Goodwill and Intangible Assets
Movements in the account are as follows:
2010
Goodwill Pipeline
Rights Total Cost Balance at beginning and end of year $9,086 $13,253 $22,339 Accumulated Amortization Balance at beginning of year – 4,367 4,367 Amortization – 602 602 Balance at end of year – 4,969 4,969 $9,086 $8,284 $17,370

- 39 -
*SGVMC311282*
2009
Goodwill Pipeline
Rights
Concession Rights for Contracts Acquired
Concession Rights Water Rights Total
Cost Balance at beginning of year $962,854 $13,253 $175,437 $133,915 $50,606 $1,336,065 Additions – – – 5,930 – 5,930 Deconsolidation of
discontinued operations (see Note 4)
(1,002,659) – (172,425) (140,003) (49,737) (1,364,824) Foreign exchange adjustments 48,891 – (3,012) 158 (869) 45,168 Balance at end of year 9,086 13,253 – – – 22,339 Accumulated Amortization Balance at beginning of year – 3,765 22,364 3,983 4,302 34,414 Amortization – 602 6,651 1,218 670 9,141 Deconsolidation of
discontinued operations (see Note 4)
– – (28,559) (8,032) (4,891) (41,482) Foreign exchange adjustments – – (456) 2,831 (81) 2,294 Balance at end of year – 4,367 – – – 4,367 $9,086 $8,886 $– $– $– $17,972
The goodwill attributable to EDC and PAHEP/MAHEP cash generating units, water rights of FG Hydro and concession rights for contracts of EDC were deconsolidated as of April 30, 2009 (see Note 4).
Pipeline Rights Pipeline rights represent the construction cost of the natural gas pipeline facility connecting the natural gas supplier’s refinery to FGP’s power plant including incidental transfer costs incurred in connection with the transfer of ownership of the pipeline facility to the natural gas supplier. The cost of pipeline rights is amortized using the straight-line method over 22 years, which is the term of the Gas Sale and Purchase Agreements (GSPA). The remaining amortization period of pipeline rights is 13.75 years as of December 31, 2010.
Goodwill Effective May 1, 2009, the goodwill attributable to EDC and PAHEP/MAHEP cash generating units were deconsolidated from the consolidated statement of financial position of First Gen Group (see Note 4). As of December 31, 2010 and 2009, the outstanding balance of goodwill is attributable only to FGHC.
The recoverable amounts have been determined based on a value in use calculation using cash flow projections based on financial budgets approved by senior management covering a five-year period. The pre-tax discount rate applied in cash flow projections was 7.88% and the cash flows beyond the remaining term of the existing agreements are extrapolated using growth rates of 2.55% and 2.61% for the years ended December 31, 2010 and 2009, respectively, for FGPC.
Key assumptions with respect to the calculation of value in use of the cash-generating units as of December 31, 2010 and 2009 on which management had based its cash flow projections to undertake impairment testing of goodwill are as follows:
§ Budgeted Gross Margins The basis used to determine the value assigned to the budgeted gross margins is the average
gross margins achieved in the year immediately before the budgeted year, increased for expected efficiency improvements.

- 40 -
*SGVMC311282*
§ Bond Rates The average yield on a five-year government bond rate at beginning of budgeted year is
utilized is 2.067% in 2010 and ranging from 2.79% to 6.37% in 2009.
No impairment loss was recognized in the consolidated statements of income for each of the three years in the period ended December 31, 2010.
13. Other Noncurrent Assets
This account consists of:
2010 2009 Advances to non-controlling shareholder - net of
current portion (see Notes 9, 16, 21, 27 and 28) $91,586 $96,557 Prepaid major spare parts [see Note 29(i)] 30,154 66,667 Prepaid gas [see Notes 17 and 29(f)] 28,118 48,647 Option assets - net of current portion (see Notes 9
and 28) 2,623 – AFS financial assets 741 526 Retirement asset (see Note 24) 369 594 Others 568 575 $154,159 $213,566
In 2010, prepaid major spare parts amounting to $53.3 million were reclassified to the “Property, plant and equipment” account as a result of the scheduled major maintenance outage of the Santa Rita and San Lorenzo power plants. On April 19, 2010, the Parent Company entered into Call Option Agreements to purchase a total of 585.0 million EDC common shares for a period of three years or up to April 2013 with one third of the options expiring at the end of each year. The related call option is classified as derivative asset with mark-to-market (MTM) movements included in the 2010 consolidated statement of income (see Note 28).
In 2010, the Parent Company bought and disposed AFS financial assets classified as quoted equity securities. The change in fair value amounting to $1.4 million was recognized initially in the other comprehensive income (loss) and was taken into profit or loss for the year ended December 31, 2010. Total gain from sale recognized under the “Others” account in the 2010 consolidated statement of income amounted to $1.9 million.
As of December 31, 2010 and 2009, the AFS financial assets pertain to proprietary membership shares which are carried at cost since these are unquoted and there is no reliable basis for their fair values.
In 2009, the Parent Company’s investment in AFS financial assets composed of quoted government debt securities, quoted equity securities and unquoted equity securities of EDC were derecognized due to the deconsolidation of Prime Terracota Group (see Note 4).

- 41 -
*SGVMC311282*
14. Accounts Payable and Accrued Expenses
This account consists of:
2010 2009 Trade $59,672 $60,140 Accrued interest and financing costs 10,375 15,740 Output VAT 15,382 12,460 Deferred output VAT 7,806 10,878 Others 5,463 5,233 $98,698 $104,451
Trade payables are noninterest-bearing and are normally settled on 30 to 60-day payment terms.
15. Bonds Payable Details of bonds payable are as follows:
2010 2009 Convertible bonds $213,283 $277,353 Philippine peso-denominated bonds – 107,984 Total 213,283 385,337 Less current portion of:
Convertible bonds subsequently redeemed 83,134 – Convertible bonds not redeemed 130,149 – Philippine peso-denominated bonds – 107,984
213,283 107,984 Noncurrent portion $– $277,353
Convertible Bonds (CBs) On February 11, 2008 (the inception date), the Parent Company issued $260.0 million, U.S. Dollar-denominated CBs due on February 11, 2013 with a coupon rate of 2.50%. The CBs are listed on the Singapore Exchange Securities Trading Limited. The CBs are traded in a minimum board lot size of $0.5 million. The CBs constitute the direct, unsubordinated and unsecured obligations of the Parent Company, ranking pari passu in right of payment with all other unsecured and unsubordinated debt of the Parent Company.
The bonds include equity conversion option whereby each bond will be convertible, at the option of the holder, into fully-paid shares of common stock of the Parent Company. The initial conversion price was P=63.72 a share with a fixed exchange rate of US$1.00 to P=40.55, subject to adjustments under circumstances described in the Terms and Conditions of the CBs. The conversion price has since been adjusted to P=26.94 a share to consider the effect of the Rights Offering. The conversion right attached to the CBs may be exercised, at the option of the holder, at any time on and after March 22, 2008 up to 3:00 pm on January 31, 2013. The CBs and the stocks to be issued upon conversion of the CBs have not been and will not be registered under the U.S. Securities Act of 1933, as amended, and subject to certain exceptions, may not be offered or sold within U.S. In addition, such conversion right is subject to a cash settlement option whereby the Parent Company may elect to make a cash settlement payment in respect of all or any portion of a holder’s bonds deposited for conversion. The Parent Company also has a call option where it

- 42 -
*SGVMC311282*
may redeem the CBs on or after February 11, 2010, in whole but not in part, at the early redemption amount, if the closing price of the stocks for any 20 trading days out of the 30 consecutive trading days prior to the date upon which the notice of such redemption is given, was at least 130% of the conversion price in effect of such trading period, or at any time prior to maturity, in whole but not in part, at the early redemption amount, if less than 10% of the aggregate principal amount of the CBs originally issued are then outstanding. The Bondholders has a put option giving them right to require the Parent Company to redeem the CBs at the early redemption amount on February 11, 2011. The early redemption amount is determined so that it represents 7.25% gross yield to the Bondholder on a semi-annual basis. The equity conversion, call and put option features of the CB were identified as embedded derivatives and were separated from the host contract (see Note 28). As of December 31, 2010 and 2009, the Parent Company is in compliance with the bond covenants.
As of December 31, 2010, the Parent Company has bought back CBs with face value of $74.0 million for a total settlement amount of $83.2 million inclusive of a premium amounting to $9.2 million.
On February 11, 2011, the holders of the CBs amounting to $72.5 million exercised their put option to require the Parent Company to redeem all or some of the CBs, at a price of 115.6% of the face value. The total put value amounting to $83.8 million (with a face value of $72.5 million and carrying value of $83.1 million) was paid on February 11, 2011. After February 11, 2011, the unredeemed CBs with a face value of $113.5 million and carrying value of $130.1 million as of December 31, 2010 will now have a maturity date of February 11, 2013 and will be reclassified as part of noncurrent liabilities in 2011.
The aggregate fair value of the outstanding embedded derivatives is nil and $1.7 million as of December 31, 2010 and 2009, respectively (see Note 28). As of December 31, 2010 and 2009, the carrying amount of the host contract amounted to $213.3 million and $277.4 million, respectively. The movements in the account are as follows:
2010 2009 Balance at beginning of year $277,353 $258,440 Redemption of convertible bonds (82,990) – Accretion for the year charged to the “Interest
expense and financing charges” account (see Note 23) 18,920 18,913
Balance at end of year $213,283 $277,353
As of December 31, 2010 and 2009, movements of debt issuance costs pertaining to the CBs are as follows:
2010 2009 Balance at beginning of year $1,689 $2,963 Accretion for the year charged to the “Interest
expense and financing charges” account (see Note 23) (1,559) (1,274)
Balance at end of year $130 $1,689

- 43 -
*SGVMC311282*
Philippine peso-denominated Bonds On June 24, 2005, the Parent Company issued P=5.0 billion (equivalent amount in U.S. dollar of $92.6 million) Philippine peso-denominated Fixed-rate Bonds (Peso Bonds) due on July 30, 2010 with a coupon rate of 11.55%. The effective interest rate of the Peso Bonds is 12.03%. Interest is payable semi-annually. The Peso Bonds constitute the direct, unconditional, unsecured and general obligations of the Parent Company. The proceeds from the Peso Bonds were used for general corporate purposes, including working capital and investments. The Peso Bonds may be redeemed at the option of the Parent Company after three years from issue date or if payments under the Peso Bonds become subject to additional or increased taxes as a result of certain changes in law.
As set forth in the Trust Agreement in connection with the issuance of the Peso Bonds, the Parent Company is obligated to comply with certain covenants with respect to, among others: maintenance of specified debt-to-equity and minimum debt-service-coverage ratios; disposition of all or substantially all of its assets; maintenance of ownership/management control; encumbrances; and payment of taxes. In addition, the Parent Company is restricted to declare or pay dividends (other than stock dividend) during an Event of Default (as defined in the Trust Agreement) or if such payment would result in an Event of Default without the prior written consent of Bondholders representing at least 51% of the aggregate outstanding principal amount of the Peso Bonds. On July 30, 2010, the Parent Company fully paid the principal balance of the Peso Bonds payable, including accrued interest amounting to $11.8 million (P=543.7 million).
As of December 31, 2010 and 2009, the unamortized debt issuance costs incurred in connection with the issuance of the Peso Bonds amounted to nil and $0.2 million, respectively, and are deducted against the Peso Bonds payable.
Movements of debt issuance costs pertaining to the Peso Bonds are as follows:
2010 2009 Balance at beginning of year $241 $681 Accretion for the year charged to the “Interest
expense and financing charges” account (see Note 23) (243) (445)
Foreign exchange adjustments 2 5 Balance at end of year $– $241
16. Long-term Debt
This account consists of long-term debts of:
2010 2009 FGPC $475,163 $494,734 FGP 114,044 139,159 Unified 117,099 112,930 First Gen 82,874 – 789,180 746,823 Less current portion 59,678 46,499 Noncurrent portion $729,502 $700,324

- 44 -
*SGVMC311282*
FGPC and FGP Long-term debts of FGPC and FGP consist of U.S. dollar-denominated borrowings availed from various lenders to partly finance the construction and operations of their power plant complexes.
FGPC Outstanding Balance
Nature Repayment Schedule Facility Amount 2010 2009
Covered foreign currency-denominated loans payable to foreign financing institutions with annual interest at six months London Inter-Bank Offered Rate (LIBOR) plus 3.25% margin and political risk insurance premium
Repayment to be made in various semi-annual installments from 2009 up to 2021
$312,000 $288,334 $293,202
Uncovered foreign currency-denominated loans payable to foreign financing institutions with annual interest at six months LIBOR plus margin of 3.50% on the 1st to 5th year, 3.75% on the 6th to 7th year and 3.90% on the succeeding years
Repayment to be made in various semi-annual installments from 2009 up to 2018
188,000 167,753 173,206
KFW/HERMES foreign currency-denominated loans payable with a fixed interest rate of 7.20%
Back-ended and annuity style repayment to be made in various semi-annual installments from 2001 up to 2012
360,000 19,076 28,326
Total 475,163 494,734 Less current portion 31,909 19,571 Noncurrent portion $443,254 $475,163
On November 14, 2008 (the “Refinancing Date”), FGPC has entered into a Bank Facility Agreement covering a $544.0 million term loan facility with nine foreign banks namely: The Bank of Tokyo-Mitsubishi UFJ, Ltd., Calyon, KfW IPEX Bank GMBH, ING Bank N.V. (Singapore Branch), Bayerische Hypo-Und Vereinsbank AG (Hong Kong Branch), Malayan Banking Berhad, Standard Chartered Bank, Société Générale (Singapore Branch) and Kreditanstalt Für Wiederaufbau (KfW) to refinance the Santa Rita project. The term loan is broken down into three separate facilities namely: (i) a Covered Facility with political risk insurance amounting to $312.0 million with a tenor of 12.5 years, (ii) an Uncovered Facility amounting to $188.0 million with a ten-year tenor, and (iii) the existing $44.0 million term loan provided by KfW with a term until November 2012. A portion of the proceeds of the term loan was used to repay outstanding loans of FGPC amounting to $132.0 million and the remaining balance was upstreamed to FGPC’s shareholders as advances which are interest-bearing. Such advances are subject to interest rate of 175 basis points over the average of the rate for the six months U.S. dollar deposits quoted by three reputable reference banks in the Philippines, provided however, that such interest rate shall in no case exceed 5.8%. As of December 31, 2010 and 2009, total advances including accrued interest forwarded to the consolidated statements of financial position amounted to $97.2 million and $99.7 million, respectively, which are presented under the “Advances to non-controlling shareholder” account (see Notes 9 and 13).
With respect to the Covered Facility, the interest rate is computed semi-annually, every May and November, using LIBOR plus 325 basis points. This facility is covered by a Political Risk Insurance (PRI) and premiums payable on the PRI are in addition to the margins payable by FGPC. The Covered Facility will mature on May 10, 2021.

- 45 -
*SGVMC311282*
As to the Uncovered Facility, the interest rate is also computed semi-annually, every May and November, using LIBOR plus: (i) 3.50% per annum from the financial close until the 5th anniversary of the Refinancing Date, (ii) 3.75% per annum from the 6th until the 7th anniversary of the Refinancing Date, and (iii) 3.90% per annum from the 8th anniversary of the Refinancing Date until the final maturity date, which is on November 10, 2018.
On June 23, 2009, Bayerische Hypo-Und Vereinsbank AG (Hong Kong Branch) assigned all of its rights and obligations under the Common Terms Agreement (CTA) and the Bank Facility Agreement up to total amount of $10.0 million (which comprises $5.0 million principal amount of the Covered Facility and $5.0 million principal amount of the Uncovered loan facility) to GE Capital Corporation. However, the existing swap contract (see Note 28) with Bayerische Hypo-Und Vereinsbank AG (Hong Kong Branch) has not been assigned.
On May 27, 2010, Société Générale (Singapore Branch) assigned to Banco de Oro Unibank, Inc. (BDO Unibank) all of its rights and obligations under the CTA and the Bank Facility Agreement up to a total amount of $5.5 million under the Uncovered Loan Facility. The assignment excludes the existing swap contract with Société Générale (Singapore Branch).
FGP Outstanding Balance
Nature Repayment Schedule Facility Amount
2010 2009
HERMES Covered Facility Agreement with annual interest at commercial interest reference rate of 7.48%
Repayment to be made in 24 equal semi-annual installments from 2003 up to 2014
$133,297 $43,043 $53,467
Commercial Loan Credit Export Credit Guarantee Department (ECGD) Facility Agreement with interest at three months to six months LIBOR plus 2.15%
Repayment to be made in 24 equal semi-annual installments from 2003 up to 2014
115,000 37,744 47,032
GKA-Covered Facility Agreement with annual interest at six months LIBOR plus 1.4% with option to convert into fixed interest rate loan
Repayment to be made in 27 equal semi-annual installments from 2003 up to 2016
77,000 33,257 38,660
Total 114,044 139,159 Less current portion 25,327 25,115 Noncurrent portion $88,717 $114,044
As of December 31, 2010 and 2009, the unamortized debt issuance costs incurred in connection with FGPC’s and FGP’s long-term debts amounting to $14.9 million and $18.3 million, respectively, were deducted against the long-term debts.
Movements of debt issuance costs are as follows:
2010 2009 Balance at beginning of year $18,332 $22,068 Accretion for the year charged to the “Interest
expense and financing charges” account (see Note 23) (3,402) (3,736)
Balance at end of year $14,930 $18,332

- 46 -
*SGVMC311282*
The common terms related to the existing FGPC and FGP financing facility agreements (CTA) contain covenants concerning restrictions with respect to, among others: maintenance of specified debt service coverage ratio; acquisition or disposition of major assets; pledging present and future assets; change in ownership; any acts that would result in a material adverse effect on the operations of the power plants; and maintenance of good, legal and valid title to the site free from all liens and encumbrances other than permitted liens. As of December 31, 2010 and 2009, FGPC and FGP are in compliance with the terms of the said agreements.
FGPC and FGP also have entered into separate agreements in connection with their existing financing facilities as follows:
§ Mortgage, Assignment and Pledge Agreements whereby a first priority lien on most of FGPC’s and FGP’s real and other properties, including revenues from the operations of the power plants, have been executed in favor of the lenders. In addition, the shares of stock of FGPC and FGP were pledged as part of security to the lenders.
§ Inter-Creditor Agreements, which describe the administration of the loans.
§ Trust and Retention Agreement (TRA) with the lenders’ designated trustees. Pursuant to the terms and conditions of the TRA, FGPC and FGP have each established various security accounts with designated account banks, where inflows and outflows of proceeds from loans, equity contributions and project revenues are monitored. FGPC and FGP may withdraw or transfer moneys from these security accounts, subject to and in accordance with the terms and conditions of their respective TRAs.
The balance of FGPC’s and FGP’s unrestricted security accounts, included as part of the “Cash and cash equivalents” account in the consolidated statements of financial position as of December 31, 2010 and 2009, amounted to $115.0 million and $72.6 million, respectively (see Note 6).
Unified On March 9, 2009, Unified signed an agreement for a three-year Corporate Note Facility (Note Facility) of up to P=5.6 billion (Facility Amount) issued by a consortium of local banks, namely BDO Unibank, Philippine National Bank (PNB), Rizal Commercial Banking Corporation (RCBC), BDO Trust and Investment Group (BDO Trust) and Robinsons Savings Bank (RSB), collectively referred to as “Lenders”. The Note Facility was evidenced by a series of Notes, with a minimum principal amount of P=100.0 million, bearing an annual interest rate of 9.3769% and will mature on March 9, 2012. The proceeds of the loan were advanced to the Parent Company, which in turn retired its existing short-term loans. Such Notes were offered pursuant to an exempt transaction under Section 10.1 of the SRC and thus have not been registered with the Philippine SEC. Any future offer or sale of the Notes is subject to the registration requirements under the SRC, unless such offer or sale qualifies as an exempt transaction or the note qualifies as an exempt security.
Details of Unified’s long-term debt as of December 31, 2010 and 2009 are as follows:
2010 2009
Amount in Philippine
Peso
Equivalent Amount in U.S. Dollar
Amount in Philippine
Peso
Equivalent Amount in
U.S. Dollar PNB P=1,991,156 $45,419 P=2,042,741 $44,215 BDO 1,881,750 42,923 1,930,500 41,786
(Forward)

- 47 -
*SGVMC311282*
2010 2009
Amount in Philippine
Peso
Equivalent Amount in U.S. Dollar
Amount in Philippine
Peso
Equivalent Amount in
U.S. Dollar RCBC P=795,359 $18,143 P=815,964 $17,661 BDO Trust 337,750 7,704 346,500 7,500 RSB 193,000 4,402 198,000 4,286
5,199,015 118,591 5,333,705 115,448
Less debt issuance cost 65,404 1,492 116,331 2,518 Total 5,133,611 117,099 5,217,374 112,930 Less current portion 107,067 2,442 83,763 1,813 Noncurrent portion P=5,026,544 $114,657 P=5,133,611 $111,117
At inception, the Note Facility was recorded net of debt issuance costs amounting to $3.2 million (P=155.2 million). As of December 31, 2010 and 2009, the unamortized debt issuance costs incurred amounted to $1.5 million and $2.5 million, respectively, detailed as follows:
2010 2009
Amount in Philippine
Peso
Equivalent Amount in U.S. Dollar
Amount in Philippine
Peso
Equivalent Amount in
U.S. Dollar Debt issuance cost at beginning of year/inception date P=116,331 $2,518 P=155,199 $3,249 Accretion for the year charged to the “Interest expense and financing charges” account (see Note 23) (50,926) (1,125) (38,868) (815) Foreign exchange difference – 99 – 84
P=65,405 $1,492 P=116,331 $2,518
Parent Company BDO Facility On May 11, 2010 (the Effective Date), the Parent Company has signed a new Facility Agreement (BDO Facility) with BDO Unibank, BDO Leasing & Finance, Inc. (BDO Leasing) and BDO Private Bank, Inc. (BDO), collectively referred to as “Lenders,” amounting to P=3,750.0 million to partially refinance its outstanding indebtedness and other general corporate requirements. The loan has a term of 5 years and 1 day from the date of the initial advance to the Parent Company. Under the Facility, the Parent Company is allowed to borrow up to P=3,750.0 million from the effective date of the Agreement and will be available up to 90 days from such date. The total facility amount can be drawn either in pesos or in U.S. Dollars or a combination of both currencies at the option of the Parent Company provided that the aggregate amount of advances in U.S. Dollars that may be availed under the Facility shall be $72.2 million. The total facility amount should be converted from pesos using the PDS closing rate on the Effective Date, which is P=45.005 per $1.00. Principal repayments of all drawdowns will start on November 12, 2012 up to May 22, 2015. The BDO Facility offers the Parent Company the option of pricing the loan at a fixed or floating rate equivalent to the sum of the applicable benchmark rate and a margin of 2.0% per annum. The Parent Company elected to avail the loans at a fixed rate.
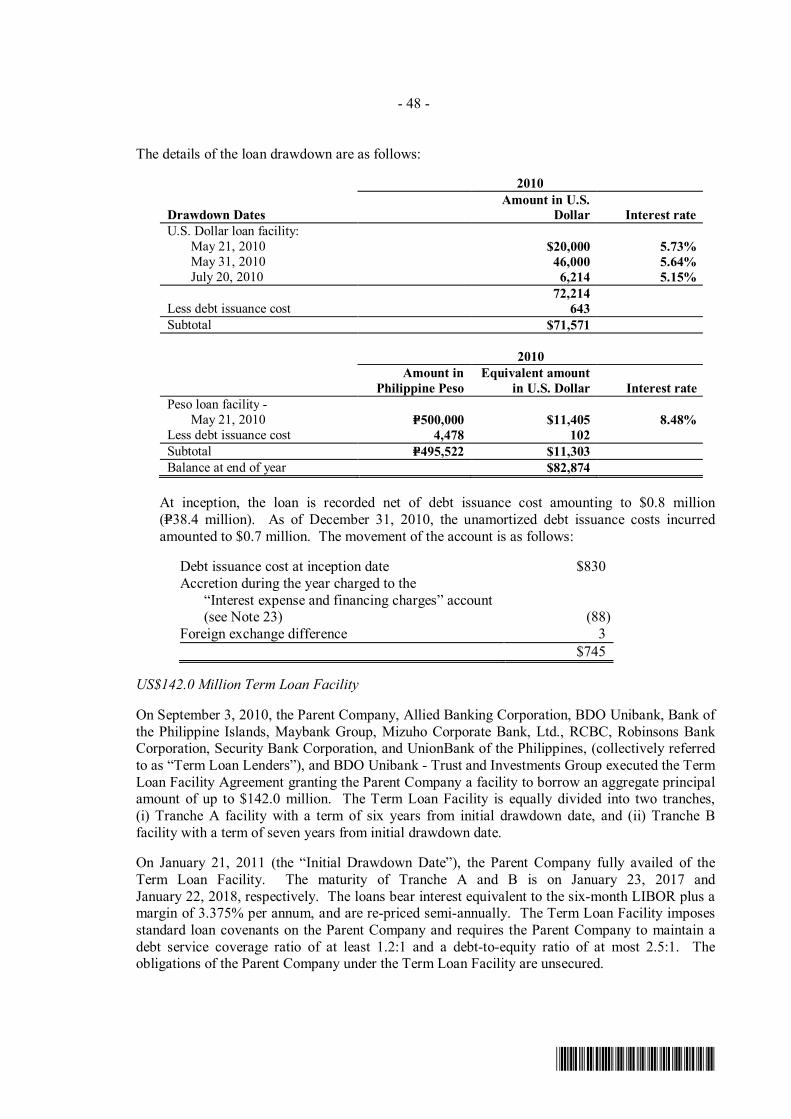
- 48 -
*SGVMC311282*
The details of the loan drawdown are as follows:
2010
Drawdown Dates Amount in U.S.
Dollar Interest rate U.S. Dollar loan facility:
May 21, 2010 $20,000 5.73% May 31, 2010 46,000 5.64% July 20, 2010 6,214 5.15%
72,214
Less debt issuance cost 643 Subtotal $71,571
2010
Amount in Philippine Peso
Equivalent amount in U.S. Dollar Interest rate
Peso loan facility - May 21, 2010 P=500,000 $11,405 8.48%
Less debt issuance cost 4,478 102 Subtotal P=495,522 $11,303 Balance at end of year $82,874
At inception, the loan is recorded net of debt issuance cost amounting to $0.8 million (P=38.4 million). As of December 31, 2010, the unamortized debt issuance costs incurred amounted to $0.7 million. The movement of the account is as follows:
Debt issuance cost at inception date $830 Accretion during the year charged to the
“Interest expense and financing charges” account (see Note 23) (88)
Foreign exchange difference 3 $745
US$142.0 Million Term Loan Facility On September 3, 2010, the Parent Company, Allied Banking Corporation, BDO Unibank, Bank of the Philippine Islands, Maybank Group, Mizuho Corporate Bank, Ltd., RCBC, Robinsons Bank Corporation, Security Bank Corporation, and UnionBank of the Philippines, (collectively referred to as “Term Loan Lenders”), and BDO Unibank - Trust and Investments Group executed the Term Loan Facility Agreement granting the Parent Company a facility to borrow an aggregate principal amount of up to $142.0 million. The Term Loan Facility is equally divided into two tranches, (i) Tranche A facility with a term of six years from initial drawdown date, and (ii) Tranche B facility with a term of seven years from initial drawdown date. On January 21, 2011 (the “Initial Drawdown Date”), the Parent Company fully availed of the Term Loan Facility. The maturity of Tranche A and B is on January 23, 2017 and January 22, 2018, respectively. The loans bear interest equivalent to the six-month LIBOR plus a margin of 3.375% per annum, and are re-priced semi-annually. The Term Loan Facility imposes standard loan covenants on the Parent Company and requires the Parent Company to maintain a debt service coverage ratio of at least 1.2:1 and a debt-to-equity ratio of at most 2.5:1. The obligations of the Parent Company under the Term Loan Facility are unsecured.

- 49 -
*SGVMC311282*
US$100 Million Notes Facility On December 17, 2010 (the “Effective Date”), the Parent Company, BDO Unibank, and BDO Capital & Investment Corporation executed the Notes Facility Agreement granting the Parent Company a facility to borrow an aggregate principal amount of $100 million. The Notes Facility is equally divided into two tranches: (i) Tranche A with a term of six years from drawdown date and (ii) Tranche B with a term of seven years from drawdown date. The Notes Facility offers the Parent Company the option of pricing the loan at a fixed or floating rate equivalent to the sum of the applicable benchmark rate and a margin of 2.625% per annum. The interest on the Notes Facility is payable on a semi-annual basis. In addition, the Notes Facility imposes standard loan covenants on the Parent Company and requires the Parent Company to maintain a debt service coverage ratio of at least 1.2:1 and a debt-to-equity ratio of at most 2.5:1. The obligations of the Parent Company under the Notes Facility are unsecured. As of March 16, 2011, the Parent Company has not yet drawn any amount from the Notes Facility.
17. Obligations to Gas Sellers on Annual Deficiency
Details of obligations to Gas Sellers on Annual Deficiency recognized pursuant to the SAs and the PDAs, including accrued interest, are as follows:
2010 2009 FGPC: Balance at beginning of year $5,433 $28,260 Reversal of the 2006 Annual Deficiency [see Note 29(f)] (5,433) – Annual deficiency for 2006, as adjusted 528 – Interest incurred (see Note 23) 59 264 Principal payments (528) (22,380) Interest payments (59) (711) Balance at end of year $– $5,433 FGP: Balance at beginning of year $3,945 $8,436 Reversal of the 2006 Annual Deficiency [see Note 29(f)] (3,945) – Annual deficiency for 2006, as adjusted 1,299 – Interest incurred (see Note 23) 145 34 Principal payments (1,299) (4,404) Interest payments (145) (121) Balance at end of year $– $3,945 Total $– $9,378 FGPC and FGP each executed on March 22, 2006 its respective SA and PDA with the Gas Sellers to amicably settle their long-standing disputes under the GSPA for Contract Years 2002 to 2004. The disputes relate to the Gas Sellers’ claim for Annual Deficiency payments totaling $163.4 million and $68.0 million from FGPC and FGP, respectively, covering the unconsumed gas volumes during these Contract Years.

- 50 -
*SGVMC311282*
Under the terms of their respective SAs and the PDAs, the Gas Sellers’ claims from FGPC and FGP have been reduced to $115.3 million and $32.7 million, respectively. Mandatory prepayments of $8.0 million and $2.1 million and pre-settlement interest of $11.0 million and $2.9 million for FGPC and FGP, respectively, were paid on June 7, 2006. Additional reductions of Annual Deficiency amounting to $9.5 million for FGPC and $3.8 million for FGP were recognized in 2006 to credit FGPC and FGP for gas consumption in excess of their respective TOPQ for 2005.
The respective SAs and PDAs allow FGPC and FGP to prepay all or part of the outstanding balances and to “make up” the volume of gas up to the extent of the principal repayments made under the PDA for a longer period of time instead of the 10-Contract Year recovery period allowed under their respective GSPAs. On May 31, 2006, all the conditions precedent set out in the respective SAs and PDAs of FGPC and FGP were completely satisfied. Such conditions precedent included an acknowledgment and consent by Meralco. As of December 31, 2010, the obligations under the SAs and PDAs, and the outstanding Obligations to Gas Sellers pertaining to the Annual Deficiency for Contract Year 2006 [see Note 29(f)] were fully settled.
Under the terms of the PPA with Meralco, all fuel and fuel-related payments are passed-through. The obligations of FGPC and FGP under their respective SAs, the PDAs and the GSPAs are passed on to Meralco on a “back-to-back” and full pass-through basis. The corresponding receivables from Meralco, including accrued interest and output VAT, are presented as part of the “Receivables” account in the consolidated statements of financial position (see Note 7).
Upon payment of the principal amount, a debit to the “Prepaid gas” account (included under the “Other noncurrent assets” account in the consolidated statements of financial position) is recognized to cover the principal portion paid to the Gas Sellers and a corresponding credit to the “Unearned revenue” account (included under “Other noncurrent liabilities” account in the consolidated statements of financial position) is recognized for the principal portion that was already paid by Meralco. As of December 31, 2010 and 2009, the remaining prepaid gas arising from the SAs and PDAs and the corresponding unearned revenue amounted to $28.1 million and $48.6 million, respectively, (see Notes 13 and 18). The prepaid gas and the corresponding unearned revenue balances as of December 31, 2010 are net of recoveries of Annual Deficiency recognized by Gas Sellers for gas consumed above the TOPQ, as calculated by Gas Sellers, for the Contract Years 2010, 2009, 2008 and 2007, which totaled $121.0 million.
18. Other Noncurrent Liabilities
This account consists of:
2010 2009 Unearned revenue (see Note 17) $28,118 $48,647 Asset retirement obligations 1,071 985 $29,189 $49,632
Asset Retirement Obligations Under their respective ECCs, FGP and FGPC have legal obligations to dismantle their respective power plant assets at the end of their useful lives. FG Bukidnon, on the other hand, has contractual obligation under the lease agreement with PSALM to dismantle its power plant asset at the end of its useful life. FGP, FGPC and FG Bukidnon established their respective provisions to recognize their estimated liability for the dismantlement of the power plant assets.

- 51 -
*SGVMC311282*
Movements of asset retirement obligations follow:
2010 2009 Balance at beginning of year $985 $910 Accretion for the year charged to the “Interest
expense and financing charges” account (see Note 23) 77 71
Foreign exchange adjustments 9 4 Balance at end of year $1,071 $985
19. Equity
a. Capital Stock
Details and movements of the Parent Company’s capital stock are as follows:
Number of Shares 2010 2009 2008 Redeemable preferred stock (Series “B”)
- P=0.50 par value Authorized 1,000,000,000 1,000,000,000 1,000,000,000 Issued 1,000,000,000 1,000,000,000 1,000,000,000
Redeemable preferred stock (Series “E”) - P=0.50 par value
Authorized 1,500,000,000 1,500,000,000 – Issued: Balance at beginning of year 375,000,000 – – Issuance as stock dividend to Preferred Stock Series “B” – 375,000,000 – Issuance as stock dividend to Preferred Stock Series “E” 93,553,892 – – Balance at end of year 468,553,892 375,000,000 –
Redeemable preferred stock (Series “F”) - P=10.00 par value
Authorized 100,000,000 – – Issued: Balance at beginning and end of year – – –
Common stock - P=1 par value Authorized: Balance at beginning of year 6,000,000,000 1,150,000,000 1,150,000,000 Reclassification to Preferred Stock Series “F” (1,000,000,000) – – Addition (August 24) – 1,620,000,000 – Addition (December 7) – 3,230,000,000 – Balance at end of year 5,000,000,000 6,000,000,000 1,150,000,000
Issued: Balance at beginning of year 2,306,993,715 1,089,072,926 1,089,046,426 Stock issued under the Stock Rights Offering 1,334,972,791 – – Conversion of deposits for future stock
subscriptions – 807,500,000 – 50% stock dividends – 405,000,000 – Stocks issued under the stock option plan
(see Note 20) 54,558 5,420,789 26,500 Balance at end of year 3,642,021,064 2,306,993,715 1,089,072,926

- 52 -
*SGVMC311282*
As of December 31, 2010, the Parent Company’s redeemable preferred stocks consist of Series “B”, Series “E”, and Series “F” stocks.
§ The Series “B” redeemable preferred stocks have voting rights, entitled to cumulative dividends of two centavos (P=0.02) per share and redeemable at the option of the Parent Company and redeemable at issue price.
§ The Series “E” preferred stocks have voting rights, entitled to receive dividends at a dividend rate and at such times as may be determined by the BOD, and redeemable at the option of the Parent Company.
§ The Series “F” preferred stocks have non-voting rights except in the cases provided by law, issue value and dividend rate to be determined by the BOD at the time of issuance, entitled to receive cumulative dividends, and redeemable at the option of the Parent Company.
Preferred stocks, regardless of series, are non-participating and non-convertible to common stocks.
As discussed in Note 1, the Parent Company has successfully completed the Rights Offering of 2,142,472,791 common stocks in the Philippines on January 22, 2010. The proceeds of the Rights Offering amounted to P=14.8 billion ($315.3 million), net of transaction costs of P=0.2 billion ($3.9 million). Such transaction costs were deducted against additional paid-in capital.
On May 12, 2010, a new two-year share buyback program was approved by the BOD of the Parent Company covering up to 300.0 million of the Parent Company’s common shares representing approximately 9% of the Parent Company’s total outstanding common shares. The two-year period commenced on June 1, 2010 and will end on May 31, 2012. The number of shares and buyback period are subject to revision from time to time as circumstances may warrant, subject to the proper disclosures to regulatory agencies, by the BOD of the Parent Company. The Parent Company will undertake a buyback transaction only if and to the extent that the price per share is deemed extremely undervalued, share prices are considered highly volatile, or in any other instance where the Parent Company believes that a buyback will result in enhancing shareholder value. As of March 16, 2011, there are no stocks purchased under the program.
On March 30, 2009, the BOD of the Parent Company approved the amendment to Article Seventh of the Parent Company’s Amended Articles of Incorporation to increase the authorized capital stock from P=1,650.0 million to P=3,270.0 million. The proposed increase in authorized capital stock shall be comprised of 1,620,000,000 common stocks with a par value of P=1.00 a share. On May 13, 2009, the proposed increase in capital stock was approved by the stockholders.
On August 24, 2009, the Philippine SEC approved the increase in authorized capital stock of the Parent Company from P=1,650.0 million to P=3,270.0 million divided into 2,770,000,000 common stocks with a par value of P=1.00 a share and 1,000,000,000 redeemable preferred stocks with par value of P=0.50 a share. Of the P=1,620.0 million increase in authorized capital stock, consisting of 1,620,000,000 common stocks with a par value of P=1.00 a share and 1,000,000,000 preferred stocks with a par value of P=0.50 a share, the amount of P=405.0 million representing at least twenty-five percent (25%) of such increase, has been subscribed and paid in full by way of a fifty percent (50%) stock dividend taken from the unrestricted retained earnings of the Parent Company.

- 53 -
*SGVMC311282*
On the same date, the Philippine SEC also approved the Parent Company’s Amended Articles of Incorporation and Amended By-Laws. The Amended Articles of Incorporation contain the amendment to the Article Seventh to reflect the foregoing increase in authorized capital stock as mentioned above.
On October 5, 2009, the BOD of the Parent Company approved the following amendments/matters to Article Seventh of the Parent Company’s Amended Articles of Incorporation:
§ to increase the authorized capital stock from P=3,270.0 million to P=7,250.0 million consisting of 6,000,000,000 common stocks with a par value of P=1.00 a share, and 2,500,000,000 preferred stocks with a par value of P=0.50 a share;
§ to undertake a stock rights offering amounting to approximately P=15.0 billion under which existing eligible shareholders of the Parent Company will have the opportunity to subscribe their pro-rata shareholding and will not be subject to dilution;
§ to authorize the declaration of stock dividends for one class or series of preferred stocks from a different class or series of preferred stocks;
§ to create new Series “E” preferred stocks which will be redeemable at the option of the Parent Company; and,
§ to revise the dividend rate of Series “A” to “D” preferred stocks from P=0.05 to P=0.02 per share.
The above amendments/matters were submitted and approved by the stockholders during a special stockholders meeting held on November 20, 2009. On January 26, 2011, the BOD of the Parent Company approved setting the dividend rate of P=0.01 per share to Series “E” preferred stock. On December 7, 2009, the Philippine SEC approved the increase in authorized capital stock of the Parent Company from P=3,270.0 million to P=7,250.0 million consisting an increase in the number of common stocks authorized for issuance by 3,230,000,000 shares with a par value of P=1.00 a share and an increase in the number of preferred stocks (Series “E”) authorized for issuance by 1,500,000,000 shares with a par value of P=0.50 a share. On March 8, 2010 and May 12, 2010, the BOD and the stockholders of the Parent Company, respectively, approved the proposed reclassification of P=1.0 billion authorized common stocks consisting of 1,000,000,000 common stocks to P=1.0 billion authorized Series “F” preferred stocks consisting of 100,000,000 Series “F” preferred stocks and the corresponding amendment to Article Seventh of the Amended Articles of Incorporation. The proposed Series “F” preferred stocks with a par value of P=10.00 a share shall be cumulative, non-voting except in the cases provided by law, non-participating and redeemable at the option of the Parent Company, among others. On August 23, 2010, the Philippine SEC approved the reclassification of a portion of its authorized common stocks to preferred stocks, and the creation of new Series “F” preferred stocks.
b. Deposits for Future Stock Subscriptions On August 13, 2009, the Parent Company received from FPHC the amount of $110.1 million (P=5.3 billion) as deposits for future stock subscriptions. On December 7, 2009, $16.8 million (P=807.5 million) of the deposits were converted to 807,500,000 common stocks. In 2010, the

- 54 -
*SGVMC311282*
remaining balance of the deposits for future stock subscriptions totaling $93.3 million (P=4.5 billion) have been fully utilized to subscribe to the common stocks issued during the Rights Offering.
c. Retained Earnings On March 30, 2009, the BOD of the Parent Company approved the declaration of 50% stock dividends on the Parent Company’s common stocks to be taken from unissued common stocks and the declaration of 50% property dividends on the Parent Company’s preferred stocks to be taken from treasury preferred stocks.
On August 27, 2009, the Philippine SEC approved the issuance of $8.4 million (P=405.0 million) common stocks consisting of 405,000,000 of the Parent Company’s common stocks with a par value of P=1.00 a share, to cover the stock dividends declared by the BOD on March 30, 2009 and has been ratified by the Parent Company’s stockholders representing at least two-thirds (2/3) of the outstanding capital stock on May 13, 2009 and the issuance of such common shares of stock to stockholders of record as of September 11, 2009. The stock dividends were paid on October 7, 2009. The Philippine SEC’s approval was pursuant to the Amended Rules Governing Pre-emptive and other Subscription Rights and Declaration of Stock or Cash Dividends of Corporations whose securities are registered under the SRC or listed in the PSE.
On September 23, 2009, the Philippine SEC approved the Parent Company’s declaration of 50% property dividends consisting of 177,619,000 preferred stocks, to be taken from treasury preferred stocks, amounting to $7.6 million (P=680.3 million) to the Parent Company’s preferred stockholders of record as of May 13, 2009.
On October 5, 2009, the BOD of the Parent Company approved the declaration of a property dividend on the Parent Company’s preferred stocks to be taken from the remaining 467,143,000 treasury preferred stocks and the declaration of a stock dividend on the 375,000,000 million Series “E” preferred stocks to be taken from the Parent Company’s unrestricted retained earnings. The above matter was approved by the stockholders during the special stockholders meeting held on November 20, 2009.
On November 26, 2009, the Philippine SEC approved the Parent Company’s property dividend declaration taken from the remaining 467,143,000 preferred stocks held in treasury amounting to $20.0 million (P=1,787.1 million) to the Parent Company’s preferred stockholders of record as of November 20, 2009.
On December 7, 2009, the Philippine SEC approved the Parent Company’s declaration of 25% stock dividends, consisting of 375,000,000 Series “E” preferred stocks amounting to $4.0 million (P=187.5 million) to the Parent Company’s preferred stockholders of record as of December 7, 2009.
On March 8, 2010 and May 12, 2010, the BOD and the stockholders of the Parent Company has respectively approved the declaration of a stock dividend on Series “E” preferred stocks consisting of 93,553,892 shares to be taken from the Parent Company’s unrestricted retained earnings. On June 2, 2010, the Parent Company submitted to the Philippine SEC a notice of declaration of stock dividends on Series “E” preferred stocks.
On January 26, 2011, the BOD of the Parent Company approved the declaration of cumulative cash dividends amounting to $1.8 million (P=77.8 million) to the Parent Company’s Series “B” preferred stockholders of record as of February 9, 2011 to be taken from the Parent Company’s unrestricted retained earnings.

- 55 -
*SGVMC311282*
The retained earnings balance is restricted to the extent of: (a) acquisition price of the treasury stocks amounting to $53.0 million as of December 31, 2010 and 2009; and (b) the undistributed net earnings of investee companies (including consolidated subsidiaries) amounting to $102.5 million and $31.9 million as of December 31, 2010 and 2009, respectively. Undistributed earnings of the investee companies are not available for dividend distribution until such time that the Parent Company receives the dividends from these investee companies.
d. Treasury Stocks
Movements in the number of treasury stocks are as follows:
2010 2009 2008 Preferred Stocks (Series “B”) Held in
Treasury: Balance at beginning of year – 644,762,000 644,762,000 Re-issuance (September 30) – (177,619,000) – Re-issuance (November 26) – (467,143,000) – Balance at end of year – – 644,762,000
Common Stocks Held in Treasury - Balance at beginning and end of year 279,406,700 279,406,700 279,406,700
20. Share-based Payment Plans
Executive Stock Option Plan (ESOP) The Parent Company has an ESOP, which entitles the option grantees to acquire common stocks of the Parent Company, which stocks shall not at any grant date, exceed four percent of the total issued and outstanding common stocks of the Parent Company.
Options under the ESOP vest within a five-year period. Awards granted prior to the Initial Public Offering (the Offering) were pegged at a fixed exercise price in accordance with the ESOP, subject to adjustments in certain cases. Any option granted after the Offering is subject to a purchase price determined at the option grant date based on the average closing price of the Parent Company’s common stocks at the stock exchange for 20 market days prior to the grant, subject to a discount, but in no case shall the purchase price be less than the par value. The terms of the ESOP include, among others, a one-year holding period from the date of award of an option, a limit as to the number of stocks an executive and employee may purchase and settle by payment in cash or check the full amount of the price of the stocks over which the option is exercised. The contractual life of options granted is ten years, with no cash settlement alternative.
On July 1, 2003, a total of 452,285 common stocks of the Parent Company’s unissued common stocks have been reserved for the grantees. By virtue of the common stock split and common stock dividends declared and approved by the Parent Company’s BOD and stockholders on April 4, 2005, the number of options and price per share granted to all executives and employees have been adjusted automatically in accordance with the terms of the ESOP. Accordingly, (i) the number of common stocks reserved for the grantees has been adjusted from 452,285 common stocks to 18,091,400 common stocks; (ii) the total number of common stocks that have been awarded to be granted over a five-year period under the ESOP has been adjusted from 409,756 common stocks to 15,856,800 common stocks; and (iii) the exercise price of P=528.00 a share has

- 56 -
*SGVMC311282*
been reduced to P=13.20 a share. The exercise price was further adjusted from P=13.20 per share to P=8.80 per share following the issuance of 50% stock dividends as approved by the SEC on August 27, 2009.
Movements in the number of stock options granted under ESOP are as follows:
Number of Shares 2010 2009 2008 Balance at beginning of year 1,427,593 4,676,846 4,768,626 50% stock dividends – 2,171,536 – Exercised during the year (54,558) (5,420,789) (26,500) Forfeited during the year – – (65,280) Balance at end of year 1,373,035 1,427,593 4,676,846
Exercisable at end of year 1,373,035 1,427,593 4,676,846
The weighted average stock prices at the dates of options exercise were P=10.94 a share, P=17.86 a share and P=29.88 a share in 2010, 2009 and 2008, respectively. The weighted average fair value of options granted was P=5.45 a share.
The weighted average remaining contractual life of the outstanding stock options as of December 31, 2010 is three years.
The fair value of the stock options was estimated as at grant date (July 2003) using the Black Scholes-Merton model, taking into account the terms and conditions upon which the options were granted. The following lists the inputs to the model used to value the stock options at grant date:
Dividend yield 25.68% Expected volatility 47.55% Risk-free interest rate 8.56% to 11.00% Expected life of option (years) 2.5 to 5.0 Weighted average stock price* P=1,147
* Before adjustment resulting from common stock split and common stock dividends
The share-based payment transactions, including transactions with employees of FPHC and an associate of the Parent Company, amounted to $0.04 million in 2008 of which $0.03 million was recognized as expense for employee services received by First Gen Group. There were no share-based payment transactions in 2010 and 2009.
The expected life of the options is based on historical data and is not necessarily indicative of exercise patterns that may occur. The expected volatility assumes that the historical volatility is indicative of future trends, which likewise, may not necessarily be the actual outcome.
No other features of options grant were incorporated into the measurement of the fair value of the option.
Employee Stock Purchase Plan (ESPP) The Parent Company has an ESPP, which entitles the eligible employees to acquire the common stocks of the Parent Company, provided that such stocks shall not at any grant date exceed one percent of the total issued and outstanding common stocks of the Parent Company. The stocks may be acquired under the ESPP at fair market price equal to the average of the closing price of the common stocks on the exchange for the 20 market days immediately preceding the grant date.

- 57 -
*SGVMC311282*
A grantee under the ESPP shall have five years to complete payments on the common stocks acquired pursuant to the plan, with a right to prepay after two years. As of December 31, 2010 and 2009, no award or sale of stocks under the ESPP has been granted to any employee.
21. Related Party Transactions
In addition to the respective PPAs of FGP and FGPC with Meralco as discussed in Note 29(a) and certain advances to non-controlling shareholder as discussed in Note 16, the following are the other significant transactions with related parties:
a. Due to related parties represent noninterest-bearing U.S. dollar and Philippine peso-denominated emergency loans to meet working capital and investment requirements of First Gen Group.
b. Management services are rendered by the Parent Company to BPPC under certain terms and conditions of a Management Contract. The consideration for the payment of management fees is fixed at $0.5 million per year effective January 1, 2006. On March 13, 2006, the Parent Company and BPPC renewed the Management Contract effective from January 1, 2006 until the end of the 15-year Cooperation Period of the Project Agreement of BPPC, which expired in July 2010. Management fees amounting to $0.3 million in 2010 and $0.5 million in each of the years 2009 and 2008 are included in the “Others” account in the consolidated statements of income.
c. Lease of premises, on which First Gen Group corporate offices are located, from First Philippine Realty Corporation (FPRC), a subsidiary of FPHC [(see Note 29(n)]. Total rent expense amounted to $0.3 million in 2010, $0.4 million in 2009 and $0.3 million in 2008 (see Note 23).
d. The Parent Company is engaged as EDC’s consultant to render services pertaining to financial, business development and other matters under a consultancy agreement beginning September 1, 2008. Such agreement is for a period of three years up to August 31, 2011. On October 12, 2009, the Parent Company and EDC agreed to adjust the monthly fee from $0.2 million (P=8.7 million net of withholding taxes plus VAT) to $0.3 million (P=11.8 million net of withholding taxes plus VAT) effective September 2009 to cover the cost of additional officers and staff assigned to EDC. Consultancy fees amounting to $3.7 million and $3.0 million for the years ended December 31, 2010 and 2009, respectively, are included in the “Others” account in the consolidated statements of income. In addition, the Parent Company charged $5.2 million (P=236.4 million) in 2010 for the reimbursement of the employee costs of its seconded personnel to EDC. This additional charge is also included in the “Others” account in the 2010 consolidated statement of income.
e. Compensation of key management personnel are as follows:
2010 2009 2008 Other short-term employee benefits $7,620 $5,581 $5,502 Share-based payments (see Note 20) – – 29 Retirement and other post-retirement
benefits (see Note 24) 356 315 680 $7,976 $5,896 $6,211

- 58 -
*SGVMC311282*
Terms and Conditions of Transactions with Related Parties. Except for certain advances to non-controlling shareholder (see Note 16), outstanding balances at year end are unsecured and interest-free and settlement occurs in cash. There have been no guarantees provided or received for any related party receivables or payables.
Advances to non-controlling shareholder (BG Plc.), included in the “Other current assets” and “Other noncurrent assets” accounts in the consolidated statements of financial position amounted to $97.2 million and $99.7 million as of December 31, 2010 and 2009, respectively (see Notes 9 and 13).
Details of amounts due from related parties (included in the “Receivables” account in the consolidated statements of financial position, see Note 7) are as follows:
2010 2009Red Vulcan $7,536 $7,356EDC 6,241 383FG Hydro 84 11,042Others 1,056 1,370 $14,917 $20,151
No impairment loss was recognized on these receivables for the years ended December 31, 2010 and 2009. This assessment is undertaken each financial year through review of the financial position of the related party and the market in which the related party operates.
Details of amounts due to related parties are as follows:
2010 2009 BG Plc. $6,348 $6,348 FGHC International Ltd. 145 145 Others 216 218 $6,709 $6,711
BG Plc. is a stockholder of FGHC, while FGHC International Ltd. is a subsidiary of FPHC. 22. Interest Income
2010 2009 2008 Cash and cash equivalents (see Note 6) $2,879 $658 $5,183 Receivables from Meralco on Annual
Deficiency (see Notes 7 and 17) 204 298 3,114 Advances to non-controlling shareholder
(see Notes 9 and 13) 5,798 5,986 782 $8,881 $6,942 $9,079

- 59 -
*SGVMC311282*
23. Costs and Expenses
Depreciation and Amortization
2010 2009 2008 Property, plant and equipment
(see Note 11) $54,368 $53,330 $53,424 Intangible assets (see Note 12) 602 602 602 $54,970 $53,932 $54,026
Staff Costs
2010 2009 2008 Salaries and wages $15,805 $9,927 $10,007 Retirement benefits (see Note 24) 777 698 1,991 Share-based payments (see Note 20) – – 29 $16,582 $10,625 $12,027
Other Administrative Expenses
2010 2009 2008 Professional fees $13,652 $12,473 $17,581 Taxes and licenses 12,553 12,970 20,570 Insurance 5,934 7,154 5,301 Others (see Notes 7, 21 and 29) 6,525 4,647 5,811 $38,664 $37,244 $49,263
Interest Expense and Financing Charges
2010 2009 2008 Interest on:
Loans and bonds (see Notes 15 and 16) $80,032 $93,752 $112,599
Swap fees (see Note 28) 17,492 11,698 1,050 Obligations to Gas Sellers on Annual
Deficiency (see Note 17) 204 298 3,114 Accretion on:
Debt issuance costs (see Notes 15 and 16) 6,417 6,270 4,587
Asset retirement obligations (see Note 18) 77 71 67
$104,222 $112,089 $121,417 24. Retirement Benefits
The following tables summarize the funded status and amounts recognized in the consolidated statements of financial position for the retirement plans and the components of net retirement benefit expense recognized in the consolidated statements of income:

- 60 -
*SGVMC311282*
The net retirement assets (liabilities) are presented in the consolidated statements of financial position as follows:
2010 2009 Net retirement assets $369 $594 Net retirement liabilities (722) (167) Net retirement asset (liability) ($353) $427
Net retirement assets are included in the “Other noncurrent assets” account (see Note 13) while the retirement liabilities are presented as “Retirement liability” account on the face of the consolidated statements of financial position.
The amounts recognized in the consolidated statements of financial position are as follows:
2010 2009 Present value of defined benefit obligation $9,729 $4,743 Fair value of plan assets (8,071) (6,731) 1,658 (1,988) Unrecognized past service cost (430) (455) Unrecognized actuarial losses (gains) (258) 2,614 Foreign exchange adjustments (617) (598) Retirement liability (asset) $353 ($427)
The amounts recognized in the consolidated statements of income are as follows:
2010 2009 2008 Current service cost $605 $512 $1,260 Interest cost 661 488 720 Expected return on plan assets (425) (249) (128) Net actuarial losses (gains) recognized (80) (76) 107 Amortization of past service cost 16 23 32 Retirement benefits expense $777 $698 $1,991
Movements in the present value of the defined benefit obligation are as follows:
2010 2009 Balance at beginning of year $4,743 $70,527 Current service cost 605 512 Interest cost 661 488 Benefits paid (94) (20) Actuarial losses 3,414 – Deconsolidation of discontinued operations
(see Note 4) – (66,901) Foreign exchange adjustments 400 137 Balance at end of year $9,729 $4,743

- 61 -
*SGVMC311282*
Movements in the fair value of plan assets are as follows:
2010 2009 Balance at beginning of year $6,731 $41,773 Expected return on plan assets 425 249 Actuarial gains 615 180 Contributions paid – 2,076 Benefits paid (94) (20) Deconsolidation of discontinued operations
(see Note 4) – (37,727) Foreign exchange adjustments 394 200 Balance at end of year $8,071 $6,731
Actual return on plan assets $1,040 $429
The Parent Company and its subsidiaries, namely FGHC, FGPC and FGP (collectively, the “First Gas Group”) have initially funded the retirement plans in December 2005. First Gen Group expects to contribute $3.8 million to its defined benefit retirement plans in 2011.
The major categories of plan assets as a percentage of the fair value of total plan assets are as follows:
2010 2009 Investments in government securities 80% 75% Investments in shares of stock 18 12 Deposits in banks – 11 Others 2 2 100% 100%
The overall expected rate of return on assets is determined based on the market prices prevailing on that date, applicable to the period over which the obligations are to be settled.
The principal actuarial assumptions used in determining retirement benefit obligations for First Gen Group as of January 1, 2010 and 2009 are as follows:
2010 2009 Discount rate (average) 8.43% 14% Future salary increase rate 12-14 10-14 Expected rate of return on plan assets (average) 7 7
Amounts for the current and previous years are as follows:
2010 2009 2008 2007 2006 Present value of defined
benefit obligation $9,729 $4,743 $70,527 $72,374 $4,969 Fair value of plan assets (8,071) (6,731) (41,773) (40,962) (1,352) Deficit (Surplus) $1,658 ($1,988) $28,754 $31,412 $3,617

- 62 -
*SGVMC311282*
The experience adjustments on the present value of defined benefit obligation amounted to $1.0 million, $0.9 million and $1.0 million in 2010, 2008 and 2006, respectively. The experience adjustments on the fair value of plan assets amounted to $0.6 million, $0.4 million and $0.1 million in 2010, 2008 and 2006, respectively. There were no experience adjustments on the present value of defined benefit obligation and fair value of plan assets in 2009 and 2007.
25. Income Tax
a. The deferred income tax assets (liabilities) of First Gen Group are presented in the
consolidated statements of financial position as follows: 2010 2009 Deferred income tax assets $3,794 $10 Deferred income tax liabilities (10,479) (18,609)
The components of these deferred income tax assets (liabilities) as of December 31, 2010 and 2009 are as follows:
2010 2009 Changes recognized in the consolidated
statements of income: Deferred income tax assets on:
Excess amortization of debt issuance costs under effective interest method over straight-line method $2,516 $2,543
NOLCO 628 1,738 Asset retirement obligations 204 255 Unamortized portion of preoperating
expenses and project development costs 84 199
Others 587 – 4,019 4,735
Deferred income tax liabilities on: Difference between the carrying amounts of
nonmonetary assets and their related tax bases (10,213) (20,059)
Prepaid major spare parts (2,100) (4,267) Unrealized foreign exchange gains (9,741) (4,046) Capitalized costs and losses during
commissioning period of the power plants (623) (636)
Others – (1,407) (22,677) (30,415) (18,658) (25,680)Changes recognized directly in other
comprehensive income (loss) - Deferred income tax asset on derivative
liability 11,973 7,081 ($6,685) ($18,599)

- 63 -
*SGVMC311282*
b. Certain deferred income tax assets of the Parent Company and certain subsidiaries have not been recognized since management believes that it is not probable that sufficient future taxable income will be available against which they can be utilized. The deductible temporary differences of certain consolidated statement of financial position items and carryforward benefits of NOLCO and MCIT of the Parent Company and certain subsidiaries for which no deferred income tax asset has been recognized consist of the following:
2010 2009 NOLCO $179,829 $201,738 Foreign exchange differentials on unrealized
losses 11,725 24,326 Accrual for retirement benefits 866 344 MCIT 449 369 Unamortized portion of preoperating expenses
and project development costs 9 237 Derivative liability – 101 Others 382 247
As of December 31, 2010 and 2009, the temporary taxable differences representing the excess
of the carrying amount of the investments in subsidiaries over the tax base amounted to $24.3 million and $104.5 million, respectively. The deferred income tax liability has not been recognized as First Gen Group is able to control the timing of the reversal of the temporary difference and it is probable that the temporary taxable difference may not reverse in the foreseeable future.
c. Provision for current income tax in 2010, 2009 and 2008 includes the RCIT of FG Bukidnon, FGP, and FGPC. For the year ended December 31, 2010, FGP computed its current income tax using the Optional Standard Deduction (OSD) method, from which availment tax benefits amounted to $4.4 million (P=197.9 million). For the year ended December 31, 2009, FGP and FG Bukidnon computed their current income tax using the OSD method, from which the combined tax benefits from availment of the OSD in 2009 amounted to $3.3 million (P=156.2 million).
d. The balance of NOLCO as of December 31, 2010 may be used by the Parent Company and certain subsidiaries as additional deductions against their respective future taxable income. Similarly, the MCIT balance as of December 31, 2010 may be applied as credit against future income tax liabilities of the Parent Company and certain subsidiaries. The balances of NOLCO and MCIT, with their corresponding years of expiration, are as follows:
Incurred for the Year Ended December 31
Available Until December 31 NOLCO MCIT
(In U.S
Dollar) (In Philippine
Peso) (In U.S. Dollar)
(In Philippine Peso)
2008 2011 $82,874 P=3,633,189 $52 P=2,272 2009 2012 55,939 2,452,391 81 3,579 2010 2013 43,109 1,889,896 316 13,846 $181,922 P=7,975,476 $449 P=19,697
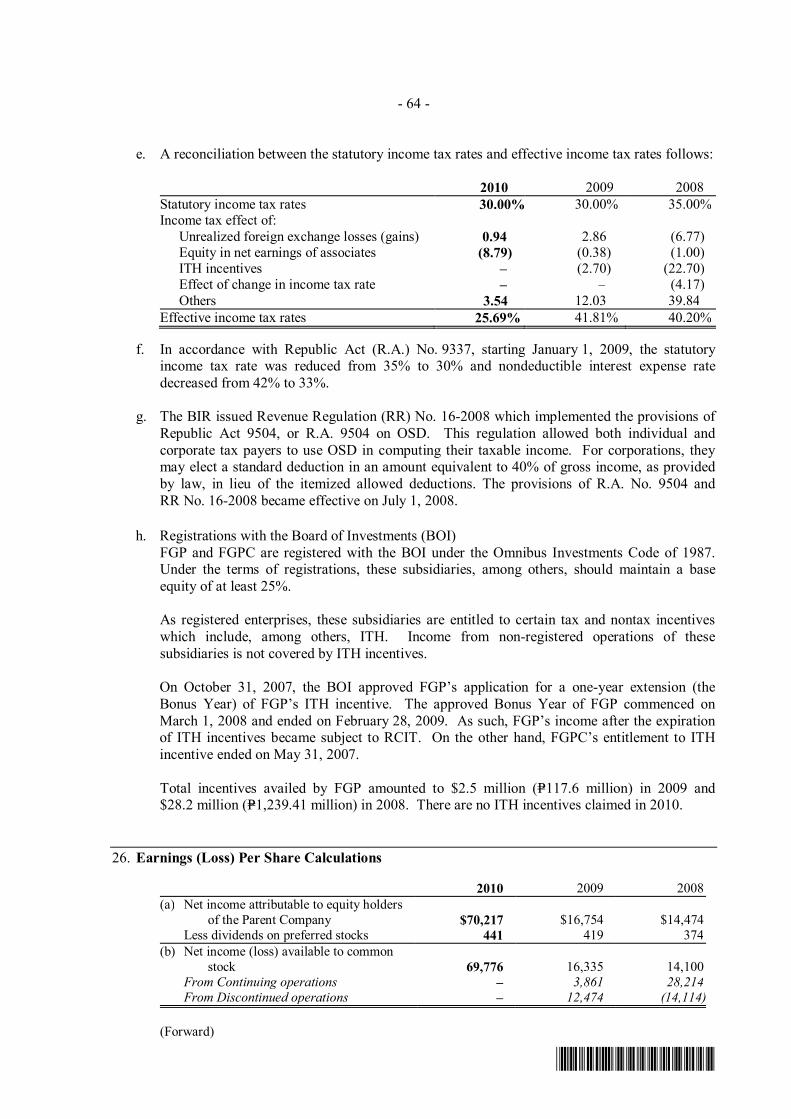
- 64 -
*SGVMC311282*
e. A reconciliation between the statutory income tax rates and effective income tax rates follows:
2010 2009 2008 Statutory income tax rates 30.00% 30.00% 35.00% Income tax effect of: Unrealized foreign exchange losses (gains) 0.94 2.86 (6.77) Equity in net earnings of associates (8.79) (0.38) (1.00) ITH incentives – (2.70) (22.70) Effect of change in income tax rate – – (4.17) Others 3.54 12.03 39.84 Effective income tax rates 25.69% 41.81% 40.20%
f. In accordance with Republic Act (R.A.) No. 9337, starting January 1, 2009, the statutory income tax rate was reduced from 35% to 30% and nondeductible interest expense rate decreased from 42% to 33%.
g. The BIR issued Revenue Regulation (RR) No. 16-2008 which implemented the provisions of
Republic Act 9504, or R.A. 9504 on OSD. This regulation allowed both individual and corporate tax payers to use OSD in computing their taxable income. For corporations, they may elect a standard deduction in an amount equivalent to 40% of gross income, as provided by law, in lieu of the itemized allowed deductions. The provisions of R.A. No. 9504 and RR No. 16-2008 became effective on July 1, 2008.
h. Registrations with the Board of Investments (BOI) FGP and FGPC are registered with the BOI under the Omnibus Investments Code of 1987. Under the terms of registrations, these subsidiaries, among others, should maintain a base equity of at least 25%. As registered enterprises, these subsidiaries are entitled to certain tax and nontax incentives which include, among others, ITH. Income from non-registered operations of these subsidiaries is not covered by ITH incentives. On October 31, 2007, the BOI approved FGP’s application for a one-year extension (the Bonus Year) of FGP’s ITH incentive. The approved Bonus Year of FGP commenced on March 1, 2008 and ended on February 28, 2009. As such, FGP’s income after the expiration of ITH incentives became subject to RCIT. On the other hand, FGPC’s entitlement to ITH incentive ended on May 31, 2007.
Total incentives availed by FGP amounted to $2.5 million (P=117.6 million) in 2009 and $28.2 million (P=1,239.41 million) in 2008. There are no ITH incentives claimed in 2010.
26. Earnings (Loss) Per Share Calculations
2010 2009 2008 (a) Net income attributable to equity holders
of the Parent Company $70,217 $16,754 $14,474 Less dividends on preferred stocks 441 419 374 (b) Net income (loss) available to common
stock 69,776 16,335 14,100 From Continuing operations – 3,861 28,214 From Discontinued operations – 12,474 (14,114)
(Forward)

- 65 -
*SGVMC311282*
2010 2009 2008 Add interest expense and accretion on
debt issuance costs on CBs $24,238 $26,785 $22,342 (c) Net income (loss) available to common
stocks adjusted for the effect of conversion of stock options and CBs 94,014 43,120 36,442 From Continuing operations 94,014 30,646 50,556 From Discontinued operations – 12,474 (14,114)
(d) Weighted average number of common stocks for basic earnings (loss) per share 3,251,330,259 1,214,952,596 1,214,496,027
Effect of conversion of: Stock options 268,084 724,118 3,916,554 Convertible bonds 317,220,210 248,187,382 248,187,382 (e) Weighted average number of common
stocks for diluted earnings (loss) per share 3,568,818,553 1,463,864,096 1,466,599,963
Basic/Diluted Earnings (Loss) Per Share (b/d) $0.021 $0.013 $0.012 From Continuing operations 0.021 0.003 0.023 From Discontinued operations – 0.010 (0.011)
For the years ended December 31, 2010, 2009 and 2008, the conversion of the CBs have an anti-dilutive effect, while the conversion of stock options did not have any significant impact on the diluted earnings (loss) per share calculation; thus, the diluted earnings (loss) per share is the same as the basic earnings (loss) per share.
27. Financial Risk Management Objectives and Policies
First Gen Group’s principal financial liabilities comprise trade payables, bonds payable, and long-term debt, among others. The main purpose of these financial liabilities is to raise financing for First Gen Group’s growth and operations. First Gen Group has other various financial assets and liabilities such as cash and cash equivalents, trade receivables, and accounts payable and accrued expenses, which arise directly from its operations.
As a matter of policy, First Gen Group does not trade its financial instruments. However, First Gen Group enters into derivative and hedging transactions, primarily interest rate swaps, as needed, for the sole purpose of managing the relevant financial risks that are associated with First Gen Group’s borrowing activities and as required by the lenders in certain cases.
First Gen Group has an Enterprise-Wide Risk Management Program which is aimed to identify risks based on the likelihood of occurrence and impact to the business, formulate risk management strategies, assess risk management capabilities and continuously monitor the risk management efforts.
The main risks arising from First Gen Group’s financial instruments are interest rate risk, foreign currency risk, credit risk and liquidity risk. The BOD reviews and approves policies for managing each of these risks as summarized below. First Gen Group’s accounting policies in relation to derivative financial instruments are set out in Note 2 to the consolidated financial statements.

- 66 -
*SGVMC311282*
Interest Rate Risk First Gen Group’s exposure to the risk of changes in market interest rate relates primarily to First Gen Group’s long-term debt and advances to non-controlling shareholder that are subject to floating interest rates.
First Gen Group believes that prudent management of its interest cost will entail a balanced mix of fixed and variable rate debt. On a regular basis, the Finance team of First Gen Group monitors the interest rate exposure and presents it to management by way of a compliance report. To manage the exposure to floating interest rates in a cost-efficient manner, First Gen Group may consider prepayment, refinancing, or entering into derivative instruments as deemed necessary and feasible.
In May 2002, FGP entered into an interest rate swap agreement to hedge half of its borrowings under the ECGD Facility. Under the swap agreement, FGP will either receive or pay, at specified intervals, the difference between fixed and variable rate interest amounts calculated by reference to the agreed-upon notional amount. Also, in November 2008, FGPC entered into interest rate swap agreements to cover the interest payments for up to 91% of its combined debt under the Covered and Uncovered Facilities (see Note 16). Under the swap agreements, FGPC will either receive or pay at specific intervals, the difference between fixed and variable rate interest amounts calculated by reference to the agreed-upon notional principal amounts.
As of December 31, 2010 and 2009, approximately 90.6% and 90.8%, respectively, of First Gen Group’s borrowings are subject to fixed interest rate after considering the effect of its interest rate swap agreement.
Interest Rate Risk Table The following table sets out the nominal amount, by maturity, of First Gen Group’s financial instruments that are exposed to interest rate risk (amounts in millions):
2010
Interest
Rates Within 1 Year
More than1 Year up to
3 Years
More than 3 Years up to
5 Years
More than
5 Years Total Fixed Rate Long-term debt: Covered Facility* 7.90% $12.30 $28.04 $32.24 $223.24 $295.82 Uncovered Facility* 7.56-7.96% 8.83 22.80 34.73 62.47 128.83 KfW Facility 7.20% 9.78 9.78 – – 19.56 ECGD Facility* 7.48% 4.79 9.58 4.79 – 19.16 Hermes-Covered Facility 7.48% 11.11 22.22 11.11 – 44.44 BDO Facility - Peso-denominated 8.48% – 0.57 10.84 – 11.41 BDO Facility - US dollar
denominated 5.15% 5.73% – 3.61 68.60 – 72.21
Bonds payable Convertible Bonds 2.50% 215.03 – – – 215.03 Corporate Note Facility 9.38% 3.69 114.90 – – 118.59 Floating Rate Long-term debt: Uncovered Facility 3.94% 2.94 7.60 11.58 20.82 42.94 ECGD Facility* 2.61% 4.79 9.58 4.79 – 19.16 GKA-Covered Facility 1.70% 5.70 11.41 11.41 5.70 34.22 Advances to non-controlling
shareholder** 5.80% 4.97 12.07 16.22 63.30 96.56 * Considerting the effect of interest rate swaps ** Excluding accrued interest

- 67 -
*SGVMC311282*
2009
Interest
Rates Within 1 Year
More than 1 Year up to 3
Years
More than 3 Years up to
5 Years
More than
5 Years Total Fixed Rate Long-term debt: Covered Facility* 7.65% $5.72 $24.61 $31.14 $240.07 $301.54 Uncovered Facility* 7.56 - 7.96% 4.65 17.74 30.51 80.57 133.47 KfW Facility 7.20% 9.78 19.56 – – 29.34 ECGD Facility* 7.48% 4.79 9.58 9.58 – 23.95 Hermes-Covered Facility 7.48% 11.11 22.22 22.22 – 55.55 Bonds payable Peso-denominated Bonds 11.55% 108.23 – – – 108.23 Convertible Bonds 2.50% – 300.59 – – 300.59 Corporate Note Facility 9.38% 2.92 112.53 – – 115.45 Floating Rate Long-term debt: Uncovered Facility 4.02% 1.55 5.91 10.17 26.86 44.49 ECGD Facility* 2.62% 4.79 9.58 9.58 – 23.95 GKA-Covered Facility 1.87% 5.70 11.41 11.41 11.41 39.93 Advances to non-controlling
shareholder** 5.8% 2.46 9.97 14.83 71.76 99.02
* Considering the effect of interest rate swaps ** Excluding accrued interest
Interest on financial instruments classified as floating rate is repriced semi-annually on each interest payment date. Interest on financial instruments classified as fixed rate is fixed until the maturity of the instrument. The other financial instruments of First Gen Group that are not included in the foregoing tables are noninterest-bearing and are therefore not subject to cash flow interest rate risk.
The following table demonstrates the sensitivity to a reasonably possible change in interest rates for the years ended December 31, 2010 and 2009, with all other variables held constant, of First Gen Group’s income before income tax and equity (through the impact of floating rate borrowings, and derivative assets and liabilities):
Change
in Basis Points
Increase (Decrease) in Income Before
Income Tax Increase (Decrease)
in Equity 2010 U.S. Dollar +100 ($1.12 million) $15.60 million -100 1.12 million (16.69 million) 2009 U.S. Dollar +100 ($1.63 million) $16.88 million -100 3.51 million (18.11 million) Philippine Peso +100 (P=3.49 million) P=– -100 3.49 million –
The effect of changes in interest rates in equity pertains to fair valuation of derivatives designated as under cash flows hedges and AFS financial assets and is exclusive of the impact of changes affecting First Gen Group’s consolidated statements of income.

- 68 -
*SGVMC311282*
Foreign Currency Risk First Gen Group’s exposure to foreign currency risk arises as the functional currency of the Parent Company and certain subsidiaries, the U.S. dollar, is not the local currency in its country of operations. Certain financial assets and liabilities as well as some costs and operating expenses, are denominated in Philippine peso or in European euro. To manage the foreign currency risk, First Gen Group may consider entering into derivative transactions, as necessary. As of December 31, 2010 and 2009, the Parent Company has not entered into any derivative transactions to cover the foreign exchange fluctuations. Moreover, the Parent Company has fully paid its Philippine peso bonds in July 2010, thus its exposure to foreign exchange fluctuations has been significantly reduced. The following table sets out the Philippine peso-denominated and Euro-denominated financial assets and liabilities as of December 31, 2010 and 2009 that may affect the consolidated financial statements of First Gen Group (amounts in millions):
2010 2009
Philippine Peso-
denominated Balances
Euro-denominated
Balances
Equivalent U.S. Dollar
Balances
Philippine Peso-
denominated Balances
Equivalent U.S. Dollar
Balances Financial Assets Loans and receivables: Cash and cash equivalents P=1,607.4 €– $36.7 P=1,384.2 $30.0 Receivables 800.9 – 18.3 395.7 8.6 2,408.3 – 55.0 1,779.9 38.6 AFS financial assets 32.5 – 0.7 24.3 0.5 Total financial assets 2,440.8 – 55.7 1,804.2 39.1 Financial Liabilities Loans and borrowings: Accounts payable and accrued expenses 1,422.8 7.9 43.0 1,496.2 32.4 Due to related parties 15.8 – 0.4 16.8 0.4 Long-term debt including current portion 5,699.0 – 130.0 5,333.7 115.5 Bonds payable – – – 5,000.0 108.2 Total financial liabilities 7,137.6 7.9 173.4 11,846.7 256.5 Net financial liabilities P=4,696.8 €7.9 $117.7 P=10,042.5 $217.4
In translating these Philippine peso-denominated assets and liabilities into U.S. dollar, the exchange rates used were P=43.84 to $1.00 and P=46.20 to $1.00, the Philippine peso-U.S. dollar exchange rates as of December 31, 2010 and 2009, respectively. In translating the Euro-denominated monetary liabilities to U.S. Dollar, the exchange rate used was €1.33 to $1.00, which represents the Euro-U.S. Dollar average closing exchange rate as of December 31, 2010.
The following table sets out, for the years ended December 31, 2010 and 2009, the impact of the range of reasonably possible movement in the U.S. dollar, European euro and Philippine peso exchange rates with all other variables held constant, First Gen Group’s income before income tax and equity (due to changes in the fair value of monetary assets and liabilities): 2010 2009
Change in Exchange Rate (in Philippine Peso against
U.S. Dollar)
Change in Exchange Rate (in European Euro against
U.S. Dollar)
Change in Exchange Rate (in Philippine Peso against
U.S. Dollar) 6% (6%) 5% (5%) 10% (10%) (Amounts in Millions)
Increase (decrease) in income before income tax ($6.4) $7.2 $0.3 ($0.3) ($19.9) $24.3
Increase (decrease) in equity (0.3) 0.4 – – (5.5) 0.1

- 69 -
*SGVMC311282*
The effect of changes in foreign currency rates in equity is exclusive of the impact of changes affecting First Gen Group’s consolidated statements of income.
Credit Risk
First Gen Group trades only with recognized, reputable and creditworthy third parties and/or transacts only with institutions and/or banks which have demonstrated financial soundness. It is First Gen Group’s policy that all customers who wish to trade on credit terms are subject to credit verification procedures. In addition, receivable balances are monitored on an ongoing basis and the level of the allowance account is reviewed on an ongoing basis to ensure that First Gen Group’s exposure to doubtful accounts is not significant.
With respect to credit risk arising from the other financial assets of First Gen Group, which comprise of cash and cash equivalents and trade and other receivables, First Gen Group’s exposure to credit risk arises from a possible default of the counterparties with a maximum exposure equal to the carrying amount of these instruments. As of December 31, 2010 and 2009, First Gen Group’s total financial assets amounted to $391.1 million and $347.3 million, respectively. These financial assets are neither past due nor impaired.
Credit Risk Exposure The table below shows the gross maximum exposure to credit risk of First Gen Group as of December 31, 2010 and 2009, without considering the effects of collaterals and other credit risk mitigation techniques:
2010 2009 Financial assets at FVPL
Option assets $4,189 $– Loans and receivables
Cash and cash equivalents (excludes cash on hand) 201,246 125,529 Receivables: Trade 71,305 89,486 Due from related parties 14,917 20,151 Receivables from Meralco on Annual Deficiency – 10,503 Others 1,281 1,194 Advances to non-controlling shareholder 97,242 99,719 Other current assets 155 144
Total loans and receivables 386,146 346,726 AFS financial assets
Investments in proprietary membership shares 741 526 $391,076 $347,252
Credit Quality of Financial Assets The evaluation of the credit quality of First Gen Group’s financial assets considers the payment history of the counterparties.
Financial assets are classified as ‘high grade’ if the counterparties are not expected to default in settling their obligations, thus, credit risk exposure is minimal. These counterparties normally include banks, related parties and customers who pay on or before due date. Financial assets are classified as ‘standard grade’ if the counterparties settle their obligations to First Gen Group with tolerable delays.

- 70 -
*SGVMC311282*
As of December 31, 2010 and 2009, all financial assets are viewed by management as ‘high grade’ considering the collectability of the receivables and the credit history of the counterparties.
Concentration of Credit Risk The Parent Company, through its operating subsidiaries FGP and FGPC, earns substantially all of its revenue from Meralco. Meralco is committed to pay for the capacity and energy generated by the San Lorenzo and Santa Rita power plants under the existing long-term PPAs which are due to expire in September 2027 and August 2025, respectively. While the PPAs provide for the mechanisms by which certain costs and obligations including fuel costs, among others, are passed-through to Meralco or are otherwise recoverable from Meralco, it is the intention of the Parent Company, FGP and FGPC to ensure that the pass-through mechanisms, as provided for in their respective PPAs, are followed.
Under the current regulatory regime, the generation rates charged by FGP and FGPC to Meralco are not subject to regulations and are complete pass-through charges to Meralco’s customers.
First Gen Group’s exposure to credit risk arises from default of the counterparties, with a maximum exposure equal to the carrying amounts of the receivables from Meralco, in the case of FGP and FGPC.
The table below shows the risk exposure with respect to credit concentration of First Gen Group as of December 31, 2010 and 2009:
2010 2009 Trade receivables from Meralco $71,171 $89,405 Receivables from Meralco on Annual Deficiency – 10,503 Total credit concentration risk $71,171 $99,908 Receivables $87,503 $110,831 Receivables from Meralco on Annual Deficiency – 10,503 Total receivables $87,503 $121,334 Credit concentration percentage 81.3% 82.3%
Liquidity Risk First Gen Group’s exposure to liquidity risk refers to the lack of funding needed to finance its growth and capital expenditures, service its maturing loan obligations in a timely fashion, and meet its working capital requirements. To manage this exposure, First Gen Group maintains its internally generated funds and prudently manages the proceeds obtained from fund-raising activities through the debt and equity markets. On a regular basis, First Gen Group’s Treasury Department monitors the available cash balances by preparing cash position reports. First Gen Group maintains a level of cash and cash equivalents deemed sufficient to finance the operations.
In addition, First Gen Group has short-term deposits and has available credit lines with certain banking institutions. FGP and FGPC, in particular, each maintain a Debt Service Reserve Account to sustain the debt service requirements for the next payment period. As part of its liquidity risk management, First Gen Group regularly evaluates its projected and actual cash flows. It also continuously assesses the financial market conditions for opportunities to pursue fund raising activities.
As of December 31, 2010 and 2009, 29.56% and 17.4% respectively of First Gen Group’s debt will mature in less than a year based on the carrying value of borrowings reflected in the consolidated financial statements.

- 71 -
*SGVMC311282*
As of December 31, 2010, the contractual undiscounted cash flows from cash and cash equivalents and trade receivables, which are short-term in nature, used for liquidity purposes amounted to $201.3 million and $71.3 million, respectively (see Notes 6 and 7). As of December 31, 2009, the contractual undiscounted cash flows from cash and cash equivalents and trade receivables, which are short-term in nature, used for liquidity purposes amounted to $125.5 million and $89.5 million, respectively (see Notes 6 and 7).
The tables below summarize the maturity profile of First Gen Group’s financial liabilities as of December 31, 2010 and 2009 based on the contractual undiscounted payments:
2010
On
Demand Less than 3 Months
3 to 12 Months
Over 1 Year up to 5 Years
Over 5 Years Total
Accounts payable and accrued expenses* $19,104 $43,672 $– $– $– $62,776
Due to related parties 6,709 – – – – 6,709 Bonds payable – 217,360 – – – 217,360 Long-term debt – 1,843 91,293 514,778 372,834 980,748 Total loans and borrowings 25,813 262,875 91,293 514,778 372,834 1,267,593 Derivative contract receipts – – (9,245) (30,181) (33,940) (73,366) Derivative contract payments – – 22,713 71,635 42,497 136,845 Total financial liability accounted for as
cash flow hedges – – 13,468 41,454 8,557 63,479 $25,813 $262,875 $104,761 $556,232 $381,391 $1,331,072
*Excluding output VAT, local and other taxes and payables to government agencies.
2009
On
Demand Less than 3 Months
3 to 12 Months
Over 1 Year up to 5 Years
Over 5 Years Total
Accounts payable and accrued expenses* $42,524 $24,034 $– $– $– $66,558
Due to related parties 6,711 – – – – 6,711 Bonds payable – 6,389 121,010 303,836 – 431,235 Long-term debt – – 101,134 651,274 574,582 1,326,990 Obligations to Gas Sellers on Annual
Deficiency – – 9,378 – – 9,378 Total loans and borrowings 49,235 30,423 231,522 955,110 574,582 1,840,872 Derivative contract receipts – – (1,857) (114,737) (92,386) (208,980) Derivative contract payments – – 3,449 100,535 57,194 161,178 Total financial liability accounted for as
cash flow hedges – – 1,592 (14,202) (35,192) (47,802) $49,235 $30,423 $233,114 $940,908 $539,390 $1,793,070
*Excluding output VAT, local and other taxes and payables to government agencies.
Fair Value Hierarchy of Financial Assets and Liabilities The table below summarizes the fair value hierarchy of First Gen Group’s financial assets and liabilities that are recorded at fair value. The hierarchy of these assets and liabilities are based on the inputs used to derive the fair value of such financial assets and liabilities and are categorized as follows:
a) Level 1 category includes financial assets and liabilities whose fair value is based on quoted market price in active markets for identical assets and liabilities;
b) Level 2 category includes financial assets and liabilities whose fair value uses inputs other than quoted prices included in Level 1 that are observable for the asset or liability, either directly (as prices) or indirectly (derived from prices); and

- 72 -
*SGVMC311282*
c) Level 3 category includes those financial assets and liabilities whose fair value is derived using inputs that are not based on observable market data.
2010 Fair Value Level 1 Level 2 Level 3 Financial assets accounted for at FVPL -
Option assets $4,189 $– $4,189 $– Financial liabilities accounted for as cash flow hedges -
Derivative liabilities $39,911 – 39,911 –
2009 Fair Value Level 1 Level 2 Level 3 Financial liabilities accounted for at FVPL -
Derivative liabilities $1,732 $– $– $1,732 Financial liabilities accounted for as cash flow hedges -
Derivative liabilities 23,603 – 23,603 – For the years ended December 31, 2010 and 2009, there were no transfers between Level 1 and Level 2 fair value measurements and no transfers into and out of Level 3 fair value measurements. The financial instrument classified under Level 3 pertains to the derivative liability from embedded derivatives on CBs. This was classified as such because of the credit spread used as input to the fair value calculation of the embedded derivatives which was assessed by First Gen Group as having a significant impact to its fair value. The fair value changes of the embedded derivatives on CBs are shown in Note 28 to the consolidated financial statements of First Gen Group. In 2009, to assess the impact of the credit spreads used, First Gen Group performed a sensitivity analysis using an assumed increase/(decrease) in the credit spread, the results of which are shown below:
Increase/(Decrease) in credit spread
Change in fair value of embedded derivatives
100 bps ($2,959) (100 bps) 3,006
Capital Management The primary objective of First Gen Group’s capital management is to ensure that it maintains a strong credit rating and healthy capital ratios in order to support its business, and maximize shareholder value.
First Gen Group manages its capital structure and makes adjustments to it, in light of changes in business and economic conditions. To maintain or adjust the capital structure, First Gen Group may adjust the dividend payment to shareholders, return capital to shareholders or issue new stocks (see Note 19). No changes were made in the objectives, policies or processes for the years ended December 31, 2010 and 2009.

- 73 -
*SGVMC311282*
First Gen Group monitors capital using a debt-to-equity ratio which is total long term-debt (net of debt issue costs) divided by total long-term debt plus total equity. First Gen Group’s practice is to keep the debt-to-equity ratio lower than 75:25.
2010 2009 Accounts payable and other liabilities* $140,571 $168,504 Bonds payable 213,283 385,337 Long-term debt 789,180 746,823 Obligations to Gas Sellers on Annual Deficiency – 9,378 Total debt $1,143,034 $1,310,042 Equity attributable to the equity holders of the
Parent Company $989,296 $663,034 Non-controlling interests 158,673 144,003 Total equity $1,147,969 $807,037 Total debt and equity $2,291,003 $2,117,079 Debt-to-equity ratio 50:50 62:38 * Excluding deferred income tax liabilities and derivative liabilities
First Gen Group’s subsidiaries are obligated to perform certain covenants with respect to maintaining specified debt-to-equity and minimum debt-service-coverage ratios, as set forth in their respective agreements with the creditors. As of December 31, 2010 and 2009, First Gen Group is in compliance with those covenants.
28. Financial Instruments
Set out below is a comparison by category of the carrying values and fair values of First Gen Group’s financial instruments as at December 31, 2010 and 2009 that are carried in the consolidated financial statements:
2010 2009
Carrying
Value Fair Value Carrying
Value Fair Value Financial Assets Financial assets at FVPL - Option assets $4,189 $4,189 $– $– Loans and receivables: Cash and cash equivalents 201,251 201,251 125,531 125,531 Receivables: Trade 71,305 71,305 89,486 89,486 Due from related parties 14,917 14,917 20,151 20,151
Receivables from Meralco on Annual Deficiency – – 10,503 9,997
Others 1,281 1,281 1,194 1,194 Advances to non-controlling
shareholder 97,242 91,268 99,719 92,615 Other current assets 155 155 144 144 Total loans and receivables 386,151 380,177 346,728 339,118 AFS financial assets - Investments in proprietary
membership shares 741 741 526 526 $391,081 $385,107 $347,254 $339,644 (Forward)

- 74 -
*SGVMC311282*
2010 2009
Carrying
Value Fair Value Carrying
Value Fair Value
Financial Liabilities Financial liabilities at FVPL - Derivative liabilities $– $– $1,732 $1,732 Loans and borrowings: Accounts payable and accrued
expenses* 73,151 73,151 79,733 79,733 Due to related parties 6,709 6,709 6,711 6,711 Bonds payable 213,283 213,283 385,337 397,150 Long-term debt 789,180 804,916 746,823 751,891 Obligations to Gas Sellers on
Annual Deficiency – – 9,378 9,378 Total loans and borrowings 1,082,323 1,098,059 1,227,982 1,244,863 Financial liability accounted for as
cash flow hedges - Derivative liabilities 39,911 39,911 23,603 23,603 $1,122,234 $1,137,970 $1,253,317 $1,270,198 *Excluding output VAT, local and other taxes and payables to government agencies
Fair Value and Categories of Financial Instruments The fair values of cash and cash equivalents, current portion of receivables, other current assets, accounts payable and accrued expenses, and due to related parties approximate the carrying values at financial reporting date, due to the short-term maturities of the transactions.
AFS financial assets For equity instruments that are not quoted, the investments are carried at cost less allowance for impairment losses due to the unpredictable nature of future cash flows and the lack of suitable methods of arriving at a reliable fair value.
FGP and FGPC long-term debt, advances to non-controlling shareholder, receivables from Meralco on Annual Deficiency and obligations to Gas Sellers on Annual Deficiency The fair values of long-term debt and advances to non-controlling shareholder were computed by discounting the instruments’ expected future cash flows using the prevailing credit adjusted USD interest rates ranging from 0.2825% to 4.0803% as of December 31, 2010.
The fair values of long-term debt, advances to non-controlling shareholder, receivables from Meralco on Annual Deficiency and obligations to Gas Sellers on Annual Deficiency were computed by discounting the instruments’ expected future cash flows using the prevailing credit adjusted USD interest rates ranging from 0.2900% to 4.5577% as of December 31, 2009.
Unified and Parent Company long-term debts The fair values of Unified and Parent Company Philippine peso-denominated long-term debts were computed by discounting the instruments’ expected future cash flows using the prevailing credit adjusted PHP interest rates on December 31, 2010 and 2009, ranging from 0.9520% to 4.926% and 3.8447% to 5.6730%, respectively. The fair values of the Parent Company U.S. dollar-denominated long-term debts were computed by discounting the instruments’ expected future cash flows using the prevailing credit adjusted USD interest rates on December 31, 2010 ranging from 0.139% to 2.067%.

- 75 -
*SGVMC311282*
Peso bonds payable The fair value of the Peso bonds payable was computed by discounting the bonds’ expected future cash flows using the prevailing credit adjusted PHP interest rates for the Peso Bonds as of December 31, 2009 ranging from 4.07% to 4.79%.
The fair value of the CBs was computed using credit adjusted USD zero coupon yield interest rates ranging from 0.051% to 1.160% on December 31, 2009.
The fair value of freestanding derivative assets and liabilities are based on counterparty valuation. The fair value of embedded derivatives in CBs and option assets are based on valuation technique which makes use of the market observable inputs (except for the 8.75% credit spread in the 2009 valuation of the embedded derivatives in CBs).
Derivative Financial Instruments First Gen Group enters into derivative transactions such as interest rate swaps to hedge its interest rate risk arising from its floating rate borrowings and equity call options to avail of investments at a fixed price for a three year period. These derivatives (including embedded derivatives) are accounted for either as Derivatives not designated as accounting hedges or Derivatives designated as accounting hedges.
The table below shows the fair value of First Gen Group’s outstanding derivative financial instruments, reported as assets or liabilities, together with their notional amounts as of December 31, 2010 and 2009 (amounts in millions). The notional amount is the basis upon which changes in the value of derivatives are measured.
2010 2009
Derivative
Asset Derivative Liabilities
Notional Amount/ Quantity
Derivative Liabilities
Notional Amount/ Quantity
Derivatives Designated as Accounting Hedges
Freestanding derivatives - Interest rate swaps $– $39.91 $443.82 $23.6 $459.0 Derivatives not Designated as
Accounting Hedges
Embedded derivatives - Embedded derivatives on CBs – – 113.5 1.7 260.0 Freestanding derivatives - Option assets 4.2 – 585 shares – – Total derivatives $4.2 $39.91 $25.3 Presented as: Current $1.6 $– $– $– $– Noncurrent 2.6 39.91 – 25.3 – Total derivatives $4.2 $39.91 $– $25.3 $–
Derivatives not Designated as Accounting Hedges First Gen Group’s derivatives not designated as accounting hedges include embedded derivatives in host financial and non-financial contracts and freestanding derivatives used to economically hedge certain exposures but were not designated by Management as accounting hedges. Such derivatives are classified as at FVPL with changes in fair value directly taken to consolidated statements of income.

- 76 -
*SGVMC311282*
Option assets On April 19, 2010, the Parent Company entered into Call Option Agreements to purchase EDC shares totaling to 585.0 million for a total option consideration of P=1.3 million ($0.03 million). These call options may be exercised at the applicable exercise prices as follows:
Exercise dates Exercise price From April 20, 2010 to April 19, 2011 P=5.67 per share From April 20, 2011 to April 19, 2012 P=6.19 per share From April 20, 2012 to April 19, 2013 P=6.76 per share
The exercise price shall be subject to cash and stock dividend adjustments. The call options are exercisable within three years as follows: (a) all the subject shares during the first exercise year; (b) remaining two-thirds of the subject shares during the second exercise year; and (c) last 1/3 of the subject shares during the third year.
The call options were valued using the binomial model. This valuation technique considers the probability of EDC’s share price moving up or down depending on the volatility, the risk free rates, expected dividend yield and the share price as of the valuation date. As of December 31, 2010, EDC’s share price is at P=5.87 per share and the fair value of the option assets amounted to $4.2 million (P=183.7 million). The movements in the option assets account as of December 31, 2010 are as follows:
Amount in
Philippine Peso Equivalent Amount
in U.S. Dollar Call option consideration P=1,250 $27 Fair value changes during the year 182,412 3,905 Foreign exchange differences – 257
P=183,662 $4,189
The net changes in fair value and net foreign exchange differences during the year were taken to the “Mark-to-market gain (loss) on derivatives” and “Foreign exchange gain (loss)” accounts, respectively, in the 2010 consolidated statement of income.
Embedded Derivatives in CBs As discussed in Note 15, at inception, multiple embedded derivatives in the CBs were bifurcated. The fair value of the embedded equity conversion, call and put options in the CBs issued by the Parent Company was computed using the indirect method of valuing multiple embedded derivatives. This valuation method compares the fair value of the option-free bond against the fair value of the bond as quoted in the market. The difference in the fair values is assigned as the fair value of the embedded derivatives. As of December 31, 2010 and 2009, the negative fair values of the embedded derivatives amounted to nil and $1.7 million, respectively, using credit-adjusted U.S. dollar risk-free rates ranging from 0.051% to 2.220% in 2009.
The table below summarizes the net movements in the fair values of the multiple embedded derivatives as of December 31, 2010 and 2009:
2010 2009 Fair value at beginning of year ($1,732) ($810) Fair value of options exercised during the year 242 – Net changes in fair value during the year 1,490 (922) Balance at end of year $– ($1,732)

- 77 -
*SGVMC311282*
The net changes in fair value during the year were taken to the “Mark-to-market gain (loss) on derivatives” account in the consolidated statements of income.
Derivatives Designated as Accounting Hedges First Gen Group has interest rate swaps accounted for as cash flow hedges of its floating rate loans. Under a cash flow hedge, the effective portion of changes in fair value of the hedging instrument is recognized as cumulative translation adjustments in other comprehensive income (loss) until the hedged item affects earnings.
Cash Flow Hedge - FGPC On November 14, 2008, FGPC entered into eight interest rate swap agreements with the following hedge providers: Société Générale (Singapore Branch), Bayerische Hypo-und Vereinsbank AG (Hong Kong Branch), Calyon and Standard Chartered Bank. On the same date, FGPC designated the interest rate swaps as hedges of the cashflow variability of the Covered and Uncovered Facilities, attributable to the movements in the six-month LIBOR (see Note 16).
Under the four interest rate swap agreements that hedge 100% of the Covered Facility, FGPC pays a fixed rate of 4.4025% and receives 6-month U.S. LIBOR on the aggregate amortizing notional amount of $312.0 million, simultaneous with the interest payments every May and November on the hedged loan. The notional amounts of the interest rate swaps are amortizing based on the repayment schedule of the hedged loan. The interest rate swap agreements have a term of 12 ½ years and will mature on May 10, 2021 (coinciding with the maturity of the hedged loan).
Under the four interest rate swap agreements that hedge 75% of the Uncovered Facility, FGPC pays a fixed rate of 4.0625% and receives 6-month U.S. LIBOR on the aggregate amortizing notional amount of $141.0 million, simultaneous with the interest payments every May and November on the hedged loan. The notional amounts of the interest rate swaps are amortizing based on the repayment schedule of the hedged loan. The interest rate swaps have a term of 8 ½ years and will mature on May 10, 2017 (coinciding with the maturity of the hedged loan).
As of December 31, 2010 and 2009, the aggregate fair value of the interest rate swaps that was deferred to cumulative translation adjustments amounted to $26.7 million (net of related deferred tax effect of $11.4 million) and $15.1 million (net of related deferred tax effect of $6.5 million), respectively. For the years ended December 31, 2010 and 2009, the net losses and net gains from the changes in the fair value of the interest rate swaps recognized in the statements of comprehensive income amounted to $11.6 million and $24.2 million, respectively.
Cash Flow Hedge - FGP In 2002, FGP entered into an interest rate swap agreement with ABN AMRO Bank NV to hedge half of its floating rate exposure on its ECGD Facility Agreement (see Note 16). Under the interest rate swap agreement, FGP pays a fixed rate of 7.475% and receives a floating rate of U.S. LIBOR plus spread of 215 basis points, on a semi-annual basis, simultaneous with the interest payments every June and December on the hedged loan. The notional amount of the interest rate swap is amortizing based on the repayment schedule of hedged loan. The interest rate swap agreement will mature in December 2014 (coinciding with the maturity of the hedged loan). As of December 31, 2010 and 2009, the fair value of the interest rate swap that was deferred to cumulative translation adjustments amounted to $1.2 million (net of related deferred income tax effect of $0.5 million) and $1.4 million (net of related deferred income tax effect of $0.6 million), respectively. For the years ended December 31, 2010 and 2009, the net gains and net losses from the change in the fair value of the interest rate swap recognized in the statements of comprehensive income amounted to $0.2 million and $0.6 million, respectively.

- 78 -
*SGVMC311282*
There was no ineffectiveness recognized in the consolidated statements of income for each of the three years in the period ended December 31, 2010.
The outstanding aggregate notional amount and the related mark-to-market losses of the interest rate swaps designated as cash flow hedges as of December 31, 2010 and 2009 are as follows:
2010 2009 Notional amount $443,818 $458,975 Mark-to-market losses 39,911 23,603
The net movements in the fair value of derivative transactions are as follows:
2010 2009 Fair value at beginning of year ($23,603) ($59,051) Fair value change taken into other comprehensive
income (loss) during the year (33,800) 22,812 Fair value change realized during the year 17,492 12,636 Fair value at end of year (39,911) (23,603) Deferred income tax effect on cash flow hedges
(see Note 25) 11,973 7,081 Fair value deferred into equity ($27,938) ($16,522)
Fair value changes during the year are recorded in the consolidated statement of comprehensive income, net of deferred income tax, under the “Cumulative translation adjustments” account in the consolidated statements of financial position. The fair value change realized during the year was taken into the “Interest expense and financing charges” account in the consolidated statements of income. This pertains to the net difference between the fixed interest paid/accrued and the floating interest received/accrued on the interest rate swap agreements as at financial reporting date.
Reconciliation of Net Fair Value Changes on Derivatives The table below summarizes the mark-to-market gain (loss) on First Gen Group’s derivative instruments recognized under the “Mark-to-market gain (loss) on derivatives” account in the consolidated statements of income:
2010 2009 Freestanding derivatives - Option assets $3,905 $– Embedded derivatives -
Multiple derivatives in CBs 1,490 (922) Total $5,395 ($922)
29. Significant Contracts, Franchise, Commitments and Contingencies
a. Power Purchase Agreements
FGP and FGPC FGP and FGPC each have an existing PPA with Meralco, the largest power distribution company operating in the island of Luzon and the Philippines and the sole customer of both companies. Under the PPA, Meralco will purchase in each Contract Year from the start of commercial operations, a minimum number of kWh of the net electrical output of FGP and FGPC for a period of 25 years. Billings to Meralco under the PPA are substantially in U.S. dollar and a small portion is billed in Philippine peso.

- 79 -
*SGVMC311282*
On January 7, 2004, Meralco, FGP and FGPC signed the Amendment to their respective PPAs. The negotiations resulted in a package of concessions including the assumption of FGP and FGPC of community taxes at current tax rate, while conditional concessions include increasing the discounts on excess generation, payment of higher penalties for non-performance up to a capped amount, recovery of accumulated deemed delivered energy until 2011 resulting in the non-charging of Meralco of excess generation charge for such energy delivered beyond the contracted amount but within a 90% capacity quota. The amended terms under the respective PPAs of FGP and FGPC were approved by the Energy Regulatory Commission (ERC) on May 31, 2006.
Under the respective PPAs of FGP and FGPC, the fixed capacity fees and fixed operating and maintenance fees are recognized monthly based on the actual NDC tested and proven, which is usually conducted on a semi-annual basis. Total fixed capacity fees and fixed operating and maintenance fees amounted to $288.4 million in 2010, $286.2 million in 2009 and $288.8 million in 2008. Total value of power sold to Meralco by FGP and FGPC (which already includes the fixed capacity fees and fixed operating and maintenance fees mentioned above) amounted to $1,168.3 million in 2010, $1,009.1 million in 2009 and $1,211.1 million in 2008.
FG Bukidnon On January 9, 2008, FG Bukidnon and Cagayan Electric Power and Light Co., Inc. (CEPALCO), an electric distribution utility operating in the City of Cagayan de Oro, signed a Power Supply Agreement (PSA) for the FG Bukidnon plant. Under the PSA, FG Bukidnon shall generate and deliver to CEPALCO and CEPALCO shall take, or pay for if not taken, the Available Energy for a period commencing on the commercial operations date until March 28, 2025. The terms and conditions of the PSA are still subject to the review by the ERC and the effectivity and commercial operations date of the PSA will coincide with the date of ERC approval of the agreement. The sale to CEPALCO of the plant’s output since March 29, 2005 has been governed by a MOA signed by both parties in 2005.
On February 15, 2010, FG Bukidnon received the decision from ERC dated November 16, 2009 which modified some of the terms of the PSA. On March 2, 2010, FG Bukidnon filed a Motion for Reconsideration (MR) with the ERC. While still awaiting the ERC’s reply to the MR, FG Bukidnon applied the ERC’s revised rate for its sale to CEPALCO starting March 2010.
On September 9, 2010, FG Bukidnon received the ERC order dated August 16, 2010 partially approving FG Bukidnon’s MR. This approved tariff is used starting September 2010.
FG Hydro FG Hydro has existing contracts, which were originally transferred by NPC to FG Hydro as part of the acquisition of PAHEP/MAHEP for the supply of electric energy with several customers within the vicinity of Nueva Ecija. All of these contracts had expired as of December 31, 2010. Upon renegotiation with the customers and due process as stipulated by the ERC, the expired contracts were renewed except for the contract with Pantabangan Municipal Electric System (PAMES). FG Hydro shall generate and deliver to these customers the contracted energy on a monthly basis. FG Hydro is bound to service these customers for the remainder of the stipulated terms, the range of which falls between December 2007 and December 2020.

- 80 -
*SGVMC311282*
Upon expiration, these contracts may be renewable upon renegotiation with the customers and due process as stipulated by the ERC. As of December 31, 2010, there are five remaining power supply contracts being serviced by FG Hydro. Details of the existing contracts of FG Hydro are as follows:
Related Contract Expiry Date Other Development Nueva Ecija II Electric Cooperative, Inc., Area 2 (NEECO II-Area 2)
December 25, 2016 The ERC granted a provisional approval on the Power Supply Agreement between FG Hydro and NEECO II-Area 2 on August 2, 2010 with a pending final resolution of the application for the approval thereof.
PAMES December 25, 2008 There is no new agreement between FG Hydro and PAMES yet. In the meantime, FG Hydro has continued to supply electricity to PAMES on a month-to-month basis.
Nueva Ecija I Electric Cooperative, Inc. (NEECO I)
December 25, 2012 FG Hydro and NEECO I signed a new agreement in December 2007 for the supply of electricity for the next five years. The ERC has provisionally approved this agreement pending final resolution of the application for the approval thereof.
Edong Cold Storage and Ice Plant December 25, 2020 A new agreement was signed by FG Hydro and ECOSIP in November 2010 for the supply of power in the succeeding ten years.
National Irrigation Administration (NIA)-Upper Pampanga River Integrated Irrigation System
October 25, 2020 FG Hydro and NIA-UPRIIS signed a new agreement in October 2010 for the supply of power in the succeeding ten years.
EDC EDC has existing PPAs with NPC for the development, construction and operation of a geothermal power plant by EDC in the service contract areas and the sale to NPC of the electrical energy generated from such geothermal power plants. The PPA provides, among others, that NPC pays EDC a base price per kWh of electricity delivered subject to inflation adjustments. The PPAs are for a period of 25 years of commercial operations and may be extended upon the request of EDC by notice of not less than 12 months prior to the end of contract period, the terms and conditions of any such extension to be agreed upon by the parties.
Details of the existing PPAs are as follows:
Contract Area Contracted Annual Energy End of Contract Leyte-Cebu Leyte-Luzon
1,370 gigawatt-hour (GWh) 3,000 GWh
July 2021 July 2022
47 MW Mindanao I 330 GWh for the 1st year and 390 GWh for the succeeding years
March 2022
48.25 MW Mindanao II 398 GWh June 2024
The PPA for Leyte-Cebu-Luzon service contract stipulates a nominated energy of not lower than 90% of the contracted annual energy.
On November 12, 1999, NPC agreed to accept from EDC a combined average annual nominated energy of 4,455 GWh for the period July 25, 1999 to July 25, 2000 for Leyte-Cebu and Leyte-Luzon PPA. However, the combined annual nominated energy starting July 25, 2000 is currently under negotiation with NPC. The contracts are for a period of 25 years commencing in July 1996 for Leyte-Cebu and July 1997 for Leyte-Luzon.

- 81 -
*SGVMC311282*
Green Core Geothermal Inc. (GCGI) With GCGI’s takeover of Palinpinon and Tongonan power plants effective October 23, 2009, following is the table that summarizes the terms of GCGI’s existing PSAs and Transition Supply Contracts (TSCs):
Customers Contract Expiration
Palinpinon V.M.C. Rural Electric Service Cooperative, Inc. (VRESCO) December 25, 2010 Central Negros Electric Cooperative, Inc. (CENECO) December 25, 2010 Dynasty Management Development Corp. (DMDC) March 15, 2016 Aklan Electric Cooperative, Inc. (AKELCO) December 25, 2009 Guimaras Electric Cooperative, Inc. (GUIMELCO) December 25, 2012 Iloilo I Electric Cooperative, Inc. (ILECO I) December 25, 2009 Philippine Foremost Milling Corp. (PFMC) March 25, 2016 Iloilo Provincial Government (IPG) December 25, 2011
Tongonan Don Orestes Romualdez Electric Cooperative, Inc.
(DORELCO) September 25, 2010
Leyte II Electric Cooperative, Inc. (LEYECO II) December 25, 2009 Philippine Phosphate Fertilizer Corp. (PHILPHOS) December 25, 2011 Philippine Associated Smelting and Refining Corp. (PASAR) September 25, 2009
At the end of 2010, five of the 12 NPC TSC assigned to GCGI remain effective, namely DMDC, GUIMELCO, PFMC, IPG and PHILPHOS. Since GCGI’s takeover of the power plants, 15 new PSAs have been signed as follows:
Customers Contract Start Contract Expiration
Leyte Don Orestes Romualdez Electric Cooperative, Inc. (DORELCO)
Dec. 26, 2010 Dec. 25, 2020
Leyte II Electric Cooperative, Inc. (LEYECO II) Dec. 26, 2010 Dec. 25, 2020 Leyte V Electric Cooperative, Inc. (LEYECO 5) Dec. 26, 2010 Dec. 25, 2020 Philippine Associated Smelting and Refining Corporation (PASAR)
Oct. 24, 2009 Dec. 25, 2012
Cebu Visayan Electric Company, Inc. (VECO) Dec. 26, 2010 Dec. 25, 2015 Balamban Enerzone Corporation (BEZ) Dec. 26, 2010 Dec. 25, 2015 Negros Occidental Electric Cooperative, Inc. (NOCECO)
Dec. 26, 2010 Dec. 25, 2020
Negros Oriental I Electric Cooperative, Inc. (NORECO 1)
Dec. 26, 2010 Dec. 25, 2020
Negros Oriental II Electric Cooperative, Inc. (NORECO 2)
Dec. 26, 2010 Dec. 25, 2020
VMC Rural Electric Service Cooperative, Inc. (VRESCO)
Dec. 26, 2010 Dec. 25, 2020
Dumaguete Coconut Mills, Inc. (DUCOM) Oct. 26, 2010 Oct. 25, 2020 Panay
Aklan Electric Cooperative, Inc. (AKELCO) March 26, 2010 Dec. 25, 2020 Capiz Electric Cooperative, Inc. (CAPELCO) Jan. 27, 2010 Dec. 25, 2020 Iloilo I Electric Cooperative, Inc. (ILECO 1) March 26, 2010 Dec. 25, 2022a Iloilo II Electric Cooperative, Inc. (ILECO 2) Dec. 26, 2010 Dec. 25, 2020
a GCGI has already submitted to ERC last November 15, 2010 the application for the approval of the PSA between ILECO 1 and GCGI.
For the other distribution utility customers, preparations are on-going for the filing of the applications for the approval of the PSAs with the ERC.

- 82 -
*SGVMC311282*
b. Stored Energy Commitment of EDC On various dates, EDC entered into Addendum Agreements to the PPA for Unified Leyte Project and Geothermal Resources Sales Contact (GRSC) for BacMan 2 projects, where any excess generation above the nominated energy or take-or-pay volume will be credited against payments made by NPC for the periods it was not able to take electricity or steam, where applicable. As of December 31, 2010, the commitment for stored energy follows (in GWh):
Contract Area Stored Energy Unified Leyte 4,326.6 BacMan II - Cawayan 671.9
c. Geothermal Service Contracts (GSC)/Geothermal Renewable Energy Service Contracts (GRESC) of EDC
By virtue of Presidential Decree (P.D.) No. 1442, EDC entered into seven GSCs with the Philippine Government through the DOE granting EDC the right to explore, develop, and utilize the country’s geothermal resource subject to sharing of net proceeds with the Philippine Government. The net proceeds is what remains after deducting from the gross proceeds the allowable recoverable costs, which include development, production and operating costs. The allowable recoverable costs shall not exceed 90% of the gross proceeds. EDC pays 60% of the net proceeds as share of the Philippine Government and retains the 40%.
R.A. 9513, “An Act Promoting the Development, Utilization and Commercialization of Renewable Energy Resources and for Other Purposes,” otherwise known as the “Renewable Energy Act of 2008” or the “RE Act”, mandates the conversion of existing service contracts under P.D. 1442 into RE Service Contracts to avail of the incentives under the RE Law. EDC submitted its letter of intent to register with the DOE as an RE Developer on May 20, 2009 and the conversion contracts negotiation with the DOE started in August 2009.
On September 10, 2009, EDC was granted the Provisional Certificate of Registration as an RE Developer for the following existing projects: (1) GSC No. 01- Tongonan, Leyte, (2) GSC No. 02 - Palinpinon, Negros Oriental, (3) GSC No. 03 - Bacon-Manito, Sorsogon/Albay, (4) GSC No. 04 - Mt. Apo, North Cotabato, and (5) GSC No. 06 - Northern Negros.
With the receipt of the certificates of provisional registration as geothermal RE Developer, the fiscal incentives of the RE Act was implemented by EDC retroactive from the effective date of the RE Act. Thus, the incentives provided by P.D. 1442 are effective until January 2009. The GSCs were fully converted to GRESCs upon signing of the parties on October 23, 2009; thereby EDC is now the holder of five (5) GRESCs and the corresponding DOE Certificate of Registration for the following geothermal production fields: (1) GRESC 2009-10-001 for Tongonan, Leyte; (2) GRESC 2009-10-002 for Palinpinon, Negros Oriental; (3) GRESC 2009-10-003 for Bacon-Manito, Sorsogon/Albay; (4) GRESC 2009-10-004 for Kidapawan, North Cotabato; and (5) GRESC 2009-10-005 for Northern Negros.
The DOE approved the application of EDC for the 20-year extension of the Tongonan, Palinpinon and Bacon-Manito GSCs. The extension is embodied in the fourth amendment to the GSCs dated October 30, 2003. The amendment extended the Tongonan GSC from May 15, 2011 to May 16, 2031, while the Palinpinon and Bacon-Manito GSCs are extended from October 16, 2011 to October 17, 2031.

- 83 -
*SGVMC311282*
d. Steam Sales Agreements (SSA) and GRSC of EDC
EDC has existing SSAs for the supply of the geothermal energy currently produced by its geothermal projects to the power plants owned and operated by NPC and GCGI. Under the SSA, NPC agrees to pay EDC a base price per kWh of gross generation for all the service contract areas, except for Tongonan I Project, subject to inflation adjustments, and based on a guaranteed TOP rate at certain percentage plant factor. NPC pays EDC a base price per kWh of net generation for Tongonan I Project. The SSA is for a period of 20 to 25 years.
Details of the existing SSAs are as follows:
Contract Area Guaranteed TOP End of Contract Tongonan I 75% plant factor June 2009 Palinpinon I 75% plant factor June 2009 Palinpinon II (covers four
modular plants) 50% for the 1st year, 65% for the 2nd year, 75% for the 3rd and subsequent years
December 2018 - March 2020
BacMan I 75% plant factor November 2013 BacMan II (covers two 20 MW modular plants)
50% for the 1st year, 65% for the 2nd year, 75% for the 3rd and subsequent years
March 2019 and December 2022
SSAs of Tongonan I, Palinpinon I and Palinpinon II remained effective until the turnover of the power plants to GCGI on October 23, 2009 [see Note 30(a)], at which time their respective GRSC became effective. Under the GRSCs which will terminate in 2031, GCGI agrees to pay EDC remuneration for actual net electricity generation of the plant with steam prices in U.S. dollars per kWh tied to coal indices.
e. Build-Operate-Transfer (BOT) Agreements of BPPC
BPPC has an existing Project Agreement with NPC. Under the Project Agreement, NPC supplies all the fuel required to generate electricity, with all electricity generated purchased by NPC. BPPC is entitled to payment of fixed capacity and operations and maintenance fees based on the nominated capacity as well as energy fees from the delivery of electric power to NPC. The Cooperation Period, which is the period within which BPPC shall operate and maintain the power plant, is 15 years which expired on July 25, 2010. Upon expiration of the 15-year period, BPPC shall transfer to NPC all of its rights, titles and interests in the power plant complex, free from liens created by BPPC and without any compensation.
In line with the Electric Power Industry Reform Act (EPIRA)-mandated Independent Power Producers (IPP) contracts review, PSALM, NPC and BPPC executed and signed in 2005 a General Framework Agreement (GFA) that embodied the renegotiated terms and conditions of the BOT Agreement. The GFA caps at 215 MW the Bauang plant’s nominated capacity and obligates BPPC to make the P=0.01/kWh contribution to an environment fund from the effective date of the GFA up to the end of Cooperation Period. Conversely, this paves way for allowing the heat run of the Bauang plant at 8.5 MW for one hour daily, except on weekends and holidays, during extended economic shutdown and the carryover of 50% of the plant’s unutilized downtime allowance up to three years. The GFA likewise permits the pursuit of bilateral contracts for ancillary services and the excess 10 MW capacity with National Transmission Corporation (TransCo) and power purchasers, respectively, under an income sharing arrangement subject to certain limitations and restrictions. The National Economic Development Authority (NEDA) approved the GFA on July 11, 2007.

- 84 -
*SGVMC311282*
Following the expiration of the Cooperation Period, BPPC turned-over the Bauang Plant to NPC on July 26, 2010 to mark the end of the Project Agreement. Through a Deed of Transfer executed between BPPC and NPC, BPPC transferred to NPC all its rights, titles and interests in the Bauang Plant, free of liens created by BPPC, without any compensation. On the same date, all rights, title and interests of BPPC in and to the fixtures, fittings, plant and equipment (including test equipment and special tools) and all improvements comprising the power plant were transferred to NPC on an “as is” basis. As part of the agreement, BPPC also transferred spare parts and lubricating oil inventory. Consequently, BPPC declared all organizational positions redundant and separated all employees, except for key officers.
f. Gas Sale and Purchase Agreements (GSPA)
FGP and FGPC each have an existing GSPA with the consortium of Shell Philippines Exploration B.V., Shell Philippines LLC, Chevron Malampaya, LLC and PNOC Exploration Corporation (collectively referred to as Gas Sellers), for the supply of natural gas in connection with the operations of the power plants. The GSPAs, now on their ninth Contract Year, are for a total period of approximately 22 years.
Total cost of natural gas purchased amounted to $230.0 million in 2010, $207.6 million in 2009 and $272.1 million in 2008 for FGP, and $457.0 million in 2010, $405.1 million in 2009 and $543.4 million in 2008 for FGPC.
Under the GSPA, FGP and FGPC are obligated to consume (or pay for, if not consumed) a minimum quantity of gas for each Contract Year (which runs from December 26 of a particular year up to December 25 of the immediately succeeding year), called the Take-Or-Pay Quantity (TOPQ). Thus, if the TOPQ is not consumed within a particular Contract Year, FGP and FGPC incur an “Annual Deficiency” for that Contract Year equivalent to the total volume of unused gas (i.e., the TOPQ less the actual quantity of gas consumed). FGP and FGPC are required to make payments to the Gas Sellers for such Annual Deficiency after the end of the Contract Year. After paying for Annual Deficiency gas, FGP and FGPC can, subject to the terms of the GSPA, “make-up” such Annual Deficiency by consuming the unused-but-paid-for gas (without further charge) within 10-Contract Year after the Contract Year for which the Annual Deficiency was incurred, in the order that it arose.
For Contract Year 2006, the Gas Sellers issued the Annual Reconciliation Statements (ARS) of FGP and FGPC on December 29, 2006. The Gas Sellers are claiming Annual Deficiency payments for Contract Year 2006 amounting to $3.9 million for FGP and $5.4 million for FGPC. Both FGP and FGPC disagree that such Annual Deficiency payments are due and each claimed for among others, relief due to events of force majeure (EFM) that affected the San Lorenzo and Santa Rita power plants, respectively. FGP’s and FGPC’s position is that the power plants actually consumed more than their respective TOPQs and are entitled to make-up its Outstanding Balance of Annual Deficiency.
Pursuant to the terms of the GSPA, the dispute on the above matter was subjected to arbitration in Hong Kong, SAR under the International Chamber of Commerce (ICC) Rules of Arbitration. The arbitral tribunal (“Tribunal”) rendered a Partial Final Award on August 11, 2009 which was received by FGP and FGPC on August 18, 2009. The Tribunal determined that the transmission related events claimed by FGP and FGPC constitute EFM under the GSPAs, and that, therefore, the companies can claim relief for those events that have

- 85 -
*SGVMC311282*
actually occurred subject to adjustments stipulated in the GSPAs. The Tribunal was not persuaded, however, that the government related events claimed by FGP and FGPC for Contract Year 2006 constitute EFM under the GSPAs based on the evidence presented.
On June 9, 2010, FGP, FGPC, and the Gas Sellers executed a Settlement Agreement (SA) to settle the GSPA dispute for Contract Year 2006. Under the terms of the SA, the Gas Sellers’ claims have been reduced to $1.3 million with interest amounting to $0.1 million (in the case of FGP) and $0.5 million with interest amounting to $0.1 million (in the case of FGPC) covering the original payment due date up to February 27, 2010. The payment of these amounts is by way of full, complete, absolute, and final settlement of the dispute and any and all Contract Year 2006 claims the Gas Sellers may have against FGP and FGPC. The total amount of $2.0 million was paid on July 29, 2010.
Also included in the June 9, 2010 SA is the GSPA amendment in which FGP, FGPC and the Gas Sellers agreed that where the Gas Sellers reschedule, reduce or cancel Scheduled Maintenance and fail to provide a rescheduling notice within the period required under clause 17.1.2 of the respective GSPAs of FGP and FGPC, Sellers shall be permitted, subject to clause 17.5, to carry forward to succeeding Contract Years the number of Days within the originally scheduled period where no actual maintenance is carried out by the Gas Sellers provided that Gas Sellers tender for delivery, and FGP and FGPC actually take, gas equivalent to at least 61.429 Terajoules (TJ) and 122.9 TJ for San Lorenzo and Santa Rita, respectively. FGP and the Gas Sellers likewise agreed that references to “the Base TOPQ divided by 350” in certain clauses of the San Lorenzo GSPA shall be replaced by “61.429 TJ”.
On September 15, 2010, FGP and FGPC received the Final Award by Consent rendered by the Tribunal on September 13, 2010, incorporating by reference the June 9, 2010 SA, including all exhibits thereto, and forming an inseparable part of the Final Award by Consent, as per FGP, FGPC, and the Gas Sellers, written request dated June 16, 2010 to the Tribunal and ICC.
g. Wind Energy Service Contract (WESC) of EDC
On September 14, 2009, EDC has entered into a WESC with the DOE granting EDC the right to explore and develop the Burgos wind project for a period of 25 years from effective date. The pre-development stage under the WESC shall be two years which can be extended for another one year if EDC has not been in default in its exploration or work commitments and has provided a work program for the extension period upon confirmation by the DOE. The WESC also provides that upon submission of the declaration of commercial viability, as confirmed by the DOE, the WESC shall remain in force during the remaining life of the 25-year of the WESC for the development/commercial stage. The DOE shall approve the extension of the WESC for another 25 years under the same terms and conditions, provided that EDC is not in default in any material obligations under the WESC, and has submitted a written notice to the DOE for the extension of the contract not later than one (1) year prior to the expiration of the 25-year period. The WESC provides that all materials, equipment, plants and other installations erected or placed on the contract area by EDC shall remain the property of EDC throughout the term of the contract and after its termination.

- 86 -
*SGVMC311282*
In 2010, EDC has entered into five WESCs with the DOE for the following contract areas:
Projects DOE Certificates
1. Pagudpud Wind Project Under DOE Certificate of Registration No. WESC 2010-02-040 (expiring in 2035)
2. Camiguin Wind Project Under DOE Certificate of Registration No. WESC 2010-02-041 (expiring in 2035)
3. Taytay Wind Project Under DOE Certificate of Registration No. WESC 2010-02-042 (expiring in 2035)
4. Dinagat Wind Project Under DOE Certificate of Registration No. WESC 2010-02-043 (expiring in 2035)
5. Siargao Wind Project Under DOE Certificate of Registration No. WESC 2010-02-044 (expiring in 2035)
h. Lubricating Oil Supply Agreement
BPPC entered into a supply contract with Pilipinas Shell Petroleum Corporation (Shell), whereby the latter will supply lubricating oil for a period of 15 years until July 2010 at a pre-agreed price indicated in the contract. The price is subject to adjustments twice a year based on various conditions, such as changes in the cost or rates of the product, among others. Correspondingly, BPPC’s contract with Shell expired on July 25, 2010.
i. Operating and Maintenance (O&M) Agreements - FGP and FGPC
FGP and FGPC have separate O&M Agreements with Siemens Power Operations, Inc. (SPO) mainly for the operation, maintenance, management and repair services of their respective power plants. As stated in the respective O&M Agreements of FGP and FGPC, SPO is responsible for maintaining adequate inventory of spare parts, accessories and consumables. SPO is also responsible for replacing and repairing the necessary parts and equipment of the power plants to ensure the proper operation and maintenance of the power plants to meet the contractual commitments of FGP and FGPC under their respective PPAs and in accordance with the Good Utility Practice.
Total O&M costs charged to the consolidated statements of income amounted to $39.0 million in 2010, $36.3 million in 2009 and $36.8 million in 2008.
In 2010, prepaid major spare parts totaling to $53.3 million were reclassified to the “Property, plant and equipment” account as a result of the scheduled major maintenance outages of Santa Rita and San Lorenzo power plants. As of December 31, 2010 and 2009, certain O&M fees amounting to $30.1 million and $66.7 million, respectively, which relate to major spare parts that will be replaced during the scheduled maintenance outage, were presented as part of the “Other noncurrent assets” account in the consolidated statements of financial position (see Note 13).

- 87 -
*SGVMC311282*
FGP and FGPC each signed a new full scope O&M agreement with SPO. The new contract took effect on August 1, 2010 (the Commencement Date) and will expire on the earlier of (i) the 20th anniversary of the Commencement Date, or (ii) the satisfactory completion of the major inspections of all units of the San Lorenzo and Santa Rita power plants, in each case nominally scheduled at 200,000 equivalent operating hours, as stipulated in their respective O&M Agreements.
j. Substation Interconnection Agreement
FGPC has an agreement with Meralco and NPC for: (a) the construction of substation upgrades at the NPC substation in Calaca and the donation of such substation upgrades to NPC; (b) the construction of a 35-kilometer transmission line from the power plant to the NPC substation in Calaca and subsequent donation of such transmission line to NPC; (c) the interconnection of the power plant to the NPC Grid System; and (d) the receipt and delivery of energy and capacity from the power plant to Meralco’s point of receipt.
As of March 16, 2011, FGPC is still in the process of transferring the substation upgrades in Calaca, as well as the 230 kilovolts (kV) Santa Rita to Calaca transmission line, to NPC.
Maintenance services related to the transmission line are rendered by Meralco Industrial Engineering Services Corporation (MIESCOR), a subsidiary of Meralco, on the 230 kV transmission line from the Santa Rita plant to the Calaca Substation in Batangas under the Transmission Line Maintenance Agreement. This involves the monthly payment of $0.02 million (P=0.9 million) as retainer fee and $0.1 million (P=3.7 million) for every six-month period as service fee, with both fees subject to periodic adjustment as set forth in the agreement. The amount of compensation for additional services requested by FGPC outside the scope of the agreement is subject to mutual agreement between FGPC and MIESCOR. Total O&M expense (shown as part of the “Power plant operations and maintenance” account in the consolidated statements of income) amounted to $0.6 million in 2010, $0.8 million in 2009 and $0.5 million in 2008.
k. Interim Interconnection Agreement
FGP has an agreement with NPC and Meralco whereby NPC will be responsible for the delivery and transmission of all energy and capacity from FGP’s power plant to Meralco’s point of receipt.
l. Franchise
The Parent Company, through FGHC, has a franchise granted by the 11th Congress of the Philippines through R.A. No. 8997 to construct, install, own, operate and maintain a natural gas pipeline system for the transportation and distribution of the natural gas throughout the island of Luzon (the “Franchise”). The Franchise is for a term of 25 years until February 25, 2026. As of March 16, 2011, FGHC, through its subsidiary FG Pipeline, has an ECC for the Batangas to Manila pipeline project and has undertaken substantial pre-engineering works and design and commenced preparatory works for the right-of-way acquisition activities, among others.

- 88 -
*SGVMC311282*
m. Tax Contingencies
FGPC FGPC was assessed by the BIR on July 19, 2004 for deficiency income tax for taxable years 2001 and 2000. FGPC filed its Protest Letter with the BIR on October 5, 2004. On account of the BIR’s failure to act on FGPC’s Protest within the prescribed period, FGPC filed with the Court of Tax Appeals (CTA) on June 30, 2005 a Petition against the Final Assessment Notices and Formal Letters of Demand issued by the BIR. On February 20, 2008, the CTA granted FGPC’s Motion for Suspension of Collection of Tax until the case is resolved with finality. As of March 16, 2011, the court proceedings are still on-going with the CTA and FGPC’s petition remains pending before the CTA for the BIR’s presentation of its evidence. Management believes that the resolution of this assessment will not materially affect First Gen Group’s consolidated financial statements.
On June 25, 2003, FGPC received various Notices of Assessment and Tax Bills dated April 15 and 21, 2003 from the Provincial Government of Batangas, through the Office of the Provincial Assessor, imposing an annual real property tax (RPT) on steel towers, cable/transmission lines and accessories (the T-Line) amounting to $0.2 million (P=12 million) per year. FGPC, claiming exemption from said RPT, appealed the assessment to the Provincial Local Board of Assessment Appeals (LBAA) and filed a Petition on August 13, 2003, praying for the following: (1) that the Notices of Assessment and Tax Bills issued by the Provincial Assessor be recalled and revoked; and (2) that the Provincial Assessor drop from the Assessment Roll the 230 kV transmission lines from Sta. Rita to Calaca in accordance with Section 206 of the LGC. FGPC argued that the T-Line does not constitute real property for RPT purposes, and even assuming that the T-Line is regarded as real property, FGPC is still not liable for RPT as it is NPC/TransCo, a government-owned and controlled corporation (GOCC) engaged in the generation and/or transmission of electric power, which has actual, direct and exclusive use of the T-Line. Pursuant to Section 234 (c) of the LGC, a GOCC engaged in the generation and/or transmission of electric power and which has actual, direct and exclusive use thereof, is exempt from RPT.
FGPC sought for, and was granted, a preliminary injunction by the Regional Trial Court (Branch 7) of Batangas City to enjoin the Provincial Treasurer of Batangas City from collecting the RPT pending the decision of the LBAA. Despite the injunction, the LBAA issued an Order dated September 22, 2005 requiring FGPC to pay the RPT within 15 days from receipt of the Order. On October 22, 2005, FGPC filed an appeal before the Central Board of Assessment Appeals (CBAA) assailing the validity of the LBAA order. In a Resolution rendered on December 12, 2006, the CBAA set aside the LBAA Order and remanded the case to the LBAA. The LBAA was directed to proceed with the case on the merits without requiring FGPC to first pay the RPT on the questioned assessment. As of March 16, 2011, the LBAA case remains pending.
On May 23, 2007, the Province filed with the Court of Appeals (CA) a Petition for Review of the CBAA Resolution. The CA dismissed the petition on June 12, 2007; however, it issued another Resolution dated August 14, 2007 reinstating the petition filed by the Province. In a decision dated March 8, 2010, the CA dismissed the petition for lack of jurisdiction.
In connection with the prohibition case pending before the Regional Trial Court (Branch 7) of Batangas City which previously issued the preliminary injunction, the Province filed on March 17, 2006 an Urgent Manifestation and Motion requesting the court to order the parties to submit memoranda on whether or not the Petition for Prohibition pending before the court is proper considering the availability of the remedy of appeal to the CBAA. The Regional Trial Court denied the Urgent Manifestation and Motion, and is presently awaiting the finality

- 89 -
*SGVMC311282*
of the issues on the validity of the RPT assessment on the T-Line. During the hearing held on November 9, 2010, counsel for the Province manifested the intention to file a Motion to Dismiss the case. As of March 16, 2011, FGPC has not received a copy of any such motion, and the injunction previously issued by the Regional Trial Court continues to be valid.
BPPC On July 26, 2010, BPPC turned over the Bauang Plant to NPC/PSALM following the expiration of the 15-year Cooperation Period covering the project. Prior to the turnover, there were cases filed against BPPC involving the assessment of RPT and franchise tax by the local government. While BPPC had recognized a “Provision for real property taxes” in accordance with PAS 37, such provision for RPT and the related receivable from NPC were duly reversed as of December 31, 2010 on the ground that the transfer of the Bauang Plant constitutes full and complete satisfaction of all RPT claims against NPC/PSALM and BPPC. Real Property Tax (RPT) (i) The Bauang Plant equipment were originally classified as tax-exempt under the
individual tax declarations until the Province of La Union (the LGU) revoked exemption and issued RPT assessments in 1998. This marked the inception of the first case. With NPC responsible for the payment of property taxes under the BOT Agreement, NPC filed with the LBAA a petition to declare exempt the equipment and machinery at the Bauang Plant but was ruled against. The matter was brought up to the CBAA where BPPC intervened. The CBAA affirmed the LBAA’s decision. Consequently, NPC and BPPC elevated their respective cases to the Court of Tax Appeals (CTA). When both appeals were denied by the CTA in February 2006, NPC appealed the decision directly to the Supreme Court (SC) while BPPC filed a Motion for Reconsideration with the CTA. The CTA ultimately denied the motion resulting in BPPC’s filing with the SC on September 11, 2006 a Petition for Review on Certiorari reiterating NPC’s exemption from RPT.
The Petition with the SC filed by BPPC was denied in November 2006. BPPC thereafter filed succeeding motions that were similarly denied in April 2007 and July 2007 while the NPC case remained pending with the SC. This paved way for the filing by the LGU in August 2007 of a motion with the SC seeking the dismissal of the NPC-filed case.
To protect the plant assets from any untoward action by local government, BPPC and NPC obtained in May 2001 a Writ of Preliminary Injunction against the collection of RPT by the LGU pending a decision by the SC on the NPC Petition.
In total disregard of a valid injunction premised on a final SC decision in July 2007, the LGU issued in December 2007 a Final Notice of Delinquency and a subsequent Warrant of Levy for the unpaid RPT on the Bauang Plant equipment. Similarly, the LGU attempted to collect the arrears on the RPT on buildings and improvements, which NPC stopped paying since 2003, and included these assets in the levy. The inability of NPC to settle the amounts due within the grace period resulted in the public auction of the assets on February 1, 2008.
In the absence of a bidder at auction proper, the alleged tax-delinquent assets were forfeited and deemed sold to the LGU. Nevertheless, Section 263 of RA No. 7160 also known as the Local Government Code of 1991, accords the taxpayer the right to redeem the property within one (1) year from date of sale/forfeiture (the Redemption Period).
Following the auction date, NPC and BPPC pursued in parallel legal and extra-judicial actions, all without success.

- 90 -
*SGVMC311282*
For failure to redeem the plant at expiry of redemption period, the LGU on February 10, 2009 consolidated title to and ownership of the plant assets by issuing new tax declarations in its name. Although, NPC’s offer of a settlement package for the P=1.87 billion RPT was accepted by the LGU, negotiations were aborted in April 2009 in the absence of a clear directive from the Department of Finance and the Department of Budget and Management for NPC to settle.
(ii) The second case was filed by NPC with the LBAA of the Province of La Union, for itself and on behalf of BPPC, following issuance of a revised assessment of RPT on BPPC’s machinery and equipment on July 15, 2003 by the Municipal Assessor of the Municipality of Bauang, La Union. Under the said revised Assessment, the maximum tax liability for the period 1995 to 2003 is about $16.8 million (P=775.1 million), based on the maximum 80% assessment level imposable on privately-owned entities and a tax rate of 2%. In addition, interest on the unpaid amounts (2% per month not exceeding 36 months) reached a total amount of $10.6 million (P=489.0 million).
BPPC has maintained the position that since the Project Agreement specifically provides that NPC is liable to pay all taxes and assessments in respect of the site, machinery and equipment and improvements thereon, NPC is directly responsible for the payment of all RPT that may be assessed on machinery and equipment at Bauang Plant.
As of December 31, 2009, the potential maximum tax liability on BPPC’s machinery and equipment for the period from 1995 to 2009 is about $25.9 million (P=1.2 billion), based on the maximum 80% assessment level imposable on privately-owned entities and at a tax rate of 2%. In addition, maximum interest on the tax liability (2% per month not exceeding 36 months) amounts to $17.8 million (P=824.3 million).
(iii) The third case was filed on October 19, 2005 by NPC with the LBAA of the Province of
La Union, for itself and on behalf of BPPC, following receipt of a Statement of Account from the Municipal Treasurer dated August 5, 2005 for RPT on BPPC’s buildings and improvements from 2003 to August 2005 amounting to $0.09 million (P=4.2 million). NPC paid all RPT on buildings and improvements directly to the local government from 1995 until 2003, when it stopped payment of the tax and claimed an exemption under the Local Government Code. These properties were included in the February 1, 2008 auction by the LGU.
The potential maximum tax liability on BPPC’s buildings and improvements for the year ended December 31, 2009 is about $1.3 million (P=58.0 million), including interest up to 2009 and alleged back-taxes dating back from 1995 to 2002.
BPPC’s Deed of Transfer (DOT) The custody and operation of the Bauang Plant remained with BPPC until turnover to NPC/PSALM on July 26, 2010. Prior to said transfer to the government, BPPC and NPC executed a DOT on July 23, 2010 as provided in the BOT Agreement. Clause 6(c) of the DOT specifically provides for NPC’s irrevocable and unconditional release of BPPC with respect to all RPT, including interests, penalties and surcharges, assessed by the Provincial Government of La Union (PGLU) and Municipality of Bauang, La Union on any of the buildings, machinery and equipment of the Bauang Plant. Clause 8 of the same document also indicates that NPC will indemnify BPPC for any claim by the PGLU and on any third party for anything that is the responsibility of NPC under the BOT Agreement.

- 91 -
*SGVMC311282*
On July 26, 2010, NPC/PSALM sent a Letter Agreement to PGLU pertaining to the transfer of the Bauang Plant to the provincial government in settlement of the RPT assessments against NPC/PSALM and BPPC. The transfer of the Bauang Plant constitutes full and complete satisfaction of all RPT claims of PGLU against NPC/PSALM and BPPC. Consequently, the parties are to file separate motions to dismiss and to terminate any outstanding case on the matter. The said letter was acknowledged and agreed by the Governor of La Union on the same date.
While BPPC has maintained the position that, pursuant to the terms of the BOT Agreement, it is NPC that is ultimately responsible for the payment of all RPT related to the power plant, and that BPPC has a right of recourse against NPC for whatever amount of RPT it may be required to pay, BPPC recognized as of December 31, 2009 a “Provision for real property taxes” amounting to $45.0 million (including buildings and improvements and interest) in accordance with PAS 37. Correspondingly, BPPC also recognized a “Receivable from NPC” for the same amount representing its claim for reimbursement for RPT. The combined effect of the provision and the claim for reimbursement is presented on a net basis in BPPC’s statements of comprehensive income.
As of December 31, 2010, the provision for RPT and the related receivable from NPC were reversed by virtue of the provisions of the Deed of Transfer and NPC/PSALM’s Letter Agreement to PGLU.
Movements of provision for real property taxes are as follows:
2010 2009 (Amounts in Millions)
Balance at beginning of year $45.0 $41.7 Provision during the year – 2.2 Foreign exchange loss – 1.1 Reversal (45.0) – Balance at end of year $– $45.0
Franchise Tax BPPC also filed with the RTC of Bauang, La Union a Petition for Certiorari and Prohibition in September 2004 to contest an assessment for franchise tax for the period 2000 to 2003 amounting to $0.7 million (P=33.0 million), including surcharges and penalties. The case was filed on the ground that BPPC is not a public utility which is required by law to obtain a legislative franchise before operating, and is thus not subject to franchise taxes. To date, the case remains pending before the RTC of Bauang, La Union.
Both NPC and BPPC believe that they are not subject to pay franchise tax to the local government. In any case, BPPC believes that the Project Agreement with NPC allows BPPC to claim indemnity from NPC for any new imposition, including franchise tax, incurred by BPPC that was not originally contemplated when it entered into said Project Agreement. More importantly, under Clause 6.1 of the DOT, NPC shall exert best efforts to pursue all legal means to cause the PGLU to withdraw or cancel the franchise tax assessments within six (6) months from execution of the DOT, as may be extended by mutual agreement of the parties. The same clause likewise provides that in the event that it is finally determined by the SC that BPPC is liable, NPC shall exert best efforts to ensure that the final judgment shall not be executed against BPPC, its directors, officers, shareholders, or any of their property, and that no property of BPPC shall be garnished or levied upon pending final judgment by the SC.

- 92 -
*SGVMC311282*
As of December 31, 2010 and 2009, there are no provisions for probable losses arising from the foregoing legal contingencies on franchise tax recognized in the consolidated financial statements.
n. Lease Commitments
First Gen Group has a non-cancelable lease agreement with FPRC on its occupied office space. The term of the lease is for a period of five years retroactive to August 1, 2003 or upon occupancy of the leased premises, whichever is earlier, and automatically expires on July 31, 2007. The lease agreement includes a clause to enable upward revision of the rental charged at a rate agreed-upon by First Gen Group and FPRC at the end of each year. The lease agreement with FPRC was renewed for one year from August 1, 2010 to July 31, 2011.
FGPC has a non-cancelable annual offshore lease agreement with the DENR for the lease of a parcel of land in Sta. Rita, Batangas where the power plant complex is located. The term of the lease is for a period of 25 years starting May 26, 1999 for a yearly rental of $0.05 million (P=3.0 million) and renewable for another 25 years at the end of the term. The land will be appraised every ten years and the annual rental after every appraisal shall not be less than 3% of the appraised value of the land plus 1% of the value of the improvements, provided that such annual rental cannot be less than $0.05 million (P=3.0 million).
FG Bukidnon has a non-cancelable lease agreement with PSALM on the land occupied by its power plant. The term of the lease is for a period of 20 years commencing on March 29, 2005, renewable for another period of 10 years or the remaining corporate life of PSALM, whichever is shorter. The rental paid in advance by FG Bukidnon for the entire term is $0.02 million (P=1.12 million).
As of December 31, 2010 and 2009, future minimum rental payments under the non-cancelable operating leases with FPRC and the DENR are as follows:
2010 2009 Within one year $225 $262 After one year but not more than five years 243 231 After five years 488 521 $956 $1,014
o. Petition for the Issuance of a Writ of Kalikasan
On November 15, 2010, a Petition for the Issuance of a Writ of Kalikasan was filed before the SC by the West Tower Condominium Corporation, et al., against respondents FPIC, the Parent Company, their respective boards of directors and officers and John Does and Richard Roes. The petition was filed in connection with the oil leak which is being attributed to a portion of FPIC’s pipeline located in Bangkal, Makati City. The oil leak was found in the basement of the West Tower Condominium. The petition was brought by the West Tower Condominium Corporation purportedly on behalf of its unit owners and in representation of the inhabitants of Barangay Bangkal, Makati City, “including minors or generations yet unborn, whose constitutional right to a balanced and healthful ecology is violated or threatened with violation” by the respondents. The petitioners seek the issuance of a Writ of Kalikasan to protect the constitutional right of the Filipino people to a balanced and healthful ecology, and pray that the respondents permanently cease and desist from committing acts of negligence in the performance of their functions as a common carrier; continue to check the structural integrity of the entire 117-km pipeline and

- 93 -
*SGVMC311282*
replace the same; make periodic reports on findings with regard to the pipeline and their replacement of the same; be prohibited from opening the pipeline and allowing its use until the same has been thoroughly checked and replaced; rehabilitate and restore the environment, especially Barangay Bangkal and West Tower Condominium, at least to what it was before the signs of the leak became manifest; open a special trust fund to answer for similar contingencies in the future; and be temporarily restrained from operating the pipeline until final resolution of the case.
On November 19, 2010, the SC issued a Writ of Kalikasan with Temporary Environmental Protection Order directing the respondents to: (i) make a verified return of the Writ within a non-extendible period of ten days from receipt thereof; (ii) cease and desist from operating the pipeline until further orders from the court; (iii) check the structural integrity of the whole span of the pipeline, and in the process apply and implement sufficient measures to prevent and avert any untoward incident that may result from any leak in the pipeline; and (iv) make a report thereon within 60 days from receipt thereof. The Parent Company and its impleaded directors and officers filed a verified Return on November 30, 2010 and a Compliance on January 18, 2011, in which it was explained that the company is not the owner and operator of the pipeline, and is not involved in the management, day to day operations, maintenance and repair of the pipeline. For this reason, neither the Parent Company nor any of its directors and officers has the capability, control, power or responsibility to do anything in connection with the pipeline, including to cease and desist from operating the same.
On January 18, 2011, the SC noted and accepted the Return filed by the Parent Company and directed the petitioners to comment on the Return within 10 days from notice. Likewise, the SC, in a Notice dated January 25, 2011, noted and accepted the Compliance filed by the Parent Company. The petitioners’ Consolidated Comment was received by the Parent Company’s counsel on March 15, 2011.
30. Other Matters
EDC
a. Acquisition of Palinpinon and Tongonan Geothermal Power Plants (PTGPP)
On September 16, 2009, PSALM issued the Notice of Award and Certificate of Effectivity to GCGI, a wholly-owned subsidiary of FL Geothermal. FL Geothermal is a wholly-owned subsidiary of EDC. The Notice of Award officially declares GCGI as the winning bidder of the 192.5 MW Palinpinon Geothermal Power Plant located in Dumaguete, Negros Occidental and 112.5 MW Tongonan Geothermal Power Plant located in Leyte.
The APA for the PTGPP between PSALM and GCGI became effective on September 16, 2009. Under the terms of the APA, GCGI is required to deliver 40% of the purchase price of $206 million as up-front payment payable on or before the closing date. The balance of 60% may be paid in fourteen (14) semi-annual payments with an interest of 10% per annum compounded semi-annually. On October 23, 2009, GCGI paid PSALM $88.0 million (P=3.8 billion) representing the 40% upfront payment for PTGPP and $7.0 million for payment of purchase orders, rental, option price, performance security deposit on land lease and insurance premiums for industrial all risks and comprehensive general liability insurance policies. On the same date, the closing date was achieved and at which date PSALM turned over to GCGI the PTGPP on the condition it will operate, maintain, and rehabilitate the geothermal power plants in the ordinary and usual course of business.

- 94 -
*SGVMC311282*
On December 15, 2009, GCGI fully paid PSALM for the balance of 60% of $124.0 million (P=5.8 billion).
b. Acquisition of Bacon-Manito Geothermal Power Plants (BMGPP)
On May 5, 2010, BGI submitted the highest offer price of $28.25 million for the 150MW BacMan Geothermal Power Plants in a competitive bidding conducted by PSALM. Located in the towns of Bacon, Sorsogon and Manito, Albay in the Bicol region, the BacMan plant package consists of two steam plant complexes. The BacMan I geothermal facility comprises two (2) 55-MW turbines, which were both commissioned in 1993. BacMan II, on the other hand, consists of two (2) 20-MW units namely, the Cawayan located in Barangay Basud and the Botong in Osiao, Sorsogon City. The Cawayan unit was commissioned in 1994 and the Botong unit was commissioned in 1998. EDC supplies the steam requirements of these plants. On September 3, 2010, BGI remitted to PSALM the amount of P=1,279.7 million representing the full payment of the BacMan power plants acquisition. The BMGPP are currently under rehabilitation to restore capacity and reliability.
c. Service Concession Arrangements
EDC operates 12 geothermal projects in five geothermal service contract areas, namely Leyte Geothermal Production Field (LGPF), Southern Negros Geothermal Production Field (SNGPF), BacMan Geothermal Production Field (BGPF), Mindanao Geothermal Production Field (MGPF) and Northern Negros Geothermal Production Field (NNGPF) under the GSCs [(see Note 29(c)] entered into with DOE pursuant to the provisions of P.D. 1442. These GSCs were replaced by GRESCs on October 23, 2009. Geothermal steam produced is partly sold to NPC, while the remainder are fed to EDC’s and GCGI’s power plants to produce electricity. EDC sells steam and power to NPC under the SSAs and PPAs, respectively. EDC also sells electricity to ILECO I under the Electricity Sales Agreement.
EDC has entered into the following service contracts with the Philippine Government (represented by the Ministry/Department of Energy) for the exploration, development and production of geothermal fluid for commercial utilization:
a. Tongonan, Leyte, dated May 14, 1981 b. Southern Negros, dated October 16, 1981 c. Bacman, Sorsogon, dated October 16, 1981 d. Mt. Apo, Kidapawan, Cotabato, dated March 24, 1992 e. Mt. Labo, Camarines Norte and Sur, dated March 19, 1994 f. Northern Negros, dated March 24, 1994 g. Mt. Cabalian, Southern Leyte, dated January 13, 1997
The exploration period under the service contracts shall be five years from the effective date, renewable for another two years, if EDC has not been in default in its exploration, financial and other work commitments and obligations and has provided a work program for the extension period acceptable to the Philippine Government. Where geothermal resource in commercial quantity is discovered during the exploration period, the service contracts shall remain in force for the remainder of the exploration period or any extension thereof and for an additional period of 25 years thereafter, provided that, if EDC has not been in default in its obligations under the contracts, the Philippine Government may grant an additional extension of 15 to 20 years.

- 95 -
*SGVMC311282*
EDC shall acquire for the geothermal operations materials, equipment, plants and other installations as are required and necessary to carry out the geothermal operations. All materials, equipment, plants and other installations erected or placed on the contract areas of a movable nature by EDC shall remain the property of EDC unless not removed therefrom within one year after the expiration and/or termination of the related service contract in which case, ownership shall be vested in the Philippine Government.
The service contracts provide that, among other privileges, EDC shall have the right to enter into agreements for the disposition of the geothermal resources produced from the contract areas, subject to the approval of the Philippine Government.
Pursuant to such right, EDC has entered into agreements for the sale of the geothermal resources produced from the service contract areas principally with the NPC, a government-owned and controlled corporation. These agreements are for 25 years and may be renegotiated by either party after five years from the date of commercial operations.
Pursuant to such right also, EDC has also entered into agreements with NPC for the development, construction and operation of a geothermal power plant by EDC in its GSC areas and the sale to NPC of the electrical energy generated from such geothermal power plants. These agreements are for 25 years of commercial operations and may be extended upon the request of EDC by notice of not less than 12 months prior to the end of the contract period, the terms and conditions of any such extension to be agreed upon by the parties.
EDC’s agreements with NPC for the sale of the geothermal resources produced from the service contract areas and the sale of the electrical energy generated from the geothermal power plants contain certain provisions relating to pricing control in the form of a cap in EDC’s internal rate of return for specific contracts; as well as for payment by NPC of minimum guaranteed monthly remuneration and nominated capacity.
For the Northern Negros service contract, EDC does not have agreements with NPC for the sale of the geothermal resources and electrical energy produced from the service contract area. EDC instead enters into contracts with distribution utilities, electric cooperatives and other third party buyers of electricity for the sale of the electrical energy generated from the service contract. In 2008, EDC has made a judgment that these service concessions and related arrangements qualify for accounting under Philippine Interpretation IFRIC 12. Accordingly, EDC has recognized the consideration received or receivable in exchange for its infrastructure construction services or its acquisition of infrastructure to be used in the arrangements as either a financial asset to the extent that EDC has an unconditional contractual right to receive cash or other financial asset for its construction services from or at the direction of the grantor, or an intangible asset for the right to charge users of the public service.
On October 23, 2009, the GSCs for the following contract areas were replaced by GRESCs pursuant to R.A. 9513 as discussed in Note 29(c): Leyte, Southern Negros, Bacman, Mindanao, and Northern Negros. Aside from the tax incentives arising from the conversion to GRESCs, the significant terms of the service concessions under the GRESCs are similar to the GSCs except for EDC having control over any significant residual interest over the steam field, power plants and related facilities throughout the concession period and even after the concession period. As a result of abovementioned changes in the service concession arrangements, EDC has made a judgment that its service concession contracts are no longer within the scope of Philippine Interpretation IFRIC 12 starting October 23, 2009.

- 96 -
*SGVMC311282*
The DOE conducted bidding on the geothermal energy resources located in Labo, Camarines Norte and the contract area was won by EDC. The certificate of registration as RE Developer for this contract area was granted by the DOE on February 19, 2010. The remaining service contract of EDC that is still covered by P.D. 1442 as of December 31, 2010 is the Mt. Cabalian in Southern Leyte, which has a term of 25 years from the effective date of the contract, January 31, 1997, and for an additional period of 25 years if EDC has not been in default in its obligations under the GSC.
FG Hydro a. O&M Agreement
FG Hydro entered into an O&M Agreement with the NIA, with the conformity of NPC. Under the O&M Agreement, NIA will manage, operate, maintain and rehabilitate the Non-Power Components of the PAHEP/MAHEP in consideration for a service fee based on actual cubic meter of water used by FG Hydro for power generation.
In addition, FG Hydro will provide for a Trust Fund amounting to $2.2 million (P=100.0 million) within the first two years of the O&M Agreement. The amortization for the Trust Fund is payable in 24 monthly payments starting November 2006 and is billed by NIA in addition to the monthly service fee. The Trust Fund has been fully funded as of October 2008.
The O&M Agreement is effective for a period of 25 years commencing on November 18, 2006 and renewable for another 25 years under the terms and conditions as may be mutually agreed upon by both parties.
b. PRUP Contract
On January 24, 2008, FG Hydro signed the Letter of Acceptance (LA) for the PRUP with Andritz Hydro GmbH, an Austrian company.
The contract provides that the Contractor will undertake the engineering, procurement, installation, testing and commissioning of the PRUP. The technical scope of the PRUP agreed upon by FG Hydro and the Contractor includes the following:
i. Refurbishment and upgrade of Pantabangan main and auxiliary plant which includes:
– Turbine and wicket gate replacement; headcover modification – Draft tube repair and modification – Generator rewind and refurbishment – Replacement of key auxiliary systems
ii. Power increase from 50 MW to 59.4 MW per unit
The total updated contract price of the PRUP amounts to €30.3 million ($44.7 million), including the Contract Options (CO) that will be exercised by FG Hydro. The contract provides that payments to the Contractor are made in accordance with the Milestone Schedule as provided in the PRUP Contract.

- 97 -
*SGVMC311282*
FG Hydro has the option to make any payments to the Contractor in U.S. dollar, at an exchange rate fixed by reference to the European Central Bank fixing rate for converting Euro to U.S. dollar as at the date of the LA, plus a premium of $0.0028 per Euro. Similarly, with respect to the CO’s, FG Hydro also has the option to make any payments to the Contractor in U.S. dollar, at an exchange rate fixed by reference to the European Central Bank fixing rate for converting Euro to U.S. dollar as at the date of the relevant option notice, plus a premium of $0.0028 per Euro.
The commissioning of the first unit commenced in December 2009 and was successfully completed in early 2010. Consequently, the final takeover of the refurbished and upgraded plant and equipment was achieved on January 29, 2010. The power generation capacity of the upgraded and refurbished unit was increased by 10 MW. The commissioning of the second unit commenced in November 2010 and was completed on December 8, 2010. Contract options and variations and closure of punchlist items, however, were completed in early 2011. The completion of the refurbishment of the second unit further increased the power generation capacity by another 10 MW bringing the total plant capacity of PAHEP/MAHEP to 132 MW.
FG Bukidnon
On October 23, 2009, FG Bukidnon entered into a Hydropower Renewable Energy Service Contract (HRESC) with the DOE, which grants FG Bukidnon the exclusive right to explore, develop, and utilize the hydropower resources within the Agusan mini-hydro contract area. FG Bukidnon shall furnish the services, technology, and financing for the conduct of its hydropower operations in the contract area in accordance with the terms and conditions of the HRESC. The HRESC is effective for a period of 25 years from the date of execution, or until October 2034. Pursuant to the RE Law and the HRESC, the National Government and Local
Government Units shall receive the Government’s share equal to 1.0% of FG Bukidnon’s preceding fiscal year’s gross income for the utilization of hydropower resources within the Agusan mini-hydro contract area.
FG Mindanao
On October 23, 2009, FG Mindanao also signed five HRESCs with the DOE in connection with the following projects: 30 MW Puyo River in Jabonga, Agusan del Norte; 14 MW Cabadbaran River in Cabadbaran, Agusan del Norte; 8 MW Bubunawan River in Baungon and Libona, Bukidnon; 8 MW Tumalaong River in Baungon, Bukidnon; and 20 MW Tagoloan River in Impasugong and Sumilao, Bukidnon. The HRESCs give FG Mindanao the exclusive right to explore, develop, and utilize renewable energy resources within their respective contract areas, and will enable FG Mindanao to avail itself of both fiscal and non-fiscal incentives pursuant to the Act. The pre-development stage under each of the HRESCs is two years from the time of execution of said contracts (the Effective Date) and can be extended for another one year if FG Mindanao has not been in default of its exploration or work commitments and has provided a work program for the extension period upon confirmation by the DOE. Each of the HRESCs also provides that upon submission of declaration of commercial viability, as confirmed by the DOE, it is to remain in force during the remaining life of the of 25-year period from the Effective Date. Subject to the approval of the DOE, FG Mindanao can request for an extension for another 25 years under the same terms and conditions, provided that FG Mindanao is not in default in any material obligations under the contract and has submitted a written notice to the DOE for the extension of the contract not later than one (1) year prior to the expiration of the 25-year period.

- 98 -
*SGVMC311282*
On July 28, 2010, FG Mindanao and the Government of the United States of America acting through the U.S. Trade and Development Agency (USTDA), executed a Grant Agreement providing FG Mindanao, as the Grantee, $0.4 million to fund the cost of goods and services required for the feasibility study on the Cabadbaran Run-of River Hydroelectic Power Plant.
Electric Power Industry Reform Act (EPIRA)
a. Reforms RA No. 9136, otherwise known as the EPIRA, and the covering Implementing Rules and Regulations (IRR) provide for significant changes in the power sector, which include among others: the functional unbundling of the generation, transmission, distribution and supply sectors; the privatization of the generating plants and other disposable assets of the NPC, including its contracts with IPP; the unbundling of electricity rates; the creation of a Wholesale Electricity Spot Market (WESM); and the implementation of open and nondiscriminatory access to transmission and distribution systems.
The EPIRA declares that the generation sector shall be competitive and open. Any entity engaged in the generation and supply of electricity is not required to secure a national franchise. However, the public listing of not less than 15% of common stocks of a generation company is required within five years from the effectivity date of the law. First Gen has complied with this requirement.
Cross ownership between transmission and generation companies and between transmission and distribution companies is prohibited. As between distribution and generation, a distribution utility is not allowed to source from an associated generation company more than 50% of its demand, a limitation that nonetheless does not apply with respect to contracts entered into prior to the effectivity of the law. First Gen, through its subsidiaries FGPC and FGP, has entered into PPAs with an affiliate distribution utility, Meralco, prior to the effectivity of the EPIRA. These agreements represent only 40% of the current demand level of Meralco.
No company or related group can own, operate or control more than 30% of the installed capacity of a grid and/or 25% of the national installed generating capacity. Under Resolution No. 26, Series 2005 of the ERC, installed generating capacity is attributed to the entity controlling the terms and conditions of the prices or quantities of the output sold in the market. Accordingly, as of this date, the total installed capacity attributable to First Gen is 2,066.59 MW, which comprises 14.16% of the national installed generating capacity amounting to 14,593.54 MW. In the Luzon, Visayas and Mindanao grids, 1,710.62 MW or 15.78% of 10,839.01 MW, 354.37 MW or 18.13% of 1,954.77 MW, and 1.6 MW or 0.09% of 1,799.75 MW can be attributed to First Gen, respectively.
The EPIRA further provides that the President of the Republic of the Philippines shall reduce the royalties, returns and taxes collected for the exploitation of all indigenous sources of energy, including natural gas, so as to effect parity of tax treatment with existing rates for imported fuels. When implemented, this provision will lower the cost of energy produced by the Santa Rita and San Lorenzo natural gas plants of FGPC and FGP, respectively.

- 99 -
*SGVMC311282*
b. Implementation Over the last two years, the implementation of reforms in the power industry mandated by the EPIRA attained significant momentum. The privatization of NPC generation assets has already exceeded the 70% target and is currently at 92% privatized NPC plants for Luzon and Visayas. Recently privatized plants include 620 MW Limay plant to San Miguel Corporation (SMC), 305 MW Palinpinon- Tongonan plant to GCGI, 55 MW Naga plant to SPC Power Corp., 218 MW Angat Mini-Hydro to K-Water and 150 MW BacMan to BGI. There was also a notable growth in terms of the NPC-IPP privatization which is now at 68% with the privatization of the contracts for: (i) the 700 MW Pagbilao plant to Therma Luzon; (ii) the 1,000 MW Sual to SMC; (iii) the 345 MW San Roque to Strategic Power Development Corporation; (iv) the 100.75 MW Bakun-Benguet to Amlan Power Holdings Corp.; and (v) the 1,200 MW Ilijan to SMC.
Generation Sector The generation sector converts fuel and other forms of energy into electricity. This sector, by utility, consists of: (i) NPC-owned and operated generation facilities; (ii) NPC-IPP plants, which consist of plants operated by IPPs, and IPP-owned and operated plants, all of which supply electricity to NPC; and (iii) IPP-owned and IPP-operated plants that supply electricity to customers other than NPC. Recent successes in the privatization process of NPC continue to build up momentum for the power industry reforms. Under the EPIRA, generation companies are allowed to sell electricity to distribution utilities or retail electricity suppliers through either bilateral contracts or WESM. Once the regime of Retail Competition and Open Access is implemented, generation companies may likewise sell electricity to eligible end-users. Pursuant to Section 31 of the EPIRA, such implementation is subject to the fulfillment of five conditions. Out of the five, only one condition remains unsatisfied: the transfer to IPP Administrators of at least 70% of the total energy output of power plants under contract with NPC and the IPPs. The transfer is at 68% of installed capacity as of December 2010. As of December 2010, PSALM has so far privatized 20 NPC generation assets in Luzon, Visayas, and Mindanao, with an aggregate installed capacity of around 4,320 MW. With the recently concluded bidding of the 150 MW BacMan power plants, NPC has privatized approximately 92% of its total installed generating capacity in Luzon and Visayas. As for the privatization of NPC-IPP contracts, PSALM commenced bidding out agreements for IPP administration in 2009. After the completion of the bidding on 1,200 MW Ilijan power plant, PSALM already privatized 68% of the NPC-IPP administration contracts.
In terms of market share limitations, no generation company is allowed to own more than 30% of the installed generating capacity of the Luzon, Visayas, or Mindanao grids, and/or 25% of the total nationwide installed generating capacity. To date, there is no power generation company, including NPC, breaching the mandated ceiling. Also, no generation company associated with a distribution utility may supply more than 50% of the distribution utility’s total demand, under bilateral contracts, without prejudice to the bilateral contracts entered into prior to the enactment of EPIRA.

- 100 -
*SGVMC311282*
Transmission Pursuant to the EPIRA, NPC transferred its transmission and sub-transmission assets to TransCo, which was created to operate the transmission systems throughout the Philippines. TransCo was also mandated to provide Open Access to all industry participants. The EPIRA granted TransCo a monopoly over the high-voltage transmission network and subjected it to performance-based regulations.
The EPIRA also required the privatization of TransCo through an outright sale or concession contract carried out by PSALM. In December 2007, Monte Oro Grid Resources Corp. won the concession contract for TransCo with a bid of $3.95 billion. On January 14, 2009, PSALM formally turned over the 25-year concession of TransCo to National Grid Corporation of the Philippines (NGCP), the company formed by Monte Oro Grid Resources Corp.
On June 26, 2006, the commercial operation of the WESM in the Luzon Grid commenced. During the first year of operation, total registered peak demand reached 6,552 MW with total registered capacity at 11,396 MW. To date, the monthly transaction volumes for both the spot and bilateral quantities recorded a high of 3,725.54 GWh. The WESM now has 46 direct participants, 12 indirect participants, and 5 intending participants.
WESM commercial operations in the Visayas kept on being deferred from 2008 to 2009 due to two main factors, (1) Lack of competition - bulk of the Visayas grid’s total capacity was still dominantly controlled by NPC; and (2) Fear of extremely high prices - Visayas still had unstable and insufficient power supply. The privatization of the following plants: (1) Panay and Bohol Diesel Power Plants; (2) Land Base Gas Turbine; and (3) Palinpinon-Tongonan Geothermal Power Plants, and the entry of new coal-fired power plants in Cebu and Panay finally enabled WESM Visayas to go in commercial operations on December 26, 2010. With a limited number of power generation technologies in the grid, WESM prices in the Visayas is expected to reflect price offers from coal and geothermal power during off-peak hours while price offers from oil-fired power plants are expected to clear the peak hours. These levels are expected to persist for the next 2 years unless growth in power demand continues its surge in 2010 with the grid coming from a depressed growth situation for the past 2 years. Moreover, prices and spot kWh sales in the Luzon and Visayas grids are expected to deviate from their current levels once WESM implements a “Luzon-Visayas” single grid operation.
The Government expects Retail Competition and Open Access to be implemented in phases. As far as Luzon is concerned, the WESM began operations in June 2006 and Retail Competition has already been introduced, with end-users who comprise the Contestable Market for this purpose already identified.
Open Access in Luzon is expected to commence soon, approximately six months after the privatization of the IPP contracts for the 650 MW Malaya Plant or the 596 MW Unified Leyte Complex. As of November 2010, the IPP contracts for the 1,000 MW Sual coal-fired power plant, the 700 MW Pagbilao coal-fired power plant, the 345 MW San Roque hydroelectric power plant, the 100.75 MW Bakun-Benguet hydroelectric power plant and the 1,200 MW Ilijan Combined Cycle Power Plant have been successfully bidded out. As for NPC generation assets, PSALM has so far privatized 20 assets or more than 92% of the generating capacity of the Luzon and Visayas grids.
In the meantime, ERC approved on December 5, 2008 a transitional (interim) and voluntary form of open access known as the Power Supply Option Program (PSOP). On January 25, 2010, the PSOP Rules subsequently received ERC approval. The program allows qualified generation companies and registered electricity suppliers to contract for the supply of electricity directly with eligible end-users. However, there are implementation aspects that

- 101 -
*SGVMC311282*
have not been touched upon by the PSOP rules. These include accounting, settlement of energy imbalances and line rentals, the rules regarding which shall be proposed by the entities which petitioned for the adoption of the PSOP in coordination with the Philippine Electricity Market Corporation. As of this writing, these additional rules have yet to be issued and, consequently, the implementation of the PSOP has not commenced. Should the Retail Competition and Open Access mandated under the EPIRA be implemented ahead, the PSOP rules will cease to be operational.
The ERC has continued to issue regulations implementing the EPIRA, among which are the Rules for Setting Distribution Wheeling Rates for Privately-Owned Distribution Utilities Entering Performance-Based Regulation, Competition Rules, Rules for Registration of Wholesale Aggregators, Guidelines for the Issuance of Licenses to Retail Electricity Suppliers and Distribution Service and Open Access Rules.
c. Proposed Amendments to the EPIRA Following are the proposed amendments to the EPIRA that, if enacted, may have material adverse effect on First Gen Group’s electricity generation business, financial condition and results of operations.
In the Philippine Senate, the Committee on Energy (CoE) sponsored the approval on second reading of Senate Bill (SB) No. 2343, which include, among others:
Lowering the privatization level precondition to retail open access from 70% to 50% for both the NPC generating assets and NPC IPP contracts, while allowing ERC to declare retail open access even before the 50% level is met with participation being limited to generation companies that comply with the 30%-25% installed generating capacity limits. This proposed amendment would allow NPC and PSALM to retain control of a sizeable generating capacity sufficient to dominate the market at the time of implementation. While this market dominance of NPC and PSALM will not, by large, adversely affect First Gen Group considering that most of the generation output of First Gen’s operating subsidiaries is already contracted with NPC and other entities on a long-term basis, any uncontracted capacity that First Gen may have in the future, as for instance in the event of expansion, may be subject to uneven competitive pressures from NPC and PSALM. Nonetheless, the market control of NPC and PSALM is expected to wane over time as the privatization program progresses.
§ Recognizing the regulatory authority of the Philippine Economic Zone Authority (PEZA) over distribution utilities in PEZA-administered economic zones. In so far as it may be interpreted to allow PEZA to declare retail open access regardless of NPC privatization level, this amendment may similarly affect First Gen Group’s competitiveness vis-à-vis NPC and PSALM as outlined above.
§ Prescribing additional limitation on bilateral contracts between related parties in that such contracts shall not exceed 20% of the installed generating capacity of a grid. Should First Gen Group expand in the Luzon Grid, this proposed restriction may limit potential off-take by Meralco from First Gen Group given Meralco’s existing off-take agreements with FGPC and FGP.
§ Subjecting the reduction of royalties for the exploitation of indigenous energy sources that
the President shall order to the qualification, “whenever the interest of the general public so requires.” Insofar as the reduction becomes discretionary rather than mandatory, the implementation of the reduction of royalties on natural gas, which would enhance the

- 102 -
*SGVMC311282*
price-competitiveness of generation by FGPC and FGP on a post-tax/post-royalty basis vis-à-vis generation using imported fuels, may be accelerated or delayed depending on the timing of the presidential action.
§ As of September 21, 2010, SB No. 2343 passed on First Reading and was referred to the Committees on Energy, Public services, Ways and Means, and Finance;
First Gen Group cannot provide any assurance whether any or all of these proposed amendments will be enacted in their current form, or at all, or when any amendment to the EPIRA will be enacted. Proposed amendments to the EPIRA, including those discussed above, as well as other legislation or regulation could have material adverse impact on the First Gen Group’s business, financial position and financial performance.
Certificates of Compliance FGP, FGPC, FG Hydro and FG Bukidnon have been granted Certificates of Compliance (COCs) by the ERC for the operation of their respective power plants on September 14, 2005, November 5, 2003, June 3, 2008 and February 16, 2005, respectively. The COCs, which are valid for a period of 5 years, signify that the companies in relation to their respective generation facilities have complied with all the requirements under relevant ERC guidelines, the Philippine Grid Code, the Philippine Distribution Code, the WESM rules, and related laws, rules and regulations. Subsequently, FGP, FGPC and FG Bukidnon have successfully renewed their relevant COCs on September 6, 2010, November 6, 2008 and February 8, 2010, respectively. Such COCs are valid for a period of 5 years from the date of issuance.
FG Energy has been granted the Wholesale Aggregator’s Certificate of Registration on May 17, 2007, effective for a period of five years, and the Retail Electricity Supplier’s License on February 27, 2008, effective for a period of three years.
Pursuant to the provisions of Section 36 of the EPIRA, Electric Power Industry Participants prepare and submit for approval of the ERC their respective Business Separation and Unbundling Plan (BSUP) which requires them to maintain separate accounts for, or otherwise structurally and functionally unbundle, their business activities.
Since each of FGP, FGPC, FG Bukidnon and FG Hydro is engaged solely in the business of power generation, to the exclusion of the other business segments of transmission, distribution, supply and other related business activities, compliance with the BSUP requirement on maintaining separate accounts is not reasonably practicable. Based on assessments of FGP, FGPC, FG Bukidnon, FG Hydro and FG Energy, they are in the process of complying with the provisions of the EPIRA and its IRR.
Clean Air Act
On November 25, 2000, the IRR of the Philippine Clean Air Act (PCAA) took effect. The IRR contain provisions that have an impact on the industry as a whole, and on FGP, FGPC and BPPC in particular, that need to be complied with within 44 months (or July 2004) from the effectivity date, subject to approval by the DENR. The power plants of FGP and FGPC use natural gas as fuel and have emissions that are way below the limits set in the National Emission Standards for Sources Specific Air Pollution and Ambient Air Quality Standards. Based on FGP’s and FGPC’s initial assessments of the power plants’ existing facilities, the companies believe that both are in full compliance with the applicable provisions of the IRR of the PCAA.

- 103 -
*SGVMC311282*
On the other hand, BPPC believes that the Project Agreement specifically provides that it is not contractually obligated to bear the financial cost of complying with the new law. Pursuant thereto, compliance of the Bauang Plant with R.A. No. 8749 shall be subject to the final agreement between the DOE, NPC and DENR, specifically on the manner of compliance by all NPC-IPPs, including BPPC. In this connection, the DENR has issued a Memorandum on September 19, 2006 directing all regional directors to hold in abeyance the implementation of the Continuous Emission Monitoring System (CEMS) which is required under the PCAA, until such time that a set of guidelines has been approved. On July 31, 2007, the DENR issued Dept. Admin. Order 2007-22 which effectively superseded the September 19, 2006 memorandum. The new pronouncement prescribes a more detailed set of guidelines for compliance to the Continuous Opacity Monitoring System (COMS)/CEMS installation required under the PCAA, and likewise provides for a two-year window from issuance date for affected facilities to comply.
BPPC has been conducting Ambient Air Emission Monitoring every quarter and Source Emission Monitoring once a year in lieu of the installation of the CEMS. Results are submitted to the Environmental Monitoring Bureau (EMB) and the DENR-Region 1 Office. Prior to July 31, 2009, NPC made representations to concerned agencies to permit the Bauang Plant to continue with already established monitoring methodologies for practical and economic reasons considering the dispatch level of the power plant. As stated in Note 29(e) of the consolidated financial statements, BPPC has turned over the Bauang Plant to NPC on an “as is” basis on July 26, 2010 to mark the end of the 15-year Cooperation Period under the Project Agreement through a Deed of Transfer executed between BPPC and NPC [see Note 29(m)].
BIR Revenue Regulation (RR) No. 16-2008
On December 18, 2008, the BIR issued RR No. 16-2008 which implemented the provisions of Section 34(L) of the Tax Code of 1997, as amended by Section 3 of R.A. No. 9504, dealing on the OSD allowed to individuals and corporations in computing their taxable income.
Based on RR No. 16-2008, it allowed individuals and corporations to claim OSD in lieu of the itemized deductions (i.e., items of ordinary and necessary expenses allowed under Sections 34(A) to (J) and (M), Section 37, other special laws, if applicable). In case of corporate taxpayers subject to tax under Sections 27(A) and 28(A) (1) of the National Internal Revenue Code (NIRC), as amended, the OSD allowed shall be in an amount not exceeding 40% of their gross income.
The items of gross income under Section 32(A) of the Tax Code, as amended, which are required to be declared in the Income Tax Return (ITR) of the taxpayer for the taxable year, are part of the gross income against which the OSD may be deducted in arriving at taxable income. Passive income which has been subjected to a final tax at source shall not form part of the gross income for purposes of computing the 40% OSD.
For other corporate taxpayers allowed by law to report their income and deductions under a different method of accounting (e.g., percentage of completion basis, etc.) other than cash and accrual method of accounting, the gross income pursuant to the RR No. 16-2008 shall be determined in accordance with said acceptable method of accounting.
A corporate taxpayer who elected to avail of the OSD shall signify in its return such intention; otherwise it shall be considered as having availed of the itemized deductions allowed under Section 34 of the NIRC. Once the election to avail the OSD is signified in the return, it shall be irrevocable for the taxable year for which the return is made. In the filing of the quarterly

- 104 -
*SGVMC311282*
ITR, the taxpayer may opt to use either the itemized deduction or OSD. However, in filing the final ITR, the taxpayer must make a choice as to what method of deduction it shall employ for the purpose of determining its taxable net income for the entire year. The taxpayer is, thus, not allowed to use a hybrid method of claiming its deduction for one taxable year.
For the taxable period 2008 which is the initial year of the implementation of the 40% OSD, the 40% maximum deduction shall only cover the period beginning July 6, 2008, which is the effective date of the said RR No. 16-2008. However, in order to simplify and provide ease of administration during the transition period, July 1, 2008 shall be considered as the start of the period when the 40% OSD may be allowed.
First Gen Group computed its income tax based on itemized deductions, except for FGP in 2010 and 2009, and FG Bukidnon in 2009.
31. Event after the Financial Reporting Date
Assignment of Call Option On March 2, 2011, the Parent Company and Northern Terracotta executed a Deed of Assignment to assign and sell the Parent Company’s full rights and obligations over the first tranche of an aggregate 585.0 million EDC common shares covered by the Call Option Agreements executed by First Gen. The assignment gives Northern Terracotta the right to exercise the call option over 195.0 million EDC shares on or before April 19, 2011, which is the expiration of the first exercise period, at an exercise price of P=5.67 per share.