
A FIELD STUDY OF LEADING, LEARNING AND INNOVATING IN ...
181
COMPLEXITY LEADERSHIP IN INDUSTRIAL INNOVATION TEAMS: A FIELD STUDY OF LEADING, LEARNING AND INNOVATING IN HETEROGENEOUS TEAMS by EMILIO DELIA A Dissertation submitted to the Graduate School-Newark Rutgers, The State University of New Jersey in partial fulfillment of the requirements for the degree of Doctor of Philosophy Graduate Program in Management written under the direction of Nancy DiTomaso and approved by ________________________ ________________________ ________________________ ________________________ ________________________ ________________________ Newark, New Jersey January, 2011
Transcript of A FIELD STUDY OF LEADING, LEARNING AND INNOVATING IN ...

COMPLEXITY LEADERSHIP IN INDUSTRIAL INNOVATION TEAMS: A FIELD STUDY OF LEADING, LEARNING AND INNOVATING IN
HETEROGENEOUS TEAMS
by
EMILIO DELIA
A Dissertation submitted to the
Graduate School-Newark
Rutgers, The State University of New Jersey
in partial fulfillment of the requirements
for the degree of
Doctor of Philosophy
Graduate Program in Management
written under the direction of
Nancy DiTomaso
and approved by
________________________
________________________
________________________
________________________
________________________
________________________
Newark, New Jersey
January, 2011

© 2010
Emilio DeLia
ALL RIGHTS RESERVED
ii
ABSTRACT OF THE DISSERTATION COMPLEXITY LEADERSHIP IN INDUSTRIAL INNOVATION TEAMS:
A FIELD STUDY OF LEADING, LEARNING AND INNOVATING IN HETEROGENEOUS TEAMS
By EMILIO DELIA
Dissertation Director:
Nancy DiTomaso
Innovation teams comprised of heterogeneous specialists are prevalent in
industrial company innovation systems because these teams are perceived to possess
special learning and innovative capabilities. There has been insufficient research on how
leadership can help create the dynamics advantageous to learning and innovating in
heterogeneous teams. Complexity Leadership Theory endeavors to address this issue
(Marion & Uhl-Bien, 2001; Uhl-Bien, Marion, & McKelvey, 2007; Uhl-Bien & Marion,
2009). This study uses the insights from Complexity Leadership Theory and from
research on team creativity, team innovation, small group process, group learning and
team heterogeneity to develop and test a model of complexity leadership in innovation
teams. Complexity leadership, which is examined with regard to the influence shared
among the team leaders and the team members, is proposed to be positively linked to
innovation team outcomes. The model is tested with quantitative data from a field study
of 59 innovation teams from 25 industrial companies and informed as well by qualitative
data on 5 teams from 3 companies. Complexity leadership was found to have a positive
effect on collaborative learning, innovation enabling behaviors, and perceived
performance. The analysis tested the mediation effects of collaborative learning and the
existence of a heterogeneity norm on the relationship between complexity leadership and
team outcomes. Collaborative learning was found to mediate this relationship and some
support was found as well for a mediating effect of the existence of a heterogeneity norm.
The expectation that complexity leadership would moderate the effects of job relevant

iii
heterogeneity on innovation enabling behaviors and perceived performance received only
moderate limited evidence of support.

iv
Preface
Acknowledgements
There are many people who challenged me with new thinking and who supported
me throughout the doctorate program and this research. I thank them all and want to
recognize many of them.
Some were central in supporting my research progress. Nancy DiTomaso guided
me into and throughout the program and through the development of my research and
dissertation. Corinne Post taught me about analysis and was an important compatriot as
we sought to make valuable contributions through our research to the companies of the
Industrial Research Institute (IRI) and beyond. Corinne was integral to the overall
project; she co-developed and co-tested the survey tool with me, led the effort to recruit
and gather data for half of the teams used in my dissertation, and converted our raw data
to SPSS data. George Farris was a centering force and taught me to keep things focused
and to go deep in my thinking and research. For their help, I am deeply grateful.
Some were teachers who opened up new perspectives and knowledge. Ya-ru
Chen introduced me to the leadership literature and helped me form the initial ideas
which led to my research topic. Deborah Dougherty reframed my thinking about
organizations and was instrumental in my understanding of emergence which also led to
my research topic. Chao Chen showed me the value and difficulty presented by different
cultures in organizations. John Cantwell taught me to see the macro view of knowledge
transfer and creation. Peter Gillett taught me through his example, the discipline required
for scientific endeavors. I benefited greatly from their desire to share their knowledge.
Some who helped were colleagues who furthered my work. Rob McNamee set
our sights on producing creative useful work and was the master of methods. Tom Tirpak
and Raju Borwankar, whom I recognize posthumously, led the project associated with
my research for the IRI. Thank you.
Some were the theorists upon whose work I built my thinking. Jim Hazy of
Adelphi University introduced me to the network of complexity leadership scholars.
Mary Uhl-Bien is my theoretical and practical guide. She possesses and shares inspiring
knowledge and feeling.
I wish to thank the Technology Management Research Center for funding and the
IRI for support which helped make my research possible. Additional funding was
provided from the Rutgers-Lehigh National Science Foundation grant under award #
SES-085267 which supported the data collection effort. Also, I am grateful to Terri
Kurtzberg and Cindy McCauley for their participation on my committee.

v
TABLE OF CONTENTS
Abstract ................................................................................................................... ii LIST OF TABLES ................................................................................................ vii LIST OF FIGURES ............................................................................................. viii CHAPTER ONE: INTRODUCTION TO THE STUDY Context and Purpose of the Study ............................................................................1 Theoretical Model ....................................................................................................7 Significance of the Study .........................................................................................8 Organization of the Dissertation ............................................................................10 CHAPTER TWO: LITERATURE REVIEW AND HYPOTHESES Introduction to Complexity Leadership Theory ....................................................11 Complexity Leadership and Innovation Team Outcomes .....................................13 Complexity Leadership and Learning ....................................................................33 Complexity Leadership and Heterogeneity ...........................................................40 Complexity Leadership and Job Relevant Heterogeneity ......................................44 Complexity Leadership and Heterogeneity Norm .................................................51 Chapter Summary ..................................................................................................58 CHAPTER THREE: Methods Introduction ............................................................................................................58 Research Design ....................................................................................................58 Field Setting ...........................................................................................................59 Data Collection and Samples .................................................................................60 Data Analysis .........................................................................................................64 Instrumentation ......................................................................................................68 Hypothesis Testing ................................................................................................84 CHAPTER FOUR: RESULTS Descriptive Statistics and Correlations ..................................................................88 Hypothesis 1 Results ..............................................................................................90 Hypothesis 2 Results ..............................................................................................91 Hypothesis 3 Results ..............................................................................................93 Hypothesis 4 Results ..............................................................................................96 Other Considerations .............................................................................................97 CHAPTER FIVE: DISCUSSION ..........................................................................98 Complexity Leadership and Innovation Team Outcomes ...................................102 Complexity Leadership and Learning ..................................................................104 Complexity Leadership and Heterogeneity .........................................................108 Implications for Management ..............................................................................117 Limitations ...........................................................................................................119 Future Research ...................................................................................................122 Conclusion ...........................................................................................................129

vi
REFERENCES ....................................................................................................130 VITA ....................................................................................................................172
vii
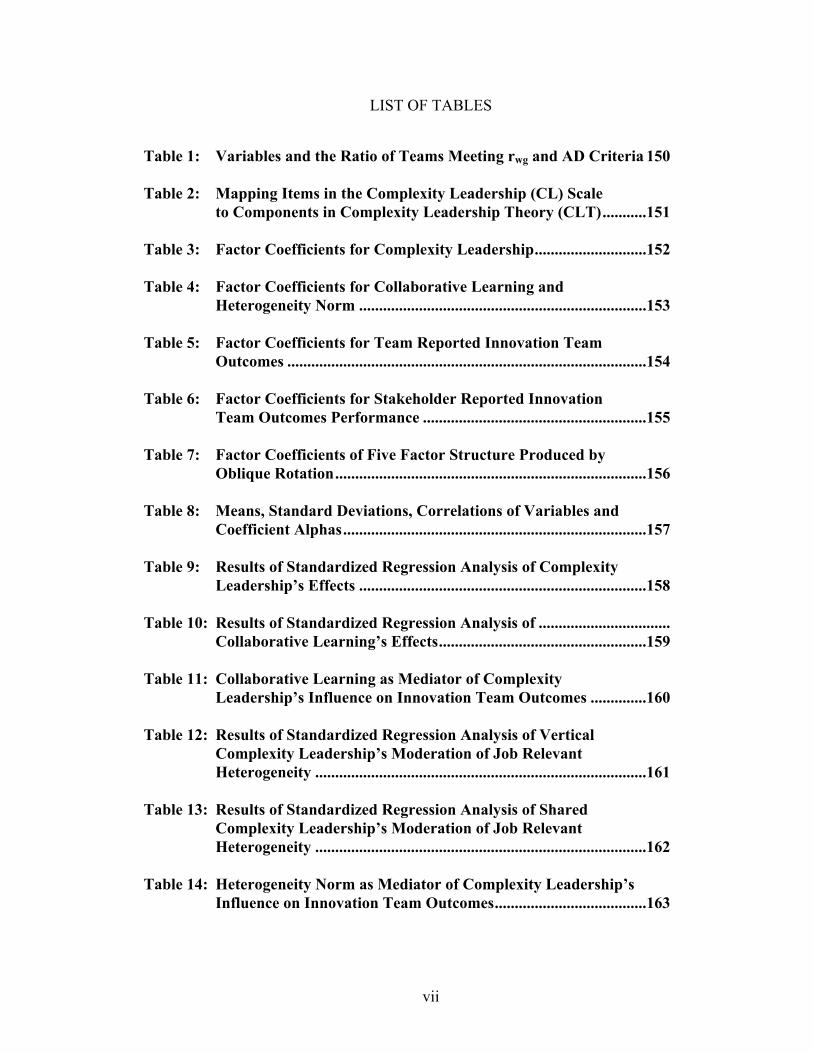
LIST OF TABLES
Table 1: Variables and the Ratio of Teams Meeting rwg and AD Criteria 150 Table 2: Mapping Items in the Complexity Leadership (CL) Scale to Components in Complexity Leadership Theory (CLT) ...........151 Table 3: Factor Coefficients for Complexity Leadership ............................152 Table 4: Factor Coefficients for Collaborative Learning and Heterogeneity Norm ........................................................................153 Table 5: Factor Coefficients for Team Reported Innovation Team Outcomes ..........................................................................................154 Table 6: Factor Coefficients for Stakeholder Reported Innovation Team Outcomes Performance ........................................................155 Table 7: Factor Coefficients of Five Factor Structure Produced by Oblique Rotation ..............................................................................156 Table 8: Means, Standard Deviations, Correlations of Variables and Coefficient Alphas ............................................................................157 Table 9: Results of Standardized Regression Analysis of Complexity Leadership’s Effects ........................................................................158 Table 10: Results of Standardized Regression Analysis of ................................. Collaborative Learning’s Effects ....................................................159 Table 11: Collaborative Learning as Mediator of Complexity Leadership’s Influence on Innovation Team Outcomes ..............160 Table 12: Results of Standardized Regression Analysis of Vertical Complexity Leadership’s Moderation of Job Relevant Heterogeneity ...................................................................................161 Table 13: Results of Standardized Regression Analysis of Shared
Complexity Leadership’s Moderation of Job Relevant Heterogeneity ...................................................................................162
Table 14: Heterogeneity Norm as Mediator of Complexity Leadership’s Influence on Innovation Team Outcomes ......................................163
viii
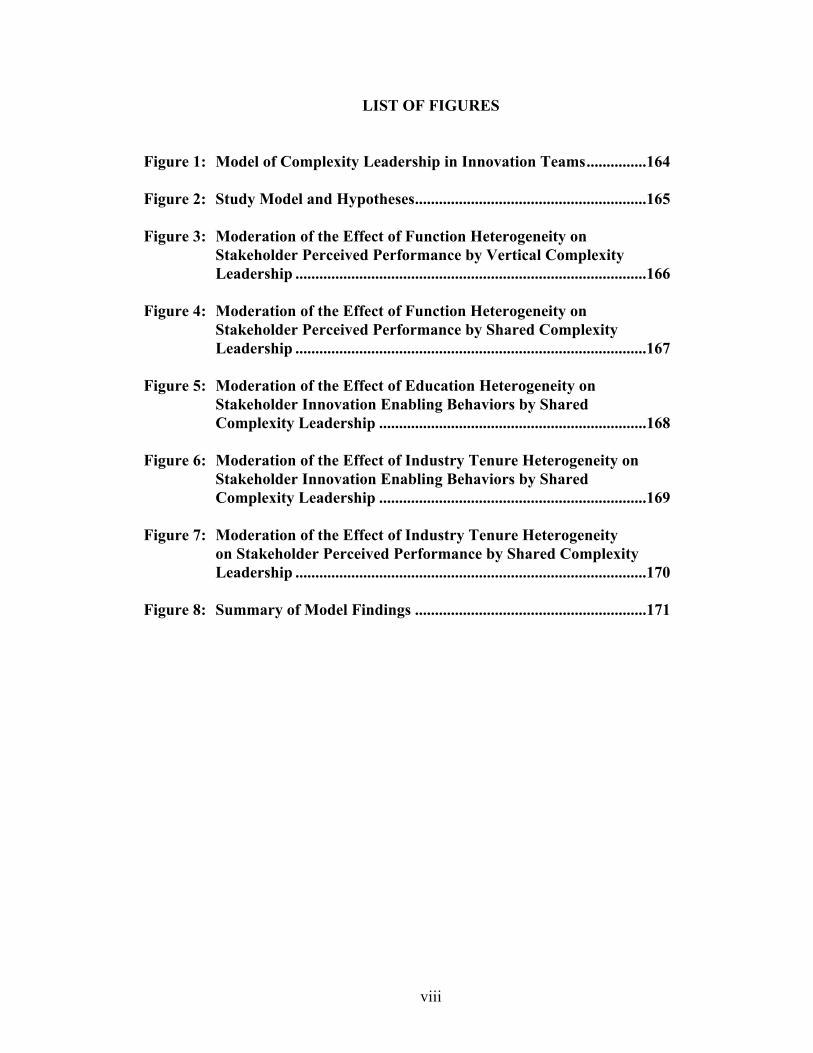
LIST OF FIGURES
Figure 1: Model of Complexity Leadership in Innovation Teams ...............164 Figure 2: Study Model and Hypotheses ..........................................................165 Figure 3: Moderation of the Effect of Function Heterogeneity on
Stakeholder Perceived Performance by Vertical Complexity Leadership ........................................................................................166
Figure 4: Moderation of the Effect of Function Heterogeneity on
Stakeholder Perceived Performance by Shared Complexity Leadership ........................................................................................167
Figure 5: Moderation of the Effect of Education Heterogeneity on Stakeholder Innovation Enabling Behaviors by Shared Complexity Leadership ...................................................................168 Figure 6: Moderation of the Effect of Industry Tenure Heterogeneity on
Stakeholder Innovation Enabling Behaviors by Shared Complexity Leadership ...................................................................169 Figure 7: Moderation of the Effect of Industry Tenure Heterogeneity
on Stakeholder Perceived Performance by Shared Complexity Leadership ........................................................................................170
Figure 8: Summary of Model Findings ..........................................................171

1
CHAPTER ONE
INTRODUCTION TO THE STUDY
Context and Purpose of the Study
Dynamic overarching trends, such as globalization, technological revolution and
morphing industry and company demarcations, are compelling industrial organizations to
focus on increasing learning and innovating (Eisenhardt, 1989; Jennings & Haughton,
2000; Prusak, 1996). Innovations in new products and in new ways of doing business
become imperatives for companies to survive and prosper. In this complex environment,
leveraging knowledge assets becomes more critical for success than management of
physical assets (Boisot, 1998). The success of an industrial company now rests on its
organizational intelligence, that is, its capacity to learn new knowledge (Cohen &
Levinthal, 1990) and its creative use of knowledge (McKelvey, 2001; Quinn, Anderson,
& Finkelstein, 2002). Organizational arrangements, such as distributed knowledge
networks (Miles, Snow, Matthews, & Miles, 1999) and innovation teams (Farris &
Cordero, 2002; Mumford, 2000), which enable the leveraging of intellectual assets, have
become commonplace. Within these new arrangements, both the work and the social
relationships among people performing the work become more interdependent and more
fluid (Zammuto, Griffith, Majchrzak, Dougherty & Faraj, 2007).
Leadership must also change to fit the knowledge work of these new
arrangements. To avoid limiting knowledge flows and knowledge creation, leadership
can no longer operate as the directing mind from the top, nor act as the only bridge across
organizational boundaries and knowledge barriers. Historically, conceptions of leadership
were necessarily tied to prevalent bureaucratic hierarchical structures, favored stability
rather than adaptability, and were oriented to lead for efficiency and control, appropriate
to manufacturing (Jones, 2000). A unifying paradigm for recent leadership conceptions is
the leader to follower(s) dynamic which emphasizes the symbolic, motivational and
inspirational actions of leaders with followers. While their means vary, different

2
leadership theories explain how leaders influence followers to align their efforts to
accomplish something desired by the leader. Different means include, for example, a
leader’s dominating personality and heightened prestige with followers (Hogg, 2001),
leader task oriented and relationship oriented behaviors toward followers (Fiedler, 1964;
Likert, 1961), fair exchanges between leader and followers (Hollander, 1964),
development of valued relationships between leader and followers (Graen & Uhl-Bien,
1995), and leader’s inspirational behavior heightening followers’ emotional involvement
and commitment (Bass, 1985).
The imbalance of influence inherent in the leader to follower paradigm becomes a
stumbling block, however, in knowledge based organizations. Knowledge and ideas
residing anywhere, at any level are the critical factors for survival and success and must
be permitted the possibility of having influence. Influence is no longer understood to be
limited to interactions involving leaders but is seen to occur anywhere at anytime in an
organization (Yukl, 2009; Yukl & Falbe, 1990) through interactions involving
knowledgeable members whatever their level or location.
In response to this, new leadership approaches are emerging that better enable
learning and innovation to originate and to be propagated throughout the company
(Achtenhagen, Melin, Mullern, & Ericson, 2003; Tichy, 2002). This new type of
leadership (Ekvall & Arvonen, 1991, 1994) increases knowledge flows so that new ideas
are prompted; reduces adherence to plans so that adaptive decisions can be made; and
encourages greater cooperation so that organizational change can occur. Leadership is
reconceived as a dynamic for adaptation.
Recently, a new theory of leadership, complexity leadership (Marion & Uhl-Bien,
2001; Uhl-Bien, Marion, & McKelvey, 2007), has been articulated to describe leadership
which enables learning and innovating in complex environments. Complexity leadership
shifts from only considering the dynamic of leader and followers; the dynamics of greater
interest are the interactions among heterogeneous agents, groupings of agents or across
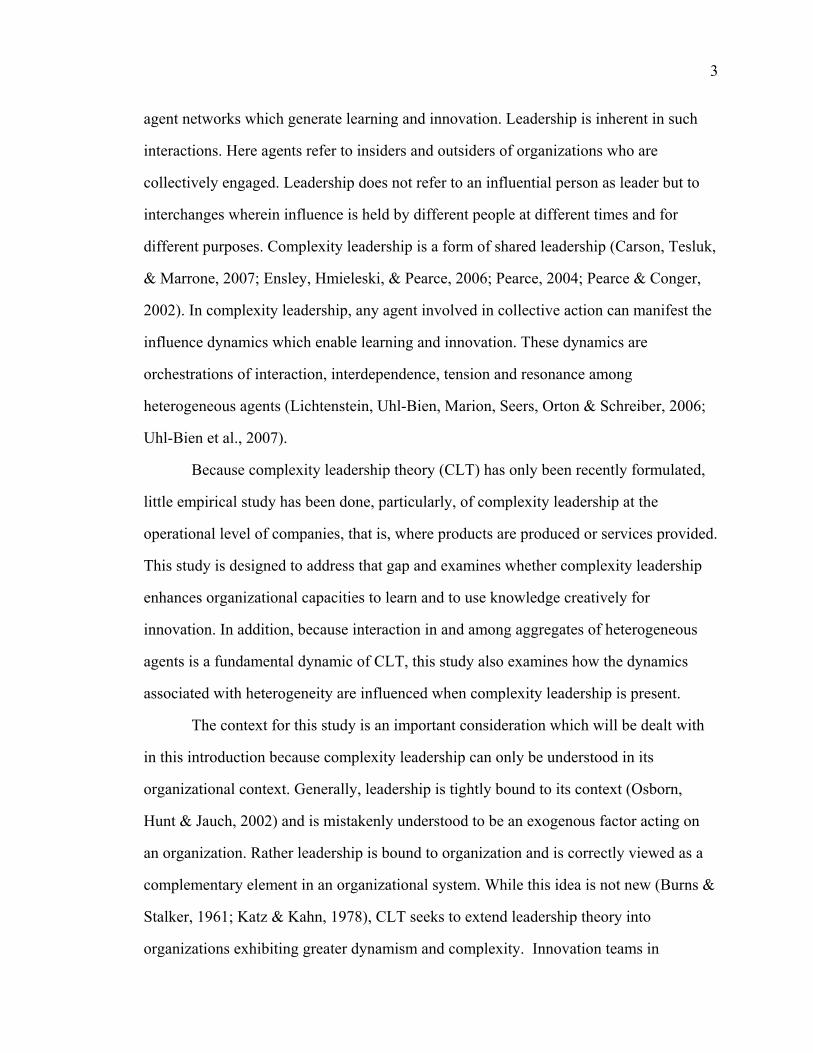
3
agent networks which generate learning and innovation. Leadership is inherent in such
interactions. Here agents refer to insiders and outsiders of organizations who are
collectively engaged. Leadership does not refer to an influential person as leader but to
interchanges wherein influence is held by different people at different times and for
different purposes. Complexity leadership is a form of shared leadership (Carson, Tesluk,
& Marrone, 2007; Ensley, Hmieleski, & Pearce, 2006; Pearce, 2004; Pearce & Conger,
2002). In complexity leadership, any agent involved in collective action can manifest the
influence dynamics which enable learning and innovation. These dynamics are
orchestrations of interaction, interdependence, tension and resonance among
heterogeneous agents (Lichtenstein, Uhl-Bien, Marion, Seers, Orton & Schreiber, 2006;
Uhl-Bien et al., 2007).
Because complexity leadership theory (CLT) has only been recently formulated,
little empirical study has been done, particularly, of complexity leadership at the
operational level of companies, that is, where products are produced or services provided.
This study is designed to address that gap and examines whether complexity leadership
enhances organizational capacities to learn and to use knowledge creatively for
innovation. In addition, because interaction in and among aggregates of heterogeneous
agents is a fundamental dynamic of CLT, this study also examines how the dynamics
associated with heterogeneity are influenced when complexity leadership is present.
The context for this study is an important consideration which will be dealt with
in this introduction because complexity leadership can only be understood in its
organizational context. Generally, leadership is tightly bound to its context (Osborn,
Hunt & Jauch, 2002) and is mistakenly understood to be an exogenous factor acting on
an organization. Rather leadership is bound to organization and is correctly viewed as a
complementary element in an organizational system. While this idea is not new (Burns &
Stalker, 1961; Katz & Kahn, 1978), CLT seeks to extend leadership theory into
organizations exhibiting greater dynamism and complexity. Innovation teams in
4
industrial companies have been chosen as the context for this study because they mirror
the organizational system context of complexity leadership, complex adaptive systems
(CAS). CAS, which are basic units of analysis in complexity science, describe
organizational systems which exhibit high levels of adaptability, innovativeness,
complexity and dynamism and, consequently, posses better fitness to more complex and
dynamic environments (Uhl-Bien et al., 2007).
CAS provide an ambidextrous organizational system paradigm (Schneider &
Somers, 2006) comprised of both mechanistic elements needed for exploitation and
organic elements conducive to exploration (He & Wong, 2004; March, 1991; Van den
Bosch, Volberda, & de Boer, 1999). The ability of CAS to evolve depends upon their mix
of dynamism and order (Kaufman, 1995). Too much dynamism and the system can tip
into chaos. Chaos is a state of disturbance in which a system cannot maintain any pattern
of behavior and can happen when a system continually overreacts to even small
environmental changes. For example, overly organic organizations may readily create
adaptive responses but lack structures that can stabilize a useful adaptation into routines
and repeatable behavior patterns. Contrarily, organizations comprised of many ordered
elements, interrelated within ordered patterns, are frozen so that only small system
changes can occur even when confronted by large forces. Mechanistic systems are best at
routinizing behaviors but lack structures to adapt routines when conditions change. The
blend of dynamism and order make CAS particularly capable of successful adaptation
(Kaufman, 1991).Through dynamism, a repertoire of responses is created and order
provides buffering which allows for an accumulation of potentially useful adaptations
available to respond to environmental pressures. Ambidexterity, that is blends of ordered
and dynamic elements, is constituent of CAS.
Industrial company innovation teams exhibit the qualities of CAS and are the
organizational context for this study. Industrial companies in their quest to improve their
ability to innovate have adopted the use of project teams as a principle organizational
5
arrangement within their innovation systems (Farris & Cordero, 2002; Mumford, 2000).
Hurdles inherent in the ordered organization of industrial companies require special
systemic arrangements advantageous to innovation. Formal hierarchical structures tend to
impede the dissemination of knowledge helpful to innovation and the sharing of
innovative ideas and outcomes throughout the organization (Dougherty & Hardy, 1996).
People and knowledge which need to be linked are not; criteria within different power
bases are inconsistent, stopping collective innovative actions; and resources required for
new development stay bound up in old routines (Dougherty & Hardy, 1996). Innovation
teams possess the dynamism to expand the sources of new ideas, to facilitate
communication across disciplines, functions, and organizations, and to speed the
development of innovation from initiation to commercial success (Guimera, Uzzi, Spiro,
& Amaral, 2005; Reagans, Zuckerman, & McEvily, 2004). Innovation teams overcome
the de-contextualization of knowledge which occurs when knowledge pools are held in
separate groups (Bechky, 2003) by bringing people possessing the different pools of
knowledge together for mutual learning. Teams are particularly adept at learning and are
the fundamental structure used for learning in organizations (Edmondson, 2002; Senge,
1994). Innovation teams provide the social contexts for interchange, learning and co-
creation which expand opportunities for collective creativity (Hargadon & Bechky,
2006). Innovation teams are important vehicles for industrial companies to realize
ambidexterity when the teams are constituted with members representing ordered
functions and knowledge disciplines who are brought together for creative interaction.
Innovation teams have been researched extensively and the findings reveal
characteristics and dynamics reflective of CAS. Heterogeneity of members is the most
consistent distinguishing attribute of innovations teams (Brown & Eisenhardt, 1995) and
mirrors the heterogeneity among agents in CAS. According to theory, CAS are fit to their
environment only when their internal complexity equals the complexity on their
environment (Schneider & Somers, 2006). Similarly, innovation teams are populated

6
with specialists possessing varied knowledge reflecting the complexity associated with
the targeted innovation (Clark & Fujimoto, 1990; Quinn, 1985; Takeuchi & Nonaka,
1986) and with the different functional skills and competencies which must be synergized
for both problem solving and implementation (Cooper, 1979; Cooper & Kleinschmidt,
1987; 1993). CAS are characterized by self organization, that is, structure and
interconnections are fluid and changeable and are not simply determined by the
environment but dynamically emerge from interaction of system elements. Innovation
teams operate autonomously within the larger system of the company (Clark & Fujimoto,
1990; Quinn, 1985; Takeuchi & Nonaka, 1986) and invent routines that do not follow
usual roles and relationships (Dougherty, 1990 & 1992; Dougherty & Corse, 1997).
Interaction and interdependency among agents are central to the functioning of CAS and
are productive of creativity and learning (Uhl-Bien et al., 2007). In their meta-analysis of
104 quantitative studies of team innovation, Hülsheger, Anderson and Salgado (2009)
found that team innovativeness increased both when members engage in interactive
communications among themselves and with outsiders and when individual member
achievement is interdependent with achievement of other team members. Innovation
performance improves when teams increase internal interaction (Dougherty, 1990; 1992;
Dougherty & Corse, 1997) and external interaction (Ancona & Caldwell, 1990; 1992b).
Because they typify CAS, innovation teams are an appropriate context to study
complexity leadership.
Complexity leadership fits the new dynamic and complex organization systems of
knowledge era industrial companies. CLT addresses leadership of ambidextrous
organizational systems, such as CAS, by articulating three focuses of complexity
leadership (Uhl-Bien et al., 2007). The first focus is on the management of ordered
elements accomplished through planning, organizing and controlling (Fayol, 1949). The
second focus addresses leading the dynamic elements arising from adaptive, creative, and
learning interactions. The third focus attends to the enabling of the conditions which
7
catalyze learning, creative and adaptive interactions and to the managing of the
entanglements between the ordered and dynamic elements in the system. Complexity
leadership relates to the more subtle and less controlling type of leadership which has
been observed on innovation teams (Cooper & Kleinscmidt, 1987; Zirger & Maidique,
1990). Subtle leadership facilitates self organization which allows for members’ roles to
shift as developments occur and reconciles the freedom required for creative processes
and the alignment necessary to ensure the innovation advances organizational purposes
(Dougherty, 1992). Complexity leadership facilitates the dynamics conducive to
innovating and to learning, which in turn also aids innovation. The potential creative
value of the heterogeneity of the team is actualized in leadership facilitated interactions.
This study is designed to examine complexity leadership in its theorized optimal
context, CAS, and to test whether its theorized influences are present.
Theoretical Model
The theoretical model examined in this dissertation is presented in Figure 1. In
this model, complexity leadership manifested by the designated team leader and the
members of the team (i.e., vertical leadership and shared leadership: Pearce & Conger,
2002; Ensley et al., 2006; Carson et al., 2007) positively influences innovation team
outcomes, that is, innovation enabling behaviors and perceived performance. Complexity
leadership enables the dynamics of interaction and interdependency conducive to team
innovation and team learning (Uhl-Bien et al., 2007).
Team learning is collaborative learning, because members learn interdependently
from one another. Collaborative learning increases individual and group learning
(Johnson, Johnson, & Anderson, 1978) and involves the open sharing of the deeper
principles, assumptions, and metaphors associated with knowledge held by members
(Cronin & Weingart, 2007; Roschelle, 1992). Collaborative learning entails purposeful
attentive interactions, members teaching and learning, and divergent and convergent
8
thinking (Janz & Prasarnphanich, 2003). Collaborative learning mediates the relationship
between complexity leadership and innovation team outcomes.
Job relevant heterogeneity, attributes such as, job role, function, educational
background and tenure, is reflective of the knowledge based heterogeneity of CLT and
has been shown to have a generally positive but inconsistent influence over innovation
performance (Hülsheger et al., 2009) with a positive or negative relationship depending
upon how attitudes and dynamics moderate the relationship (van Kippenberg, De Dreu &
Homan, 2004). Complexity leadership catalyzes dynamics which engage member
differences and increase likelihood that differences will have greater beneficial influence
on creative and innovative performance (Uhl-Bien et al., 2007). Complexity leadership
moderates the relationship between job relevant heterogeneity and innovation team
outcomes.
Complexity leadership theory anticipates in CAS a heterogeneity norm which
leverages differences among agents and has far reaching effects on dynamics (Marion &
Uhl-Bien, 2001). In innovation teams, the heterogeneity norm is a team pattern of
respecting, engaging and leveraging job relevant heterogeneity. Norms which align
member interaction behavior are established early in team formation, and once the
heterogeneity norm is formed, less leadership intervention is required regarding
heterogeneity (Jassawalla & Sashittal, 2002; Taggar & Ellis, 2007). The heterogeneity
norm mediates the relationship between complexity leadership and innovation team
outcomes.
-----
Insert Figure 1 Here
-----
Significance of the Study
This study adds to research in leadership in several ways. Its primary contribution
is toward understanding complexity leadership at the operational level of organizations,

9
that is the level of producing products or providing services (Uhl-Bien et al., 2007).
Because of the relative newness of complexity leadership theory, few studies have been
done to test or demonstrate that the theorized leadership is capable of influencing the
learning and innovation performance of CAS. Consequently, little field testing of the
theory has been done. This early stage of theory development provides a rich and open
field for this study to explore. Complexity leadership theorists suggest research strategies
that address the difficulties associated with capturing the complex dynamics of leadership
in CAS and that emphasize qualitative ethnographic approaches and the use of simulation
and other mathematical modeling as prime research approaches (Hazy, 2007; Marion &
Uhl-Bien, 2001; Uhl-Bien et al., 2007). This study, which is primarily quantitative field
research supported by a qualitative study, is designed to provide a bridge between the
existing research of leadership and complexity leadership. This study’s theory
development and research methods rely heavily on existing research literatures of team
creativity, innovation, small team process, team learning, team leadership, and team
diversity. This study’s goal is to increase the potential synergies between complexity
leadership and other research disciplines.
The second contribution of this study will be to our understanding of leadership in
innovation teams. A gap exists in our descriptions of innovation team leadership with
little research delineating leadership’s role in the internal team dynamics (Brown &
Eisenhardt, 1995). This observed gap is reinforced by Hülsheger et al.’s (2009) meta-
analysis of 104 quantitative studies of innovation teams. Leadership was not identified in
their review of the extensive empirical team innovation literature as one of the team level
variables influencing innovation performance. This current study will provide new
insights into leadership of innovation teams that will have value not only to researchers
but also to industrial companies, especially given the dominate role innovation teams
have in their innovation systems. When complexity leadership is shown to have the
influences on learning and innovating purported, new direction will be provided to

10
industrial companies for leadership training and development of innovation team leaders
and members.
Additional value will be provided by this study to research on heterogeneity,
which has been developed in the diversity literature. In this literature, the contradictory
effects, both positive and negative, of diversity on team performance have led to the
theorizing of moderating factors. Because diversity on teams, for example, job relevant
heterogeneity, has been observed to have different, even opposite, effects in different
studies, there is a need to separate the effects of diversity from the dynamics that may
emerge from diversity. Intervening moderating variables, such as a positive or negative
bias toward diversity, have been proposed to influence the relationship between diversity
and performance (van Knippenberg et al., 2004). This study’s heterogeneity norm reflects
a positive bias toward heterogeneity and, because positive bias is an understudied
phenomenon (van Knippenberg & Schippers, 2007), this research will shed new light on
potential moderating factors associated with heterogeneity.
Organization of the Dissertation
The study upon which this dissertation is based is presented according to the
following outline. Chapter Two provides the literature review for the hypotheses tested
in the study. The literature review uses empirical and theoretical research to support the
proposed hypotheses summarized in the theoretical model shown in Figure 1. Chapter
Three outlines the methods used to test the hypotheses presented in Chapter Two. The
methods include the research design, field setting, participants and samples, measures
used to operationalize the constructs in this study, data collection and data analysis. In
Chapter Four, the results of the empirical hypothesis tests for this study are presented. A
concluding discussion of the study’s findings, strengths and limitations, and directions
for future research is presented in Chapter Five.

11
CHAPTER TWO
LITERATURE REVIEW AND HYPOTHESES
Introduction to Complexity Leadership Theory
Complexity leadership theory (CLT) asks that the paradigm that has held sway
over leadership theory and research for some time be reshaped in light of new
understanding of how complex systems learn, adapt and innovate to maintain fitness
within complex environments. A shift of paradigm is called for because the context of
leadership both inside companies and in the environments experienced by companies has
greater complexity, that is, greater dynamism and greater number of disparate system
elements needing to be interwoven. While traditional hierarchical views of leadership
were relevant in bureaucratic organizations seeking consistency and predictability, the
upheavals arising from the knowledge explosion, continual technology revolutions,
globalization, and other complexity creating factors, require leadership that is primarily
an enabler of change and adaptation in organizational systems. Conceptions of
organizations and leadership must change simultaneously in order to grasp the
organizational imperatives required now. Within CLT, organizational systems are not
bounded entities but viewed as complex adaptive systems (CAS) made up of
heterogeneous agents or elements which interact and mutually affect each other, and from
this dynamic, novelties arise which change the system as a whole ( Marion & Uhl-Bien,
2001). Previously, leadership would have been envisioned to be the force organizing and
controlling these dynamics with the aim of producing organizational goals. Research in
the leadership of innovation supports the need to change this view. Traditional top-down
leadership providing direction and control limits flexibility and experimentation and

12
reduces innovativeness (Amabile, 1997, 1998). CLT theorizes leadership as an adaptive
dynamic, enabling the dynamics of system agents to interact through self organizing and
to create emergent learning, adaptation and innovation.
Complexity leadership is leadership of aggregates (Marion & Uhl-Bien, 2001).
Complexity leadership differs from recent leadership theories which focus on the
relationship between leaders and followers and relies heavily on dyadic, that is, leader
and follower, influence constructs and research techniques. The aggregates, to which
complexity leadership is attuned, are groups of interacting actors who operate with a
sense of commonality and, at a higher level, meta-aggregates of interacting groups linked
by some form of interdependence. The important feature of these aggregates and meta-
aggregates is their propensity for emergence, that is, pattern and order not predicted by
previous conditions arising from the multiplicity of interactions within the complex
system. Emergence happens in aggregates as conflicting constraints and preferences
clash and are resolved when correlation is created. One task of complexity leadership is
to enable dynamics which enhance emergence of learning and innovation in aggregates.
A second task is to enable the diffusion of the learning and innovation which has
emerged into meta-aggregates. The shift in complexity leadership from dyadic concerns
to aggregate concerns is central to the handling of complexity. As bureaucratic
management was formulated to lead predictable and controlled organizations, complexity
leadership leads complex organizations in complex environments and must not only
attend to the challenges of managing ordered organizational elements but also to
challenges of creating learning, innovation and adaptation in dynamic system elements. A

13
more detailed description of the functions of complexity leadership given in the next
section will clarify the relationship between complexity leadership and innovation.
Complexity Leadership and Innovation Team Outcomes
A potent source of change and adaptation in contemporary companies is
innovation which is purposively pursued through organized innovation systems.
Innovation can relate to products and services, or processes and practices (Slappendel,
1996). Innovation is the generation of new knowledge with special attention to its
usefulness and, subsequently the practical application or implementation of the
knowledge (Camison-Zornoza, Lapierdra-Alcami, Segarra-Cipres & Boronat-Navarro,
2004). Innovation is creativity with an organizational purpose because innovation by
definition entails the application or implementation of the results of creativity. In
industrial companies, innovation is a team activity and the role of leadership in shaping
team dynamics for innovation is essential (Jassawalla & Sashittal, 2002).
Within CLT, complexity leadership is a complex dynamic comprised of three
functions: administrative leadership, adaptive leadership and enabling leadership (Uhl-
Bien et al., 2007). Together, these three functions permit organizations to take advantage
of the learning and innovation potential of CAS, such as the organizational systems of
innovations teams, within the typically bureaucratic contexts of industrial companies.
The following builds on the theory of complexity leadership, its functions relative to
team innovation, and how existing research literature on group creativity, innovation
teams, group conflict, and group leadership can be used to explain the relationships
between complexity leadership with innovation and learning. Some of these cited studies
14
focus on leadership by examining the behaviors of specific leaders and are nonetheless
relevant in exploring issues related to complexity leadership.
Administrative leadership is defined as management which functions to create
order and alignment. This first function of complexity leadership is traditionally
embodied in individuals with special influence derived from designated authority within
the hierarchy. In this regard, CLT embraces earlier conceptions of bureaucratic
management which attends to planning, organizing and controlling (Fayol, 1949) as
necessary leadership activities in CAS pertaining to system elements requiring order and
stability. In CLT, administrative leadership performs the normal managerial functions of
structuring tasks, coordinating activities, managing crisis, and acquiring and allocating
resources, with attention and consideration for organizational learning, adaptation and
innovation (Uhl-Bien et al., 2007). In innovation teams, administrative leadership is
generally performed by a designated team leader who provides guidance to the team by
keeping focus on linkages to company processes, strategies, and competencies (Clark &
Fujimoto, 1990; Quinn, 1985; Takeuchi & Nonaka, 1986). Administrative leadership on
innovation teams seeks to deal effectively with routines in the organization’s innovation
system, such as stage gate reviews and innovation portfolio management. The attention
of the leader to the company’s routines helps create an environment in which the team
can operate effectively. Conditions allow the team to balance its need to be independent
enough from the larger organization for creativity but still be connected enough so that it
efforts are supported and its creative outputs can be implemented.
Adaptive leadership, the second function of complexity leadership, is an influence
dynamic emerging from the interaction and interdependence among heterogeneous agents

15
in a social system which specifically aids adaptation in that system. Adaptive leadership
is defined as interactive influence events from which changes in knowledge, action
preferences or behaviors occur that make an organization more capable of adapting
(Lichtenstein1 et al., 2006). The consequences of adaptive leadership are present in the
emergent group phenomena of learning and innovation. Emergence involves the
“reformulation of existing elements to produce outcomes that are qualitatively different
from the original elements” (Uhl-Bien et al., 2007, p. 308) and involves knowledge
created by “seeing beyond original assumptions to something not bounded by those
assumptions” (Uhl-Bien et al., 2007, p. 307). In innovation teams, adaptive leadership is
occurring when interacting members generate innovation enabling behaviors and
innovative outcomes to resolve preference asymmetries, that is, differences in
knowledge, assumptions, perspectives, needs, behaviors, etc. Unlike previous
conceptions of leadership, adaptive leadership interactions are not based upon authority
asymmetries where leaders possess higher status and greater influence than followers.
Adaptive leadership is not leaders influencing followers to achieve the leaders’ desires
but rather members interacting to generate innovative outcomes (Lichtenstein et al.,
2006). Authority asymmetries are more one-sided because, as psychological theories of
power suggest, persons possessing influence and status engage in more “other
approaching” behavior while the less powerful inhibit engagement (DiTomaso, Post, &
Parks-Yancy, 2007; Keltner, Gruenfeld, & Anderson, 2003) which reduces open
interaction and, consequently, their expression of differences. The tension arising from
preference asymmetries opens up space for new understanding between members
(Bradbury & Lichtenstein, 2000; Lichtenstein et al., 2006) and fosters struggles and

16
debates. Learning and innovation happen when the open space between members is filled
by events of new knowledge creation. Ideas emerge from the clash of the member
preferences. In innovation teams, adaptive leadership can be recognized as having
successfully occurred when innovation is created that is deemed to be useful and is
embraced by the larger organization for application and implementation (Uhl-Bien et al.,
2007).
Enabling leadership is the third function in the CLT framework. Enabling
leadership is defined as two separate but linked sub-functions: first, the fostering of
conditions which stimulate the adaptive influence dynamics of adaptive leadership to
occur and second, the forging of connections between the emerging changes from
adaptive leadership with the ordered elements managed by administrative leadership
(Uhl-Bien et al., 2007). Enabling leadership helps innovation teams, as CAS, create new
dynamic elements and then manage the blending of dynamic elements with ordered
elements. Innovation teams are challenged to generate dynamism not characteristic of the
bureaucratic systems in which they operate and yet to maintain linkages with the
bureaucracy. The dynamic elements produced represent new possibilities for adaptation
beyond what can normally emerge from the bureaucracy. The linkages permit flows of
resources and information which enable the team to innovate and also ultimately enable
the larger organization to integrate the outcomes of the teams’ innovative production. To
summarize, in CLT terms, enabling leadership is made up of two sub-functions: (1)
enable conditions which catalyze adaptive leadership and (2) manage the entanglement
between adaptive and administrative structures. Four conditions which catalyze adaptive
17
leadership have been identified: (1) interaction, (2) interdependence, (3) tension, and (4)
resonance (Uhl-Bien et al., 2007).
Interaction
Interaction is defined as the interchanges between and among agents. Interaction
is enabled when leadership instigates interchanges between members of the team and
supports the unfolding of developing interchanges. Enabling leadership increases
interchanges by improving existing connections among members and forging new ones.
In innovation teams, leaders use interaction tactics by instigating interchanges within the
team, with groups in the larger organization and with others outside the organization in
order to spur intellectual stimulation, which is an important factor in achieving group
creativity and innovation (Mumford, 2000). In a number of small group experimental
studies, Maier and his colleagues (Maier, 1950; 1953; Maier & Hoffman, 1960; Maier &
Solem, 1962) observed team leader behaviors which stimulated interaction and were
helpful in developing group creativity. The leader behaviors included: encouraging
members to share information; encouraging members to seek from others a variety of
information relevant to the problem; and prolonging discussions to allow for more
information sharing. Overall, interaction provides two important advantages to
innovation: first, new information is made available to be processed and secondly,
thinking is broadened to include more perspectives which can lead to unexpected
association of ideas and new knowledge.
Interdependence
The second enabling condition is interdependence. Interdependence in complexity
leadership theory builds on previous higher order definitions, for example, reciprocal

18
interdependence described by Thompson as, “referring to the situation in which the
outputs of each become the inputs for the others” (Thompson, 1967: 69) and team
interdependence (Van De Ven, Delbecq, & Koenig, 1976) where a group collaborates in
order to perform jointly undertaken work. The interdependence of complexity leadership
is people collaborating in order to co-learn and co-create and is built on collaboration
between competing forces which transcend their heterogeneous agendas to achieve
outcomes beneficial to all (Jassawalla, & Sashittal, 2006). This interdependence is
achieved not only through technical task elements but also social context, socially
constructed by members of a group. Socio-technical systems theory (Trist, 1981)
recognized that both the task environment and the social environment can contribute to
leveraging individual and group efforts through interdependence. In uncertain contexts,
such as efforts to innovate, individual and team behaviors which maintain or build
socially constructed interdependence relate to individual, team and organizational
performance in terms of proficiency, adaptability, and pro-activity (Griffin, Neal, &
Parker, 2007). Leaders foster interdependence by linking preferences among team
members through social processes, such as mutual problem solving, to create mutual
reliance and collaboration even where linkages may not occur naturally within the task
environment (Wageman, 1995). The advantages observed from socially constructed
interdependence include better use of collective knowledge and skills, higher quality
social processes, extensive mutual learning, shared sense of responsibility for outcomes
and positive interpersonal interactions (Wageman, 1995). Innovation teams, who achieve
high levels of collaborative interdependence, exhibit greater creativity and quantum leaps
of innovation; teams who only focus at integrating task dependencies, have difficulty

19
going beyond the existing technical relationships among functions and disciplines
(Jassawalla & Sashittal, 2006).
The first two catalyzing conditions, interdependence and interaction, work
together to enhance collective actions in innovation teams. Interdependence adds
pressure to interact purposefully, mindful of mutually beneficial outcomes (Uhl-Bien et
al., 2007). Interaction allows for the movement of information while interdependence
provides the meaning and purpose to do so. Interdependence creates reciprocal feedback
loops which enrich and amplify the results of interaction and increase emergence of
unexpected innovative outcomes (Lichtenstein & Plowman, 2009).
Tension
The third catalyzing condition, tension, arises from interaction when differences
in constraints, needs, preferences and knowledge exist among agents. The concept of
tension in complexity leadership captures the stretching required to understand others’
knowledge and perspectives and to combine different knowledge into new knowledge.
Enabling leadership in order to create an impetus for adaptive behaviors fosters and
incites tension by influencing dynamics so that differences, dissent and divergent
perspectives are leveraged and members accept responsibility for resolving differences
and creating solutions (Heifetz & Laurie, 2001; Uhl-Bien et al., 2007).
Tension arises when leaders instigate divergent thinking and have positive
attitudes toward disagreement. Both have been shown to influence group creativity when
groups are solving work problems. Leaders use disagreements to frame more creative
solutions when divergent thinking yields new ideas (Maier & Janzen, 1969). In small
group experiments (Maier & Hoffman, 1965), positive leader attitudes increased the

20
likelihood that disagreements led to creative solutions. Leadership also instigates tension
by bringing in external sources of different knowledge, perspectives or skills and by
capitalizing on the heterogeneity of agents inside and outside the team. Knowledge
heterogeneity precipitates tension in the team as personal knowledge bases or previously
held perspectives are challenged by differences (Carley & Hill, 2001). Tension is
associated with a felt need to adjust differing cognitive structures which are held
individually and/or collectively. Resulting cognitive accommodations generate new
structures, ideas and knowledge unanticipated from the sum of the information
previously available (Uhl-Bien et al., 2007). Interactions under tension can have a non-
linear influence on future interactions and produce innovative outcomes.
However, there are potential hazards associated with tension, which complexity
leadership mitigates. The discomfort associated with tension can lead to premature
convergence on sub-optimal solutions. Teams are challenged to maintain a state of active
differences and, consequently, tend to quickly seek consensus or agreement. Leadership
can negotiate sufficient deliberation to prevent premature closure of design decisions
(Lester, Piore, & Malek, 1998). Additionally, an alternate problem arises when tension
leads to unproductive conflict which prevents members from bringing their thinking
together and therefore blocks creativity and innovation. Enabling leadership seeks to use
conflict productively (Uhl-Bien et al., 2007).
The work of Basadur and colleagues (Basadur, Graen, & Green, 1982; Basadur,
Graen, & Scandura, 1986; Basadur, Pringle, Speranzini, & Bacot, 2000) elucidates the
role of innovation team leadership in avoiding the pitfalls of pre-mature convergence.
Leadership enables four skills helpful to the creative process of the team (Basadur et al.,
21
2000): (1) divergence, the ability to generate and consider a variety of options; (2)
convergence, the ability to advance the process by evaluating and selecting options; (3)
deferral of judgment, the ability to keep divergence and convergence separated and
sequenced in the right order; and (4) vertical deferral of judgment, a more global ability
to balance divergence and convergence which helps avoid skipping steps and/or
advancing prematurely. Without these skills, insufficient problem definition, premature
selection of a solution, and delivering sub-optimal solutions occur. To avoid these
pitfalls, leadership influences the team to self-monitor and increase sensitivity to
information related to creative team processes and outcomes. When teams reflect on and
evaluate team dynamics, dysfunctional habits can be broken (Milliken, Bartel, &
Kurtzberg, 2003). An additional important observation is made in the body of Basadur’s
work: the cycling through divergent and convergent interaction happens throughout the
innovation project from early problem definition to solution implementation.
Leadership helps alter the tendency to prematurely converge by engaging the
team to sustain divergent interaction. However too much or the wrong type of divergence
can lead to unproductive conflicts. When groups experience too much conflict, their
ability to coordinate learning and implement innovative ideas becomes limited (Brown &
Duguid, 2000). A substantial body of research has described the relationship between
conflict and group performance. Theoretical and empirical studies document the negative
influence conflict has on team performance (Brown, 1983; Gladstein, 1984; Saavedra,
Earley, & Van Dyne, 1993; Wall & Callister, 1995) while others found that the level or
intensity of conflict determined whether effects were positive or negative (Wall & Nolan,
1986). Low levels of conflict provided advantages when people directly dealt with issues
22
and learned from each other (Nemeth, 1986; Tjosvold, 1997). Another stream of conflict
research called attention to the importance of understanding the differences between
relationship and task conflict (Amason, 1996; Jehn, 1995; Simons & Peterson, 2000).
Relational conflicts are interpersonal incompatibilities, such as, political preferences,
which generally decrease team performance. Task conflicts are differences about work
related issues, such as scheduling and distribution of work or resources, and their
influence on performance is moderated by task routineness. Task conflict interferes with
the performance of routine tasks but increases performance of non-routine or complex
tasks, such as innovation (Amason, 1996; Simons & Peterson, 2000) because non-routine
tasks do not depend on pre-established solutions and are better served when team
members engage in deliberate processing of task-relevant information. In a meta-analysis
of 28 research articles, De Dreu and Wiengart (2003) studied the effects of relationship
and task conflict on team performance. They found that both types were equally
disruptive of team performance. They also found that task routineness did not moderate
task conflict’s impact. From their findings, they suggest that some task conflict may be
beneficial but that “such positive effects quickly break down as conflict becomes more
intense, cognitive load increases, information processing is impeded, and team
performance suffers.” (De Dreu & Wiengart, 2003: 746). With its aim to support tension,
enabling leadership does not seek to avoid conflict but seeks to use conflict productively.
Hülsheger and colleagues (2009) found no correlation between conflict and team
innovation performance, so it can be said that the presence or lack of conflict is not as
important as what is done with it. Tjovold and his colleagues have shown across a wide
range of team issues and settings that when conflict is effectively led, it contributes

23
positively to team performance and does not devolve into unproductive conflict, that is,
cognitive load is kept manageable at levels that enhance information processing (Alper,
Tjosvold, & Law, 2000; Chen, Liu, & Tjosvold, 2005; Tjosvold, 1997, 1998; Tjosvold,
Poon, & Yu, 2005; Tjosvold, Sun, & Wan, 2005; Tjosvold & Wong, 2004). Leadership
of conflict entails being attuned to and recognizing conflict, openly identifying and
discussing differences, and actively instigating collaborative problem solving.
Complexity leadership mitigates occurrences of unproductive conflict by recognizing
when disagreements are reaching disruptive levels of hostile interaction and engaging
members in interdependent conflict resolution and mutual problem solving. Leadership
guides team interactions so that members can engage in conflict without adverse negative
consequences (Schein, 1993). Conflict, when it is properly led, promotes learning and
innovation when contending parties interact to mutually understand and search for
resolutions comprised of differing perspectives.
The way enabling leadership deals with conflict highlights how tension works
with the other catalyzing conditions of interaction and interdependence. Open interaction
and mutual problem solving promoted by enabling leadership contributes to positive
collaborative interdependence which provides encouragement for the perspective that
incorporating other’s ideas will help individual and team performance and in turn will
lead to more interaction (Tjosvold et al., 2005b). Tension uses and supports the benefits
of interaction and interdependence on innovation teams.
Resonance
Resonance is the fourth condition of enabling leadership which catalyses adaptive
leadership and emergence. Resonance is defined as correlation among agents which
24
supports their acting in concert and is a condition that helps self organized aggregations
of agents choose to work and achieve a common outcome together (Uhl-Bien et al.,
2007). Resonance relates to the forces which bind agents together who are heterogeneous
in constraints, knowledge and preferences. While resonance is not specifically listed as a
catalyzing condition by Uhl-Bien et al., (2007), subsequent discussions with one of the
authors, Mary Uhl-Bien, highlighted resonance as an important catalyzing condition in
CAS to which complexity leadership attends. Resonance helps the generation of new
ideas and makes it possible for teams to take ideas through to application or
implementation.
Resonance and leadership’s enabling role have been recognized in team research.
Resonance is evident in team cognitive structures and dynamics supporting collective
action, such as, team identity (Van der Vegt & Bunderson, 2005), team culture (Earley &
Mosakowski, 2000), and shared super-ordinate goals (Milliken et al., 2003). Team
identity is the socially constructed sense of “entitativity” (i.e., a thing unto itself or a
sense being a distinct group) and is a feature of high performing heterogeneous teams
who are capable of unified action (Earley & Mosakowski, 2000). Leaders use identity to
frame how the members understand the nature of the team and their roles. In CAS, team
identity brings degrees of stability and continuity which provide enough of a foundation
for adaptation to be supportable (Schneider & Somers, 2006). Team culture refers to the
social and cognitive environment, the shared view of reality, and the collective belief and
value system reflected in a consistent pattern of behaviors among participants (Jassawalla
& Sashittal, 2002). Creation of a team culture is an important achievement that helps
equip individuals to innovate as a group and provides a means to integrate a multiplicity
25
of cultures with their existing viewpoints and knowledge. In innovation teams
characterized by heterogeneity among organizational and demographic cultures,
leadership is a factor in whether a productive team culture is blocked from emerging
(Earley & Mosakowski, 2000). Effective leadership helps the team navigate interactions
by making sense of the differences among the multiple existing subcultures within the
group and of the emerging team culture with its new norms and values (Jassawalla &
Sashittal, 2002). Super-ordinate goals have been shown to positively affect creativity and
learning by bringing members with diverse agendas together through awareness of their
mutual interests (Milliken et al., 2003). While control oriented extrinsic motivators, such
as task oriented measurements, are detrimental to creativity, information based
motivators, such as super-ordinate goals, are conducive to team creativity (Amabile,
1997). By giving meaning to the value team goals have to the larger organization, leaders
create a unifying purpose that furthers the innovation of the group (Mumford &
Licuanan, 2004). Underlying the formation of identity, culture and super-ordinate goals is
the sense-making and sense-giving that leadership provides.
Enabling leadership uses sense-making and sense-giving to help the team increase
correlation through the development of common or shared understanding (Gioia &
Chittipeddi, 1991; Marion & Uhl-Bien, 2001). Sense-making and sense-giving are done
through a number of leadership behaviors including: the repeated use of specific
language (Lichtenstein, 2000), the use of symbols or rituals (Plowman, Baker, Beck,
Silansky, Kulkarni, & Travis, 2007b), and the telling of stories (Boal & Schultz, 2007).
These behaviors reveal, reinforce and frame the meaning of shared experiences and lead
teams to form a shared understanding of unfolding events. Gaining credibility and
26
relevance for shared understanding are difficult challenges, especially given the dynamic
nature of CAS and the heterogeneity among its members (Lichtenstein & Plowman,
2009; Weick & Roberts, 1993). When many heterogeneous agents are interacting to
produce a creative outcome, leader sense-making helps bridge gaps in understanding and
is an important factor influencing performance (Dunham & Freeman, 2000). Complex
activities involving many interactions induce fluid structures and understanding
(Kazanjian, Drazin, & Glynn, 2000). In these conditions, leaders’ sense-making and
sense-giving activities aid the development of shared mental models about events and
their consequences (Frankwick, Walker, & Ward, 1994) and are a significant influence
on performance. Leadership sense-making and sense-giving enable resonance on
innovation teams so that collective effort of members is engaged.
Resonance complements the second catalyzing condition, interdependence. With
interdependence, team members rely upon each other; with resonance, members find
reason and meaning to act in a concerted manner. Interdependence and resonance work
together on innovation teams to transform potentially random interaction among
members into purposeful interaction. Concerted efforts of members lead to the generation
of new innovative ideas and the momentum for taking new ideas through the process of
application and implementation.
Manage the Entanglement Between Adaptive and Administrative Structures
The second function of enabling leadership recognizes that differences between
ordered administrative structures and the dynamism of adaptive structures must be
managed and bridged. Enabling leadership seeks to influence the relationship and
interchanges so that ordered and emergent system elements work complementarily and

27
not counter to one another (Uhl-Bien et al., 2007). Administrative and adaptive elements
may by their nature be inherently antithetical but need not be inimical to each other. For
example, the existence of functional routines will not preclude emergence and self-
organization if the interfaces between formal functions and innovators are managed
appropriately (Dougherty & Hardy, 1996). In order to manage the entanglement between
adaptive and administrative structures, enabling leadership influences the reciprocal
interaction between the two by recognizing and responding to the needs of both. In
innovation teams, administrative and enabling leadership together mediate with formal
organizational structures to garner resources, to ensure safety and autonomy for the team
and to facilitate the dissemination of innovation outcomes into the larger organization.
This function of enabling leadership represents the boundary spanning role of innovation
leadership described in the literature (Ancona & Caldwell, 1992a; Burke, Stagl, Klein,
Goodwin, Salas, & Halpin, 2006; Hirst & Mann, 2004).
Boundary spanning involves leadership activity with lateral and vertical outsiders
and deals with both politically oriented communication that increases the influence of the
team, and task coordination which expands the resources and information available to the
team and resolves problems important to other groups (Brown & Eisenhardt, 1995).
Occasions for intrusive outside political pressure and the resulting need for political
communication happen frequently on innovation teams because their efforts span
departmental boundaries, are dependent on resources throughout the organization, and
involve continuous evaluation and regular review (Benjamin, 1993). Political processes
entail both observable and covert influence (Eisenhardt & Bourgeois, 1988; Pfeffer,
1981). Administrative leadership engages in tangible observable interactions with formal

28
structures, such as stage reviews, with open and forthright discussion and full disclosure
of information, while enabling leadership attends to impression management with
symbolic and meaning shaping communication to influence attitudes, beliefs, and
opinions of others (Benjamin, 1993). Both are necessary because political processes
impacting innovation occur on two inter-related levels: first, formal maneuvering for
resources and autonomy, and secondly, the shaping of meanings and attributions that
influence the construal of the innovation’s value to the organization (Frost & Egri, 1991).
Politically oriented activities have been characterized as ambassadorial (Ancona &
Caldwell, 1992b) and include lobbying for support, protecting the team from outside
pressure and managing the perceptions of outsiders about the team and its work. The
second function of boundary spanning, task coordination, involves communicating with
others to dialogue about technical and design issues and to acquire resources, including
people, technology and information (Ancona & Caldwell, 1992b). Coordination with
other groups enhances the likelihood of obtaining knowledge and perspectives about
domain-relevant and procedural knowledge bases (Hülsheger et al., 2009) and of solving
problems during development which will later facilitate adoption of the innovation by
other groups. Enabling leadership maintains substantive two way information linkages
with outsiders even as the innovation team strives to operate with the autonomy which
permits the free flow of internal dialogue necessary for team creativity (Mumford, 2000).
If autonomy becomes a disconnect from the formal organization, the team could be cut
off from needed resources and subsequently, the adoption of the team’s innovation could
be blocked.
29
By managing the entanglement between adaptive and administrative structures,
enabling leadership helps make innovation happen within industrial companies. The
resources, information and autonomy required to generate new knowledge and ideas are
made available to the team. The team’s new ideas will be found to be useful because they
are connected to the company’s goals, strategies and competencies and the likelihood that
the ideas will be applied or implemented across the company is increased.
Complexity Leadership as Shared Leadership
One additional aspect of complexity leadership, its shared nature, must be
considered before a statement of the hypothesized relationship between complexity
leadership and innovation can be made. CLT describes that complex leaders encourage
mutual influence among agents and networks of agents (Marion & Uhl-Bien, 2001).
Adaptive leadership is fundamentally a mutual influence dynamic among members.
Complexity leaders enable interaction which leads to members adapting and structuring
their work rather than the leader controlling and directing. CLT asserts that the best
innovations emerge, not from the limited vision of the leader but when members
themselves work through issues (Marion & Uhl-Bien, 2001). This view of leadership has
been corroborated by research which found leaders of innovation teams were more
successful when they practiced subtle rather than controlling leadership (Cooper &
Kleinscmidt, 1987, Zirger & Maidique, 1990). Subtle leadership facilitates self
organization which allows for the leadership role to shift among team participants.
Complexity leadership is not only the work of the leader but is work shared by the
members of the team.

30
Shared leadership is a collaborative team process where members of the group
enact leadership roles rather than where leadership is only the domain of the designated
leader (Pearce & Conger, 2003). Shared leadership entails a simultaneous, ongoing,
mutual influence process among members within knowledge based teams (Pearce, 2004).
Shared leadership is evident when whole teams take on the responsibility of creating
direction, alignment, and commitment that broadens and enriches the sources of expertise
and insights compared to the limitations that arise when a single person, the leader,
provides direction (O'Connor & Quinn, 2004). Shared leadership aligns with
collaborative team dynamics arising from leadership enabled interaction,
interdependence, tension and resonance. The CAS processes of self-organization and
emergence are conceived as bottom up and are supported through bottom up leadership,
wherein the members are involved in mutual influence rather than only influenced by the
leader. Shared leadership supports collaboration in innovation teams and aligns with their
information intensive interchanges.
Shared leadership has been empirically studied and its positive effects verified. In
this literature, shared leadership exists when multiple group members exhibit leadership
behavior within team interactions and can coexist with vertical leadership. Pearce and
Sims (2002) studied change management teams at a large automotive manufacturing firm
and found shared leadership provided additional positive influence on team effectiveness
beyond the vertical leadership of designated team leaders. Shared leadership more
strongly predicted team performance than vertical leadership in virtual teams engaged in
social work projects (Pearce, Yoo, & Alavi, 2004). Ensley and colleagues (2006) studied
top management teams (TMT) of new ventures and found that shared leadership

31
significantly contributed to company performance beyond the influence of vertical
leadership. Shared leadership increased TMT performance and enabled the top managers
to share divergent views and at the same time maintain a unified convergent purpose.
Consulting teams performed better in projects requiring production of significant client
deliverables when members shared leadership (Carson et al., 2007).
Research exists which supports a shift from considering only the influence of the
leader to considering leadership as a collaborative process among the leader and group
members. Hierarchical and concentrated leadership impedes innovation by blocking
learning, while distributed or shared leadership facilitates learning and increases the
speed of innovation in a group (Papadakis & Bourantas, 1998). Focusing energy only
toward a charismatic or transformational leader and his/her vision distracts members’
attention from their work and restricts their autonomy to create their own vision, and may
explain why in some studies, teams without transformational leaders outperform those
with such a leader (Mumford, Scott, Gaddis, & Strange, 2002). Shared leadership,
because of its information rich relational interactions, leads to greater shared learning and
innovation by those involved and in the organization generally (Argryis & Schon, 1978;
Beer, 1999). Leadership skills that foster innovation are more effective when they are
shared across the team rather than concentrated in one person (O'Connor & Quinn, 2004).
Because complexity leadership is a form of shared leadership, this study when
assessing the relationship between complexity leadership and team dynamics and
innovation team outcomes must account for both the vertical, that is, the leader, and
shared, that is, members, manifestations of complexity leadership and their influences.
Statement of Hypothesis

32
Innovation is the development of new knowledge which is subsequently
implemented by an organization as new products or processes. Through administrative
leadership, complexity leadership links the team to organizational administrative
structures so that team efforts are supported and outputs can be implemented into the
larger organization. Complexity leadership contains the mutual influence dynamics from
which learning and innovation emerge. Complexity leadership fosters the conditions,
including interaction, interdependence, tension and resonance, which catalyze dynamics
productive of learning and innovation. Interaction makes tacit information available for
team processing and broadens perspectives, both of which can lead to unexpected
association of ideas and new knowledge. Complexity leadership furthers collaborative
interdependence which leads teams to exhibit greater creativity and quantum leaps of
innovation (Jassawalla & Sashittal, 2006). By enabling tension, complexity leadership
helps prevent premature convergence by helping the team sustain divergent interaction
and allows the team to use conflict productively. Complexity leadership uses sense
making and sense giving to create resonance among heterogeneous members which
supports their acting in concert and which creates common understanding and
convergence. By managing the connection between the ordered administrative processes
and emergent learning and innovation events, enabling leadership ensures that resources,
information and autonomy required to generate new knowledge and ideas are available to
the team and that the team’s new ideas will be implemented because they are useful to
the company’s goals, strategies and competencies. Complexity leadership is performed
by both the leader and members of innovation teams and, shared leadership increases
information rich interactions, innovativeness and the speed of innovation in teams

33
(Argryis & Schon, 1978; Beer, 1999; Papadakis & Bourantas, 1998). Therefore, it can be
hypothesized:
Hypothesis 1: Complexity leadership manifested by either team leader or team
members or both is positively related to innovation team outcomes.
Complexity Leadership and Learning
Learning and innovation are inextricably linked. Learning, because it entails the
active interaction between concepts and practice, is a fundamental process in innovation
and is comprised of trial and error cycles of ideas, actions, outcomes and responses (Van
de Ven & Polley, 1992). Within CLT, CAS are organizational systems adept at learning
and, specifically, learning within CAS is aggregate learning which connects CLT to the
team and organizational learning literatures. Team and organizational learning have been
described as the processes through which knowledge is obtained and used that provide
opportunities for improvement (Edmonson, 1999; Gibson & Vermeulen, 2003).
Individual learning is a component of team and organizational learning, but the
knowledge learned by an individual only becomes organizational learning when this
knowledge is shared and used for change in the organization (Fiol & Lyles, 1985).
Learning at the aggregate level incorporates individual learning into group learning
processes supported by interaction, interdependence, tension and resonance (Uhl-Bien et
al., 2007) and is a prime purpose of complexity leadership. Organizations rely on their
innovation teams to be particularly adept at learning for the benefit of the larger
organization. Complexity leadership’s relationship to team learning is an important
consideration to more fully understand its influence on innovation team outcomes.

34
Similar to the influence complexity leadership has on innovation team outcomes
by increasing collaboration in creative interchanges, complexity leadership enables
collaborative learning, a type of learning specifically related to team innovation.
Innovation depends upon a communal learning process involving the communal
construction of conceptual frameworks, impressing it on reality and observing and
interpreting the interaction (Brown & Duguid, 1991). Collaborative learning is people
sharing and understanding knowledge together through their interaction and
interdependence enabled by complexity leadership. The concept of collaborative learning
is a team level phenomenon and builds upon the literature of cooperative learning
(Johnson et al., 1978), which studied learning in dyads and among small groups.
Collaborative, or cooperative, learning is contrasted to competitive learning and to
individualistic learning and exists when individuals work together to maximize their own
learning as well as each other’s learning. Collaborative learning was shown to improve
performance individually and collectively (Johnson et al., 1978) more than the other
types of learning.
Collaborative learning increases knowledge sharing and creation and develops
when the interdependence of group members, the structure and content of interactions,
and the pattern of other group processes are responded to positively (Janz &
Prasarnphanich, 2003). In collaborative learning, members teach each other about their
knowledge and expect other members to do so. Collaborative learning promotes more
positive attitudes towards heterogeneity among peers (Johnson et al., 1978); different
knowledge, perspectives and cognitions are respected, valued, and actively sought.
Complexity leadership helps build the collective behaviors of collaborative learning by
35
giving sense to the value that differences among members provide to team innovation
performance. The resonance enabled by complexity leadership fosters team members to
make mutual adjustments which provide feedback mechanisms and are effective means
to coordinate knowledge in dynamic environments (Mintzberg, 1979) such as innovation
teams. Complexity leadership addresses tension and conflict which can impede learning
(Argryis, 1999). Cognitive and other behavioral changes associated with learning can
cause unproductive or crippling tension; leadership helps equip the team to stretch
without breaking by making sense of aspirations and increasing tolerance for
interpersonal risk (Argryis, 1999), which are actions espoused in complexity leadership
(Uhl-Bien, et al., 2007). In collaborative learning, team members express and explore
their divergent views. Conflict can potentially block mutual learning which leadership
helps the team avoid by distinguishing between the constructive and destructive aspects
of conflict and by engaging conflicting parties in joint discussion to understand and
resolve discrepancies between them (Argryis, 1999), actions promoted in complexity
leadership (Uhl-Bien et al., 2007).
Collaborative learning involves a deep multi-step process of sharing, comparing,
relating and testing knowledge. By observing learning interactions, Rochelle (1992)
described a collaborative process of learning. Collaborative learning starts with
expressions of perceptions of reality at an intermediate level of abstraction situated in the
understandings held by participants. Relationships and differences emerge from the
interaction of metaphors derived from members’ knowledge bases and which can link
members understanding. Members engage in interactive cycles of confirming and/or
repairing constructed shared understanding through situated actions, such as,

36
experimentation, simulations, appeals to expertise external to the interaction and other
means. By applying progressively higher standards for testing evidence, convergence on
shared understanding and/or construction of new knowledge occurs. In the collaborative
learning process, team members work together to share tacit knowledge (i.e., what each
individual knows but does not normally make available to others) and to develop new
knowledge, and these sharing processes increase innovative performance through the
socialization of knowledge which converts tacit knowledge into new knowledge and then
into tested knowledge (Janz & Prasarnphanich, 2003). Collaborative learning enhances
innovation performance of individuals and of the team (Janz & Prasarnphanich, 2003).
Learning is central to the goals of both exploitative and explorative innovation
(March, 1991; Van den Bosch et al., 1999). Exploitation efficiently seeks to learn new
uses for and to create innovation from knowledge existing in the organization.
Exploration seeks to absorb, that is learn, new knowledge in order to expand the scope
and variety in organizational knowledge which enables the creation of new knowledge
and of innovation by combining different knowledge bases. Collaborative learning
supports both forms of innovative activity.
To make possible the use of existing knowledge, collaborative learning solves a
critical challenge for innovation teams. People from different thought-worlds will have
sufficient understanding of one another’s existing knowledge to be able to create
something new together (Dougherty, 1992). Cronin and Weingart (2007), through their
concept of representational gap developed from information processing psychology and
shared mental model research, present an exposition of the depth of the learning hurdle
innovation teams can face. As defined by Cronin and Weingart (2007), a

37
“representational gap is a group-level phenomenon that arises as a function of the
cognition of individuals working together to solve a problem” (p. 762). Gaps open
because there are differences in individual cognitive representations about the specifics
of the problem arising from their tacitly held knowledge.
Members construct their individual representations unconsciously from their
existing schemas or mental models because they try to capitalize on what they know and
value when solving problems (Dougherty, 1992; Weingart, Cronin, Houser, Cagan, &
Vogel, 2005). For example, when experts from different disciplines try to solve a
problem, each will use the trained principles from his or her domain; consequently,
differences occur in goal preferences, perceived constraints, understanding of what can
be altered, and the rules to apply. Because members can only make sense through their
different perceptions, misunderstanding and conflict increase which can degrade team
innovation performance. New knowledge communicated by other members is unlikely to
influence other members’ representations because of the circularity and self-reinforcing
use of their existing representations to evaluate and understand new knowledge. The
same process interferes with the creation of shared representations or “communal
conceptual frameworks” critical to innovation (Brown & Duguid, 1991). The unexamined
use of existing representations is an example of the limitations associated with single
loop learning described by Argryis (1999) where adaptive learning is blocked because
underlying rules and assumptions are not examined and altered. The deeper collaborative
leaning ensures that the work to explore members’ representations is done sufficiently to
uncover problematic incompatibilities, contradictions and gaps. As Schein (1993) pointed
out, normal coordination mechanisms are not up to the task. Deeper dialogue is required

38
that makes it possible for people to discover that they use language differently, that they
operate from different mental representations, and that these structures are learned social
constructions of reality and thus limited by nature and subject to change. When the time
and effort for collaborative learning is taken, teams can engage in double loop learning,
where open discussion, experimentation and other means can be utilized to ensure
development and testing of new more innovatively productive representations (Argryis,
1999).
In addition to facilitating the use of existing knowledge, collaborative learning
increases absorptive capacity, that is, the ability of the team to learn and use new
knowledge which exists outside its current knowledge bases. New knowledge is brought
into the team through formal and informal interactions and linkages with outsiders
catalyzed by complexity leadership (Uhl-Bien et al., 2007). Described previously, the
collaborative learning process contains steps that facilitate linking to this new
knowledge. This is an important consideration because absorptive capacity is contingent
on the relationships that are made between newly acquired knowledge and the
organization’s existing knowledge. Only new knowledge which can be related to, can be
absorbed (Cohen & Levinthal, 1990). Relationships are forged through lateral
communication between members of a group which arises from coordination that can be
explicitly designed but may emerge from a process of interaction among members (De
Leeuw & Volberda 1996). While requiring time and effort, knowledge coordination
positively influences absorptive capacity because it increases flexibility in making
connections between different knowledge and expands the range of knowledge which can
be related (Van den Bosch, Volberda & de Boer, 1999). Collaborative learning increases
39
likelihood that relationships can be discovered and knowledge absorbed because it entails
intensive communication and development of metaphors which link knowledge bases.
The functions and the catalyzed conditions of complexity leadership foster the
emergence of collaborative learning in innovation teams. Collaborative learning is people
sharing and understanding knowledge together. Complexity leadership furthers
collaborative learning by supporting the time and effort required for in depth knowledge
sharing and exploration by structuring interactions, by encouraging interdependent
thinking, through sustaining tension while different understandings are explored and by
seeking to build connections among separately held knowledge. On a team, both the
leader and members engage in complexity leadership. Shared leadership facilitates
learning while only hierarchical and concentrated leadership impedes learning,
(Papadakis & Bourantas, 1998). Collaborative learning is a process which closely relates
with and leads to innovation in teams. Collaborative learning allows teams to understand
and exploit the knowledge possessed by members and to absorb and use new knowledge.
Teams uncover gaps in their knowledge which they must bridge through the creation of
new knowledge. Learning and knowledge creation are fundamental work of innovation
teams. By influencing collaborative learning in addition to other team process helpful to
innovation, complexity leadership indirectly enhances innovation team outcomes.
Therefore, it can be hypothesized that:
Hypothesis 2a: Complexity leadership manifested by either team leader or team
members or both is positively related to collaborative learning.
Hypothesis 2b: Collaborative learning is positively related to innovation team
outcomes.
40
Hypothesis 2c: Collaborative learning partially mediates the relationship between
complexity leadership manifested either by the team leader or by team members, and
innovation team outcomes.
Complexity Leadership and Heterogeneity
Heterogeneity among participants is a main characteristic of CAS and of
innovation teams. In complexity theory, it is from the interdependent interaction of
heterogeneous agents in CAS that learning and innovation emerge (Marion & Uhl-Bien,
2001). Innovation teams are purposefully populated with members heterogeneous in
background, expertise, and perspective in order to bring together the task knowledge
which can lead to productive new and novel combinations and to engage representatives
of the varied functional expertise necessary for problem solving and implementation of
the innovation (Brown & Eisenhardt, 1995).
Leadership is challenged to gain positive effects from the heterogeneity present
on innovation teams because heterogeneity has been shown to have contradictory effects
on group performance (Harrison & Klein, 2007; Mannix & Neale, 2005; van
Knippenberg & Schippers, 2007; Williams & O’Reilly, 1998). Heterogeneity enhances
groups’ ability to create and adapt but also increases conflict and reduces collaboration
among members. Because these contradictory forces can cancel out any advantage from
the critical factor of heterogeneity, the dynamics enabled by complexity leadership must
help avoid the negatives and realize the positives of heterogeneity in innovation teams.
CLT assumes heterogeneity to have beneficial effects in CAS without explaining the
mechanisms that would lead to positive influence. Given the well documented
contradictory effects of heterogeneity, it would advance CLT to conceptualize how
41
complexity leadership enables the leveraging of heterogeneity for learning and
innovation and what potential self-organized elements arise from its dynamics which
assure heterogeneity will be helpful to learning and innovating. Certainly, how
heterogeneity is handled within innovation teams will influence their ability to innovate;
the role complexity leadershipplays will be discussed in following sections. Hypotheses
will be proposed that examine how complexity leadership moderates the relationship of
heterogeneity to innovation team outcomes and how positive team norms regarding
heterogeneity arising from the dynamics enabled by complexity leadership, influence the
relationship between leadership and team outcomes.
The effect of heterogeneity upon team performance, generally, and on team
innovation, specifically, has been extensively studied in the diversity research.
Comprehensive reviews of this literature have pointed to a bifurcation in the theories
explaining the contradictory effects of group heterogeneity on performance (Harrison &
Klein, 2007; Mannix & Neale, 2005; van Knippenberg, & Schippers, 2007; Williams, &
O’Reilly, 1998). Two theoretical streams split into theories focused on social category
diversity and the causes of negative effects and theories focused on job related diversity,
which stress the causes of positive effects.
The social category diversity view of heterogeneity is based upon a social identity
and social categorization perspective which holds that recognized differences and
similarities among group members cue individuals to categorize self and others.
Individuals will have favorable preferences towards others or groups seen as similar and
negative responses toward those who are seen as different. The individual’s differences
can negatively affect self perceptions and attitudes which influence behaviors. For
42
example, differences in age, tenure, education, sex and race reduce individual’s
psychological attachment to the group (Tsui, Egan and O’Reilly, 1992). Because of
differences in cognitive style, individuals inaccurately perceive their own creative
performance and have lower group satisfaction (Kurtzberg, 2005). At the team level,
social identity and social categorization theories also suggest members will identify less
with the larger more diverse group and more with similar subgroups (Rico, Molleman,
Sánchez-Manzanares, & Van der Vegt, 2007). Consequently, subgroup polarization
increases which leads to more conflict, less collaboration, less cohesion and, ultimately,
to lower quality decisions (Lau & Murnighan, 1998; Li & Hambrick, 2005). In the social
category diversity view, heterogeneity presents impediments to team performance,
particularly in complex tasks such as innovation.
The job related diversity view uses information processing/decision making
perspective which holds that the differences among group members bring together non-
redundant knowledge, skills and abilities. These unique contributions are task relevant,
and even as these differences cause task oriented conflict, the interactions lead to more
alternatives, new solutions and better decisions (Ancona & Caldwell, 1992a; De Dreu &
West, 2001). Members from different thought worlds with different information networks
articulate different ideas, concerns, beliefs and information. Through collaboration, the
exchange of information and perspectives positively impacts individual and group level
processing when implications are integrated (van Knippenberg et al, 2004; Jehn,
Northcraft, & Neale,1999). Further, the positive relationship between heterogeneity and
performance increases as the task of the group is more complex and non-routine (van
Knippenberg et al., 2004). The job related diversity view sees task relevant heterogeneity

43
as a positive force and a necessary team ingredient which leads to more productive
innovation.
While the contradiction of heterogeneity and inconsistency in findings remain
unresolved, researchers have suggested ways to untangle the knot. Van Knippenberg and
colleagues (2004) propose integrating the social categorization and information
processing theories into a unified model. In their theoretical model, CEM for
Categorization-Elaboration Model, they expand consideration and clarify the role of
elements in social categorization. It is not social categorization itself that directly
influences performance but the affective evaluative responses to heterogeneity based on
perceived threat or benefit from it that moderates group information processing and
subsequently performance. This view opens the possibility of positive attitudes towards
heterogeneity and challenges the social categorization perspective to address the need
observed by van Knippenberg and his colleagues (van Knippenberg & Haslam 2003; van
Knippenberg & Schippers, 2007) for the social categorization perspective to incorporate
positive relationships of heterogeneity with group interaction. Additionally, van
Knippenberg et al. (2004) posit that the elaboration of task-relevant information, that is
the sharing, interchange and combining of ideas, knowledge and perceptions, is the
information processing process and the chief means by which heterogeneity influences
team creative and innovative performance. This study will follow the framework of van
Knippenberg and colleagues. In its theory development, moderators and mediators will
be examined by considering their social categorization effects and their information
processing effects.
44
This study deals with heterogeneity as it is conceived by complexity leadership
which focuses on differences in knowledge and knowledge networks and the skills,
competencies and perspectives related to the knowledge. Other forms of diversity which
have been extensively examined in the literature, such as categorical diversity, are not
considered in this study because of its focus on complexity leadership theory.
Complexity Leadership and Job Relevant Heterogeneity
Complexity leadership is theorized in this study to enable dynamics which
leverage heterogeneity in CAS for learning and innovation. As suggested by CLT,
leveraging heterogeneity would involve enabling a collective impetus among
heterogeneous agents to interact in ways that produce new patterns of thinking or new
modes of operating (Uhl-Bien et al., 2007). Through leveraging heterogeneity,
diversification in behaviors, strategies and responses is increased which enhances the
organizational system’s capacity for innovation and adaptation to environmental
problems or internal demands (McKelvey, 2007). In CLT, heterogeneity refers to
differences among agents in relevant attributes, such as skills, knowledge, preferences,
and outlooks (Uhl-Bien et al., 2007). Job relevant heterogeneity has been studied
extensively and, similar to other types of heterogeneity, has been found to have
inconsistent relationship to team outcomes. In their meta-analysis, Hülsheger and
colleagues (2009) found that while generally a positive relationship between job relevant
heterogeneity and team innovation was evident, the variance among studies prevented
generalizing this finding. They concluded that unidentified factors which varied among
studies play intervening roles in the relationship. Research has demonstrated that
leadership is one potential intervening factor with positive moderation effects found for

45
transformational leadership (Kearney & Gebert, 2009) and with moderation effects
varying for different leadership styles (Somech, 2006). Likewise, complexity leadership
potentially moderates the relationship. It is proposed that through the enabling aspect of
complexity leadership, dynamics are catalyzed in innovation teams which increase job
relevant heterogeneity’s information processing benefits and decrease its social identity
impediments.
Job relevant heterogeneity relates to the differences among members in attributes
which tie closely to the task at hand, such as, function, education, professional role, and
types of tenure (Millikin & Martins, 1996; Pelled, Eisenhardt, & Xin, 1999).
Heterogeneity in these attributes has been theorized to be related to team innovation
because they represent differences in knowledge, skills and expertise which can help the
team create solutions for new products and processes (Woodman, Sawyer, & Griffin,
1993). Individual and collective creative processes are stimulated by the interaction of
people with divergent job related backgrounds, such as, differing functional and/or
industry experience, and with varied educational backgrounds who contribute different
thinking approaches and perspectives (Perry- Smith, 2006). Additionally, team members
with divergent backgrounds not only bring the knowledge they possess but also bring
different information networks which broadens the sources of information and
perspectives available to the team (Perry-Smith & Shalley, 2003; West, 2002). For teams
where the need for cognition was high, educational diversity improved team leader
assessments of team performance, presumably because high cognitive demands promote
the benefits from educational differences to information processing (Kearney, Gerbert, &
Voelpel, 2009). In a study of 88 cross-functional teams (Yeh & Chou, 2005), function

46
and job position diversity had positive influence on team learning behaviors which this
study has argued, are important contributors to team innovation outcomes. However, two
recent studies (Somech, 2006; Van der Vegt, Van de Vliert, & Huang, 2005) found no
direct influence by function diversity on team outcomes including team reflection, team
innovation and team performance. These studies reinforce the inconsistency of effects
across studies noted by Hülsheger and colleagues (2009) and the need to identify
intervening factors. The benefits of job relevant heterogeneity can be realized if
dynamics are present on innovation teams that increase information processing capacity
and avoid the effects of negative biases toward heterogeneity.
The four conditions enabled by complexity leadership: interaction,
interdependence, tension and resonance, create dynamics contribute to leveraging job
relevant heterogeneity in innovation teams. Complexity leadership increases interaction
among agents in CAS. Interaction is a primary condition required to gain benefit from job
relevant heterogeneity. Heterogeneity which is not engaged through interaction will have
little influence on innovative outcomes. In their study of 224 R&D teams, Reagans and
Zuckerman (2001) found that team heterogeneity by itself did not predict team
productivity but heterogeneity combined with level of interaction was linked to
productivity. They broke interaction into two elements: “network density” which is how
much team members communicate with one another and "network heterogeneity," the
percent of team communication among members with different backgrounds. They
conclude that relevant heterogeneity must be engaged through social interaction for it to
have value to team performance. Through enabling interaction among members,
47
complexity leadership increases both “network density” and “network heterogeneity” and
the information processing on innovation teams.
Complexity leadership enables collaborative interdependence among team
members. Pertaining to social categorization, collaborative interdependence among team
members focuses members on common tasks and goals and reduces salience of subgroup
categorization. Further, collaborative interdependence increases and facilitates intra-team
exchange and interaction which enhances team information processing. From both the
social categorization and information processing perspectives, collaborative
interdependence would be associated with more positive effects of heterogeneity on team
processes and outcomes. Interdependence and collaboration have been shown to
moderate the relationship between group heterogeneity and group outcomes. In a number
of studies, Chatman and colleagues (Chatman & Flynn, 2001; Chatman, Polzner,
Barsade, & Neale, 1998; Chatman & Spataro, 2005) found that in groups with
cooperative norms which favor interdependent work efforts, group heterogeneity was
more positively related to group performance outcomes. Cooperative group cultures were
associated with more positive relation between heterogeneity and performance (Jehn &
Berzrukova, 2004). Several studies examined task interdependence, where members
must work together to perform a task, and/or outcome interdependence, where outcomes
can only come about from the combined efforts of members (Wageman, 1995).
Heterogeneity was only positively related to innovative behavior when both task
interdependence and outcome interdependence were high (Van der Vegt & Janseen,
2003). Heterogeneity was positively rated to team reflexivity, that is, the ability to self-
examine team information processing, and team performance when outcome
48
interdependence was high (Schippers, Den Hartog, Koopman, & Wienk. 2003). While
studying demographic heterogeneity, Jehn et al. (1999) found that when task
interdependence was high, heterogeneity was more positively related to satisfaction and
commitment.
Complexity leadership injects tension by enabling dynamics wherein differences,
dissent, and divergent perspectives are encouraged and members accept responsibility for
resolving differences and creating solutions (Heifetz & Laurie, 2001; Uhl-Bien et al.,
2007). These tension filled dynamics have positive influence on both information
processing and social categorization aspects of heterogeneity. As discussed above,
heterogeneity can only provide value if it is engaged trough interaction (Reagans &
Zuckerman, 2001) and has greater effect through increased interaction among
heterogeneous group members (i.e., “network heterogeneity”). When interaction between
task related differences is encouraged by complexity leadership, the likelihood of
increased “network heterogeneity” will occur which in turn increases the likelihood that
the heterogeneous information available to the team will be processed. When complexity
leadership makes differences salient, social categorization may act to stimulate
information processing. When groups possessing heterogeneous information contain a
person who is recognized as different, they tend to more effectively use their information
heterogeneity which suggests that the recognized heterogeneity alerts the group to the
potential existence of different information (Phillips, 2003; Phillips & Lewin-Loyd,
2006; Phillips, Northcraft,& Neale, 2006). One consequence of tension can be conflict,
and conflict has also been related to heterogeneity. A basic tenant of social categorization
theory supported by research is that homogeneous groups will experience less incidents

49
of conflict while heterogeneous groups will experience more conflict among members
(Harrison & Klein, 2007; Mannix & Neale, 2005; van Knippenberg & Schippers, 2007;
Williams & O’Reilly, 1998). However, inconsistent results have been found in the
relationship between heterogeneity and group performance. In some studies, conflict
positively affects heterogeneity’s relation to performance (De Dreu & Weingart, 2003;
Lovelace, Shapiro, & Weingart, 2001); while in others the effects are negative (Cox,
Lobel, & McLeod, 1991; Jehn et al., 1999; Li & Hambrick, 2005). These different
results have been explained alternately by information processing theory which asserts
that conflict increases the consideration of divergent information and leads to better
decisions and more creative solutions and by social categorization theory’s view that
conflict blocks communication and consideration of heterogeneous information. This
dilemma can be used to highlight the effects of complexity leadership’s handling of
conflict. While De Dreu and Weingart’s (2003) meta-analysis of the extensive conflict
literature found that conflict of any type is negatively related to group performance,
Hülsheger et al. (2009) found no correlation between conflict and team innovation
performance. To restate the point made previously in this paper, it can be said that the
presence or lack of conflict is not as important to innovation performance as what is done
with conflict; the way conflict is managed determines whether performance will be
helped or hindered (Simons & Peterson, 2000; Tjosvold, 1998). Complexity leadership
enables open identification and discussion of differences, and actively instigates
collaborative problem solving among contending parties (Uhl-Bien et al., 2007). Any
conflict arising from heterogeneity is more likely to have positive effects on performance
in the presence of complexity leadership.

50
Complexity leadership enables resonance, defined as correlation among
heterogeneous agents which supports their acting in concert and is a condition that helps
aggregations of heterogeneous agents choose to work and achieve some common
outcome together (Uhl-Bien et al., 2007). Through leadership sense-giving and sense-
making, complexity leadership fosters dynamics that enable teams to create collective
structures such as team identity, team culture and team super-ordinate goals which bind
heterogeneous members together. These structures focus members on what they share in
common and beneficially influence team innovation (Earley & Mosakowski, 2000;
Jassawalla & Sashittal, 2002; Mumford, & Licuanan, 2004). Further, they can reduce the
effects of social categorization by reducing the salience of subgroup categorization. One
area for common cognitions which may influence heterogeneity’s effects is members’
beliefs of how heterogeneity affects the team, referred to as “diversity mind-sets” (van
Knippenberg & Schippers, 2007). Diversity mindsets, such as the “integration-and-
learning perspective” of Ely and Thomas (2001) which perceives heterogeneity as a
valuable resource for the group, have been shown to be associated with positive effects of
heterogeneity, presumably because such attitudes are positive social categorization
evaluative responses which promote information processing. Members with a more
positive belief in the value of heterogeneity report a more positive relationship between
heterogeneity and group identity (van Knippenberg & Haslam, 2003). Groups with
gender heterogeneity are more likely to use their different information in decision making
when they believe in the value of heterogeneity (Homan, Hollenbeck, Humphrey, van
Knippenberg, Ilgen, & Van Kleef, 2008). Complexity leadership is associated with
51
positive beliefs regarding heterogeneity because it enables dynamics, such as
encouraging differences, helpful to their emergence.
The four conditions enabled by complexity leadership: interaction,
interdependence, tension and resonance, create dynamics on innovation teams which
increase job relevant heterogeneity’s information processing benefits and decrease its
social identity impediments. Interaction is a primary condition required to gain
information processing benefit from job relevant heterogeneity (Reagans & Zuckerman,
2001). Collaborative interdependence focuses members on common tasks and goals
reducing salience of subgroup categorization and increases and facilitates intra-team
exchange which enhances team information processing. Complexity leadership injects
tension by enabling dynamics wherein differences, dissent, and divergent perspectives
are encouraged and these tension filled dynamics increase the likelihood that the
heterogeneous information available to the team will be processed (Reagans &
Zuckerman, 2001), that salient differences stimulate information processing (Phillips,
2003; Phillips & Lewin-Loyd, 2006) and that conflict based on differences is handled
productively. Through sense-giving and sense-making, complexity leadership fosters
correlation and focuses members on what they share in common reducing the negative
effects of subgroup categorization. Because complexity leadership enables conditions in
innovation teams which reduce the negative influence of social categorization, increase
the positive effects of social categorization and promote information processing, it can be
hypothesized that:

52
Hypothesis 3: Complexity leadership manifested either by the team leader or by team
members moderates the relationship between job-relevant heterogeneity and
innovation team outcomes.
Complexity Leadership and Heterogeneity Norm
Norms have been demonstrated to be useful structures for teams and are
comprised of shared values and patterns of behavior that emerge from interactions within
teams (Barker, 1993; Bettenhausen & Murnighan, 1991; Feldman, 1984; Friedkin, 2001).
Team norms which regard heterogeneity positively relate to team innovativeness because
these norms provide support for trust and risk taking and lead to more sharing of tacit
information (Jassawalla & Sashittal, 2002). Team norms that enhance cooperation among
heterogeneous members have been shown to influence effectiveness and outcomes of
teams (Chatman & Flynn, 2001). In this dissertation, I propose a heterogeneity norm as
an emergent structure in CAS and in innovation teams arising from the dynamics enabled
by complexity leadership. A heterogeneity norm is defined as a team pattern of tolerating,
respecting and engaging heterogeneity and is theorized to contribute favorably to positive
social categorization evaluative responses and information processes in teams. The norm
guides the teams to behaviors that gain benefit from their differences, obviating the need
for intervening leadership activity.
Team norms influence team performance and are shared values, attitudes and
beliefs that guide member behaviors through social pressure on members to engage in or
avoid certain behaviors (Argots, 1989; Barker, 1993; Bettenhausen & Murnighan, 1985;
1991; Feldman, 1984; Friedkin, 2001). Norms about social behaviors are particularly
important in groups that are highly interdependent, and their presence contributes to team

53
performance (Wageman, 1995). Viewed from social exchange theory, norms give rise to
obligations that form the basis of each person's relationship with others and with the team
as a whole (Shore & Barksdale, 1998). Social information processing theory (Salancik &
Pfeiffer, 1978) showed that people form ideas and select behaviors based upon
information from their immediate work environment, that is, the behavior of others.
When individuals join into teams, their uncertainty regarding expected behaviors are
eased as subsequent interaction within the team clarifies what is appropriate (Colman &
Carron, 2001). People adopt the desire to perform a behavior when they believe that the
behavior will have positive value to themselves and/or to the team (Bommer, Rubin &
Baldwin, 2005). Team norms are shared cognitive structures which can guide behaviors
beneficial to both individual and group outcomes.
A team heterogeneity norm relates group heterogeneity positively to team
outcomes. Ely and Thomas (2001) reported that when an “integration-and-learning
perspective,” which emphasizes heterogeneity as a valuable resource for the group, was
present in the group, members felt more valued and respected. Intra-group relations were
higher quality, and heterogeneous teams were more successful. Members shared an
attitude predicated on the beliefs that a heterogeneous group of people “comes together
for the express purpose of learning from one another how best to achieve the work
group's mission, but that often meant tension- filled discussions in which people
struggled to hear each other's points of view before resolving how to proceed,” (Ely &
Thomas, 2001: 247). This view is supported by work that shows heterogeneous groups
make better use of their heterogeneous information and perform better when they have
value-in-heterogeneity rather than value-in-homogeneity beliefs (van Knippenberg &
54
Schippers, 2007). Team norms which value heterogeneity are particularly important to
the performance of innovation teams because such norms support the information
processing of different knowledge bases on the team. Norms which value individual
differences and uniqueness tend to emerge when the success of the group is dependent on
unique and specialized knowledge, skills and abilities that individual members bring to
the group (Postmes, Haslam, & Swaab, 2005; Postmes, Spears, Lee, & Novak, 2005).
Such norms have positive influence on trust and risk taking and lead individuals to
contribute their specialized knowledge and unique perspectives (Jassawalla & Sashittal,
2002). Members who sense their difference feel safe to question assumptions and think
divergently; the divergent attitude feeds their ability to construct new definitions of
problems, to combine ideas with others into new solutions, and to communicate creative
solutions to the team (Janssen & Huang, 2008). The heterogeneity norm shifts social
categorization concerns from differences among members to a higher team level focus.
Norms that appreciate value of heterogeneity and expressions of individual knowledge
and expertise reinforce rather than mitigate collective goals and group attachment when
heterogeneity and specialized knowledge provide value to team accomplishment
(Bettencourt & Sheldon, 2001; Swann, Kwan, Polzer, & Milton, 2003). When
heterogeneity is tied to the good of the team as a whole, the resulting inclusiveness
supports super-ordinate identity and reduces individual and sub-group biases which could
lead to conflict and deteriorated performance (Homan et al., 2008). In innovation teams,
the heterogeneity norm permits members to handle contested points of view, engage in
debate and realize synergies from differences (Schein, 1993)
Within CLT, a heterogeneity norm, while not explicitly theorized, is anticipated.

55
In CLT, individual preferences are valued because it is from the clash of heterogeneous
preferences that learning and innovation emerges. Rules governing how heterogeneity is
dealt with are important to the dynamics within CAS. According to most complexity
theorists, agent interactions in CAS are governed by few rules which have far-reaching
influence to coordinate behaviors (Lichtenstein et al., 2006; Uhl-Bien et al., 2007) and
the existence of these rules leads to highly ordered but self-organized correlated actions
of agents. For example, flocks of birds form intricate and quickly changing maneuvers
when faced by threats simply by members of the flock observing a few simple rules
governing their movement relative to other nearby members. Such rules enable network
dynamics from which newness and novelty emerge and are different from bureaucratic
rules which work to limit alternatives. In complex networks, interaction rules, such as a
heterogeneity norm, enable open interchanges among dissimilar agents which allow ideas
to emerge, to be elaborated, to conflict with one another, and to gain acceptance or die;
learning and innovation are the resulting outcomes (Uhl-Bien et al., 2007). In CLT
terms, the heterogeneity norm is a form of correlation, which is understood to be the
emergence of areas of common understanding and/or patterns of behavior which lead to a
degree of stability within CAS. Further, the heterogeneity norm is a first order correlation
which means that through the correlation both the needs of individual agents and the
needs of the aggregate as a whole are accommodated (Marion & Uhl-Bien, 2001).
Certain individual and team values are aligned in first order correlations. For example,
with a heterogeneity norm, individuals’ needs for their unique knowledge to be valued
are supported and, in so doing, the team’s need for innovative outcomes is also
accommodated. In knowledge driven organizations, members are not limited to only view
56
their own work and immediate dependencies rather, they seek to address problems
beyond their separate, specialized knowledge, and use their specialized knowledge to
solve a broader range of complex and creative problems and to contribute their expertise
to activities well beyond their old specialization (Zammunto et al., 2007). In so doing,
they serve their organizations need for innovation. Correlation is a form of resonance in
CLT ( Marion & Uhl-Bien, 2001). The heterogeneity norm provides the benefits of
resonance to the dynamics of innovation teams but also in a unique way, provides an
additional benefit of increasing the team’s ability to handle tension arising from
differences among members. When team members value different perspectives from their
colleagues, they are more likely to engage in the tension filled interactions which can
lead to learning and creation of innovative solutions.
CLT views the role that leadership plays in the formation of the heterogeneity
norm differently from traditional leadership theory. Marion and Uhl-Bien (2001)
distinguish between the traditional view of leadership as a link in cause and effect
process wherein leadership influences actions of followers to attain a desired outcome.
Rather, complexity leadership enables dynamics which help agents in CAS self organize,
that is, structures, such as a heterogeneity norm, emerge from their interdependent
interaction. The view that leadership enables conditions within teams for norm formation
is supported in research about team culture formation. As previously stated, team norms
are part of team culture (Earley & Mosakowski, 2000; Jassawalla & Sashittal, 2002).
Leadership has been shown not to create culture but rather to facilitate a process among
organizational members to create a culture which will help the group perform its tasks
and achieve its goals (Earley & Mosakowski, 2000). Norms have influence because the

57
social expectations formed around norms are self enforced as members align their
behaviors with accepted norms, decreasing deviation. This process is an example of the
feedback loops which amplify processes by which emergence and self-organization occur
without external intervention. Complexity leadership does not cause the norm to exist in
a strict cause and effect relationship but enables dynamics by which a heterogeneity norm
can emerge from the interaction within the system.
When the heterogeneity norm with its common attitudes and values is present on
a team, members will tend to more readily share their uniquely held knowledge, will
more confidently engage in discussions of divergent views, will expect to rely on the
knowledge of other team members to resolve problems, will handle the tension associated
with maintaining divergence until true learning and creativity occur, and will avoid
conflict fueled by biases about heterogeneity of other members. Those behaviors
represent realizations of behaviors sought by complexity leadership as it fosters the
catalyzing conditions of interaction, interdependence, tension and resonance. Norms
generally obviate the need for leadership intervention. Teams align member behavior by
establishing norms early in team formation, and once the norm is formed, less leadership
intervention is required regarding behavior (Jassawalla & Sashittal, 2002; Taggar & Ellis,
2007). Consequently, in the presence of a heterogeneity norm, less complexity leadership
behaviors are required from the leader and members to influence related member
behavior. It is therefore hypothesized that:
Hypothesis 4: A heterogeneity norm partially mediates the relationship between
complexity leadership, manifested either by the team leader or by team members, and
innovation team outcomes.
58
Chapter Summary
The picture that emerges from the discussion of complexity leadership in this
paper is a leadership focused at the dynamics in aggregates of heterogeneous agents
which catalyze the emergence of learning and innovating. Also, complexity leadership
positively influences the relationship between the heterogeneity of agents and innovation
team outcomes.
CHAPTER THREE
RESEARCH METHODS
Introduction
The methods section of this paper contains several sub-sections: the research
design, the setting of the study, a description of data collection and the samples, data
analysis, an enumeration of the instrumentation, and the methods of hypotheses testing.
Research Design
The research design is a field study of active or recently concluded innovation
teams in industrial companies. One of the strengths of this proposal is that it is informed
by the results of two studies, one qualitative and one quantitative, involving a number of
innovation teams across a number of companies. The study began with interviews with
participants involved in 5 innovation teams in 3 companies. This preliminary analysis
clarified important functions of leadership and the ability of group members to share
leadership roles, both of which make collaboration and learning possible by leveraging
the heterogeneity of team members. In the quantitative phase, 59 R&D innovation teams
from 25 companies participated.
59
Although this study is primarily a quantitative analysis, the qualitative pilot study
was conducted for the purposes of understanding innovation within teams as they
develop new products for the market or new operating processes for the company and of
developing and validating how the factors of leadership, collaborative learning and
heterogeneity affect the innovation process. The pilot study supplemented efforts of
retrieving indicators used in the research literature. The findings of the qualitative pilot
study were used to help build the survey instruments. The pilot study and literature
search provided the basis for triangulation in developing reliable and valid indicators. By
combining qualitative data extracted from the interviews with existing theoretical studies
of various aspects of team leadership, learning, heterogeneity and innovation along with
empirical analyses using validated scales, an item inventory was developed that was
utilized in the construction of the indicators for the major variables of this study and
which were included in the survey. The item inventory was then factor analyzed using
respondent data so that parsimonious, reliable, and valid indicators could be identified for
use in the analysis of leadership, learning and heterogeneity in the innovation process.
Field Setting
This study was conducted in conjunction with a Research on Research (ROR)
committee of the Industrial Research Institute (IRI). The Industrial Research Institute is a
prime professional organization for corporate research leaders, with the mission of
“enhancing the effectiveness of technological innovation in industry.” Members represent
over 200 major industrial R&D organizations. Within IRI, an ROR committee established
as a “laboratory for innovation management” becomes the vehicle providing IRI member
60
companies with cutting-edge research on innovation techniques and management
practices.
In order to attract and retain its membership, IRI needs to deliver groundbreaking
research to its members. In addition, ROR committees have a tradition of collaborating
with universities on research projects. Researchers from this university have been
involved in prior research collaboration with IRI that has led to publications in top tier
academic management journals. It is important to note that the member companies of IRI
understand that in order to reap the benefits of their membership (e.g., cutting edge
research), they need to provide access to their companies for research.
In this context, and because of membership interest in developing a better
understanding of what it takes to lead heterogeneous R&D teams, the IRI ROR
committee invited this researcher and colleagues in the research team to use the
committee members’ influence for recruiting innovation teams from IRI member
companies to participate in testing the model of innovation proposed by this study.
Twenty-seven IRI companies in total participated in this project.
Data Collection and Samples
The IRB of Rutgers University approved exemption of the project under the
exempt category 2 on September 5, 2007. Appropriate safeguards are provided to study
participants to maintain confidentiality and to minimize risk to the companies or the
participants. As required, the researchers have signed confidentiality agreements with
companies when asked and received signed agreements from appropriate company
representatives permitting company personnel to participate in the study.
61
All data have been carefully handled, made available only to those directly
involved in the study on a need to know basis, and will be maintained in locations that
are not accessible to those without appropriate authorization. Rutgers University, of
course, maintains strict security procedures for all of its computer technologies and
regularly updates security procedures to protect against unauthorized access. The
researcher was assisted by research associates who had extensive prior experience in
handling confidential data and maintaining confidentiality both in the data and in the
research procedures by which the data are handled and reported.
Data collection required a two phase process. The first phase included the
qualitative pilot study. Data were collected by interview. The second phase involved the
use of self administered online survey to team members and leaders and a survey to
stakeholders for which some respondents were surveyed by phone while others used a
self-administered online survey. The details of data collection will be described below.
Both phases of the study contain data from two separate samples: 1. stakeholders and 2.
team leaders and members. In the analysis, team leader and member data are aggregated
by teams. Stakeholder data are team level data and used in analyses with the aggregated
team data.
Stakeholder Sample
A stakeholder is someone who is not on the team but cares about the outcomes of
the team, that is, has a stake in the outcomes of the team. This may be an internal
customer for the output of the team or someone who is responsible at a higher level to
deliver the output of the team. This person must have enough interest and be sufficiently
involved to knowledgably comment about:

62
• the team’s performance and its current and future expected outcomes,
• the team’s innovation, and
• the environment in which the team is operating.
The stakeholder sample was chosen by submitting the above criteria to the
company representatives to the study. Based upon those criteria, company representatives
submitted a list of one or more stakeholders per team.
Team Leader and Member Sample
Because this is fundamentally a study of team factors, the sampling frame for this
study included all members and leaders of innovation teams. The teams had to meet the
following qualifications:
They had to be composed of members from multiple groups or functions because
functional diversity is an important dimension in the study,
They had to be involved in innovation, whether product or process,
They had to have been operating for a minimum of two months, and
They either had to be operating at the time of the study or concluded their work
within 60 days prior to the assessment.
The Pilot Qualitative Study Data Collection
In the qualitative pilot study, five teams from three companies were volunteered
and interviews were conducted with participants from all five teams. A total of 24
interviews were conducted. Participants included two stakeholders, 6 team leaders, and
16 team members. All interviewees were verbally informed of their rights as participants
in a scientific study of confidentiality, the right to refusal without retribution, and the
right to have access to the findings of the study. Confidentiality is maintained by the
63
researcher by eliminating all identifiable information. Interviews were conducted
predominantly in person, only four by telephone, digitally recorded and then transcribed.
The digital recordings are kept in a password protected computer and backups are
physically secured. Transcriptions have all identifying information removed.
This pilot study used semi-structured interviews. The format was similar for
stakeholder, member, and leader interviews. The first section of the interview contained
questions on general background, including tenure, training, prior experience, and career
goals. Topics that were the focus of the subsequent sections of the interviews included:
the types of heterogeneity that are salient in the innovation team and how they are
perceived to affect the innovation process, the existence and use of leadership which
facilitates or impedes innovation, and team processes that affect the team’s innovation
efforts. The leader and stakeholder guides were shortened versions of the team member
guide. Stakeholder interviews were the shortest, taking 45 minutes. Team leader
interviews averaged 70 minutes. Team member interviews took on average two hours.
Copies of the items in the member interview schedules are available upon request.
Stakeholder and leader items were selected from the member interview schedule.
The Quantitative Study Data Collection
Data were collected in the quantitative phase through two survey instruments: the
leader/member survey that contains approximately 250 questions, and a much shorter
stakeholder survey of about 40 questions. The leader/member and stakeholder surveys
are available upon request from the author. Surveys were administered online through the
use of Survey Monkey. Participation was voluntary and confidentiality was guaranteed
by maintaining participation anonymity. The consent notice was included in the email

64
which invited the team participant to take the survey. Identifying data were deleted when
extracted from Survey Monkey.
For the quantitative study, 63 teams were proposed from 25 companies of which
60 qualified. Stakeholder surveys were attempted with 94 stakeholders; 89 (95%)
completed surveys. There was at least one stakeholder for each innovation team. For
qualified teams, all team members and leaders were invited to participate in the survey.
The population for the study was 588 team members and leaders. The response rate on
the survey was high (92%) with a total of 543 usable surveys. One team was removed
from the sample because it achieved only a 50% response rate which fell below the 70%
qualifying threshold. The sample used in the analysis included 59 teams. Average size of
the teams was 9.8 members with a standard deviation of 4.9. Four teams had 4 members,
the least number, and largest team had 28. The average number of functional
organizations represented on the teams was 3.8 functions. Fifty-one teams had 3 or more
functions. The team with the most had 7 different functions and 2 teams had 1 function
represented.
Data Analysis
Data analysis was conducted in two major phases: the first phase analyzed the
interview data and the second analyzed the survey data. The survey analysis was
performed in two stages: first, a preliminary analysis was conducted, in which descriptive
data were computed on the reliability and validity variables. The second stage consisted
of answering research questions and testing hypotheses.
The Pilot Qualitative Study Data Analysis

65
Using analytical techniques both from grounded theory and from more structured
forms of qualitative analysis, responses across topics and teams were compared and
contrasted in order to evaluate what kinds of team and leadership practices seem to be
most effective and most positively related to the development of innovation and how
heterogeneity is perceived within innovation teams. A coding structure was created by
the researcher for encoding the responses based upon the topics contained in the semi-
structured interview schedules, notes made by the researcher during the interviews, and a
preliminary review of responses. The electronic coding of the transcripts was performed
by an independent coder trained by the researcher. When questions arose regarding
appropriate coding of responses, the coder and researcher discussed the response and
jointly selected the appropriate code. During these discussions, a few new codes were
created. After the coder completed all interviews, the coding was checked by the
researcher. Only minimal changes were made as a result of this review and after
discussion between the researcher and the coder.
The interview data were analyzed with qualitative software, Atlas.ti, which
aggregated responses by the electronic codes assigned. The reports facilitated the
analysis of topics and teams. Using these reports, the researcher identified recurring
themes and patterns from which theory and items for scales were drawn. The findings are
reported in the subsections of this chapter.
The Quantitative Study Data Analysis
Preliminary Analyses: Items of variables that measure the major constructs of the
study were factor analyzed using principal components analysis and varimax rotation.
Separate factor analyses were conducted for each construct, that is, a separate analysis

66
was conducted for leadership, team dynamics including learning and heterogeneity norm
and innovation team outcomes. The purpose of the factor analysis was to develop
parsimonious, reliable, and valid indicators of the variables in the study. The choice of
varimax, an orthogonal rotation method, was made because of its simplicity of
interpretation and because the results of orthogonal rotation are more replicable
(Pedhazur & Schmelkin, 1991). Some consideration was given to oblique rotation
because it could create a factor structure better fit to the correlations among constructs
theoretically present in this study (Conway & Huffcutt, 2003). However, studies have
shown that orthogonal techniques are predominantly chosen by researchers. Ford,
MacCallum, and Tait (1986) found that almost 80% of articles which described their
factor analyses involved orthogonal rotations, whereas only 12% either used oblique
rotations or did not rotate the solution. A later similarly conducted survey of studies
(Fabrigar, L. R.,Wegener, D. T., MacCallum, R. C., & Strahan, E. J. 1999) found that
researchers in 48.3% of articles used varimax specifically and 20.6% used oblique
rotations. Varimax is used in this study because its advantage of greater generalizability
of results (Pedhazur & Schmelkin, 1991) is an important benefit which offsets its
limitations and because the widespread and prevalent use of varimax among researchers
represents a practice standard. Interestingly, both rotation procedures can be expected to
produce similar interpretations except for extremely complex factor structures (Hetzel,
1997). Conway and Huffcutt (2003) point to the advantages of using multiple analysis
techniques and to observe the differences. In a later section, oblique rotation will be
applied to all items in factors which are described subsequently in this section, and a
discussion of similarities and differences between orthogonal and oblique results will be
67
provided. All variables derived from the factor analysis were then subjected to
reliability checks using coefficient alpha. The scales for the factored variables for
complexity leadership, team dynamics, and team reported outcomes are created by taking
the averages of the ratings across the items in the scale for each individual team member.
Missing data is handled by excluding the item from the average calculation. Team level
aggregated variables are calculated taking the average of the team across the scale scores
of its members. This approach normally requires verification that aggregation of the team
members to the team level is appropriate. One widely accepted approach to test the
validity of team aggregation is through the use of ICC (Interclass Correlation), however it
was discovered that ICC does not handle conditions where team sizes vary substantially.
In this study, team size varied from four to 28 members. Alternative but well established
indices for interrater reliability and interrater agreement (LeBreton & Senter, 2008) were
used and include rwg index and AD (average deviation). For each team, these indices are
calculated for each of the six aggregated team level variables. A team is rated
questionable for a variable if it fails both the rwg index and AD thresholds established by
Dunlap, Burke, and Smith-Crowe (2003). Seven teams failed to meet these criteria for all
six aggregated variables and one team failed for four of the six. While other teams failed
for one or at most two variables, there was sufficient agreement in the other variables for
these teams to meet standards. Excluding the seven teams from the analysis was
considered but rejected. Five of questionable teams were small teams with five or fewer
members which by nature lack the number of respondents needed to achieve reasonable
statistics. More importantly, when using rwg index and AD, aggregation is evaluated on
how much agreement exists among members of the group. Because this study is
68
examining teams with members possessing heterogeneous perceptions, teams exhibiting
low levels of perceptual agreement should by design be included in the study. Table 1
shows the percent of teams which passed the rwg index and AD thresholds for each of the
six variables in the 59 team sample and in the 52 team sample. Regressions were run to
compare the results from the original 59 team sample to those of 52 teams. The
comparison showed similar results with some differences which will be reviewed in
detail in the next section.
-----
Insert Table 1 Here
-----
Instrumentation
This study requires a number of variables. They will be discussed under their
major constructs with the input variables first, mediating or intervening variables second,
outcome or dependent variables third and control variables last.
Complexity Leadership
In this study, complexity leadership is conceptualized along two dimensions:
behaviors and distribution. Uhl-Bien et al. (2007) developed the concept of complexity
leadership and described its functions, which are incorporated into this study through
behavioral descriptions constructed by the author from information gathered through the
pilot study interviews and from a review of complexity leadership literature.
Respondents’ perceptions of innovation team leadership were explored in the interviews
and four themes of effective leadership were identified: (1) leadership assures that
divergent thinking and convergent thinking occur at beneficial times; (2) leadership
models collaboration and inclusion; (3) leadership manages conflict by knowing when to
69
take issues offline to one-on-one or smaller groups and how to resolve conflict at lowest
level possible without escalation outside of the team; and (4) leadership nurtures the
relationship with formal organization by anticipating needed sources of support and by
controlling and designing information flows to other groups and upper management. The
four themes mapped into the leadership functions described by Uhl-Bien et al. (2007) and
confirmed theoretical principles of complexity leadership. Those themes were restated
into behavioral statements and included into the survey section about leadership with
other behaviors garnered from studies of complexity leadership (Lichtenstein et al., 2006;
Lichtenstein & Plowman, 2009; Plowman et al., 2007a, b; Uhl-Bien et al., 2007).
The complexity leadership scale has eleven items each for vertical and shared
complexity leadership, keyed to a seven-point Likert type response mode with higher
scores indicating greater levels of leadership behaviors and included the following items:
Fosters interaction within and outside the team by encouraging open engagement
Instigates discussion of different types of thinking among team members
Recognizes the difference between unhelpful conflict and helpful conflict
Engages members of the team in mutual problem solving
Seeks a broad range of perspectives when solving problems
Guides team members to converge on an agreement when one is needed
Helps the team understand new events emerging in the team’s environment
Procures resources which the team needs from other groups
Coordinates activities with other groups
Resolves problems raised by other groups
70
Releases timely information to others in the company to advance the team’s
image or work
Because of overall space and time constraints for the survey and the range of
topics to be covered, the number of questions related to leadership was limited.
Consequently, behavioral items were constructed to yield what can be characterized as a
“global” measure of complexity leadership. CLT breaks down complexity leadership into
various functional and sub-functional components. These components are reflected in the
measure of this study but the components are not measured separately. Some items
address multiple components while others only one. For example, an item addressing
interaction within and outside the team relates to the interaction condition of the sub-
function, Enabling Leadership. An item which describes seeking a broad range of
perspectives when solving problems relates to both the interaction and interdependence
conditions of Enabling Leadership. Table 2 provides a mapping of the items to the CLT
function of Administrative Leadership and the sub-function of Enabling Leadership
including enabling interaction, interdependence, tension and resonance and managing the
entanglement between the administrative and adaptive structure.
-----
Insert Table 2 Here
-----
The second leadership dimension in this study is its distribution and conceives
that leadership is not only the province of the appointed leader of the team but also
emanates from members of the team. The theme of shared leadership emerged from the
analysis of the pilot study interviews; leadership activity was distributed among group

71
members. A member of a team provides a typical statement about shared leadership;
“The team's pretty fluid in terms of who would lead at any given time…it's not a military
type organization with a hierarchy. It's got more of an egalitarian type of organization, so
in that way I think it's a pretty key norm and we share the leadership role as appropriate.”
A vertical and a shared dimension are separately conceived. Complexity leadership is
assessed both vertically in relationship to leadership from team leaders and shared in
relationship to leadership from among team members. Complexity leadership is
consequently operationalized with two scales. The technique for measuring vertical
versus shared leadership was derived from Pearce and Sims (2002). Each respondent
evaluated both leader and members on each leadership behavior. For the vertical
dimension, statements began with, "The team leader..."; for the shared dimension
statements began with, "Teammates..." In this section, the assessment of leadership
variables will be detailed.
All leadership items were keyed to a seven-point Likert-type response mode from
strongly disagree to strongly agree (1-7 respectively). The items constructed by the
author were assessed using the research sample and re-analyzed using factor analysis.
The factor analysis followed the standards set by Pearce and Sims (2002) and strove to
describe factors which were as consistent as possible between vertical and shared
dimensions in order to facilitate comparison and also reflected the theoretical basis of the
items. Separate analyses were conducted on vertical and shared items. The same items
emerged in the factors for team leader (vertical) and team member (shared) items.
Table 3 contains the factors, items and factor loadings for the two scales of
complexity leadership generated from the separate analyses of shared and vertical

72
complexity leadership. The rotation method used was varimax with Kaiser
Normalization. These variables were used in team level analyses. The scale for vertical
complexity leadership achieved a coefficient alpha of 0.92 and the shared scale an alpha
of 0.89, both indicating strong internal consistency. Vertical and shared complexity
leadership are input variables and are also theorized to be moderating variables of job-
relevant heterogeneity.
-----
Insert Table 3 Here
-----
Job Relevant Heterogeneity
Job relevant heterogeneity is conceptualized as the variety of bodies of
knowledge within a team and is conceived to include the information which team
members bring because of their education and work experience; information sourced
from inside and outside their company from informal networks; and information made
available through formal organizational contacts. Job relevant heterogeneity is
operationalized by four heterogeneity variables: education, function, job role, and
industry tenure. The pilot interviews reinforced the salience of job relevant heterogeneity.
Leaders and members were asked to identify what type of differences among members
was most salient to their team; background and skills were far and away the most often
mentioned. In addition to educational and functional background, two other categories
are salient; job role and work experience. Job role reflects the person’s position within
the company structure and in practice determines information and networks available to
the person. The pilot interviews also highlighted the relevancy of individuals’
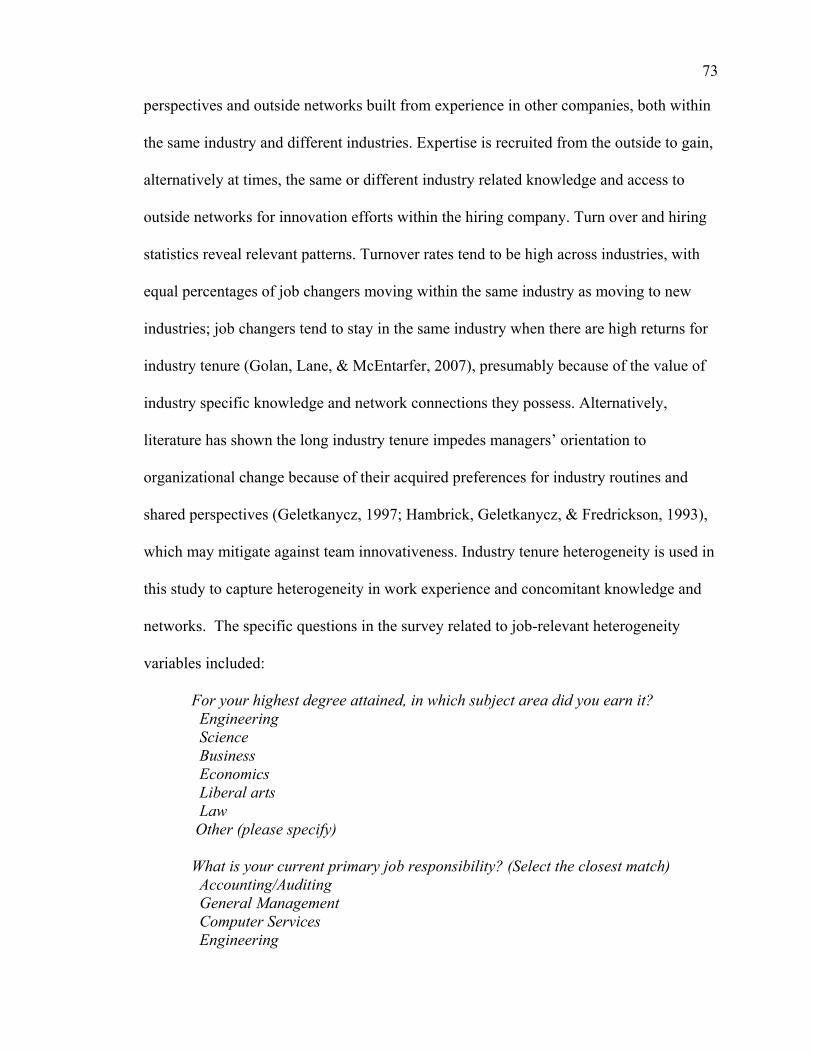
73
perspectives and outside networks built from experience in other companies, both within
the same industry and different industries. Expertise is recruited from the outside to gain,
alternatively at times, the same or different industry related knowledge and access to
outside networks for innovation efforts within the hiring company. Turn over and hiring
statistics reveal relevant patterns. Turnover rates tend to be high across industries, with
equal percentages of job changers moving within the same industry as moving to new
industries; job changers tend to stay in the same industry when there are high returns for
industry tenure (Golan, Lane, & McEntarfer, 2007), presumably because of the value of
industry specific knowledge and network connections they possess. Alternatively,
literature has shown the long industry tenure impedes managers’ orientation to
organizational change because of their acquired preferences for industry routines and
shared perspectives (Geletkanycz, 1997; Hambrick, Geletkanycz, & Fredrickson, 1993),
which may mitigate against team innovativeness. Industry tenure heterogeneity is used in
this study to capture heterogeneity in work experience and concomitant knowledge and
networks. The specific questions in the survey related to job-relevant heterogeneity
variables included:
For your highest degree attained, in which subject area did you earn it? Engineering Science Business Economics Liberal arts Law
Other (please specify)
What is your current primary job responsibility? (Select the closest match) Accounting/Auditing General Management Computer Services Engineering

74
Finance Human Resources Marketing Production/ Manufacturing/ Supply Chain Basic and Applied Research Information Services Customer Service Development Legal Sales
Other (please specify)
Within the structure of the company, what do you consider yourself?
A support staff associate
A technical specialist
A professional associate
A supervisor
A middle manager
An upper manager
None of these
How many years have you worked in this industry since the start of your career?
Education, function, industry tenure and job role are categorical variables which
are dummy coded. The “Other” category responses for education and function were
recoded when appropriate into existing categories. No new categories were identified.
Industry tenure reflects amount of relative experience in the industry of the innovation
team and is coded into the following experience categories: minimal (< 1 year), some (1-
3 years), moderate (3-5 years), substantial (5-10 years), and maximal (> 10 years). Job
relevant heterogeneity measures are calculated using the Index of Diversity (Blau, 1960;
1977) introduced into social science from biology by Peter Blau and is often referred to

75
as the Blau index. Selection of this index follows the guidelines established by Harrison
& Klein (2007) for measuring variety diversity in groups which they define as
differences based on expertise, knowledge, background, and networks and identify
attributes such as educational and functional background, industry experience, and
network ties. The general formula of the index is:
.
Blau indices are normalized for the analyses. Job-relevant heterogeneity is an input
variable.
Collaborative Learning
Collaborative learning is defined as a team processes which allows heterogeneous
innovation teams to share, understand and use the tacit information held by members so
that the team can work together to create new knowledge. The collaborative learning
items scales are constructed from items derived from Janz and Prasarnphanich (2003);
and Jassawalla and Sashittal (2002). In addition, the scales originating from the literature
were supplemented by items developed out of the in-depth interviews conducted by this
researcher. Collaborative learning arose from the interviews as an important driver when
teams have disparate knowledge which must be brought to bear for innovation. Three
patterns became evident. First, people spend time and effort to fully explain their
knowledge, doing the cognitive work necessary to articulate their tacit knowledge. One
engineer of a team expressed this aspect: “In this case, I had to think through {my
discipline} enough to explain it to {other specialists} or to somebody who was far
removed, so that I could make it clear to them. So it helped me clarify my thinking and it

76
also allowed different team members to say what you’re proposing isn’t right for my
needs. So you could fix things very quickly on the fly. So that was very powerful.”
Secondly, learning happened across all disciplines not just those with obvious
dependencies and is described in the following quote: “I’d say to a fairly large extent,
that we tried early on to segment it and say, ‘Well, the technical folks ought to be
working on that, and they don’t need to be sitting in the meeting when we’re talking
about the marketing challenges.’ But we ended up saying, ‘No, that’s really not the right
approach.’ Even if it takes a little longer, technical guys need to understand the
marketing style and the same vice versa, if we’re going to be successful in the long run.”
The third pattern was evidence of the use of expressions of differences as a mechanism
within the learning process, reflected in the following quote: “I think the whole thing
about getting used to everybody on everything, trying to express their own views. This
perspective would be one that created greater flexibility and probably faster to market...
And so then if I put forth an opinion, someone else will put forth an opinion based on
their business experience with it. So you get a different type of conversation, a rich
conversation.”
The collaborative learning scale operationalizes learning as a group phenomenon
manifested in how much effort is put forth into learning the perspective of the other team
members, how much teaching team members provide each other, and quantity and quality
of their communication. Collaborative learning was assessed using a five item scale. The
scale is designed to measure the extent to which collaborative learning takes place in a
team. All variables in this scale were assessed using a seven-point Likert type response

77
mode from strongly disagree (1) to strongly agree (7). The scale was scored, with higher
scores indicating greater collaborative learning. Items in the scale include:
Everyone takes time to make sure the whole team learns together.
Our team takes time for everyone to get up to speed on difficult concepts.
This team takes the time to have members learn each other’s perspectives.
When things change, members of this team make adjustments they know will help the other members of the team.
This team knows when it’s time to let disagreements be aired.
Table 4 contains the factors, items and factor loadings for the two scales of team
dynamics, collaborative learning and heterogeneity norm which are theorized to be
mediating variables of complexity leadership’s relation to innovation team outcomes. The
indicators were subjected to reliability estimates using Cronbach's coefficient alpha. The
collaborative learning factor has an alpha of 0.85.
-----
Insert Table 4 Here
-----
Heterogeneity Norm
The heterogeneity norm is conceived as a pattern of team attitudes and behaviors
for tolerating, respecting and engaging the heterogeneity of its members. The scale for
the norm is constructed from items selected from scales used by Mor Barak, Cherin, and
Berkman (1998) and derived from the “integration-and-learning perspective” described
by Ely and Thomas (2001). Positive attitudes and behaviors regarding heterogeneity were
consistently expressed in the interviews of innovation team leaders and members. For
example, a team member stated the sentiment expressed by many others: “I think what
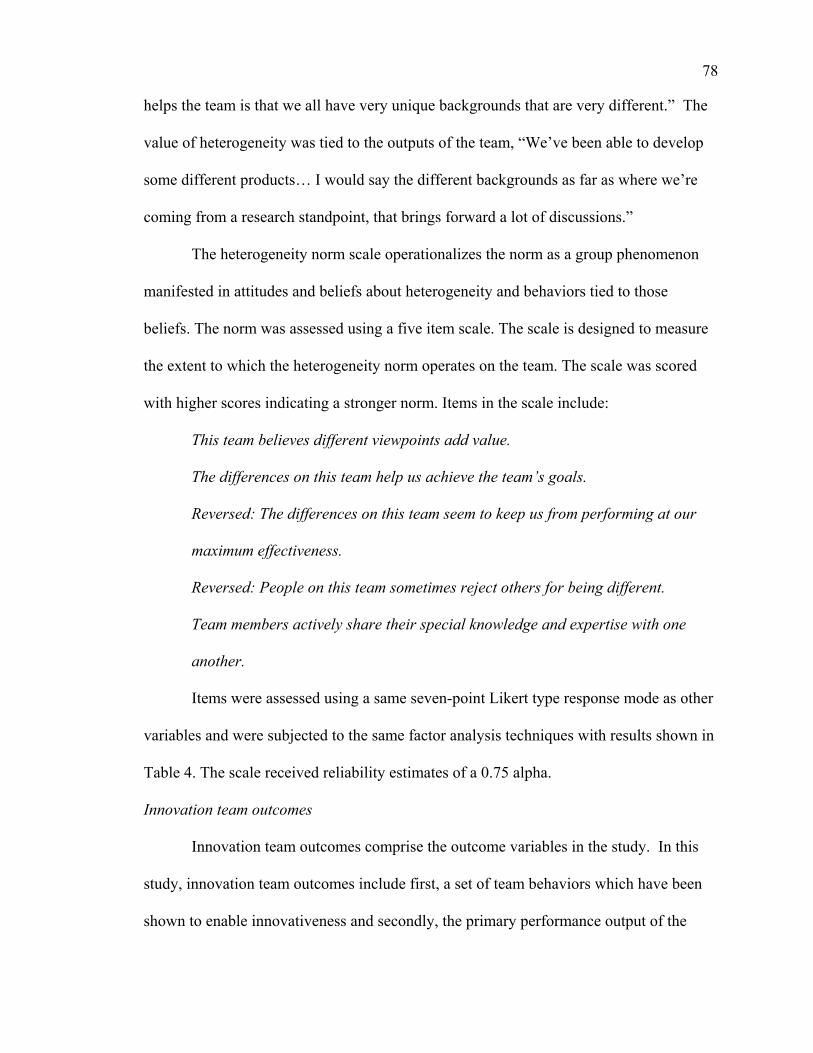
78
helps the team is that we all have very unique backgrounds that are very different.” The
value of heterogeneity was tied to the outputs of the team, “We’ve been able to develop
some different products… I would say the different backgrounds as far as where we’re
coming from a research standpoint, that brings forward a lot of discussions.”
The heterogeneity norm scale operationalizes the norm as a group phenomenon
manifested in attitudes and beliefs about heterogeneity and behaviors tied to those
beliefs. The norm was assessed using a five item scale. The scale is designed to measure
the extent to which the heterogeneity norm operates on the team. The scale was scored
with higher scores indicating a stronger norm. Items in the scale include:
This team believes different viewpoints add value.
The differences on this team help us achieve the team’s goals.
Reversed: The differences on this team seem to keep us from performing at our
maximum effectiveness.
Reversed: People on this team sometimes reject others for being different.
Team members actively share their special knowledge and expertise with one
another.
Items were assessed using a same seven-point Likert type response mode as other
variables and were subjected to the same factor analysis techniques with results shown in
Table 4. The scale received reliability estimates of a 0.75 alpha.
Innovation team outcomes
Innovation team outcomes comprise the outcome variables in the study. In this
study, innovation team outcomes include first, a set of team behaviors which have been
shown to enable innovativeness and secondly, the primary performance output of the
79
team. Two variables, therefore, assess the innovation team outcomes: innovation enabling
behaviors and perceived performance. Assessments came from two sources: stakeholders,
who provided an external, more objective source of data, and team members, including
the designated leaders, who provided internal sources. A strength of this study is the dual
sourcing for ratings of innovation team outcomes. This approach follows the strong
suggestion of Hülsheger et al. (2009) and provides their desired advantage for this
researcher to assess the perspectives of the different data sources. Hülsheger and
colleagues found that by far most studies, of the 104 they examined, relied on single
source self-reported data only.
Table 5 contains the team member assessed innovation team outcomes factors.
Table 6 contains stakeholder innovation factors. In summary, four variables relate to
innovation team outcomes: stakeholder-innovation enabling behaviors, stakeholder-
perceived performance, team-innovation enabling behaviors and team-perceived
performance.
-----
Insert Tables 5 and 6 Here
-----
Innovation enabling behaviors. Innovation enabling behaviors was assessed
using the Innovative Work Behavior (IWB) scale (Janssen, 2000), a nine item scale that
asks respondents to describe their innovative behavior using a five-point Likert-type
response mode in which "1" is "never," and "5" is "always." Participants are asked, "With
what frequency do you engage in the behaviors listed below?" Typical items include,
“Searching out new work methods, techniques or instruments," and "Generating original
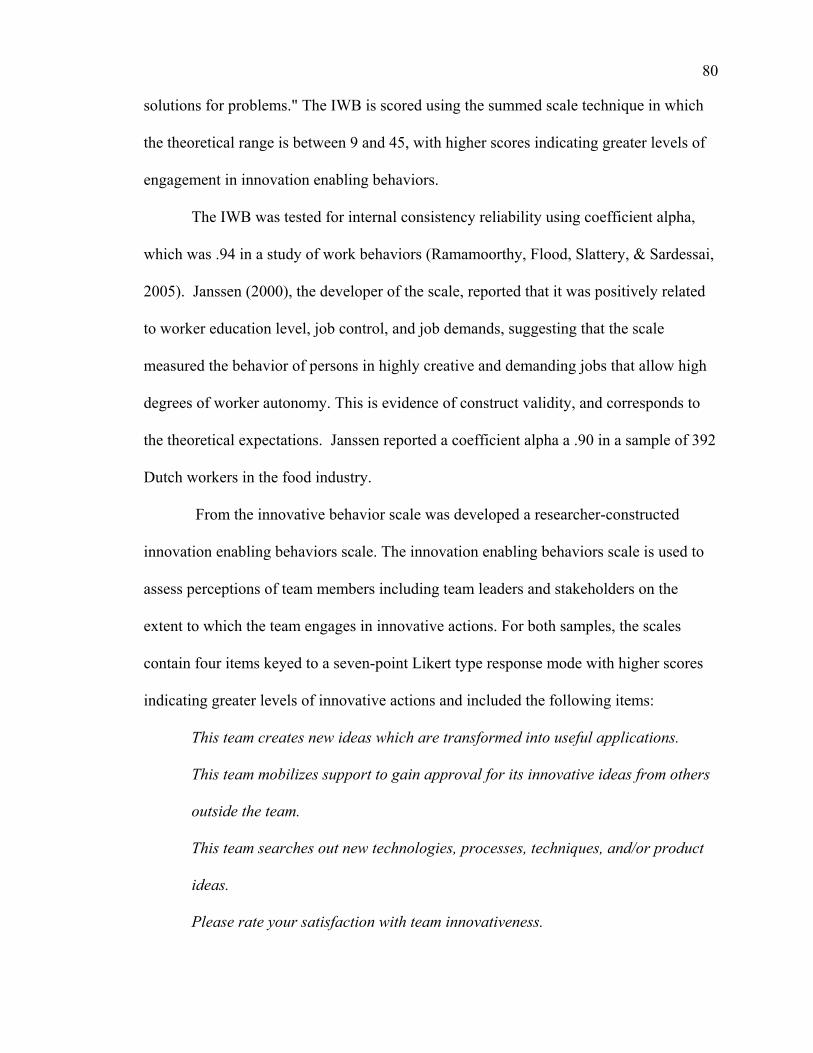
80
solutions for problems." The IWB is scored using the summed scale technique in which
the theoretical range is between 9 and 45, with higher scores indicating greater levels of
engagement in innovation enabling behaviors.
The IWB was tested for internal consistency reliability using coefficient alpha,
which was .94 in a study of work behaviors (Ramamoorthy, Flood, Slattery, & Sardessai,
2005). Janssen (2000), the developer of the scale, reported that it was positively related
to worker education level, job control, and job demands, suggesting that the scale
measured the behavior of persons in highly creative and demanding jobs that allow high
degrees of worker autonomy. This is evidence of construct validity, and corresponds to
the theoretical expectations. Janssen reported a coefficient alpha a .90 in a sample of 392
Dutch workers in the food industry.
From the innovative behavior scale was developed a researcher-constructed
innovation enabling behaviors scale. The innovation enabling behaviors scale is used to
assess perceptions of team members including team leaders and stakeholders on the
extent to which the team engages in innovative actions. For both samples, the scales
contain four items keyed to a seven-point Likert type response mode with higher scores
indicating greater levels of innovative actions and included the following items:
This team creates new ideas which are transformed into useful applications.
This team mobilizes support to gain approval for its innovative ideas from others
outside the team.
This team searches out new technologies, processes, techniques, and/or product
ideas.
Please rate your satisfaction with team innovativeness.
81
Coefficient alpha for the member/leader survey was 0.82 and, for stakeholders, 0.84.
Perceived performance. Performance of a team has been assessed with
comparisons to expectations (Edmonson, 1999), and satisfaction with performance
(Cordero, DiTomaso, & Farris, 1996). During interviews, stakeholders also related
estimates of performance to the willingness to continue to provide investment in the
team’s project. Stakeholders, team members and leaders were assessed on perceived
performance scales with items using a seven point Likert type response mode. For
question regarding satisfaction, answers ranged from very dissatisfied (1) to very
satisfied (7). For question regarding expectations, answers ranged from far below
expectation (1) to far exceed expectations (7). For all other items, the range was from
strongly disagree (1) to strongly agree (7). Higher scores reflect higher perceived
performance. Four items were included for the team leader/member version:
Satisfaction with overall team performance
Satisfaction with the timeliness of team work
Team’s performance relative to the team’s own expectations
Team’s performance relative to the expectations of the team’s stakeholders
The perceived performance scale contains the following five items in the version for
stakeholders:
Satisfaction with overall team performance
Team’s performance compared to your expectations for the team
Team’s performance compared to expectations formed by performance of other
innovation teams in your company

82
This team is on track to realize the outcomes we expect from the innovation on
which this team is working.
This team will continue to receive support and resources for its work.
Both scales were assessed for internal consistency; the team members’ scale
achieved a coefficient alpha of 0.87 and the stakeholder items achieved a coefficient
alpha of 0.86.
Control Variables
Two control variables are used in all tests of this study’s hypotheses.
Organization or team size has been shown to be a factor affecting team performance in
studies regarding heterogeneity, leadership and innovation (Tsui et al., 1992; Pearce &
Sims, 2002; Pelled et al., 1999; Cunningham & Chelladurai, 2005). Team size was
provided for each team by the source company. Additionally, team tenure has been
confirmed as a team level variable influencing team innovation (Hülsheger et al., 2009)
and is, therefore, also a control variable in all hypotheses regressions. The six response
options for the team tenure question were ordered to measure team tenure(1 = less than 3
months; 2 = 3-6 months; 3 = 6-12 months; 4 = 1-2 years; 5 = 2-4 years; 6 = >4 years.
Team tenure is calculated as the mean of all reporting team members.
Using Oblique Rotation to Compare Factors Produced by Orthogonal Rotation
As discussed previously, varimax is the rotation technique used in this study’s
factor analyses. An additional factor analysis was performed using OBLIMIN, an oblique
rotation in SPSS, to provide a comparison test of the factors identified through
orthogonal rotation. Oblique techniques can confirm that factors are really distinct
because oblique rotation is better at finding a general factor when one exists as opposed

83
to separations interpreted by orthogonal techniques (Fabrigar et al., 1999). All items from
the five factors of the study arising from team member assessments, that is, complexity
leadership, collaborative learning, heterogeneity norm, innovation enabling behaviors
and perceived performance, were included. With all items, any more general factors not
identified by varimax should be detected and overlaps exposed, for example, between
shared complexity leadership, which is conceived of as a team process, and another
closely related team process, collaborative learning.
Table 7 contains the results of the oblique analysis and shows confirmation of the
five factor structure produced previously by orthogonal rotation. The same five factors
are interpreted by the oblique rotation as were interpreted by the orthogonal rotation. The
same items comprise the factors, with the exception of one. The item, “When things
change, members of this team make adjustments they know will help the other members
of the team”, was loaded as one of 5 items comprising the collaborative learning factor
by varimax with a coefficient of .586. Oblique rotation produced very low coefficients
for the item and close cross loadings for collaborative learning (.280), innovative
behavior (.294) and the heterogeneity norm (.305). Because those results suggest that the
item should be removed, an analysis was run without the item and the results showed that
the five factor structure remained constant with no other changes. Consequently, a
collaborative learning factor was also tested with the remaining four items after
excluding the cross loaded item. The 4 item collaborative learning factor has an alpha of
.82 compared to that of .85 for the 5 item factor and a correlation of .976 significant at
the .01 level to the 5 item factor. In summary, no substantial change to the orthogonal
factor structure would be required because of the results of the oblique rotation. These
84
findings reinforce the view from the literature that in most cases, both rotation procedures
will produce similar interpretations (Hetzel, 1997)
Hypothesis Testing
Analysis techniques used to test the hypotheses of this study are presented in this
section. Variables, means, standard deviations and Pearson bi-variate correlations
among all referenced variables are reported. OLS multiple regressions are used to test the
relationships depicted in the study’s theoretical model displayed in Figure 1 and
expressed in the hypotheses. Because the output of innovation team outcomes is
comprised of four variables: stakeholder-innovation enabling behaviors, stakeholder-
perceived performance, team-innovation enabling behaviors and team-perceived
performance, tests of hypotheses include regressions with each of the four output
variables as the dependent variable. For all hypotheses, regression testing, a probability
level of .05 is used for the rejection of the null hypothesis. In this study, attention is paid
to adjusted R2 rather than R2 because the sample size of 59 teams increases the
probability overstatement of estimates. Adjusted R2 provides an estimate of cross
validation that adjusts for smaller ratios of samples size to predictors (Dielman, 1991).
Changes in adjusted R2 are prime indicators to compare the effects of different input,
mediator or moderator variables. Because the effects of team level phenomena, such as
shared complexity leadership, job related heterogeneity, and team-innovation enabling
behaviors, are the subjects of inquiry, all hypotheses are assessed with team level data
using the team as the unit of measure. In the power analysis for the 59 team sample size,
the power coefficient would be greater than .80; that is, there would be less that 20%
probability of a Type II error (Cohen, & Cohen, 1983) with an effect size of .15 for all
85
regressions except the tests of moderation which have a power coefficient of .61, that is,
there would be a 39% probability of a Type II error.
Hypothesis 1 Testing
The first hypothesis theorizes a positive relationship between complexity
leadership manifested by either the team leader (vertical) or team members (shared) or
both with innovation team outcomes. The construct of complexity leadership was
measured using two variables one relating to vertical and the other shared. Correlation
estimates will provide indicators of the relationship between the distributions of
complexity leadership and innovation.
Multiple regressions test the hypothesis with a regression for each of the four
output variables that comprise the construct of innovation team outcomes. Each multiple
regression is executed in four steps. The control variables, team size and team tenure, are
entered in step one and remain in all subsequent steps. In step two, vertical complexity
leadership is entered. Step three removes vertical complexity entered in step two and
enters shared complexity leadership. In step four, both vertical and shared complexity
leadership are present. The regression analysis is designed to test the hypotheses by
providing separate estimates for distributions of complexity leadership to be compared
and to ultimately estimate the effects when both types of distribution are operating.
The following equation represents the final step in the multiple regression, testing
the direct effects of both vertical and shared complexity leadership on innovation team
outcomes:
{innovation team outcomes} = b1 team size + b2 team tenure + b3 vertical
complexity leadership + b4 shared complexity leadership + e1.
86
Hypotheses 2a,b,c Testing
In the second hypothesis, the relationships among complexity leadership
manifested by either the team leader (vertical) or team members (shared) or both,
collaborative learning and innovation team outcomes are theorized in a set of three sub-
hypotheses. The test of hypothesis 2a, a positive relationship between complexity
leadership and collaborative learning, involves a multiple regression in the same structure
as used with hypothesis 1. Four steps are used to compare and contrast the influence of
vertical and shared complexity leadership on collaborative learning. Hypothesis 2b
theorizes a positive relationship between collaborative learning and innovation team
outcomes. Its multiple regression is accomplished in two steps, the first, the entering of
controls and the second, the entering of the predictor variable, collaborative learning.
Hypotheses 2c involves the most complex set of multiple regressions to test
whether collaborative learning partially mediates the relationship between complexity
leadership and innovation team outcomes. The approach reflects the test of mediation
described by Baron and Kenny (1986) which compares the regression coefficient of the
independent variable before and after the mediator variable is included into the
regression. If the coefficient declines to zero after entering the mediator variable, full
mediation is present; any decline indicates partial mediation; and increase means no
mediation. In the multiple regressions, test of mediation of vertical and shared
complexity leadership by collaborative learning are done separately and together in order
to compare their influences. Additionally, the bootstrapping procedures described by
Preacher and Hayes (2008), which is favored over the Sobel test for smaller sample sizes,
is used to verify the significance of the mediation. The following equation represents the
87
final step in the multiple regression, testing the mediation effects of collaborative
learning on both vertical and shared complexity leadership:
{innovation team outcomes} = b1 team size + b2 team tenure + b3 vertical
complexity leadership + b4 shared complexity leadership + b5 collaborative
learning + e1.
Hypothesis 3 Testing
In hypothesis 3, complexity leadership is theorized to moderate the relationship
between job relevant heterogeneity and innovation team outcomes. The standard
regression approach to testing moderation is used that steps into the regression equation,
first the controls, then the predictors, followed by the moderator and finally the
predictor/moderator interaction terms. All variables other than controls involved in the
moderation test are centered. Given that the construct of job relevant heterogeneity is
made up of four variables, the number of variables must be considered in constructing the
regressions. Because of limits associated with the sample size of fifty-nine teams, vertical
and shared complexity leadership are tested in separate regressions because in the final
regression step of moderation, eleven independent variables are present. Each of the two
multiple regressions will have four steps in which variables will be added in the
following sequence: (1) the two control variables, (2) the four heterogeneity variables, (3)
the complexity leadership variable, and (4) the four interaction terms. The following
equation specifies the final step of the regression sequence, all variables other than the
controls are centered variables:
{innovation team outcomes} = b1 team size + b2 team tenure + b3 education
heterogeneity + b4 function heterogeneity + b5 job role heterogeneity
88
+ b6 industry tenure heterogeneity + b7 (vertical or shared) complexity
leadership + b8 complexity leadership x education interaction + b9
complexity leadership x function interaction + b10 complexity leadership x
job role interaction + b4 complexity leadership x industry tenure interaction
+ e1.
Hypothesis 4 Testing
Hypotheses 4 theorizes that the heterogeneity norm partially mediates the
relationship between complexity leadership and innovation team outcomes and is tested
in the same manner as described for hypothesis 2c above. Both the Baron & Kenny
(1986) and bootstrapping (Preacher and Hayes, 2008) procedures are used to confirm the
mediation.
The following equation represents the final step in the multiple regression, testing
the mediation effects of heterogeneity norm on both vertical and shared complexity
leadership:
{innovation team outcomes} = b1 team size + b2 team tenure + b3 vertical
complexity leadership + b4 shared complexity leadership + b5 heterogeneity
norm + e1.
CHAPTER FOUR
RESULTS
Descriptive Statistics and Correlations
Variable means, standard deviations, correlations are reported in Table 8.
Additionally, alpha scores for all factored variables are shown. A number of important
correlations are evident regarding the outcome variables. The dual sourcing for ratings of

89
innovation team outcomes from team leaders and members and from stakeholders
provides stronger testing of relationships (Hülsheger et al., 2009). An important
consideration is the relationship between the same measures from the two sources;
significant correlation would indicate likelihood that the same phenomenon is being
measured. In this study, team-perceived performance and stakeholder-perceived
performance are correlated (.47, p < .01). Also, correlations were expected and found
between the two variables of innovation team outcomes within each source, i.e.,
correlation between team-innovation enabling behaviors and team-perceived performance
( .51, p < .01) and correlation between stakeholder-innovation enabling behaviors and
stakeholder-perceived performance (.44, p <.01). However, difficulties can arise if there
is little correlation between the same measures from the two sources which in this study
is true for the innovation enabling behaviors measures. The innovation enabling
behaviors scales that emerged from the team and stakeholder factor analyses contain the
same four items, however, low correlation exists between innovation enabling behaviors
as perceived by the two sources (.22, p > .05) and across the two sources between
innovation enabling behaviors and perceived performance (.20, p > .05 for stakeholder-
innovation enabling behaviors and team-perceived performance; .01. p > .05 for team-
innovation enabling behaviors and stakeholder-perceived performance). Further, team-
innovation enabling behaviors correlated significantly with complexity leadership (.65, p
< .01 for vertical; .55, p < .01 for shared), collaborative learning (.64, p < .01) and the
heterogeneity norm (.63, p < .01) but stakeholder-innovation enabling behaviors did not.
Stakeholders’ perceptions of innovation enabling behaviors in this study appear
disconnected from the team dynamics examined. The perceptions of innovation enabling
behaviors differ markedly, as will be seen in the regression test results of this study’s
hypotheses. This topic will be further discussed and possible explanations presented in
the next section.

90
Correlations exist among many of the predictor variables, with some being very
high. For example, collaborative learning is highly correlated with complexity leadership
(.67, p < .01 for vertical; .57, p < .01 for shared). Similarly, the heterogeneity norm is
also highly correlated with complexity leadership (.66, p < .01 for vertical; .56, p < .01
for shared). While all factors were successfully tested for discriminate validity with both
orthogonal and oblique rotational techniques, concern must be given to potential overlaps
in concepts or in their operationalizations. Later in this section, this topic will be taken up
again in a discussion of the results of tests for multicollinearity in the regression
associated with the hypotheses.
Readers are alerted to correctly interpret the team tenure control variable reported
in Table 8. Because of the coding structure of this categorical variable as described in the
Instrumentaion section, the mean score of 3.89 is interpreted to show that average team
tenure is approximately one year
The following subsections review the results of the tests of the hypotheses of this
study. Figure 2 provides a summary depiction of the hypotheses.
-----
Insert Table 8 Here
-----
Hypothesis 1 Results
Positive direct effects of both complexity leadership distributions, vertical and
shared, on innovation team outcomes are proposed. The regression technique followed
the approach used by Pearce and Sims (2002) which examines the separate and joint
effects of the distributions. Advantages of this approach include reporting of individual
and joint contributions to adjusted R2 and testing for multi-collinearity. Table 8 contains
the results of the regressions of the four outcome variables. Differences between the
results of team reported and stakeholder reported innovation team outcomes exist;
generally, team reported innovation team outcomes, which represent same source
91
measurement of predictors and outcomes, provided stronger support for the hypotheses in
terms of higher more significant beta coefficients and contributions to adjusted R2 than
stakeholder reported. For team reported innovation team outcomes, vertical complexity
leadership alone achieved significant coefficients (β = .533, p < .01 and contributed .357
to adjusted R2 for team-innovation enabling behaviors and β = .675, p < .01 with .367 R2
contribution for team-perceived performance). Shared complexity leadership also had
positive effects (β = .640, p < .01 and contributed .368 to adjusted R2 for team-innovation
enabling behaviors and β = .598, p < .01 with .319 contribution for team-perceived
performance). When both are present in the regressions, the vertical complexity
leadership is the more powerful predictor (β = .509, p < .01) for team-perceived
performance and shared is more powerful for team-innovation enabling behaviors (β =
.509, p < .01). For stakeholder-perceived performance, vertical complexity leadership has
significant positive effects when alone in the regression (β = .353, p < .01 with
contribution of .103) and when jointly present with shared complexity leadership (β =
.461, p < .05). Stakeholder-innovation enabling behaviors was least related to complexity
leadership. When alone in the regression, shared complexity leadership achieved
significance, a beta of .26 with p of .058, just marginally above the study’s .05
probability threshold and .044 contribution to adjusted R2. No multi-collinearity issues
were found in any of the regressions; this topic will be discussed more fully across the
entire analysis later in this section. In summary, the hypothesis of direct positive effects
of complexity leadership on innovation team outcomes is strongly supported by team
reported innovation team outcomes and finds some support with stakeholder reported
innovation team outcomes.
-----
Insert Table 9 Here
-----
Hypothesis 2 Results
92
The second hypothesis is comprised of three sub-hypotheses which propose a
positive direct effect of complexity leadership on collaborative learning; a positive
influence of collaborative learning on innovation team outcomes; and a partial mediation
of the direct effects of complexity leadership on innovation team outcomes by
collaborative learning. These sub-hypotheses were assessed using the Baron and Kenny’s
(1986) causal step approach to assessing mediation which involves three separate
regression steps. The first step is designed to verify the required direct relationship
between the predictor and mediator variables; the second verifies the required direct
relationship between the mediator and outcome variables; and the third is the mediation
analysis which regresses the outcome variable on both the predictor and mediator.
The test of hypothesis 2a, a positive relationship between complexity leadership
and collaborative learning also followed the Pearce and Sims (2002) approach, first
collaborative learning is regressed against vertical complexity leadership, then shared
complexity leadership and followed by both vertical and shared. The standardized
coefficients and contribution to adjusted R2 support the hypothesis. Vertical complexity
leadership alone achieved beta of .682, p < .01, and contributed .429 to adjusted R2.
Shared complexity leadership alone achieved beta of .581, p < .01, with a .299
contribution. When both were present in the regression, the betas were .543, p < .01, for
vertical and .207 , p > .10, for shared and they jointly added .441 to adjusted R2.
Hypothesis 2a is supported.
The assessment of hypothesis 2b, a positive influence on innovation team
outcomes by collaborative learning, requires a regression against each of the four
innovation team outcomes variables. The regression analysis (See Table 10) found
significant relationship for team-innovation enabling behaviors (β = .592, p < .01 and
.235 R2 contribution), team-perceived performance (β = .738, p < .01 and .312 R2
contribution) and stakeholder-perceived performance (β = .327, p < .05 and .092 R2
contribution). The relationship was not significant for stakeholder-innovation enabling
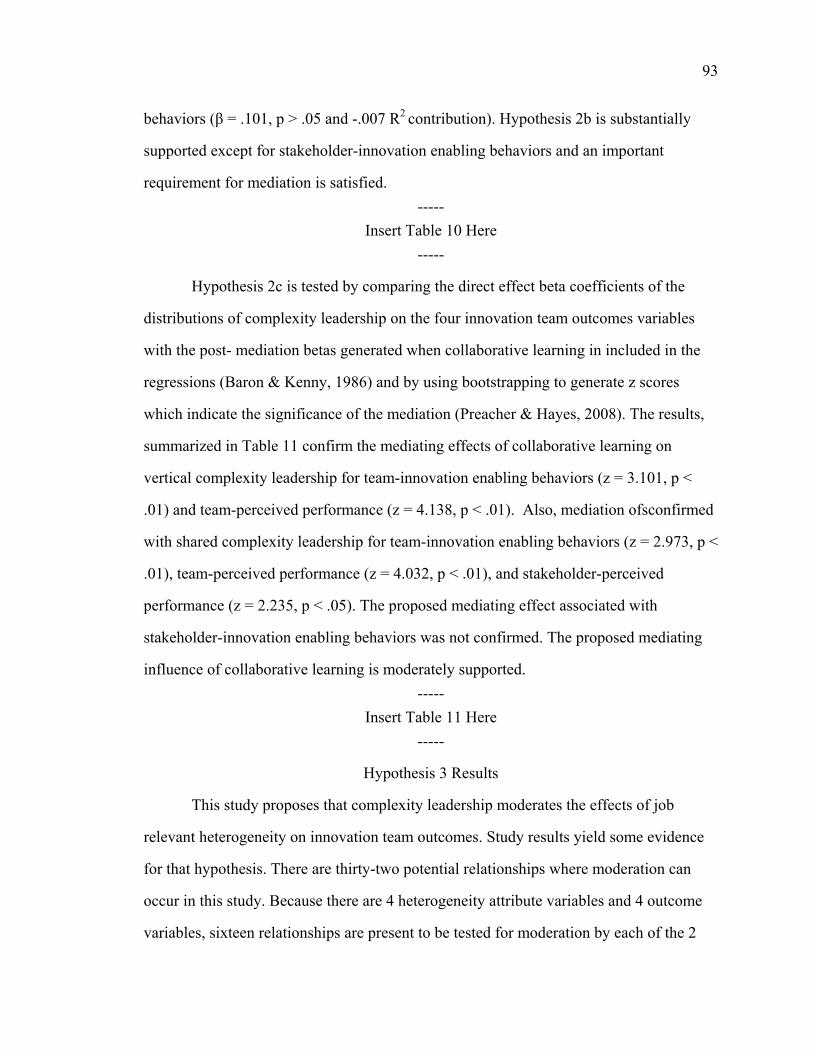
93
behaviors (β = .101, p > .05 and -.007 R2 contribution). Hypothesis 2b is substantially
supported except for stakeholder-innovation enabling behaviors and an important
requirement for mediation is satisfied.
-----
Insert Table 10 Here
-----
Hypothesis 2c is tested by comparing the direct effect beta coefficients of the
distributions of complexity leadership on the four innovation team outcomes variables
with the post- mediation betas generated when collaborative learning in included in the
regressions (Baron & Kenny, 1986) and by using bootstrapping to generate z scores
which indicate the significance of the mediation (Preacher & Hayes, 2008). The results,
summarized in Table 11 confirm the mediating effects of collaborative learning on
vertical complexity leadership for team-innovation enabling behaviors (z = 3.101, p <
.01) and team-perceived performance (z = 4.138, p < .01). Also, mediation ofsconfirmed
with shared complexity leadership for team-innovation enabling behaviors (z = 2.973, p <
.01), team-perceived performance (z = 4.032, p < .01), and stakeholder-perceived
performance (z = 2.235, p < .05). The proposed mediating effect associated with
stakeholder-innovation enabling behaviors was not confirmed. The proposed mediating
influence of collaborative learning is moderately supported.
-----
Insert Table 11 Here
-----
Hypothesis 3 Results
This study proposes that complexity leadership moderates the effects of job
relevant heterogeneity on innovation team outcomes. Study results yield some evidence
for that hypothesis. There are thirty-two potential relationships where moderation can
occur in this study. Because there are 4 heterogeneity attribute variables and 4 outcome
variables, sixteen relationships are present to be tested for moderation by each of the 2

94
complexity leadership distributions. Of the thirty-two potential opportunities for
moderation, five instances were found or sixteen percent of the relationships which is
above the 5% which could be expected from random effects at a .05 threshold for
accepting the null hypothesis. Tables 12 and 13 show the moderation regression results
for vertical and shared complexity leadership respectively.
-----
Insert Tables 12 & 13 Here
-----
The direct effects of the four job relevant heterogeneity variables on innovation
team outcomes are shown in step two of the regressions in Table 12. No significant direct
effects by any of the variables are present for stakeholder assessed innovation team
outcomes but significant influence is present for team assessed innovation team
outcomes. Job role heterogeneity has significant positive effects on team assessed
outcomes (β = .298, p < .05 for innovation enabling behaviors and β = .318, p < .05 for
perceived performance). Industry tenure heterogeneity also has positive effects on team
assessed outcomes with mixed significance (β = .108, p > .10 for innovation enabling
behaviors and β = .285, p < .01 for perceived performance). Function heterogeneity has
negative effects and mixed significance (β = -.242, p > .10 for innovation enabling
behaviors and β = -.422, p < .01 for perceived performance). Education heterogeneity has
no appreciable effects on team assessed outcomes.
Vertical complexity leadership moderated the relationship between function
heterogeneity and stakeholder-perceived performance (β = .396, p < .05). Shared
complexity leadership moderated four relationships: between function heterogeneity and
stakeholder-perceived performance (β = .438, p < .01); between education heterogeneity
and stakeholder-innovation enabling behaviors (β = .398, p < .05); and between industry
tenure and both stakeholder-innovation enabling behaviors (β = -.313, p < .05) and
stakeholder-perceived performance (β = -.381, p < .01).
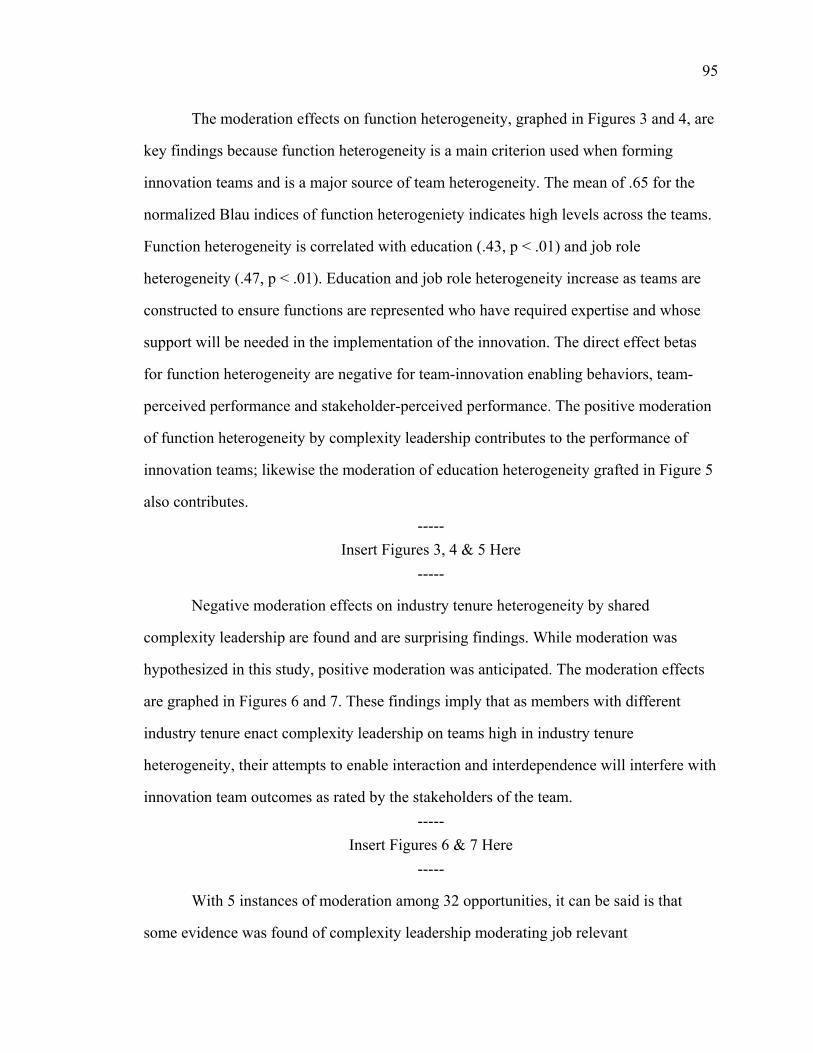
95
The moderation effects on function heterogeneity, graphed in Figures 3 and 4, are
key findings because function heterogeneity is a main criterion used when forming
innovation teams and is a major source of team heterogeneity. The mean of .65 for the
normalized Blau indices of function heterogeniety indicates high levels across the teams.
Function heterogeneity is correlated with education (.43, p < .01) and job role
heterogeneity (.47, p < .01). Education and job role heterogeneity increase as teams are
constructed to ensure functions are represented who have required expertise and whose
support will be needed in the implementation of the innovation. The direct effect betas
for function heterogeneity are negative for team-innovation enabling behaviors, team-
perceived performance and stakeholder-perceived performance. The positive moderation
of function heterogeneity by complexity leadership contributes to the performance of
innovation teams; likewise the moderation of education heterogeneity grafted in Figure 5
also contributes.
-----
Insert Figures 3, 4 & 5 Here
-----
Negative moderation effects on industry tenure heterogeneity by shared
complexity leadership are found and are surprising findings. While moderation was
hypothesized in this study, positive moderation was anticipated. The moderation effects
are graphed in Figures 6 and 7. These findings imply that as members with different
industry tenure enact complexity leadership on teams high in industry tenure
heterogeneity, their attempts to enable interaction and interdependence will interfere with
innovation team outcomes as rated by the stakeholders of the team.
-----
Insert Figures 6 & 7 Here
-----
With 5 instances of moderation among 32 opportunities, it can be said is that
some evidence was found of complexity leadership moderating job relevant

96
heterogeneity’s influence on innovation team outcomes. The proposed moderating
relationship finds limited support. Detailed discussion of these results in the next section
will explain how and why they provide important insights into the relationship between
complexity leadership and job relevant heterogeneity.
Hypothesis 4 Results
The heterogeneity norm is proposed to mediate the direct effects of complexity
leadership on innovation team outcomes. Results provide some support for the
hypothesis. In initial steps for testing mediation, the relationships between the predictor
and mediator and between the mediator and the outcome variables must be established.
Relative to the predictor and mediator, complexity leadership is positively related to the
heterogeneity norm: the beta for vertical complexity leadership is .682, p < .01 and .576,
p < .01 for shared. Regarding mediator and outcomes, the heterogeneity norm has
significant positive relationship to team-innovation enabling behaviors (β = .601, p < .01)
and team-perceived performance (β = .610, p < .01) but only has near significant relation
to stakeholder-perceived performance (β = .239, p = .063) and positive but not significant
with stakeholder-innovation enabling behaviors (β = .152, p = .240).The assessment of
the mediation hypothesis compares the direct effect beta coefficients with the post-
mediation betas generated when the heterogeneity norm is included in the regressions.
Additionally, bootstrapping is used to generate z scores indicating the significance of the
mediation. The results, summarized in Table 14 show mediating effects of the
heterogeneity norm for team reported innovation team outcomes but not for stakeholder
reported. Mediating effects are confirmed for vertical complexity leadership with team-
innovation enabling behaviors (z = 2.970, p < .01) and team-perceived performance (z =
4.219, p < .01). Also, mediation is confirmed for shared complexity leadership with
team-innovation enabling behaviors (z = 2.872, p < .01) and team-perceived performance
(z = 2.950, p < .01). The proposed mediating effects of the heterogeneity norm are
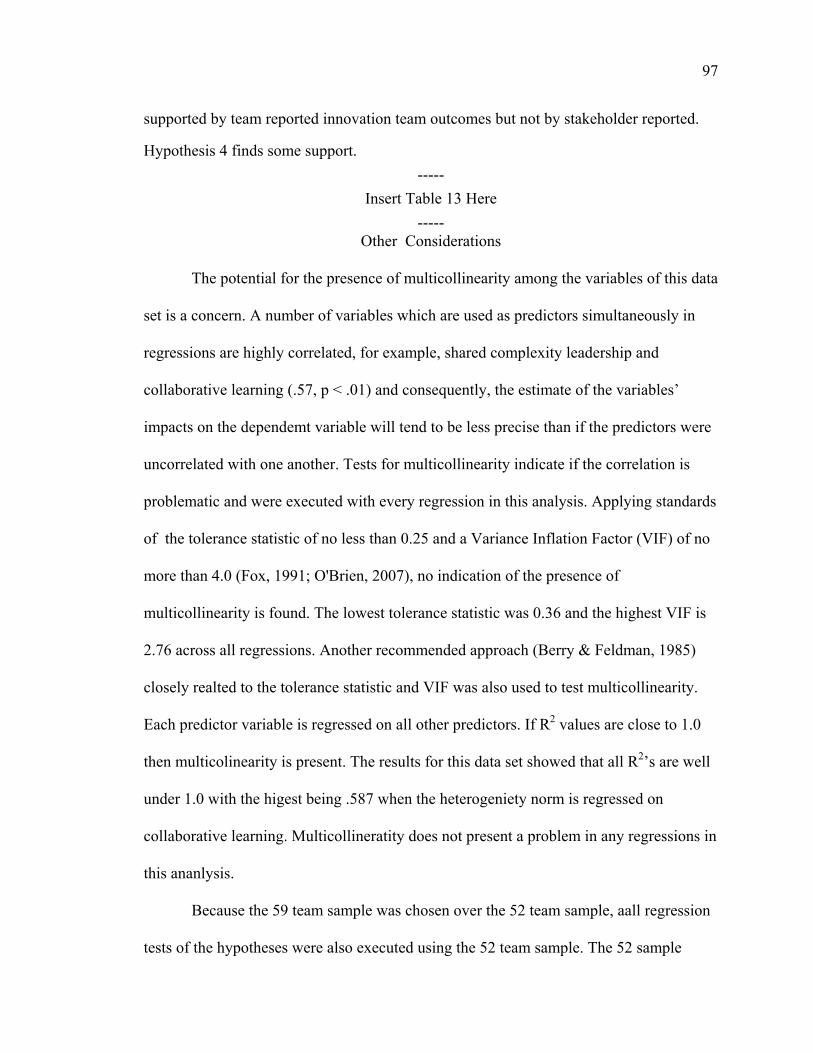
97
supported by team reported innovation team outcomes but not by stakeholder reported.
Hypothesis 4 finds some support.
-----
Insert Table 13 Here
----- Other Considerations
The potential for the presence of multicollinearity among the variables of this data
set is a concern. A number of variables which are used as predictors simultaneously in
regressions are highly correlated, for example, shared complexity leadership and
collaborative learning (.57, p < .01) and consequently, the estimate of the variables’
impacts on the dependemt variable will tend to be less precise than if the predictors were
uncorrelated with one another. Tests for multicollinearity indicate if the correlation is
problematic and were executed with every regression in this analysis. Applying standards
of the tolerance statistic of no less than 0.25 and a Variance Inflation Factor (VIF) of no
more than 4.0 (Fox, 1991; O'Brien, 2007), no indication of the presence of
multicollinearity is found. The lowest tolerance statistic was 0.36 and the highest VIF is
2.76 across all regressions. Another recommended approach (Berry & Feldman, 1985)
closely realted to the tolerance statistic and VIF was also used to test multicollinearity.
Each predictor variable is regressed on all other predictors. If R2 values are close to 1.0
then multicolinearity is present. The results for this data set showed that all R2’s are well
under 1.0 with the higest being .587 when the heterogeniety norm is regressed on
collaborative learning. Multicollineratity does not present a problem in any regressions in
this ananlysis.
Because the 59 team sample was chosen over the 52 team sample, aall regression
tests of the hypotheses were also executed using the 52 team sample. The 52 sample

98
removed teams which did not meet the rwg index and AD thresholds for aggregation of
individual data to team level variables. The results were the same, other than minor
differences of beta coefficients and adjusted R2 estimates, with the following exceptions.
In the test of hypothesis 1, the 52 team sample showed a significant beta for shared
complexity leadership in the joint regression step with vertical complexity leadership in
relation to team-innovation team performance which was not present in the 59 team
sample. Similarly for hypothesis 2a, the 52 team sample, unlike the 59 team sample, also
showed a significant beta for shared complexity leadership in the joint regression step in
relation to collaborative learning. These results from the 52 team sample would
strengthen the case for accepting the proposed positive effects of shared leadership. In
hypothesis 3, the 52 team sample did not yield moderation effects in two instances
present in the 59 team sample. These included vertical complexity leadership moderation
of functional heterogeneity with stakeholder- innovation team performance and shared
complexity leadership moderation of education heterogeneity with stakeholder innovative
behaviors. Those moderation differences would weaken the argument that there is some
evidence to support hypothesis 4 which was made based on the 59 team sample results.
CHAPTER FIVE
DISCUSSION
Introduction
Complexity leadership focuses on leadership that enables organizational learning
and innovation in complex organizational contexts (Marion & Uhl-Bien, 2001; Uhl-Bien
et al., 2007). This study provides one of the first empirical tests of complexity leadership
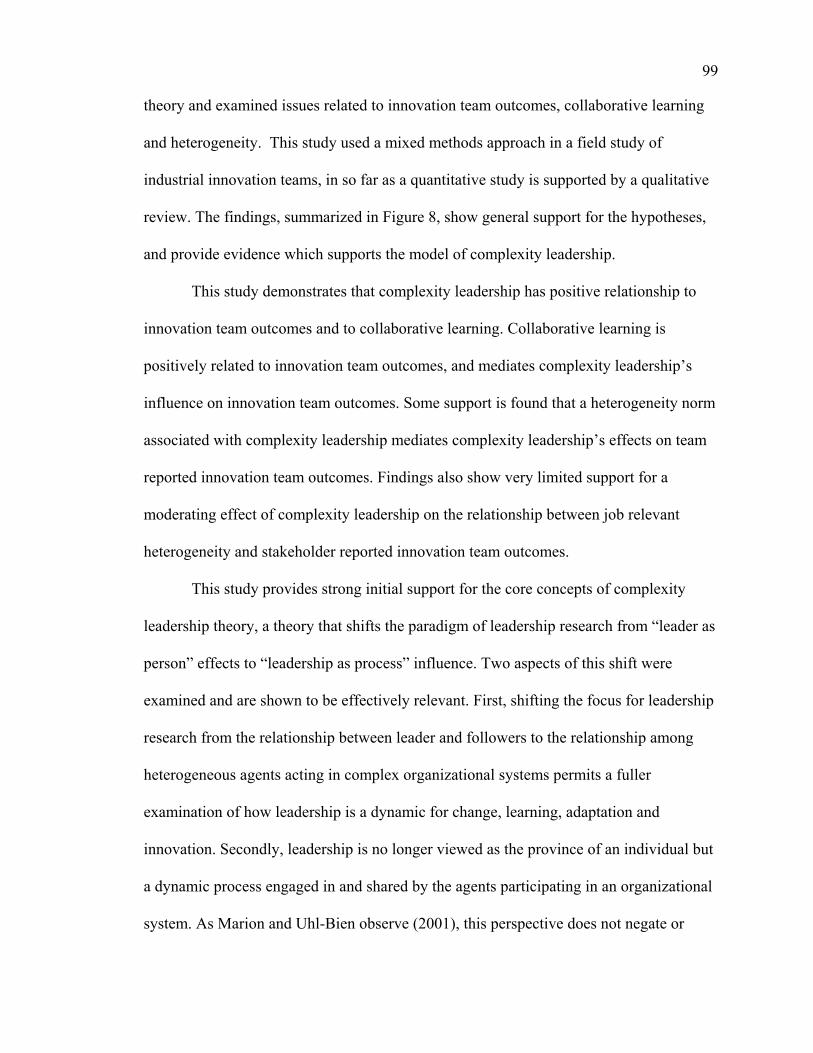
99
theory and examined issues related to innovation team outcomes, collaborative learning
and heterogeneity. This study used a mixed methods approach in a field study of
industrial innovation teams, in so far as a quantitative study is supported by a qualitative
review. The findings, summarized in Figure 8, show general support for the hypotheses,
and provide evidence which supports the model of complexity leadership.
This study demonstrates that complexity leadership has positive relationship to
innovation team outcomes and to collaborative learning. Collaborative learning is
positively related to innovation team outcomes, and mediates complexity leadership’s
influence on innovation team outcomes. Some support is found that a heterogeneity norm
associated with complexity leadership mediates complexity leadership’s effects on team
reported innovation team outcomes. Findings also show very limited support for a
moderating effect of complexity leadership on the relationship between job relevant
heterogeneity and stakeholder reported innovation team outcomes.
This study provides strong initial support for the core concepts of complexity
leadership theory, a theory that shifts the paradigm of leadership research from “leader as
person” effects to “leadership as process” influence. Two aspects of this shift were
examined and are shown to be effectively relevant. First, shifting the focus for leadership
research from the relationship between leader and followers to the relationship among
heterogeneous agents acting in complex organizational systems permits a fuller
examination of how leadership is a dynamic for change, learning, adaptation and
innovation. Secondly, leadership is no longer viewed as the province of an individual but
a dynamic process engaged in and shared by the agents participating in an organizational
system. As Marion and Uhl-Bien observe (2001), this perspective does not negate or

100
obviate our extensive knowledge of how leadership stabilizes system elements but adds
new dimensions required to understand what leadership is in dynamic complex
environments.
An important contribution of this study is its operationalization of the
theoretically described elements of complexity leadership (Uhl-Bien et al., 2007) into a
reliable and effective eleven item scale applicable to all agents in a system whether
designated leaders or members. The measure was built from data collected in the
qualitative phase of the project and from leadership and related non-leadership literatures.
The scale can form a base for further development of techniques for measuring
complexity leadership and opens the possibility of examining the differences and
synergies among complexity leadership and other conceptions of leadership for which
scales are already well developed, particularly in their shared manifestations (Avolio,
Sivasubramaniam, Murry, Jung, & Garger, 2003).
This study emphasizes that leadership must be examined in context; that the
context for complexity leadership is that of complex adaptive systems (CAS); and that
innovation teams are CAS. This study’s results reinforce the ambidextrous nature of CAS
and complexity leadership’s relation to both its stable and dynamic system elements.
Complexity leadership enables dynamics of self organization and emergence which lead
both to stabilizing elements such as the heterogeneity norm and to dynamic interactions
such as collaborative learning in which pre-existing tacitly held cognitive structures are
penetrated and revealed and new knowledge created. In the presence of a team norm that
respects and uses differences, agents can depend on open interactions in which to
productively share their unique tacit knowledge. The shared nature of complexity
101
leadership means that influence is dynamic and flowing and shifts among agents as needs
and conditions change.
A strength of this study is the dual sourcing of evaluations of innovation
outcomes from internal team members and external stakeholders. But this strength also
presents a challenge in interpreting the results. The problems of common method
variance and response biases associated with single sourcing of predictors and outcomes
are well established (Podsakoff, MacKenzie, Lee, & Podsakoff, 2003). However, only
external reported assessments cannot be relied on for unquestionably reliable and valid
ratings (Howard, 1994; Spector, 1994). This study helps address the problem that most
previous studies of innovation teams have because it relies on dual sourcing of
performance evaluation, rather that single source (Hülsheger et al., 2009). This study’s
findings show similar results to other studies using dual sourcing, that is, self reports of
team leaders and members had higher effect sizes than independent stakeholder raters
(Hülsheger et al., 2009). Also, in this study, stakeholder-innovation enabling behaviors
did not follow the patterns reflected in stakeholder-perceived performance, team-
innovation enabling behaviors, nor team-perceived performance. This apparent
disconnect may reflect one of the potential hazards of external raters, that of being too far
removed to reliably evaluate. Innovation enabling behaviors describes behaviors more
internal to the team, such as searching out new technologies, which may not be as
observable or salient to stakeholders compared to the items in the perceived performance
measure, such as decision to continue resourcing the team. Nonetheless, with two sources
for outcome variables, this study has a richer set of measures available to better judge the
theorized influences (Howard, 1994; Spector, 1994). Because this study relies on both
102
internal and external sourcing in an attempt to overcome the limitations of each
individually, findings are interpreted both by identifying consistent patterns across both
sources and by comparing and contrasting the estimates provided from the two sources.
The details and theoretical implications of each aspect of the proposed model and
related hypotheses will be further discussed in the following sub-sections.
Complexity Leadership and Innovation Team Outcomes
This study adds to our understanding of the leadership of innovation and
contributes to the literature in two ways. First, complexity leadership theory is described
and successfully field tested at the operational level of organizations (Uhl-Bien et al.,
2007). Second, the gap in our descriptions of innovation team leadership delineating its
role in team dynamics (Brown & Eisenhardt, 1995) is addressed. In this vein, complexity
leadership theory provides the framework by which this study integrates disparate
research areas such as, team creativity, team innovation, team interdependence, network
dynamics, team conflict, team culture, team identity and team leadership into a cohesive
and comprehensive description of leading the dynamics of innovations. This study
increases and broadens the potential research linkages between complexity leadership
and other research disciplines.
Complexity leadership of innovation teams plays a direct role in enabling both
internal dynamics and those with external linkages which foster the creation and
implementation of innovation. In this study, the patterns of influence reflected across the
measures of innovation team outcomes consistently show better results from the
interaction, interdependence, tension and resonance of complexity leadership. Leadership
which fosters open interaction, divergent discourse, identification of unproductive

103
conflict, mutual conflict management among contending parties, convergent decision
processes, and sense making which unites member understanding, increases innovation
enabling behaviors and perceived performance. Leadership which enables productive
connection between the innovation team and the larger organization through formal
administrative and informal network linkages, also improves innovation outcomes.
Interestingly, differences in influence on innovation outcomes are present
between vertical and shared distributions of complexity leadership. Vertical complexity
leadership is more related to perceived performance and shared more related to
innovation enabling behaviors. For team reported outcomes, when vertical and shared are
both in the regression, only one has significance; vertical significantly influences
perceived performance while shared influences innovation enabling behaviors. For
stakeholder-perceived performance, only vertical had significant effects and that was
both when alone and when together with shared in the regression. Only shared had close
to significant effects on stakeholder reported innovation enabling behaviors (β = .261, p =
.058 and .044, p < .05 contribution to adjusted R2) when alone in the regression. These
findings suggest that while both may have positive relationship to innovation outcomes,
the nature and manner of the influence varies. To understand implications, it is helpful to
contrast the two measures of innovation team outcomes, innovation enabling behaviors
and perceived performance. Perceived performance evaluates team results versus
expectations and goals, and also for stakeholders, the likelihood that resources and
support will continue to be provided to the team. Innovation enabling behaviors address
team creativity and ability to gather, use and implement new knowledge. Vertical
leadership relates to the activity of the designated team leaders who performs most of the
104
administrative leadership for the team, such as dealing with routines in the organization’s
innovation system including stage gate reviews where decisions about whether to
continue support for the project are made. The designated leader also keeps focus on
linkages to company processes, strategies, and goals (Clark & Fujimoto, 1990; Quinn,
1985; Takeuchi & Nonaka, 1986). Given the special role of the designated leaders, that
vertical leadership has special relationship to evaluations of perceived performance is
understandable. With the other measure, innovation enabling behaviors, shared
complexity leadership’s special relationship is explained by CLT. The creative and
learning processes of the team are more reliant on the mutual influence dynamics of
shared complexity leadership among the members than by the vertical influence of the
designated leader. To summarize, positive influence on innovation team outcomes of
complexity leadership manifested by the leaders and members is supported.
Complexity Leadership and Learning
The results of this study provide confirming evidence that the dynamics enabled
by complexity leadership increase team learning and that complexity leadership increases
collaborative learning. This study contributes understanding to the leadership of team or
organizational learning literature. Collaborative learning is a key process in
organizational innovation and the results of the study show collaborative learning
positively relates to innovation team outcomes. In knowledge era companies, innovation
teams are brought together to intensify organizational learning well beyond simply
providing better linkages between separate functions or disciplines. Also as theorized,
complexity leadership indirectly improves innovation team outcomes by enabling
collaborative learning.

105
During the interview phase of this project, it became apparent to this author that a
shift has occurred in innovation teams. This author led the introduction of the cross
functional product team structure in a division of a fortune 100 company in the late
1980’s and had the opportunity to lead or observe many teams develop, introduce and
manage new service products through the early 1990’s. The closer linkages among
functions afforded by cross functional innovation teams improved speed to market,
reduced development costs and produced more marketable products and services
compared to past arrangements which depended on isolated functional groups
contributing to development efforts sequentially from within their functional silos.
However, it seems that since that time, a shift has occurred that changed the purpose and
dynamics of cross functional innovation teams and that this shift was observable in the
interviews. Responses indicated that the purpose moved from the linking of functions to
collaborative learning among uniquely knowledgeable members. Innovation teams are
more relied on by their companies and are more capable of being loci of organizational
learning. Functional people were no longer on the team to simply represent their
function, but rather to actively engage in co-learning and co-creating. Characteristics
were identified by interviewees that distinguish the earlier implementation of cross
functional innovation teams from the newer paradigm. Early generation teams which
were brought together for the purpose of linking, exhibited the following:
Interaction occurs across the boundaries of functions to enhance coordination and mutual problem solving.
Dialogue is enabled between dependent functions but discouraged more broadly in
order to efficiently use functional resources.

106
Activity is aligned across functional boundaries through the articulation of common goals managed by clearly assigned leadership.
Functional experts are partially vested with authority to represent the interests of
their function or discipline and could lead team’s decisions in their specific realms.
Conflict resolution and decision-making rely on functional management and are
frequently escalated.
Contemporary teams which are organized for learning exhibit the following:
Interaction and collaboration are fostered across all team participants even when there are no obvious dependencies or connection between their knowledge bases.
In-depth dialogue, whether in person or electronically, is used to educate members
about each others’ knowledge and ideas.
The comprehensive body of shared knowledge is used by members to engage in
parallel development and mutual adjustments as changes occur.
Connection is maintained with the formal structure which does not dominate or direct
the team. A balance between removing boundaries and respecting them is maintained.
The ability to influence the team is distributed among group members and is not
limited to their area of expertise.
Learning oriented teams require a new type of leadership which is more fit to
higher levels of collaboration and which enables more sharing and cross learning of the
tacit knowledge by expert members. The leadership characteristics identified in the
interviews of the qualitative study were reflected in the description of complexity
leadership used in the quantitative study: sharing leadership, encouraging divergent and
convergent thinking, resolving conflict by engaging members in mutual problem solving,
nurturing the relationship with the formal organization, and modeling collaboration and

107
inclusion. The relationship between complexity leadership and team learning uncovered
in the qualitative phase was reinforced by quantitative results.
The collaborative learning examined in this study relies on in depth examination
and communication which engages members in uncovering the logic behind their
knowledge to themselves and to others. This deeper penetration of tacit knowledge
allows members to make connection among knowledge bases which a more superficial
treatment or exposition would not permit. The black boxes would remain unopened and
disconnected. Collaborative learning applies to the learning needs of both exploitative
and explorative innovation. In exploitation, existing connections among knowledge bases
must be uncovered, in a sense re-learned so that new perspectives can be applied and new
implications formulated. Explorative learning builds upon exploitative learning
capability but is more challenging because previously unknown relations and
interdependencies between knowledge must be discovered and/or formulated (Dunne &
Dougherty, 2010). The power of the shared process of collaborative learning is shown in
the positive effects collaborative learning has on innovation team outcomes and
collaborative learning’s mediation of complexity leadership. Collaborative learning arises
from the interaction, interdependence, tension and resonance of complexity leadership.
The interplay between complexity leadership and collaborative learning is a dynamic that
reinforces sharing, developing, changing, testing, and creating knowledge, all of which
are central to innovation.
Complexity Leadership and Heterogeneity
The results of the analyses provide some support for this study’s two hypotheses
regarding heterogeneity. The heterogeneity norm does mediate complexity leadership’s
108
influence on innovation team outcomes as reported by teams, and some evidence was
found for a moderating effect of complexity leadership on the relationship between job
relevant heterogeneity and innovation team outcomes. This study contributes to theory
describing how complexity leadership relates to heterogeneity.. This is important because
CLT presumes that heterogeneity is constitutive of, and has positive effects in, CAS, but
it does not describe the mechanisms for those effects. Additionally, this study’s theory
regarding heterogeneity and complexity leadership is grounded in recent theory
developed in the diversity literature to explain the persistent contradictory findings
regarding the effects of diversity. For example, the CEM model proposed by van
Knippenberg, et al. (2004) provides theoretical elements used to formulate the
heterogeneity norm and complexity leadership relationship to job relevant heterogeneity.
The results of this study also contribute to the further elaboration of that stream of
research.
The Heterogeneity Norm
The effects proposed by this study for a norm that values and engages the
heterogeneity of the team were supported. The heterogeneity norm was proposed to arise
in the context and dynamics enabled by complexity leadership. This study confirms its
presence in CAS and also confirms the positive relation complexity leadership has to it.
The heterogeneity norm adds to understanding of how complexity leadership interplays
with heterogeneity to create beneficial team dynamics. The heterogeneity norm clarifies
how complexity leadership helps channel positive effects from heterogeneity which has
been shown to have both positive and negative effects on group performance.

109
The relationship between complexity leadership and the norm must be
distinguished from the more traditional view that leadership has a direct causal
relationship to norm formation, not theorized by CLT. Leadership has been shown to
influence norm formation (Jassawalla & Sashittal, 2002, Taggar & Ellis, 2007). Some
studies emphasized negotiation of norms among leaders and followers and how leader
expectation predicts the adoption of the norm by the group (Taggar & Ellis, 2007).
Others examined how the prominent role of leadership within a social context influences
the behavior of followers. Meindl (1990) showed that the leader’s behavior spreads
throughout a group through social contagion because followers are susceptible to the
leader’s behaviors and other members who imitate the leader. The leader has a prominent
role in the social context of the group and achieves effects in the group because the
information upon which the leader focuses and the behaviors the leader engages in are
more salient and form internalized expectations of normal behavior within followers
(Bommer et al., 2004). However, within CLT, the leader’s use of special influence to top-
down control outcomes can interfere with the bottom-up dynamics in the system (Marion
& Uhl-Bien, 2001) and reduces the system’s ability to adapt and achieve fitness. While
leadership may provide general guidance through vision and goals to help the CAS
correlate to the larger organization, complexity leadership seeks to enable the conditions
which create productive dynamics and then supports these dynamics to generate self-
organization and emergence of productive states, such as the heterogeneity norm.
That complexity leadership enables emergent, self-organizing behavior found
support in the Plowman et al. (2007b) field study of the Mission Church. Their
ethnographic analysis demonstrated that leadership of the church did not direct the

110
changes that occurred in the church but enabled the conditions which allowed for the
emergences of non-linear productive changes. Leadership fostered creative network
dynamics among church participants by disrupting existing patterns, encouraging novelty
and making sense as the changes unfolded. Similarly, the findings of this study are
interpreted to show that complexity leadership relates to the existence of a heterogeneity
norm because the norm arises from the interdependent interaction enabled by complexity
leadership. The heterogeneity norm can be added to CLT as an emergent structure
associated with but not caused by complexity leadership.
From social categorization theory, van Knippenberg et al. (2004) describe a
sequence of social categorization which includes elements such as salient in-group and
out-group categorizations; in-group and out-group biases; and affective responses, such
as conflict and cohesion. Using that framework, this study’s proposed heterogeneity
norm assumes that on innovation teams, the relevant in-group is the team which
encompasses all members (Homan et al., 2008); the salient characteristic of that in-group
is differences among team members which contributes to the work of the teams (Ely &
Thomas, 2001); the biases are positive toward the differences because they do not
threaten, but rather contribute to, the creative work of the team (Ely & Thomas, 2001);
and the effective evaluative response is the engagement of the differences (Janssen &
Huang, 2008). This study differs from van Knippenberg and colleagues (2004); rather
than their focus on the moderating effects of social categorization process on group
information processing, this study examines the direct relationship of the heterogeneity
norm to innovation team outcomes and considers how the norm mediates complexity
leadership’s influence with the aim to answer questions relevant to complexity leadership
111
theory. The exploration of the heterogeneity norm in this study contributes to our
understanding of how attitudes toward heterogeneity influence team performance. The
findings that the heterogeneity norm is positively related to team reported innovation
team outcomes and mediates complexity leadership’s influence are noteworthy. It was
proposed that the heterogeneity norm would have those effects because the norm shifts
social categorization concerns among members to a higher team level focus, that is, the
potential positive effect of member differences on team performance.
Because the heterogeneity norm reflects a positive bias toward heterogeneity, this
study helps address an area needing more study identified by van Knippenberg and
Schippers (2007), and answers their challenge to incorporate positive relationships of
heterogeneity with group interaction. It can be asserted from the findings that the
heterogeneity norm has positive influence on information processing, described by van
Knippenberg et al. (2004); that is, the elaboration of task-relevant information facilitates
the sharing, interchange and combining of ideas, knowledge and perceptions.
Moderation of Job Relevant Heterogeneity
The proposed moderation of job relevant heterogeneity by complexity
leadership found very limited support in the results of this study. The moderation was
predicted because the dynamics created by complexity leadership are proposed to
catalyze information processing, which would increase job relevant heterogeneity effects
on innovation team outcomes. Similar to moderators, such as task motivation in the CEM
model which enhance the relationship between diversity and information processing (van
Knippenberg, et al., 2004), complexity leadership provides a context through which its

112
enabled dynamics enhance the relationship between job related heterogeneity and
innovation team outcomes.
While only 5 instances of true moderation are found in the potential thirty-two
relationships, a number of interesting and surprising patterns are present which provide
more weight to the findings. First, two instances of positive moderation involve function
heterogeneity, a key attribute of innovation teams and its effects on stakeholder-
perceived performance, as shown in Figures 3 and 4. Somewhat surprisingly, the direct
effect betas for function heterogeneity shown in Tables 11 and 12 are negative for team-
innovation enabling behaviors (β = -.242), team-perceived performance (β = -.422) and
stakeholder-perceived performance (β = -.166). Function heterogeneity has been found to
have mixed effects in cross-functional product groups with negative effects including
reduced internal communications, cohesion and budget performance and increased job
stress but positive effects on external communication, technical quality and schedule
performance (Ancona & Caldwell, 1992a; Keller, 2001). The positive moderation of
function heterogeneity by complexity leadership is an important finding of this study.
The negative effects of function heterogeneity are explainable through how function
diversity can impede internal communication and the development of correlation among
members. Functional representatives feel a tension between their allegiance to their
function and to their participation on the team. Functional representatives can come with
strings attached related to their career and to the political position of their function, both
of which can provide motives to keep specialized information tacit and unshared. Status
differences among functions can be reflected in access to key resources such as
information, are imbedded in the relationships among functional representatives and can

113
be formidable barriers to open and shared influence. When groups in a status hierarchy
are in competition for jobs, rewards, or other resources, conflict may emerge if those with
more favorable positions perceive a threat to their position from those in less favorable
positions (DiTomaso, Post, Smith, Farris, & Cordero, 2007).It is an important finding
that complexity leadership helps overcome cognitive and political barriers between
functional representatives. As proposed by CLT, the results can be interpreted to show
that complexity leadership mitigates these effects and brings forth the advantages of
different functional knowledge bases by enabling interaction and interdependent
dynamics, by helping the team and its members deal with tension, and by increasing
correlation through sense making that builds team identity and team cohesion.
A second surprising pattern in the moderation results is presented by 2 instances
of negative moderation of industry tenure by shared complexity leadership with
stakeholder-innovation enabling behaviors (β = -.313, p < .05) and stakeholder-
perceived performance (β = -.381, p < .01). Positive moderation was anticipated. It is
difficult to propose a logic to explain this pattern. One possibility explanation comes
from joining fault line research (Lau & Murnighan, 1998; Li & Hambrick, 2005; Rico et
al., 2007) with how industry heterogeneity was observed to be increased in the teams of
the study. On one team, because the innovation would move the company into a new
industry, a cadre of people was hired from the industry. In another instance, the
company’s move into a new industry was accomplished through an acquisition and,
subsequently, an innovation team was made up of members from the acquired company
and the acquiring company. Fault lines arise when subgroups are formed around salient
characteristics and are congruent with commonly held perspectives which can be

114
expected when people come from the same industry or company within the industry.
Members identify more with their subgroups and less with the larger group (Rico et al.,
2007) which increases subgroup polarization, leading to more conflict, less cohesion and
poorer group decisions (Lau & Murnighan, 1998; Li & Hambrick, 2005). A second piece
of the puzzle may be that both negative moderations involved shared complexity
leadership. A logic to consider which could explain the negative moderation would be the
following. Using fault line theory, subgroups exist on the team distinguished by common
industry experience who share similar perspectives; these fault lines lead to greater
conflict and less cohesion. Shared complexity leadership is based on interactive influence
among members. As greater interactive influence is attempted on the team, conflict and
lack of cohesion are exacerbated which leads to poorer innovation team outcomes. But a
word of caution must be noted. While a plausible logic has been attempted to be
proposes, it is highly speculative. It rests on assumptions built from few data points about
how industry heterogeneity was increased across the teams in the study. Additional
research designed to verify and explore this phenomenon would be necessary.
A third pattern of note is that all 5 instances of moderation were related to
stakeholder reported innovation outcomes. Given that stakeholder effects sizes were
smaller than team effect sizes in the tests of other hypotheses, this is noteworthy. When
considering only stakeholder outcomes, moderation is found in thirty-one percent of the
possible sixteen relationships making the findings more relevant. Relative to stakeholder
outcomes, complexity leadership is a catalyst in addition to having direct effects. These
results support CLT’s assertion that the dynamics enabled by complexity leadership
catalyze interactive change events among heterogeneous agents. This third pattern
115
contrasts from that seen in team reported outcomes. Whereas with team reported
outcomes, complexity leadership has significant direct effects and no evidence of
catalyzing heterogeneity. In fact, examination of the moderation tests with team-
innovation enabling behaviors and team-perceived performance shown in Tables 11 and
12 reveals another interesting pattern. In step two, when job relevant heterogeneity
measures are added, its measures have many significant direct effects on team-innovation
enabling behaviors and team-perceived performance. However, when complexity
leadership is added in step 3, the betas and significance are reduced and most lose their
significance. Because this pattern of results could indicate mediation, tests for mediation
were conducted. No mediation of job related heterogeneity by complexity leadership was
found primarily because job relevant heterogeneity measures are not predictors of
complexity leadership. However, it can be said that when controlling for complexity
leadership, job related heterogeneity loses its influence on team reported outcomes which
suggests that complexity leadership is a better predictor of team reported outcomes than
heterogeneity. Reversing the statement describes an important finding about the
relationship between complexity leadership and heterogeneity. When controlling for job
relevant heterogeneity, complexity leadership’s estimated effects on team reported
innovation outcomes remain stable. This observation leads to questioning whether similar
relationships are present for the heterogeneity norm. The norm arises from the dynamics
enabled by complexity leadership and has direct positive effects on performance.
Regressions show that similar to complexity leadership, when controlling for
heterogeneity, the effects the heterogeneity norm has on innovation team outcomes
remain stable.

116
One final aspect of the moderation results is that 4 of the 5 instances of
moderation involved shared complexity leadership which means that fifty percent of
possible relationships involving shared leadership and stakeholder outcomes exhibited
moderation. Given that shared complexity leadership showed less influence on
stakeholder outcomes in the test of other hypotheses than vertical, its moderation effects
are noteworthy and shed additional light on the role it plays. As reported by Reagans and
Zuckerman (2001), team heterogeneity by itself does not predict team performance;
heterogeneity must be engaged through social interaction for it to have value to team
performance. Additionally, Ensley et al. (2006) found that shared leadership enabled
teams of heterogeneous managers to share divergent views. The moderation findings of
this study reinforce the view that shared complexity leadership, because it entails mutual
influence among heterogeneous agents, is particularly helpful in engaging heterogeneity
for the benefit of team innovation.
A main research question for this study was to answer how complexity leadership
operates with heterogeneity. The full picture that can be drawn from this study is multi-
dimensioned and is made possible because this study has findings from two sources,
internal and external, for ratings of team outcomes. Here are the major elements. First, a
heterogeneity norm which values and engages differences emerges from the dynamics
enabled by complexity leadership and this norm increases innovation team outcomes
assessed by the team. Second, complexity leadership’s positive effects on innovation
team outcomes and those of the heterogeneity norm are stable when controlling for job
relevant heterogeneity. Complexity leadership and the heterogeneity norm perform
positively and consistently across a wide range of team heterogeneity patterns. Third,
117
because of its dynamic of shared and mutual influence, shared complexity leadership
catalyses job related heterogeneity to have impact on innovation team outcomes.
Implications for Management
This study provides important insight into the leadership of innovation teams,
which can guide management in companies to improve the performance of this important
element in their innovation systems. Because the role of leadership in forming internal
team dynamics productive of innovation has not been sufficiently research, limited
guidance could be given. The knowledge gained by the study can help create training
programs and other skill development activities for both individuals who will play the
role of designated team leader and also those who will be members of innovation teams.
The shared nature of complexity leadership can provide benefit when embodied by
participants on innovation teams.
Because this field study observed existing phenomena, the knowledge gleaned by
this study already exists in companies. Certainly, the people who were interviewed could
articulate a level of understanding of the relationships. However no evidence was found
that companies were formally or intentionally developing the identified skills. The
knowledge embodied in this report is tacitly and not consciously held in companies. The
value of this study is that existing tacit knowledge about dynamics important to
innovation teams performance has been made explicit and accessible. In some instances,
the knowledge gained from their experience was nonetheless questioned by interviewees
because it contradicted normal routines or generally accepted wisdom. For example, a
number of team members questioned their stepping up to lead team activities. This

118
underscores the challenges to the dissemination and implementation of the principles
confirmed by this study.
Some of the more challenging changes can be identified. The relinquishment of
the directing and controlling roles of designated leaders will present difficulties,
especially in environments where innovation efforts are closely managed and monitored.
The environment would need to be relaxed so that leaders will not feel pressure to control
events so they can step back and encourage members to step forward to act in leadership
ways. Members need to shift from viewing themselves only in their functional or
discipline roles and to re-conceive their role more broadly as a contributor to the learning
and creativity of the team and a leader of team efforts. Important skills in this regard
involve how to make their tacit knowledge explicit and explainable to others and how to
develop metaphors between their knowledge and that of others. Functional management
would enable this shift when they embrace and value the expanded roles of their
representatives on innovation teams and in so doing would help innovation teams move
to higher levels of collaborative learning. Attitudes and techniques associated with
conflict will undergo change. Skills should be developed to better distinguish productive
from non-productive conflict and to self-manage mutual conflict resolution. Techniques
for shared sense-making and sense-giving must become widespread among participants
of innovation teams. The normal tendency to seek convergence on teams prematurely
must give way to adequate periods of divergent thinking. The ability to move back and
forth between divergence and convergence throughout the life of the team should be
supported by developing skills related to guiding and sustaining divergence, recognizing
when convergence is needed and building productive convergence. Schedule
119
expectations for innovation teams must change to accommodate the time needed for more
in depth and possibly more protracted collaborative learning; management should be
attuned to the benefits of simultaneous development and mutual adjustment that will
accrue.
In sum, following the principles of CLT, managerial attempts to change behavior
to align with the principles learned in this study will have less impact if they are only
directed in a top-down manner and if training is done individually. Learning techniques
which help innovation can be applied to the dissemination of the skills identified in this
study. Managers should consider introducing the principles of this study in the setting of
innovation teams and to make learning how to embody the principles a team challenge
which will contribute to the success of their efforts. The principles represent an
innovative change to innovations teams. Seen from a CLT perspective, it is an innovation
best served by the self-organization and emergence made possible through the interaction
and interdependency among heterogeneous team members.
Limitations
The limitations of this study principally arise from its sample of teams. Many
aspects of the sample can limit the validity of its estimates and generalization of its
findings. The first limitation is that it is a convenience sample rather than a random
sample. Companies were asked to select teams across the spectrum of performance from
low to high but in their process of selecting teams, may have been biased toward higher
performing teams. The means and standard deviations for perceived performance provide
some evidence supporting this possibility (mean of 4.83 and standard deviation of .66 for
team-perceived performance and 5.17 mean and standard deviation of .95 for

120
stakeholder-perceived performance). Survivor bias may be another contributor to the
selection of higher performing teams. Innovation teams are regularly reviewed and if
underperforming, can be disbanded. The population of teams from which companies
could choose would consequently be biased toward those performing well enough and
producing innovations valuable enough to continue to be resourced.
The sample size of 59 teams is another limitation. As was noted, because of the
number of teams, regressions were constrained in the number of predictor variables
which were included. This limitation chiefly determined how the regressions for
moderation testing were constructed; tests for moderation of the two distributions of
complexity leadership were required to be done separately. Also another limitation
related to the sample size is the low power ratings reported above. Those power ratings
indicate relatively high possibility of Type 2 errors. It is possible that real relationships in
the data are not elucidated by the analyses due to sample size and low power.
Because most of the companies which participated in this study were global
enterprises, they were asked to provide teams which reflected their international
operations. However, few teams in the study had members located outside of the USA
and only two teams were resident in countries other than the USA. Given the limited
exposure to non-USA respondents, generalizing the results of this study globally is
constrained.
By design, all teams in the sample were innovation teams which are generally
project oriented. Innovation teams were selected for this study because they represent
CAS and the theory of this study asserts that complexity leadership must be studied in the
context of CAS. Reflecting that assertion, the applicability of the findings to other
121
contexts is questionable. It can be asserted that this study can be applied generally to
project oriented teams for which learning and innovating are key elements of their work.
Further research must be done in order to study how the description of complexity
leadership developed in this study would operate in other types of teams such as long
standing teams tasked with ongoing operations and teams at higher levels of the
organization.
A second limitation arises from the method used in this study to measure vertical
and shared leadership which is taken from the shared leadership literature. Generally, a
strong relationship exists between vertical leadership and shared leadership in studies of
shared leadership and is reflected in their high correlations (Ensley, Hmieleski, & Pearce,
2006; Pearce & Sims, 2002). That pattern can be explained because the exact same items
are measured in the constructs but in different loci--one set focused on leader and other
on team members. While their correlation is high, the different foci of the two measures
make them distinct constructs that should be kept separate. However, the high correlation
makes problematic interpretation of betas when both measures are in the regression
equation. A useful approach (Pearce & Sims, 2002) around the dilemma to understand
effects is to examine the R2 contribution to the outcome measures when one distribution
of leadership is added to the equation already containing the other. In this study,
correlation between the two distributions of leadership is high (r = .71, p < .01) and is in
line with other studies of shared leadership. When examining the contributions to R2 for
team-innovation enabling behaviors, for example, adding vertical to shared changes the
adjusted R2 from .481 to .490 (+ .009); adding shared to vertical changes the adjusted R2
from .469 to .490 (+ .021). For team-perceived performance, adding vertical to shared
122
changes the adjusted R2 from .370 to .494 (+ .124); adding shared to vertical changes the
adjusted R2 from .417 to .497 (+ .080). However, improvement of the measures should be
sought and this topic will be discussed in the next section.
A third limitation of this study is the validity and reliability of the measure
for complexity leadership. Because no measure previously existed, the goal of this study
required its construction. The process this study used was designed to alleviate this
limitation. The preliminary qualitative study sought to uncover leadership behaviors
which respondents could identify were associated with their teams’ innovation
performance. Interview questions were constructed from a review of complexity
leadership literature but were open ended to allow for spontaneous minimally directed
responses. The analysis of the qualitative data became a main source for the items
included in the quantitative survey in addition to translation of items from the few
existing field studies of complexity leadership. Factor analysis was used to identify the
items which adhered in the construct statistically and theoretically. The factor analysis
followed techniques previously validated for constructing a scale useable for both
vertical and shared dimensions (Pearce & Sims, 2002). Nonetheless, validation by a
single study can only be limited. Further validation of this study’s complexity leadership
measure must rely on future research.
Future Research
The study was done at an early stage of development of complexity leadership
theory. Consequently, there are many possibilities for future research questions linked to
this study. The first area to consider is the further development and elaboration of
complexity leadership and its associated model. This study examined complexity
123
leadership at the operation level of organizations. The question arises if the same
description of complexity leadership formulated in this study will have similar effects at
the general management and strategic levels. The literature exploring shared leadership is
an example to be followed by future complexity leadership research. Shared leadership
studies have confirmed similar effects on teams spanning a range of levels from change
project teams to top management teams. Another extension of this study for complexity
leadership theory would be research into other examples of CAS, particularly
organizational systems which have a greater need for stability than innovation teams. The
amount of learning, adaptation and innovation required in organizational systems will
vary. Complexity leadership recognizes this and accounts for it through its three
functions of administrative, adaptive and enabling leadership. Because this study
examined a system with high learning and innovation requirements, questions arise
whether the same description would help understand the effects of the functions and how
they interact when organizational requirements vary in their need for stability and
complex dynamics. It would appear to this researcher that the model proposed by this
study would need further elaboration of administrative behaviors to do so. Finally, the
model of this study contained two separate outcome measures, innovation enabling
behaviors and perceived performance which may be linked. Argument can be made the
perceived performance in a consequence of innovation enabling behaviors. Future
research could examine this relationship and complexity leadership’s role. For example,
path analysis flowing from complexity leadership through innovation enabling behaviors
to team innovation performance would shed light of this topic.

124
A second area of research which this study makes possible is the relationship
between complexity leadership and other theories of leadership. Here also, shared
leadership research can provide a model in so far as the effects of multiple theories of
leadership are tested simultaneously in shared leadership studies using previously
validated scales. Research could compare and contrast the effects of different types of
leadership, for example, transformational leadership with complexity leadership. In
addition, how various leadership behaviors work in concert or in contradiction to one
another can be examined. Contingency leadership theory would suggest that leadership
should vary depending on the conditions faced. However, this line of research presents
difficulties which would require the expansion of research designs. The phenomena
associated with complexity leadership are by their nature complex and unfold over time
in multi-determined and emergent manners. Most complexity leadership theorists
propose research studies using qualitative techniques and/or computer modeling so that
complex relationships, such as, amplifying feedback loops, can be appropriately
examined. A danger of inappropriately reducing the complexity of the phenomena could
be present in single method quantitative research studies. This current research employed
a mixed method in order to ground the quantitative study in a richer, nuanced landscape
revealed in the qualitative study. A mixed method approach is therefore suggested when
field studying complexity leadership in concert with other forms of leadership.
A third area for additional research arises from the measure used in this study for
complexity leadership. As discussed in the Instrumentation section, this study used a
“global measure” which captures the functions and sub-functions of complexity
leadership in one scale. Future studies could develop measures of each component. With
125
separate component measure, insights into how distinct the components are could be
gained. Finer tuned understanding can be gotten about the relationship of the components
to learning and innovation.
An important aspect of complexity leadership, its shared nature, is a fourth area for future
research. In the previous section, the limitation presented by the methods for measuring vertical
and shared leadership was discussed. This limitation is understood by the shared leadership
research community. Research can be undertaken that will more definitely explain the consistent
pattern of high correlation between vertical and shared leadership and determine measurement
techniques to better reflect the true relationship between vertical and shared leadership. As this
study presented in its arguments about norm formation, members take cues from and model
formal leader behaviors. One line of research would be how vertical leadership behavior
influences member leadership behavior and vice versa. Can members engage in complexity
leadership when leaders do not? Does vertical complexity leadership affect innovation
indirectly through shared? If member attitudes are strongly positive to the vertical leader,
will they tend to report shared behavior that mirrors the vertical? A second line of research
in this regard could examine the effect of organizational culture on leadership behavior by testing
whether certain leadership behaviors are more common in some organizations than others, that is,
a reflection of organizational culture. In summary, further research could pave the way to
changing methods and/or changing leadership models which contain both vertical and shared
leadership.
The heterogeneity norm contributes to both complexity leadership theory and
diversity research. Opportunities for further research exist in both areas. In this study, the
heterogeneity norm is an emergent structure arising from the dynamics enabled by
complexity leadership but it must be questioned whether this is a common occurrence
126
with complexity leadership or limited to contexts such as innovation teams. Complexity
leadership researchers perceive that a few rules govern the interaction of agents
(Lichtenstein et al., 2006). The existence of the heterogeneity norm raises questions
about whether some rules are the same across different types of CAS. For diversity
research, the heterogeneity norm relates to the study of attitudes toward diversity and
opens up additional research questions. A line of inquiry is how existing organization
attitudes influence the formation of a heterogeneity norm in the organization’s teams.
Also, past research has focused on determining attitudes which management can
inculcate in an organization to enhance the benefits from diversity. This study’s theory of
the emergence of the heterogeneity norm from interaction among members opens up the
possibility of bottom-up creation of positive attitudes toward diversity in addition to top-
down direction. Research into how those two processes complement each other could
yield more effective approaches to lead changes in organizational attitudes toward
diversity.
Because this study focuses on heterogeneity as conceived by complexity
leadership which relates to knowledge diversity and its measures, other types of diversity
were not considered by this study. Other types, shown to impact individual and group
performance, for example, categorical diversity, can also be studied in the context of
complexity leadership. A recent paper ( Post, De Lia, DiTomaso, Tirpak, & Borwankar,
2009), coming from the larger project of which this study is a part, found that differences
in thinking approaches, sequential thinking, i.e. following a set sequence of steps or
routines, versus connective thinking, i.e., simultaneously bringing multiple factors into
play and linking previously disconnected factors, enabled innovation enabling behaviors.

127
By studying other types of heterogeneity together with knowledge heterogeneity, team
compositional issues could be examined in concert with leadership. For example, the
relative effects on team outcomes could be parsed between the various types of
heterogeneity and leadership to answer whether the outcomes of the team are the result of
the team composition itself or chiefly arise from the leadership behaviors in the team.
Research in this vein could provide insights helpful to complexity leadership theory and
to diversity research.
A closely related research area to the types of heterogeneity would be to more fully
examine relationships among the constructs of collaborative learning and the heterogeneity norm
with complexity leadership and the types of heterogeneity. Collaborative learning can be
conceptualized to be an element in information processing mechanisms (van Kippenberg,
De Dreu & Homan, 2004) through which heterogeneity provides value to team outcomes;
consequently, it would be beneficial to explore the indirect effect of team heterogeneity
through collaborative learning to team innovation outcomes. Because norms by their
nature substitute for leadership influence in guiding the behavior in teams (Jassawalla &
Sashittal, 2002; Taggar & Ellis, 2007), the heterogeneity norm may have a moderating effect
on the relationship between heterogeneity and innovation team outcomes. In summary,
further research would add to our understanding of the moderating effect of complexity
leadership on team heterogeneity which may be better explained in concert with the effects of
collaborative learning and the heterogeneity norm.
Another area for research is the relationship of complexity leadership with other
team processes and dynamics not considered in this paper. An important example is the
team dynamic of a shared mindset among team members. Previous research (Dougherty,
1992: Mathieu, Goodwin, Heffner, Salas, & Cannon-Bowers, 2000) suggests that a

128
shared mindset would be helpful to perceived performance by bridging the disparate
mindsets existing on cross-function/discipline teams and closing information gaps. But
the issue is complicated with effects which may not be linear and would benefit from a
closer examination of the relationship between a shared mid-set and innovation teams
outcomes. In both the discussion and measurements of this paper, dichotomies exist. For
example, a generally shared pool of knowledge is created through collaborative learning
when members share and explain their individual mindsets sufficiently so others can
understand, account for and use the multiple views for knowledge creation. The
heterogeneity is not lost in the process but something held in common is created.
Common values and norms which contribute to a shared mindset are also dealt with in
the discussion and measurements. In the heterogeneity norm, something is held in
common but it values difference and uniqueness. The dual conditions of tension and
resonance enabled by complexity leadership are discussed and measured. They together
address the need for balance between and the importance of timing divergent versus
convergent thinking. Questions about shared mindset arise from the discussion about
when and how the divergent thinking versus convergent thinking needs to take place and
how it is implemented in heterogeneous teams so as not to diminish the value derived
from heterogeneity. Fundamentally, a question can be asked if a group mindset should be
developed and if so, how does it contribute positively to innovation. This is vein of
research would be interesting and important question for team innovation process, for
complexity leadership and for diversity research. Beyond shared mindset, other processes
can also be researched in relation to complexity leadership for example, psychological
safety and unproductive conflict. The research would fulfill the opportunities created by
129
this study to better connect complexity leadership to other existing literatures.
Conclusion
This study has striven to test and elaborate the theory of complexity leadership in
innovation teams, an important context for research and for industrial organizations. This
study employed a mixed methods approach because complexity theory is early in its
development and both the richness and specificity of qualitative and quantitative
techniques were needed to explore the concepts of CLT. This study developed a measure
for complexity leadership which can be used and tested in future research. Complexity
leadership is shown by this study to further organizational learning and innovation in
heterogeneous organizational systems as theorized by its developers. New understanding
about how complexity leadership relates to heterogeneity fills a gap in CLT and a new
structure, the heterogeneity norm, has been identified for further research. This study
reinforces that the shift in the complexity and dynamism of organizations has been
responded to with a new conception of leadership, and organizations are now challenged
to experiment with complexity leadership which is shared and is a dynamic for change
and adaptation.
130
REFERENCES
Achtenhagen, L., Melin, L., Mullern, T., & Ericson, T. 2003. Leadership: The role of
interactive strategizing. In A. Pettigrew, R. Whittington, L. Melin, C. Sanchez-Runde, F. A. J. Van Den Bosch, W. Ruigrok, & T. Numagami (Eds.), Innovative forms of organizing: International perspectives. London: Sage Publications: 49−71.
Alper, S., Tjosvold, D., & Law, K. S. 2000. Conflict management, efficacy, and
performance in organizational teams. Personnel Psychology, 53: 625–642. Amason, A. C. 1996. Distinguishing the effects of functional and dysfunctional conflict
on strategic decision making: Resolving a paradox for top management groups. Academy of Management Journal, 39: 123–148.
Amabile, T. M. 1997. Entrepreneurial Creativity through Motivational Synergy. Journal
of Creative Behavior, 31: 18-26. Amabile, T. M. 1998. How to kill creativity. Harvard Business Review, 76: 77–87. Ancona, D. G., & Caldwell. D. F. 1990. Beyond boundary spanning: Managing external
dependence in product development teams. Journal of High Technology Management Research, 1: 119-135.
Ancona, D. G., & Caldwell. D. F. 1992a. Demography and design: Predictors of new
product team performance. Organization Science, 3: 321-341. Ancona, D. G., & Caldwell, D. F. 1992b. Bridging the boundary: External process and
performance in organizational teams. Administrative Science Quarterly, 37: 634-665.
Argots, L. 1989. Agreement about norms and work-unit effectiveness: Evidence from the
field. Basic and Applied Social Psychology, 10: 131−140. Argyris, C. 1999. On Organizational Learning. Second Edition. Cambridge, MA:
Blackwell.
Argyris, C., & Schon, D. 1978. Organizational Learning. Cambridge, MA: Blackwell Avolio, B. J., Sivasubramaniam, N., Murry, W. D., Jung, D., & Garger, J. W. 2003.
Assessing shared leadership: Development and preliminary validation of a team multifactor leadership questionnaire. In C. L. Pearce, & J. A. Conger (Eds.), Shared Leadership: Reframing the Hows and Whys of Leadership, Thousand Oaks: Sage Publications: 143-172.
131
Barker, J. R. 1993. Tightening the iron cage: Concertive control in self-managing teams. Administrative Science Quarterly, 38: 408−437.
Baron, R. M., & Kenny, D. A. 1986. The Moderator-Mediator Variable Distinction in
Social Psychological Research: Conceptual, Strategic, and Statistical Considerations. Journal of Personality and Social Psychology, 51(6): 1173-1182.
Basadur, M., Graen, G. B., & Green, S. G. 1982. Training in creative problem solving:
effects on ideation and problem finding and solving in an industrial research organization. Organizational Behavior & Human Performance, 30(1): 41-70.
Basadur, M., Graen, G. B., & Scandura, T. A. 1986. Training effects on attitudes toward
divergent thinking among manufacturing engineers. Journal of Applied Psychology, 71(4): 612-617.
Basadur, M., Pringle, P., Speranzini, G., & Bacot, M. 2000. Collaborative problem
solving through creativity in problem definition: Expanding the pie. Creativity & Innovation Management, 9(1): 54-76.
Bass, B. M. 1985. Leadership and Performance Beyond Expectations. New York: The
Free Press. Bechky, B. A. 2003. Sharing meaning across occupational communities: The
transformation of understanding on a production floor. Organization Science, 14(3): 312-330.
Beer, M. 1999. Leading learning and learning to lead. In J.Conger, G.Spreitzer, & E.
Lawler (Eds.) The leader's change handbook. San Francisco, CA: Jossey-Bass: 127-161.
Benjamin. B. 1993. Understanding the political dynamics of developing new products.
Working paper, Stanford University Graduate School of Business. Stanford, CA. Berry, W. D., & Feldman, S. 1985. Multiple regression in practice. Beverly Hills: Sage. Bettencourt, B. A., & Sheldon, K. 2001. Social roles as mechanisms for psychological
need satisfaction within social groups. Journal of Personality and Social Psychology, 81: 1131-1143.
Bettenhausen, K. L., & Murnighan, J. K. 1985. The emergence of norms in competitive
decision-making groups. Administrative Science Quarterly, 30: 350−372. Bettenhausen, K. L., & Murnighan, J. K. 1991. The development of an intragroup norm
and the effects of interpersonal and structural challenges. Administrative Science Quarterly, 36: 20−35.

132
Blau, F. 1960. Patterns of deviation in work groups. Sociometry, 234: 245-261. Blau, F. 1977. Inequality and heterogeneity. New York: Free Press. Boal, K. P., & Schultz, P. L. 2007. Storytelling, time, and evolution: The role of strategic
leadership in complex adaptive systems. Leadership Quarterly, 18: 411–428. Boisot, M. H. 1998. Knowledge assets: Securing competitive advantage in the
information economy. Oxford: Oxford University Press. Bommer, W. H., Rubin, R. S., & Baldwin, T. T. 2005. Setting the stage for effective
leadership: Antecedents of transformational leadership behavior. Leadership Quarterly, 15: 195–210.
Bradbury, H., & Lichtenstein, B. 2000. Relationality in organizational research:
Exploring the space between. Organization Science, 11: 551−564. Brown, L. D. 1983. Managing conflict at organizational interfaces. Reading, MA:
Addison-Wesley. Brown, J. S., & Duguid, P. 2000. Balancing Act: How to Capture Knowledge Without
Killing It. Harvard Business Review, May-June: 73-80. Brown, S. L., & Eisenhardt, K. M. 1995. Product development: Past research. Present
findings, and future directions. Academy of Management Review, 20(3): 343-378.
Burke, C. S., Stagl, K. C., Klein, C., Goodwin, G. F., Salas, E.; Halpin, S. M.. 2006 What
type of leadership behaviors are functional in teams? A meta-analysis. Leadership Quarterly, 17 (3): 288-307.
Burns, T., & Stalker, G. M. 1961. The Management of Innovation. London: Tavistock. Camison-Zornoza, C., Lapiedra-Alcami, R., Segarra-Cipres, M., & Boronat-Navarro, M.
2004. A meta-analysis of innovation and organizational size. Organization Studies, 25: 331-361.
Carley, K., & Hill, V. 2001. Structural change and learning within organizations. In A.
Lomi & E. R. Larsen (Eds.), Dynamics of Organizational Societies. Cambridge, MA: AAAI/MIT Press: 63−92.
Carson, J. B., Tesluk, P. E., & Marrone, J. A. 2007. Shared leadership in teams: an
investigation of antecedent conditions and performance. Academy of Management Journal, 50(5): 1217-1234.
133
Chatman, J. A., & Flynn, F. J. 2001. The influence of demographic heterogeneity on the emergence and consequences of cooperative norms in work teams. Academy of Management Journal, 44: 956−974.
Chatman, J. A., Polzer, J. T., Barsade, S. G., & Neale, M. A. 1998. Being different yet
feeling similar: The influence of demographic composition and organizational culture on work group processes and outcomes. Administrative Science Quarterly, 43: 749–780.
Chatman, J. A., & Spataro, S. E. 2005. Using self-categorization theory to understand
relational demography-based variations in people’s responsiveness to organizational culture. Academy of Management Journal, 48: 321–31.
Chen, G., Liu, C. H., & Tjosvold, D. 2005. Conflict management for effective top
management teams and innovation in China. Journal of Management Studies, 42: 277–300.
Clark, K. B., & Fujimoto. T. 1990. The power of product integrity. Harvard Business
Review, 68(8): 107-118. Cohen, J., & Cohen, P. 1982. Applied multiple regression/correlation analysis for the
behavioral sciences. Hillsdale, New Jersey: Lawrence Erlbaum Associates. Cohen, W. M. & Levinthal, D. A. 1990. Absorptive Capacity: A New Perspective on
Learning and Innovation. Administrative Science Quarterly, 35(1): 128-152. Colman, M. M., & Carron, A. V. 2001. The nature of norms in individual sport teams.
Small Group Research, 32: 201−222. Conway, J. M., & Huffcutt, A. I. 2003. A review and evaluation of exploratory factor
analysis practices in organizational research. Organizational Research Methods, 6: 147-168.
Cooper, R. G. 1979. The dimensions of industrial new product success and failure.
Journal of Marketing, 43: 93-103. Cooper, R. G. & Kleinschmidt, E. I. 1987. New products: What separates winners from
losers? Journal of Product Innovation Management, 4: 189-184. Cooper. R. G. & Kleinschmidt, E. J. 1993. Major new products: What distinguishes the
winners in the chemical industry? Journal of Product Innovation Management, 10: 90-111.
Cordero, R., DiTomaso, N., & Farris, G. 1996. Gender and race/ethnic composition of
technical work groups: Relationship to creative productivity and morale. Journal of Engineering and Technology Management, 13: 205-221.
134
Cox, T. H., Lobel, S. A., & McLeod, P. L. 1991. Effects of ethnic groupcultural
differences on cooperative and competitive behavior on a group task. Academy of Management Journal, 34: 827–847.
Cunningham, G. B., & Chelladurai, P. 2005. Affective Reactions to Cross-functional
Teams: The Impact of Size, Relative Performance, and Common In-group Identity. Group Dynamics: Theory, Research, and Practice, 8: 83-97.
Cronin, M, A., & Weingart, L. R.. 2007 Representational gaps, information processing,
and conflict in functionally diverse teams. Academy of Management Review, 32 (3): 761-773.
De Dreu, C. K. W., & Weingart, L. R. 2003. Task versus relationship conflict, team
performance, and team member satisfaction: A meta-analysis. Journal of Applied Psychology, 88(4): 741–749.
De Dreu, C. K. W., & West, M. A. 2001. Minority dissent and team innovation: The
importance of participation in decision making. Journal of Applied Psychology, 86: 1191–1201.
De Leeuw, A. J. C, & Volberda, H. W. 1996. On the concept of flexibility: A dual
control perspective. Omega, 2: 121-139. Dielman, T. E. 1991. Applied regression analysis for business and economics. Boston:
PWS- Kent. DiTomaso, N., Post, C., & Parks-Yancy, R. 2007. Workforce Diversity and Inequality:
Power, Status, and Numbers. Annual Review of Sociology, 33: 473-501. DiTomaso, N., Post, C., Smith, D. R., Farris, G. F., & Cordero, R. 2007. Effects of
Structural Position on Allocation and Evaluation Decisions for Scientists and Engineers in Industrial R&D. Administrative Science Quarterly, 52(2): 175-207.
Dougherty, D. 1990. Understanding new markets for new products. Strategic
Management Journal. 11: 59-78. Dougherty, D. 1992. Interpretive barriers to successful product innovation in large firms.
Organization Science, 3: 179-202. Dougherty D. & Corse, S. 1997. What does it take to take advantage of product
innovation? Research on Technological Innovation, Management and Policy, 6: 155-190.
135
Dougherty, D., & Hardy, C. 1996. Sustained product innovation in large, mature organizations: Overcoming innovation-to-organization problems. Academy of Management Journal, 39: 1120−1153.
Dunne, D. D., & Dougherty, D. 2010. Searching for clues: A theoretical framework for
exploratory product innovation. In draft for submission. Dunham, L., & Freeman, R. E. 2000. There is business like show business: Leadership
lessons from the theater. Organizational Dynamics, 29: 108–122. Dunlap, W.P., Burke, M.J., & Smith-Crowe, K. 2003. Accurate Tests of Statistical
Significance for rWG and Average Deviation Interrater Agreement Indexes. Journal of Applied Psychology, 8(2): 356–362.
Earley, P. C., & Mosakowski, E. 2000. Creating hybrid team cultures: An empirical test
of transnational team functioning. Academy of Management Journal, 43(1): 26-49.
Edmondson, A. C. 1999. Psychological safety and learning behavior in work teams.
Administrative Science Quarterly, 44: 350-383. Edmondson, A. C. 2002. The Local and Variegated Nature of Learning in Organizations:
A Group-Level Perspective. Organization Science, 13(2): 128-146. Eisenhardt, K. M. (1989). Making fast strategic decisions in high-velocity environments.
Academy of Management Journal, 32: 543−576. Eisenhardt, K M., & Bourgeois III, L. J. 1988, Politics of strategic decision making in
high-velocity environments: Toward a midrange theory. Academy of Management Journal, 31(4): 737-770.
Ekvall, G., & Arvonen, J. 1991. Change-centered leadership: An extension of the two-
dimensional model. Scandinavian Journal of Management, 7(1): 17-26. Ekvall, G., & Arvonen, J. 1994. Leadership profiles, situation and effectiveness. British
Journal of Management, 3(3): 139-160. Ely, R. J. & Thomas, D. A. 2001. Cultural Diversity at Work: The Effects of Diversity
Perspectives on Work Group Processes and Outcomes. Administrative Science Quarterly, 46(2), 229-273.
Ensley, M. D., Hmieleski, K. M., & Pearce, C. L. 2006. The importance of vertical and
shared leadership within new venture top management teams: Implications for the performance of startups. Leadership Quarterly, 17(3): 217-231.

136
Fabrigar, L. R.,Wegener, D. T., MacCallum, R. C., & Strahan, E. J. 1999. Evaluating the use of exploratory factor analysis in psychological research. Psychological Methods, 4, 272-299.
Farris, G. F. & Cordero, R. 2002. Leading your scientists and engineers. Research
Technology Management, 45(6): 13-25. Fayol, H. 1949. General and Industrial Management. London: Pitmann Feldman, D. C. (1984). The development and enforcement of group norms. Academy of
Management Review, 9: 47−53. Fiedler, F. E. 1964. A contingency model of leadership effectiveness. In L. Berkowitz
(Ed.), Advances in Experimental Social Psychology. New York: Academic Press: 149-190.
Fiol, C., & Lyles, M. 1985. Organizational learning. Academy of Management Review, 10(4): 803-813.
Ford, J. K., MacCallum, R. C., & Tait, M. 1986. The application of exploratory factor
analysis in applied psychology: A critical review and analysis. Personnel Psychology, 39: 291-314.
Fox, J. 1991. Regression Diagnostics: Quantitative Applications In The Social
Sciences. California: Sage Publication. Frankwick, G. L., Walker, B. A., & Ward, J. C. 1994. Belief structures in conflict:
Mapping a strategic marketing decision. Journal of Business Research, 31: 183–195.
Friedkin, N. E. 2001. Norm formation in social influence networks. Social Networks, 23:
167−189. Frost, P. J., & Egri, C.P. 1991. The Political Process of Innovation, in L.L. Cummings
and B.M. Staw (Eds.), Research in Organizational Behavior, 13: 229-295. Geletkanycz, M. A. 1997. The salience of 'culture's consequences': The effects of cultural
values on top executive commitment to the status. Strategic Management Journal, 18(8): 615-634.
Gibson, C., & Vermeulen, F. 2003. A healthy divide: Subgroups as a stimulus for team
learning behavior. Administrative Science Quarterly, 48: 202-239. Gioia, D., & Chittipeddi, K. 1991. Sensemaking and sensegiving in strategic change
initiation. Strategic Management Journal, 12: 433−448.
137
Gladstein, D. L. 1984. A model of task group effectiveness. Administrative Science Quarterly, 29: 499–517.
Golan, A., Lane, J., & McEntarfer, E. 2007.The Dynamics of worker reallocation within
and across industries. Economica, 74(293):1-20. Graen, G.B. & Uhl-Bien, M. 1995. Relationship-based approach to leadership:
Development of leadership-member exchange (LMX) theory of leadership over 25 years: Applying a multi-level multi-domain perspective. Leadership Quarterly, 6: 219-247.
Griffin, M, A., Neal, A., & Parker, S. K. 2007. A new model of work role performance:
Positive behavior in uncertain and interdependent contexts. Academy of Management Journal, 50(2): 327–347.
Guimera, R., Uzzi, B., Spiro, J., & Amaral, L. A. N. 2005. Team Assembly Mechanisms
Determine Collaboration Network Structure and Team Performance. Science, 308(29): 697-202.
Hambrick, D. C., Geletkanycz, M. A., & Fredrickson, J. W. 1993. Top executive
commitment to the status quo: Some tests of its determinants. Strategic Management Journal, 14(6): 401-418.
Hargadon, A. B. & Bechky, B. A. 2006. When collections of creatives become creative
collectives: A field study of problem solving at work. Organization Science, 17(4): 484-500.
Harrison, D. A., & Klein, K. J. 2007. What's the difference? Academy of Management
Review, 32(4): 1199–1228. Hazy, J. K. 2007. Computer models of leadership: Foundations for a new discipline or
meaningless diversion? Leadership Quarterly, 18: 391–410. He, Z., & Wong, P. 2004. Exploration versus. exploitation: An empirical test of
ambidexterity hypothesis. Organization Science, 15: 481-494.
138
Heifetz, R. A., & Laurie, D. L. 2001. The work of leadership. Harvard Business Review, 79(11), 131−141.
Hetzel, R. D. 1997. A primer on factor analysis with comments on patterns of practice
and reporting. In B. Thompson (Ed.), Advances in social science methodology (Vol. 4). Greenwich, CT: JAI Press: 215-267.
Hirst, G., & Mann, L. 2004. A model of R&D leadership and team communication: The
relationship with project performance. R&D Management, 34(2):147–160. Hogg, M. A. 2001. A Social Identity Theory of Leadership. Personality and Social
Psychology Review, 5(3): 184-200. Hollander, E. 1964. Leadership, groups, and influence. New York: Oxford University
Press. Homan, A. C., Hollenbeck, J. R., Humphrey, S. E., van Knippenberg, D., Ilgen, D. R., &
Van Kleef, G. A. 2008. Facing differences with an open mind: Openness to experience, salience of intragroup differences, and performance of diverse work groups. Academy of Management Journal, 51(6): 1204–1222.
Howard, H. S. 1994. Why do people say nasty things about self-reports? Journal of
Organizational Behavior, 15, 399–404. Hülsheger, U. R., Anderson, N., & Salgado, J. F. 2009. Team-level predictors of
innovation at work: A comprehensive meta-analysis spanning three decades of research. Journal of Applied Psychology, 94(5): 1128-1145.
Janssen, O. 2000. Job demands, perceptions of effort--reward fairness and innovative
work behavior. Journal of Occupational & Organizational Psychology, 73(2): 287-302.
Janssen, O., & Huang, X. 2008. Us and me: Team identificatin and individual
differentiation as complementary drivers of team members’ citizenship and creative behaviors. Journal of Management, 34(1): 69-88.
Janz, B. D. & Prasarnphanich, P. 2003. Understanding the antecedents of effective
knowledge management: The importance of a knowledge-centered culture. Decision Science, 34(2): 351-384.
Jassawalla, A. R., & Sashittal, H. C. 2002. Cultures that support product innovation
processes. Academy of Management Executive, 16(3): 42-54. Jassawalla, A. R., & Sashittal, H. C. 2006. Collaboration in cross-functional product
innovation team. In M. M. Beyerlein, S. T. Beyerlein, & F. A. Kennedy (Eds.), Innovation through collaboration. Oxford, UK: Elsevier LTD: 1−26.
139
Jehn, K. A. 1995. A multimethod examination of the benefits and detriments of
intragroup conflict. Administrative Science Quarterly, 40(2): 256-282. Jehn, K. A., & Bezrukova, K. 2004. A field study of group diversity, workgroup context,
and performance. Journal of Organizational Behavior, 25: 703–29. Jehn, K. A., Northcraft, G. B., & Neale, M. A. 1999. Why differences make a difference:
A field study of diversity, conflict, and performance in workgroups. Administrative Science Quarterly, 44(4): 741-763.
Jennings, J., & Haughton, L. 2000. It's not the big that eat the small…it's the fast that
eat the slow. New York: Harper Business. Johnson, D. W., Johnson, R. T. & Anderson, D. 1978. Student cooperative, competitive,
and individualistic attitudes, and attitudes toward schooling. Journal of Psychology, 100(2), 183-199.
Jones, G. R. 2000. Organizational theory, (3rd ed.). Reading, MA: Addison-Wesley. Katz, D., & Kahn, R. L. 1978. The social psychology of organizations. New York: John
Wiley & Sons. Kauffman, S. A. 1991. Antichaos and adaptation. Scientific American, 265(2), 78–84. Kauffman, S. A. 1993. Origins of order: Self-organization and selection in evolution.
Oxford, England: Oxford University Press. Kauffman, S. A. 1995. At home in the universe: The search for laws of self-
organization and complexity. New York: Oxford Press. Kazanjian, R. K., Drazin, R., & Glynn, M. A. 2000. Creativity and technological
learning: the roles of organization, architecture, and crisis in large-scale projects. Journal of Engineering Technology Management, 17: 273–298.
Kearney, E., & Gebert, D. 2009. Managing diversity and enhancing team outcomes: The
promise of transformational leadership. Journal of Applied Psychology, 94(1): 77–89.
Kearney, E., Gebert, D., & Voelpel, S. C. 2009. When and how diversity benefits teams:
The importance of team mambers' need for cognition. Academy of Management Journal, 52(3): 581–596.

140
Keller, R. T. 2001. Cross-functional project groups in research and new product development: Diversity, communications, job stress, and outcomes. Academy of Management Journal, 44, 547–555
Keltner, D., Gruenfeld, D.H., & Anderson, C. 2003. Power, approach, and inhibition.
Psychology Review, 110: 265–84. Kurtzberg, T. R. 2005. Feeling creative, being creative: An empirical study of diversity
and creativity in teams. Creativity Research Journal, 17: 51-65. Lau, D. C., & Murnighan, J. K. 1998. Demographic diversity and faultlines: The
compositional dynamics of organizational groups. Academy of Management Review, 23: 325–340.
LeBreton, J.M. & Senter, J.L. 2008. Answers to 20 questions about interrater reliability
and interrater agreement. Organizational Research Methods, 11: 815-852. Lester, R. K., Piore, M. J., & Malek, K. 1998. Interpretive management: What general
managers can learn from design. Harvard Business Review, 76(2): 86-96. Li, J., & Hambrick, D. C. 2005. Factional groups: a new vantage on demographic
faultlines, conflict, and disintegration in work teams. Academy of Management Journal, 48: 794–813.
Lichtenstein, B. 2000. Self-organized transitions: A pattern amid the ‘chaos’ of
transformative change. Academy of Management Executive, 14: 128−141. Lichtenstein1, B. B, & Plowman, D. A. 2009. The leadership of emergence: A complex
systems leadership theory of emergence at successive organizational levels. Leadership Quarterly, 20: 617-630.
Lichtenstein1, B. B., Uhl-Bien, M., Marion, R., Seers, A., Orton, J.D., & Schreiber, C. 2006. Complexity leadership theory: An interactive perspective on leading in complex adaptive systems. E:CO, 8(4): 2–12. Likert, R. 1961. New Patterns of Mangement. New York: McGraw-Hill. Lovelace, K., Shapiro, D. L., & Weingart, L. R. 2001. Maximizing cross-functional new
product teams’ innovativeness and constraint adherence: A conflict communications perspective. Academy of Management Journal, 44: 779–793.
Maier, N. R. 1950. The quality of group discussions as influenced by the discussion
leader. Human Relations, 3:155–174. Maier, N. R. 1953. An experimental test of the effect of training on discussion leadership.
Human Relations, 6: 161–173.
141
Maier, N. R., & Hoffman, L. R. 1960. Quality of first and second solutions in group
problem solving. Journal of Applied Psychology, 44: 278–283. Maier, N. R., & Hoffman, L. R. 1965. Acceptance and quality of solutions as related to
leaders’ attitudes toward disagreement in group problem-solving. Journal of Applied Behavioral Science, 1: 373–386.
Maier, N. R., & Janzen, J. C. 1969. Are good problem solvers also creative?
Psychological Reports, 24: 139–146. Maier, N. R., & Solem, A. R. 1962. Improving solutions by turning choice situations into
problems. Personnel Psychology, 15: 151–157. Mannix, E., & Neale, M. A. 2005. What differences make a difference. Psychological
Science in the Public Interest, 6(2): 31-55. March, J. G. 1991. Exploration and exploitation in organizational learning. Organization
Science, 2: 71–87. Marion, R. & Uhl-Bien, M. 2001. Leadership in Complex Organizations. Leadership
Quarterly, 12(4): 389-418. Mathieu, J. E., Goodwin, G. F., Heffner, T. S., Salas, E.. & Cannon-Bowers, J. A. 2000.
The Influence of Shared Mental Models on Team Process and Performance. Journal of Applied Psychology, 85(2): 273-283.
McKelvey, B. 2001. Energizing order-creating networks of distributed intelligence.
International Journal of Innovation Management, 5: 181−212. McKelvey, B. 2007. Emergent strategy via Complexity Leadership: Using complexity
science and adaptive tension to build distributed intelligence. In M. Uhl-Bien & R. Marion (Eds.), Complexity Leadership Part I: Conceptual Foundations. Charlotte, NC: Information Age Publishing.
Meindl, J. R. 1990. On leadership: An alternative to the conventional wisdom. Research
in Organizational Behavior, 12; 159-205. Miles, R. E., Snow, C. C., Matthews, J. A., & Miles, G. 1999. Cellular-network
organizations. In W. E. Halal & K. B. Taylor (Eds.), Twenty-first Century Economics. New York: Macmillan: 155−173.
Milliken, F. J., Bartel, C. A., & Kurtzberg, T. R. 2003. Diversity and creativity in work
groups: A dynamic perspective on the affective and cognitive processes that link diversity and performance. In P. B. Paulus, & B. A. Nijstad (Eds.), Group Creativity: Innovation Through Collaboration. Oxford University Press.
142
Milliken, F. J., & Martins, L. L. 1996. Searching for common threads: Understanding the
multiple effects of diversity in organizational groups. Academy of Management Review, 2: 402–433.
Mintzberg, H. 1979. The Structuring of Organizations. Prentice-Hall, Englewood Cliffs,
NJ. Mor Barak, M. E., Cherin, D. A., & Berkman, S. 1998. Organizational and personal
dimensions in diversity climate: Ethnic and gender differences in employee perceptions. Journal of Applied Behavioral Science, 34: 82-104.
Morgan, G. 2006. Images of Organization. Thousand Oaks, CAL Sage. Mumford, M. D. 2000. Managing creative people: Strategies and tactics for innovation.
Human Resources Management Review, 10: 313-351. Mumford, M. D., & Licuanan, B. 2004. Leading for innovation: Conclusions, issues, and
directions. Leadership quarterly, 15(1):163−171. Mumford, M. D., Scott, G. M., Gaddis, B., & Strange, J. M. 2002. Leading creative
people: Orchestrating expertise and relationships. Leadership Quarterly, 13: 705–750.
Nemeth, C. J. 1986. Differential contributions of majority and minority influence
processes. Psychological Review, 93: 10–20.
O'Brien, R. M. 2007. A Caution Regarding Rules of Thumb for Variance Inflation Factors. Quality and Quantit,y 41(5): 673-690.
O'Connor, P. G., & Quinn, L. 2004. Organizational Capacity for Leadership. In C. D.
McCauley (Ed.), Handbook of Leadership Development. San Francisco, CA: Jossey-Bass.
Osborn, R., Hunt, J. G., & Jauch, L. R. 2002. Toward a contextual theory of leadership.
Leadership Quarterly, 13: 797−837. Papadakis, V., & Bourantas, D. 1998. The Chief Executive Officer As Corporate
Champion of Technological Innovation. Technology Analysis & Strategic Management, 1: 89-110.
Pearce, C. L. 2004. The future of leadership: Combining vertical and shared leadership to
transform knowledge work. Academy of Management Executive, 18(1): 47-57. Pearce, C. L., & Conger, J. A. 2003. Shared leadership: Reframing the hows and whys
of leadership. Thousand Oaks: Sage.
143
Pearce, C. L. & Sims Jr., H. P. 2002. Vertical Versus Shared Leadership as Predictors of
the Effectiveness of Change Management Teams: An Examination of Aversive, Directive, Transactional, Transformational, and Empowering Leader Behaviors. Group Dynamics: Theory, Research, and Practice, 6(2): 172-197.
Pearce, C. L., Yoo, Y., & Alavi, M. 2004. Leadership, social work and virtual teams: The
relative influence of vertical vs. shared leadership in the nonprofit sector. In R. E. Riggio & S. Smith-Orr (Eds.), Improving leadership in nonprofit organizations. San Francisco: Jossey-Bass: 180–203.
Pedhazur, E. J., & Schmelkin, L. P. 1991. Measurement, design, and analysis: An
integrated approach. Hillsdale, NJ: Erlbaum. Pelled, L. H. 1996. Demographic diversity, conflict, and work group outcomes: An
intervening process theory. Organization Science, 7(6): 615-631. Pelled, L. H., Eisenhardt, K. M., & Xin, K. R. 1999. Exploring the blackbox: An analysis
of work group diversity, conflict, and performance. Administrative Science Quarterly, 44: 1–28.
Perry-Smith, J. E. 2006. Social yet creative: The role of social relationships in facilitating
individual creativity. Academy of Management Journal, 49: 85–101. Perry-Smith, J. E., & Shalley, C. E. 2003. The social side of creativity: A static and
dynamic social network perspective. Academy of Management Review, 29: 89–106.
Pfeffer, J. 1981. Management as symbolic action: The creation and maintenance of
organizational paradigms. In Barry. M. Staw. & L.L. Cummings, (Eds.), Research in Organizational Behavior. 3: 1-52.
Phillips, K. 2003. The effects of categorical based expectation on minority influence: The
importance of congruence. Personality and Social Psychology Bulletin, 21(1): 3-13.
Phillips, K., & Lewin-Loyd, D. 2006. When surface and deep-level diversity collide: The
effects of dissenting group members. Organizational Behavior & Human Decision Processes, 99: 143-160.
Phillips, K., Northcraft, G. B., & Neale, M. A. 2006. Surface-level diversity and
decision-making in groups: When does deep-level similarity help? Group Processes & Intergroup Relations, 9(4): 467-482.
144
Plowman, D. A., Baker, L., Beck, T., Silansky, S., Kulkarni, M., & Travis, D. 2007a. Radical change accidentally: The emergence and amplification of small change. Academy of Management Journal, 50: 515−543.
Plowman, D. A., Baker, L., Beck, T., Silansky, S., Kulkarni, M., & Travis, D. 2007b. The
role of leadership in emergent, self-organization. Leadership Quarterly, 18: 341-356.
Postmes, T., Haslam, S. A., & Swaab, R. 2005. Social influence in small groups: An
interactive model of social identity formation. European Review of Social Psychology, 16: 1-41.
Postmes, T., Spears, R., Lee, A. T., & Novak, R. J. 2005. Individuality and social
influence in groups: Inductive and deductive routes to group identity. Journal of Personality and Social Psychology, 89: 747-763.
Preacher, K. J., & Hayes. A. F. 2008. Asymptotic and resampling strategies for assessing
and comparing indirect effects in multiple mediator models. Behavior Research Methods, 40(3): 879-891.
Podsakoff, P. M., MacKenzie, S. B., Lee, J. Y., & Podsakoff, N. P. 2003.Common
method biases in behavioral research: A critical review of the literature and recommended remedies. Journal of Applied Psychology, 88: 879–903.
Prusak, L.1996. The knowledge advantage. Strategy & Leadership, 24: 6−8. Quinn, J. B. 1985. Managing innovation: Controlled chaos. Harvard Business Review,
83(3): 73-84. Quinn, J. B., Anderson, P., & Finkelstein, S. 2002. Managing professional intellect:
Making the most of the best. In S. Little P. Quintas & T. Ray (Eds.), Managing knowledge: An essential reader. London: Sage, 335−348.
Ramamoorthy, N., Flood, P. C., Slattery, T., & Sardessai, R. 2005. Determinants of
innovative work behavior: development and test of an integrated model. Creativity and Innovation Management, 14(2): 142-150.
Randel, A. E. 2002. Identity salience: a moderator of the relationship between group
gender composition and work group conflict. Journal of Organizational Behavior, 23: 749–766.
Reagans, R., & Zuckerman, E. W. 2001. Networks, Diversity and Productivity: The
Social Capital of Corporate R&D Teams. Organization Science, 12(4): 502-517.

145
Reagans, R., Zuckerman, E., & McEvily, B. 2004. How to Make the Team: Social Networks vs. Demography as Criteria for Designing Effective Teams. Administrative Science Quarterly, 49(1): 101-133.
Rico, R., Molleman, E., Sánchez-Manzanares, M., & Van der Vegt, G. 2007. The Effects
of Diversity Faultlines and Team Task Autonomy on Decision Quality and Social Integration. Journal of Management, 33(1): 111-132.
Roschelle, J. 1992. Learning by collaborating: Convergent Conceptual Change. The
Journal of the Learning Sciences, 2(3): 235-276. Saavedra, R., Earley, P. C., & Van Dyne, L. 1993. Complex interdependence in task-
performing groups. Journal of Applied Psychology, 78: 61–72. Salancik, G. R., & Pfeffer, J.1978. A social information processing approach to job
attitudes and task design. Administrative Science Quarterly, 23: 224-253. Schein, E. 1993. On Dialogue, Culture, and Organizational Learning. Organizational
Dynamics, 2: 40-51. Schneider, M., & Somers, M. 2006. Organizations as complex adaptive systems:
Implications of complexity theory for leadership research. Leadership Quarterly, 17(4), 351−365.
Schippers, M. C., Den Hartog. D. N., Koopman, P. L., & Wienk, J. A. 2003. Diversity
and team outcomes: The moderating effects of outcome interdependence and group longevity and the mediating effect of reflexivity. Journal of Organizational Behavior, 24: 779–802.
Senge, P. M. 1994. The fifth discipline: The art and practice of learning organization.
New York: Doubleday. Schein, E. 1993. On Dialogue, Culture, and Organizational Learning. Organizational
Dynamics, 2: 40-51. Sheremata, W. A. 2000. Centrifugal and centripetal forces in radical new product development
under time pressure. Academy of Management Review, 25(2): 389-408. Shore, L. M., & Barksdale, K. 1998. Examining degree of balance and level of obligation
in the employee relationship: A social exchange approach. Journal of Organizational Behavior, 19: 731−744.
Simons, T., & Peterson, R. 2000. Task conflict and relationship conflict in top
management teams: The pivotal role of intragroup trust. Journal of Applied Psychology, 85: 102–111.
146
Slappendel, C. 1996. Perspectives on innovation in organizations. Organization Studies, 17(1): 107-129
Somech, A. 2006. The effects of leadership style and team process on performance and
innovation in functionally heterogeneous teams. Journal of Management, 32(1): 132-157.
Spector, P. E. 1994. Using self-report questionnaires in OB research: A comment on the
use of a controversial method. Journal of Organizational Behavior, 15(5): 385-392.
Swann, W.B., Kwan, V. S. Y, Polzer. J. T., & Milton, L. P. 2003. Fostering group
identification and creativity in diverse groups: The role of individual and self-verification. Personality and Social Psychology Bulletin, 29: 1396-1406.
Taggar, S. & Ellis, R. 2007. The role of leaders in shaping formal team norms.
Leadership Quarterly, 18(2): 105-120. Takeuchi, H., & Nonaka, I. 1986. The new new product development game. Harvard
Business Review, 64{1): 137-146.
Thompson, J. D. 1967. Organizations in Action. McGraw-Hill, New York. Tichy, N.M. 2002. The Leadership Engine. New York: HarperCollins Publishers Inc. Tichy, N. M. & Fombrun, C. 1979. Network Analysis in Organizational Settings. Human
Relations, 32(11): 923-965. Tjosvold, D. 1997. Conflict within interdependence: Its value for productivity and
individuality. In C. K. W. De Dreu & E. Van de Vliert (Eds.), Using conflict in organizations. London: Sage: 23–37.
Tjosvold, D. 1998. Making employee involvement work: Cooperative goals and
controversy to reduce costs. Human Relations, 51: 201–214. Tjosvold, D., Poon, M., & Yu, Z. Y. 2005a. Team effectiveness in China: Cooperative
conflict for relationship building. Human Relations, 58: 341–367. Tjosvold, D., Sun, H. F., & Wan, P. 2005b. Effects of openness, problem-solving, and
blaming on learning: An experiment in China. Journal of Social Psychology, 145: 629–644.
Tjosvold, D., & Wong, A. S. 2004. Innovating Across Cultural Boundaries: Applying
Conflict Theory to Develop a Common Approach. International Negotiation, 9: 291-313.
147
Tuckman, B. W., & Jensen, M. C. 1977. Stages of small group development revisited. Group and Organization Studies, 2: 419−427.
Trist, E. L.. 1981. The socio-technical perspective. In A. van de Ven & W.F. Joyce
(Eds.), Perspectives on Organization Design and Behavior, Wiley-Interscience. Tsui, A. S., Egan, T.N., & O’Reilly, C.A. 1992. Being different: Relational demography
and organizational attachment. Administrative Science Quarterly, 37: 549-579. Uhl-Bien, M., & Marion, R. 2009. Complexity leadership in bureaucratic forms of
organizing: A meso model. Leadership Quarterly, 20(4): 631-650. Uhl-Bien, M., Marion, R., & McKelvey, B. 2007. Complexity leadership theory: Shifting
leadership from the industrial age to the knowledge era. Leadership Quarterly, 18: 298-318.
Van den Bosch, F.A.J, Volberda, H.W. & de Boer, M. 1999. Coevolution of firm
absorptive capacity and knowledge environment: Organizational forms and combinative capabilities. Organization Science, 10: 551–568.
Van Der Vegt, G, S., & Bunderson, J. S. 2005. Learning and performance in
multidisciplinary teams: The importance of collective team identification. Academy of Management Journal, 48(3): 532-547.
Van Der Vegt, G. S., & Janssen, O. 2003. Joint impact of interdependence and group
diversity on innovation. Journal of Management, 29: 29–51. Van der Vegt, G. S., Van de Vliert, E., & Huang, X. 2005. Location-level links between
diversity and innovative climate depend on national power distance. Academy of Management Journal, 48: 1171–1182.
Van De Ven, A. H., Delbecq, A. L., & Koenig, R. 1976. Determinants of coordination
modes within organization. American Sociological Review, 41: 322-338. Van De Ven, A. H., & Polley, D. 1992. Learning while innovating. Organization
Science, 3(1): 92-116. van Knippenberg, D., De Dreu, C. K. W., & Homan, A. C. 2004. Work Group Diversity
and Group Performance: An Integrative Model and Research Agenda. Journal of Applied Psychology, 89(6): 1008-1022.
van Knippenberg, D., & Haslam, S.A. 2003. Realizing the diversity dividend: exploring
the subtle interplay between identity, ideology, and reality. In S.A. Haslam, D van Knippenberg, MJ Platow, N Ellemers (Eds.), Social Identity at Work: Developing Theory for Organizational Practice. New York/Hove: Psychology Press: 61–77.
148
van Knippenberg, D., & Schippers, M. C. 2007. Work Group Diversity. Annual Review
of Psychology, 58: 515-541. Wageman, R. 1995. Interdependence and Group Effectiveness. Administrative Science
Quarterly, 40(2): 145-180. Wall, J., & Callister, R. 1995. Conflict and its management. Journal of Management,
21: 515–558. Wall, V., & Nolan, L. 1986. Perceptions of inequity, satisfaction, and conflict in task-
oriented groups. Human Relations, 39: 1033–1052. Weick, K. E., & Roberts, K. H. 1993. Collective mind in organizations: Heedful
interrelating on flight decks. Administrative Science Quarterly, 38(3): 357-381. Weingart, L. R., Cronin, M. A., Houser, C. J. S., Cagan, J., & Vogel, C. M. 2005.
Functional diversity and conflict in cross-functional product development teams: Considering representational gap and task characteristics. Research in Management, 4: 89–110.
West, M. A. 2002. Sparkling fountains or stagnant ponds: An integrative model of
creativity and innovation implementation in work groups. Applied Psychology: An International Review, 51: 355–424.
Williams, K. Y., & O'Reilly, C. A. 1998. Demography and Diversity in Organizations: A
Review of 40 Years of Research. Research in Organizational Behavior, 20: 77-140.
Woodman, R. W., Sawyer, J. E., & Griffin, R. W. 1993. Toward a theory of
organizational creativity. Academy of Management Review, 18: 293–321. Yeh, Y., & Chou, H. 2005. Team composition and learning behaviors in cross-functional
teams. Social Behavior and Personality, 33: 391–402. Yukl, G. 2009. Leading organizational learning: Reflections on theory and research.
Leadership Quarterly, 20(1): 49-53. Yukl, G. & Falbe, C. M. 1990. Influence Tactics and Objectives in Upward, Downward,
and Lateral Influence Attempts. Journal of Applied Psychology, 75(2): 132-140.

149
Zammuto, R, F., Griffith, T. L., Majchrzak, A. Dougherty, D. J., & Faraj, S. 2007. Information Technology and the Changing Fabric of Organization. Organization Science, 18(5), 749-762.
Zirger, B. J., & Maidique, M. 1990. A model of new product development: An empirical
test. Management Science, 36: 867-883.
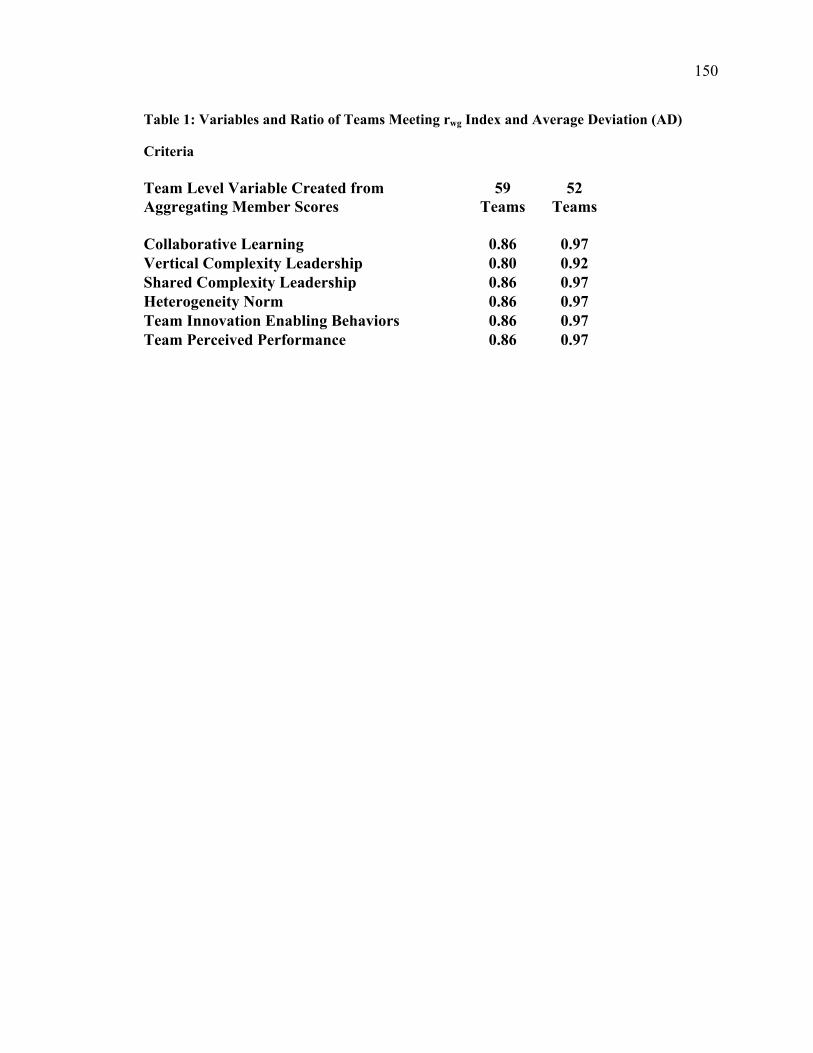
150
Table 1: Variables and Ratio of Teams Meeting rwg Index and Average Deviation (AD)
Criteria Team Level Variable Created from Aggregating Member Scores
59 Teams
52 Teams
Collaborative Learning 0.86 0.97 Vertical Complexity Leadership 0.80 0.92 Shared Complexity Leadership 0.86 0.97 Heterogeneity Norm 0.86 0.97 Team Innovation Enabling Behaviors 0.86 0.97 Team Perceived Performance 0.86 0.97
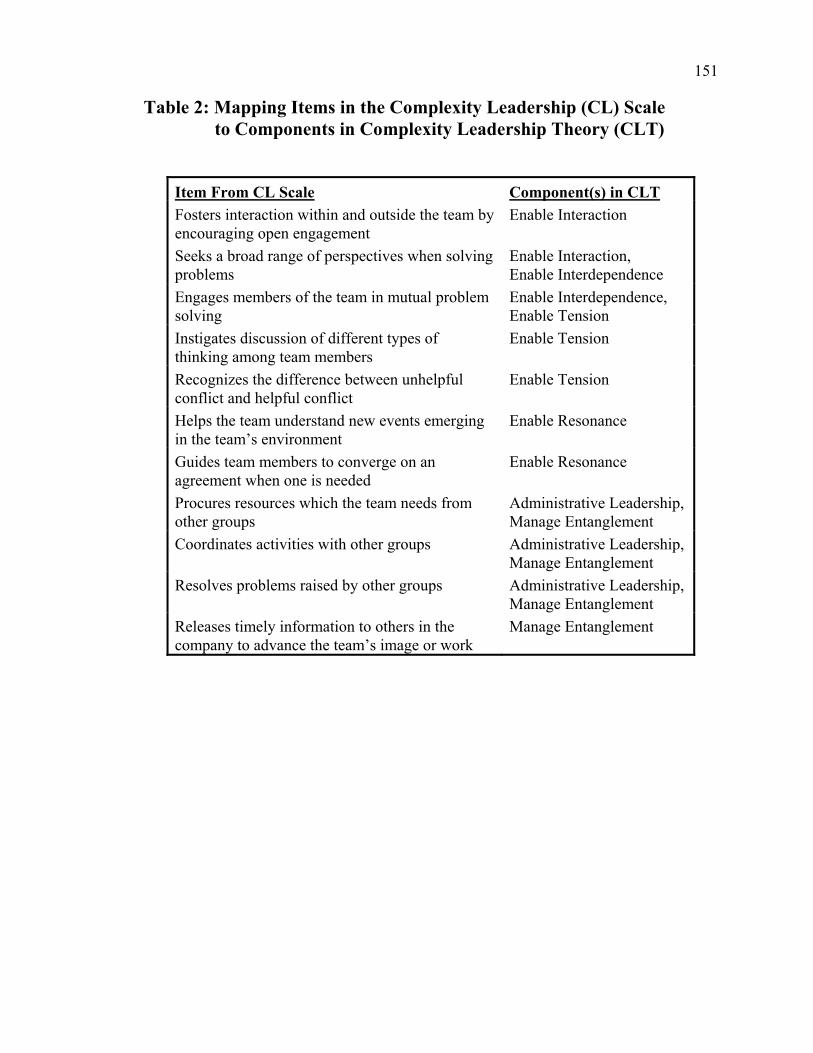
151
Table 2: Mapping Items in the Complexity Leadership (CL) Scale to Components in Complexity Leadership Theory (CLT)
Item From CL Scale Component(s) in CLT
Fosters interaction within and outside the team by encouraging open engagement
Enable Interaction
Seeks a broad range of perspectives when solving problems
Enable Interaction, Enable Interdependence
Engages members of the team in mutual problem solving
Enable Interdependence, Enable Tension
Instigates discussion of different types of thinking among team members
Enable Tension
Recognizes the difference between unhelpful conflict and helpful conflict
Enable Tension
Helps the team understand new events emerging in the team’s environment
Enable Resonance
Guides team members to converge on an agreement when one is needed
Enable Resonance
Procures resources which the team needs from other groups
Administrative Leadership, Manage Entanglement
Coordinates activities with other groups Administrative Leadership, Manage Entanglement
Resolves problems raised by other groups Administrative Leadership, Manage Entanglement
Releases timely information to others in the company to advance the team’s image or work
Manage Entanglement
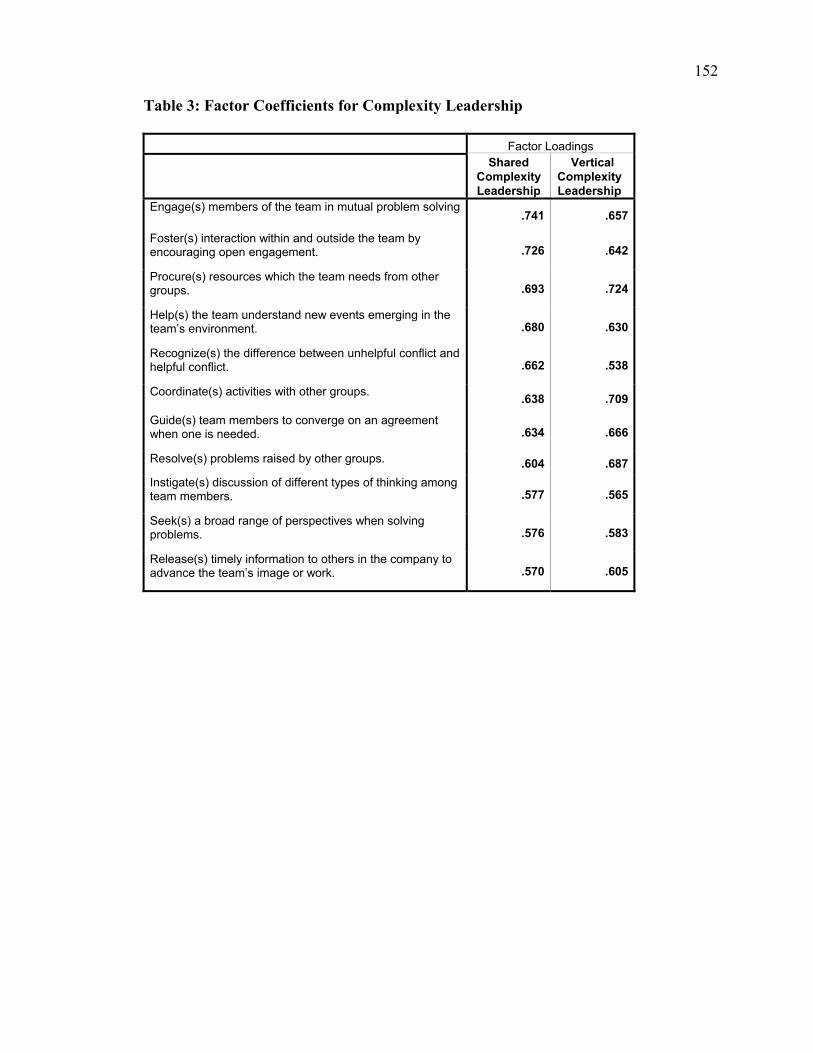
152
Table 3: Factor Coefficients for Complexity Leadership
Factor Loadings
Shared Complexity Leadership
Vertical Complexity Leadership
Engage(s) members of the team in mutual problem solving .741 .657
Foster(s) interaction within and outside the team by encouraging open engagement. .726 .642
Procure(s) resources which the team needs from other groups. .693 .724
Help(s) the team understand new events emerging in the team’s environment. .680 .630
Recognize(s) the difference between unhelpful conflict and helpful conflict. .662 .538
Coordinate(s) activities with other groups. .638 .709
Guide(s) team members to converge on an agreement when one is needed. .634 .666
Resolve(s) problems raised by other groups. .604 .687
Instigate(s) discussion of different types of thinking among team members. .577 .565
Seek(s) a broad range of perspectives when solving problems. .576 .583
Release(s) timely information to others in the company to advance the team’s image or work. .570 .605

153
Table 4: Factor Coefficients for Collaborative Learning and Heterogeneity Norm
Factor ID: Collaborative Learning = 1 Heterogeneity Norm = 2
Factor Loadings
1 2 Everyone takes time to make sure the whole team learns together. .863 .105
Our team takes time for everyone to get up to speed on difficult concepts. .853 .131
This team takes the time to have members learn each other’s perspectives. .795 .278
When things change, members of this team make adjustments they know will help the other members of the team.
.586 .490
This team knows when it’s time to let disagreements be aired. .547 .394
Reversed: The differences on this team seem to keep us from performing at our maximum effectiveness. -.074 .753
This team believes different viewpoints add value. .353 .695
The differences on this team help us achieve the team’s goals. .274 .679
Reversed: People on this team sometimes reject others for being different. .289 .670
Team members actively share their special knowledge and expertise with one another. .470 .552
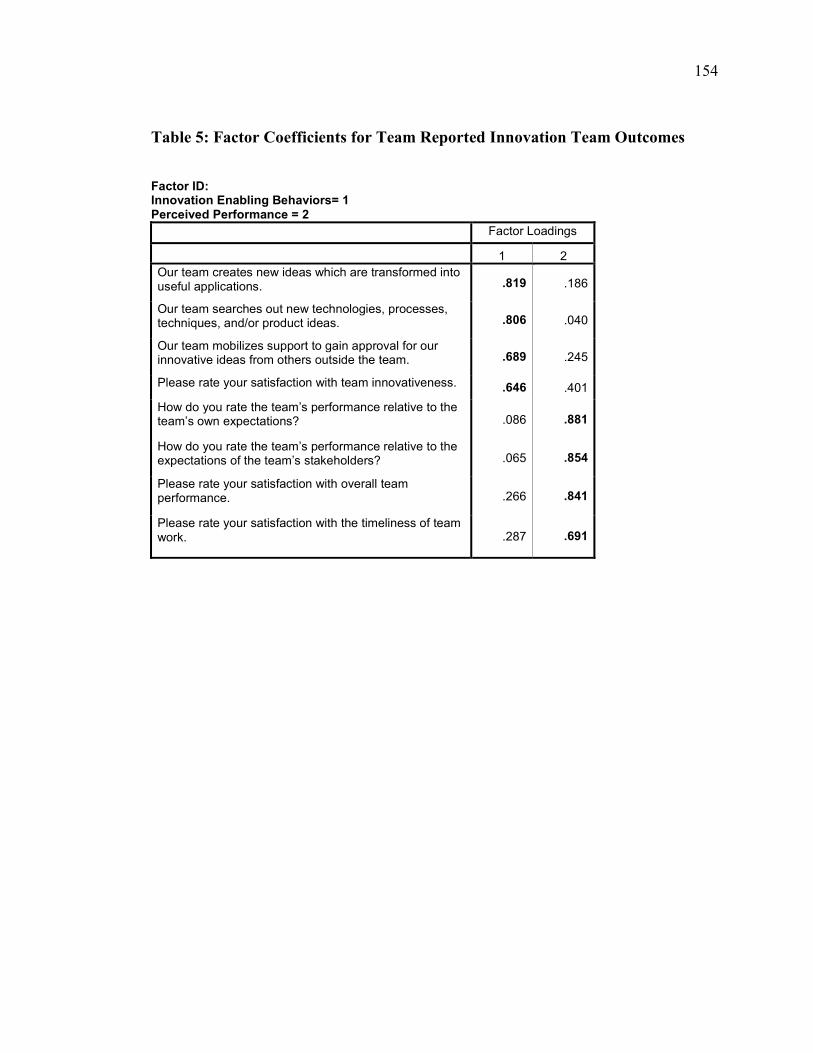
154
Table 5: Factor Coefficients for Team Reported Innovation Team Outcomes
Factor ID: Innovation Enabling Behaviors= 1 Perceived Performance = 2
Factor Loadings
1 2 Our team creates new ideas which are transformed into useful applications. .819 .186
Our team searches out new technologies, processes, techniques, and/or product ideas. .806 .040
Our team mobilizes support to gain approval for our innovative ideas from others outside the team. .689 .245
Please rate your satisfaction with team innovativeness. .646 .401
How do you rate the team’s performance relative to the team’s own expectations? .086 .881
How do you rate the team’s performance relative to the expectations of the team’s stakeholders? .065 .854
Please rate your satisfaction with overall team performance. .266 .841
Please rate your satisfaction with the timeliness of team work. .287 .691

155
Table 6: Factor Coefficients for Stakeholder Reported Innovation Team Outcomes Factor ID: Innovation Enabling Behaviors = 1 Perceived Performance = 2 Factor Loadings
1 2 This team mobilizes support to gain approval for its innovative ideas from others outside the team. .831 .091
This team creates new ideas which are transformed into useful applications. .822 .105
This team searches out new technologies, processes, techniques, and/or product ideas. .789 .263
Please rate your satisfaction with team innovativeness. .691 .325
This team will continue to receive support and resources for its work. .288 .826
This team is on track to realize the outcomes we expect from the innovation on which this team is working. -.126 .805
Team’s performance compared to other innovation teams in your company. .479 .677
Please rate your satisfaction with overall team performance. .434 .640
Team’s performance compared to your expectations for the team .573 .634

156
Table 7: Factor Coefficients of Five Factor Structure Produced by Oblique Rotation Factor ID: Collaborative Learning = 1 Shared Complexity Leadership = 2 Innovation Enabling Behaviors = 3 Perceived Performance = 4 Heterogeneity Norm = 5
Component
1 2 3 4 5
Our team takes time for everyone to get up to speed on difficult concepts. .793 .074 .036 .061 .028 Everyone takes time to make sure the whole team learns together. .775 .107 .091 .052 -.022This team takes the time to have members learn each other’s perspectives. .602 .048 .069 .307 .099
This team knows when it’s time to let disagreements be aired. .530 .026 .145 -.043 .271
Engage(s) members of the team in mutual problem solving. .060 .754 -.008 .020 .019Foster(s) interaction within and outside the team by encouraging open engagement.
-.024 .702 .024 .031 .152
Procure(s) resources which the team needs from other groups. -.107 .684 -.005 .124 -.006Release(s) timely information to others in the company to advance the team’s image or work.
-.214 .662 .136 .065 -.018
Help(s) the team understand new events emerging in the team’s environment.
.239 .653 -.102 .102 -.127
Instigate(s) discussion of different types of thinking among team members. .181 .648 .004 -.067 -.045Guide(s) team members to converge on an agreement when one is needed.
.200 .624 .089 -.181 .004
Coordinate(s) activities with other groups. -.110 .623 -.061 .015 .205Resolve(s) problems raised by other groups. -.088 .603 .135 .139 -.017Recognize(s) the difference between unhelpful conflict and helpful conflict. .184 .593 .098 -.058 -.039Seek(s) a broad range of perspectives when solving problems. .164 .473 .026 .070 .185
How do you rate the team’s performance relative to the team’s own expectations?
-.042 -.050 .954 -.012 -.029
How do you rate the team’s performance relative to the expectations of the team’s stakeholders? .023 -.040 .904 -.014 -.065
Overall team performance .039 .096 .762 .028 .073Timeliness of team work .040 .157 .575 .012 .089
Our team searches out new technologies, processes, techniques, and/or product ideas.
-.013 .022 -.094 .898 .014
Our team creates new ideas which are transformed into useful applications. .013 .006 .080 .865 .014
Team innovativeness .014 .127 .295 .541 .069Our team mobilizes support to gain approval for our innovative ideas from others outside the team. .383 .079 .007 .506 .011
Reversed: The differences on this team seem to keep us from performing at our maximum effectiveness.
-.141 .001 -.055 -.046 .830
Reversed: People on this team sometimes reject others for being different. .211 .089 -.020 -.044 .646This team believes different viewpoints add value. .155 -.026 .124 .186 .582The differences on this team help us achieve the team’s goals. .011 .016 .224 .150 .516Team members actively share their special knowledge and expertise with one another. .184 .134 .078 .192 .419
When things change, members of this team make adjustments they know will help the other members of the team.
.280 .079 .294 .114 .305
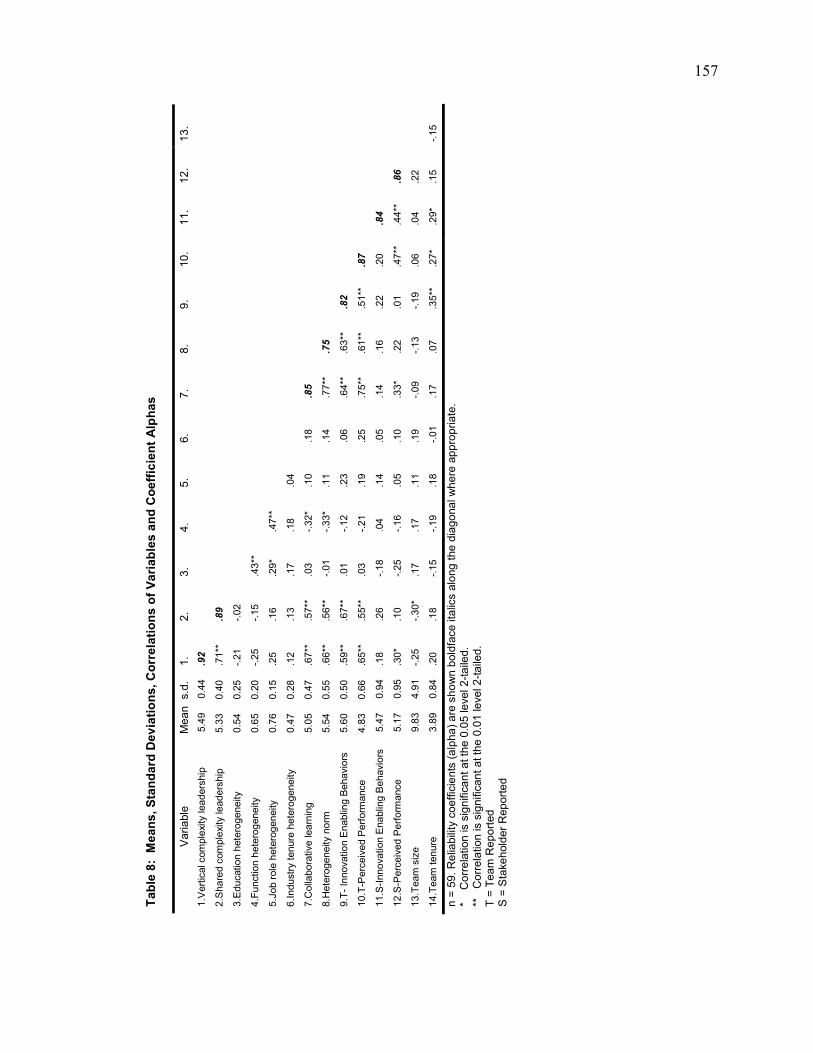
157
Tab
le 8
: M
ean
s, S
tan
da
rd D
evia
tio
ns
, C
orr
elat
ion
s o
f V
ari
able
sa
nd
Co
eff
icie
nt
Alp
has
Var
iabl
e
Me
an
s.d
. 1.
2
. 3
. 4
. 5
. 6.
7
. 8
. 9
. 10
. 1
1.
12
. 1
3.
1.V
ertic
al c
ompl
exi
ty le
ad
ersh
ip
5.4
9 0
.44
.92
2.S
hare
d co
mpl
exity
lead
ersh
ip
5.33
0.
40
.71*
* .8
9
3.E
duca
tion
hete
roge
neity
0.
54
0.25
-.
21
-.02
4.F
unct
ion
hete
roge
neity
0.
65
0.20
-.
25
-.15
.4
3**
5.Jo
b ro
le h
eter
ogen
eity
0.
76
0.15
.2
5 .1
6 .2
9*
.47*
*
6.In
dust
ry t
enur
e he
tero
gene
ity
0.47
0.
28
.12
.13
.17
.18
.04
7.C
olla
bora
tive
lear
ning
5.
05
0.47
.6
7**
.57*
* .0
3 -.
32*
.10
.18
.85
8.H
eter
ogen
eity
nor
m
5.
54
0.55
.6
6**
.56*
* -.
01
-.33
* .1
1 .1
4 .7
7**
.75
9.T
- In
nova
tion
Ena
blin
g B
ehav
iors
5.
60
0.50
.5
9**
.67*
* .0
1 -.
12
.23
.06
.64*
* .6
3**
.82
10.T
-Per
ceiv
ed P
erfo
rman
ce
4.83
0.
66
.65*
* .5
5**
.03
-.21
.1
9 .2
5 .7
5**
.61*
* .5
1**
.87
11
.S-I
nno
vatio
n E
nabl
ing
Beh
avio
rs
5.4
7 0
.94
.18
.2
6 -.
18
.04
.1
4 .0
5
.14
.16
.2
2
.20
.8
4
12.S
-Per
ceiv
ed P
erfo
rman
ce
5.17
0.
95
.30*
.1
0 -.
25
-.1
6 .0
5 .1
0
.33*
.2
2
.01
.4
7**
.4
4**
.86
13.T
eam
siz
e 9.
83
4.91
-.
25
-.30
* .1
7 .1
7 .1
1 .1
9 -.
09
-.13
-.
19
.06
.04
.22
14.T
eam
tenu
re
3.89
0.
84
.20
.18
-.15
-.
19
.18
-.01
.1
7 .0
7 .3
5**
.27*
.2
9*
.15
-.15
n =
59.
Re
liabi
lity
coef
ficie
nts
(alp
ha
) a
re s
ho
wn
bol
dfa
ce it
alic
s al
ong
the
dia
go
nal w
he
re a
ppro
pria
te.
*
Co
rre
latio
n is
sig
nifi
can
t at t
he
0.0
5 le
vel 2
-ta
iled
. **
C
orre
latio
n is
sig
nifi
can
t at t
he
0.0
1 le
vel 2
-ta
iled
. T
= T
ea
m R
epo
rted
S
= S
take
hol
de
r R
epor
ted

158
Table 9: Results of Standardized Regression Analysis of Complexity Leadership’s Effects
Variable
Team – Innovation Enabling Behaviors
Team - Perceived
Performance
Stakeholder- Innovation Enabling Behaviors
Stakeholder - Perceived
Performance
Step 1: Controls
Team size -.137 .102 .086 .246 t
Team tenure .331* .288* .305* .188
Adjusted R2 .112* .051 t .060 t .048 t
Step 2: Main effect - vertical
Team size -.018 .253* .120 .325*
Team tenure .246* .180t .281* .131
Vertical complexity leadership .533** .675** .150 .353**
Adjusted R2 .469** .417** .064 t .151**
∆ in adjusted R2 .357** .367** .004 t .103**
Step 3: Main effect - shared
Team size .042 .269* .158 .290*
Team tenure .245* .208 t .271* .167
Shared complexity leadership .640** .598** .255 t .157
Adjusted R2 .481** .370** .104* .054
∆ in adjusted R2 .369** .319** .044* .006
Step 4: Main effects - both
Team size .047 .284** .156 .304*
Team tenure .232* .173 t .273* .135
Vertical complexity leadership .190 .509** -.041 .461*
Shared complexity leadership .509** .247 t .283 -.161
Adjusted R2 .490** .494** .088 t .149*
∆ in adjusted R2 .378** .443** .028 t .101*
n = 59. Standardized coefficients (β) are reported. t p < 0.10 level 2-tailed; * p < 0.05 level 2-tailed; ** p < 0.01 level 2-tailed

159
Table 10: Results of Standardized Regression Analysis of Collaborative Learning’s Effects
Variable
Team – Innovation Enabling Behaviors
Team - Perceived
Performance
Stakeholder- Innovation Enabling
Behaviors
Stakeholder - Perceived
Performance
Step 1: Controls
Team size -.137 .102 .086 .246 t
Team tenure .331* .288* .305* .188
Adjusted R2 .112* .051 t .060 t .048 t
Step 2: Main effect
Team size -.018 .253* .093 .267*
Team tenure .246* .180t .288* .134
Collaborative learning .592** .738** .101 .327*
Adjusted R2 .454** .586** .053 .140*
∆ in adjusted R2 .235** .312** -.007 .092*
n = 59. Standardized coefficients (β) are reported. t p < 0.10 level 2-tailed; * p < 0.05 level 2-tailed ; ** p < 0.01 level 2-tailed

160
Table 11: Collaborative Learning as Mediator of Complexity Leadership’s Influence on Innovation Team Outcomes Baron & Kenny Mediation Test Bootstrapping Test_ IV - Distribution of Complexity
Leadership
DV
Innovation Performance1
IV β Direct Effects
IV β Post-mediation
Mediator β Collaborative
Learning
Z-Score Statistic
Probability Two-tailed
Vertical T – Innovation Enabling Behaviors
.533** .229 t .445** 3.101 .002
Vertical T - Perceived Performance
. .675** .309* .537** 4.138 .000
Vertical S - Innovation Enabling Behaviors
.150 .144 .008 NA NA
Vertical S - Perceived Performance
.353** .232 .175 1.353 .176
Shared T - Innovation Enabling Behaviors
.640** .430** .362** 2.973 .003
Shared T - Perceived Performance
.598** .249* .604** 4.032 .000
Shared S - I Innovation Enabling Behaviors
.255 t .285 t -.052 NA NA
Shared S - Perceived Performance
.157 .048 .352* 2.235 .018
n = 59. Standardized coefficients (β) are reported. t p < 0.10 level 2-tailed; * p < 0.05 level 2-tailed ; ** p < 0.01 level 2-tailed 1 T = Team Reported; S = Stakeholder Reported

161
Table 12: Results of Standardized Regression Analysis of Vertical Complexity Leadership’s Moderation of Job Relevant Heterogeneity
Variable
Team - Innovation Enabling
Behaviors
Team - Perceived
Performance
Stakeholder-innovation Enabling
Behaviors
Stakeholder - Perceived
Performance
Step 1: Controls Team size -.137 .102 .086 .246 t Team tenure .331* .288* .305* .188 Adjusted R2 .112* .051 t .060 t .048 t Step 2: Main effects Team size -.179 .048 .083 .267 Team tenure .240 t .159 .275 t .090 Job role heterogeneity .298* .318* .091 .158 Industry tenure heterogeneity .108 .285** .046 .119 Function heterogeneity -.242 -.422** .127 -.166 Education heterogeneity .082 .085 -.241 -.279 t Adjusted R2 .135* .181* .048 .094 t ∆ in adjusted R2 .023* .130* -.012 .046 t Step 3: Moderator Team size -.029 .224* .122 .346* Team tenure .268* .192 t .283* .105 Job role heterogeneity -.011 -.044 .011 -.005 Industry tenure heterogeneity -.043 .107 .006 .039 Function heterogeneity .010 -.126 .193 -.033 Education heterogeneity .190 .211 t -.213 -.222 Vertical complexity leadership .577** .677* .149 .304 t Adjusted R2 .356** .491** .045 .142* ∆ in adjusted R2 .244** .440** -.015 .096* Step 4: Interactions Team size .010 .244* .118 .316* Team tenure .228 t .206 t .313* .173 Job role heterogeneity .053 -.043 -.098 -.043 Industry tenure heterogeneity .006 .119 -.044 .002 Function heterogeneity .101 -.167 .274 -.185 Education heterogeneity .057 .202 -.257 -.065 Vertical complexity leadership .568** .685** .148 .344* Job role heterogeneity X vertical complexity leadership
.122 -.008 .162 -.106
Industry tenure heterogeneity X vertical complexity leadership
.152 .079 -.166 -.178
Function heterogeneity X vertical complexity leadership
-.259 .100 -.092 .396*
Education heterogeneity X vertical complexity leadership
-.047 .019 .182 -.047
Adjusted R2 .384** .467** .031 .201* ∆ in adjusted R2 .272** .416** -.029 .153*
n = 59. Standardized coefficients (β) are reported. t p < 0.10 level 2-tailed; * p < 0.05 level 2-tailed; ** p < 0.01 level 2-tailed
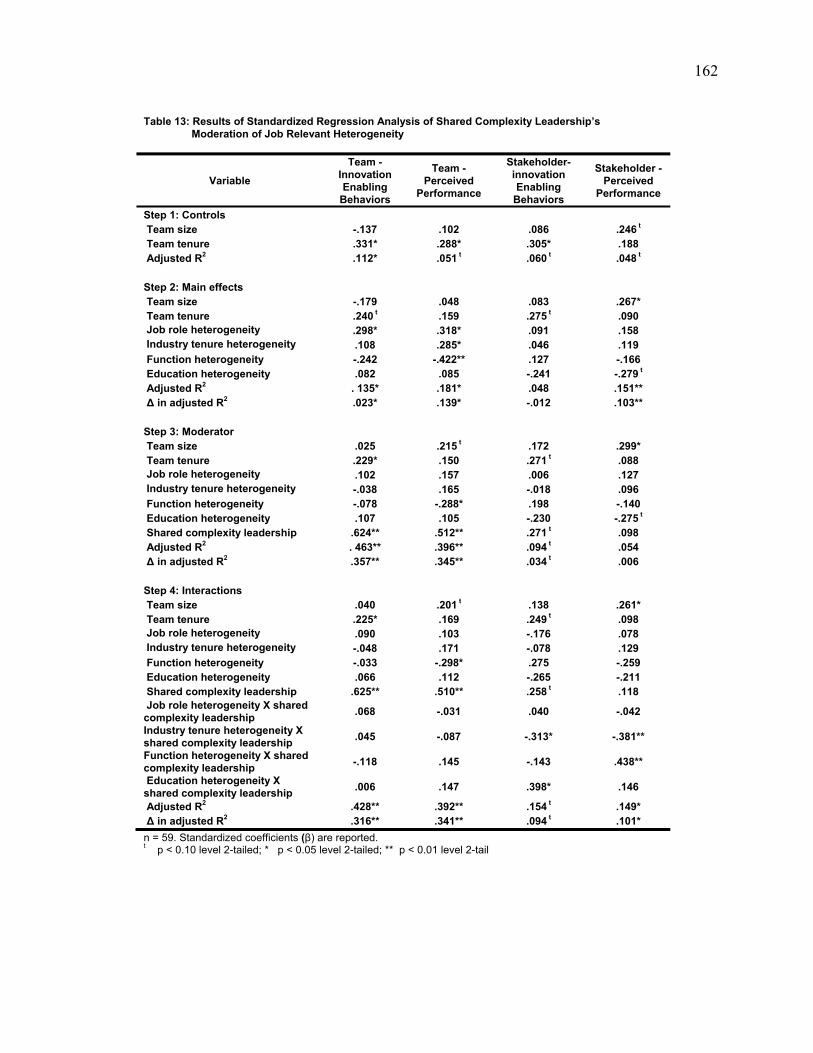
162
Table 13: Results of Standardized Regression Analysis of Shared Complexity Leadership’s Moderation of Job Relevant Heterogeneity
Variable
Team - Innovation Enabling
Behaviors
Team - Perceived
Performance
Stakeholder-innovation Enabling
Behaviors
Stakeholder - Perceived
Performance
Step 1: Controls Team size -.137 .102 .086 .246 t Team tenure .331* .288* .305* .188 Adjusted R2 .112* .051 t .060 t .048 t Step 2: Main effects Team size -.179 .048 .083 .267* Team tenure .240 t .159 .275 t .090 Job role heterogeneity .298* .318* .091 .158 Industry tenure heterogeneity .108 .285* .046 .119 Function heterogeneity -.242 -.422** .127 -.166 Education heterogeneity .082 .085 -.241 -.279 t Adjusted R2 . 135* .181* .048 .151** ∆ in adjusted R2 .023* .139* -.012 .103** Step 3: Moderator Team size .025 .215 t .172 .299* Team tenure .229* .150 .271 t .088 Job role heterogeneity .102 .157 .006 .127 Industry tenure heterogeneity -.038 .165 -.018 .096 Function heterogeneity -.078 -.288* .198 -.140 Education heterogeneity .107 .105 -.230 -.275 t Shared complexity leadership .624** .512** .271 t .098 Adjusted R2 . 463** .396** .094 t .054 ∆ in adjusted R2 .357** .345** .034 t .006 Step 4: Interactions Team size .040 .201 t .138 .261* Team tenure .225* .169 .249 t .098 Job role heterogeneity .090 .103 -.176 .078 Industry tenure heterogeneity -.048 .171 -.078 .129 Function heterogeneity -.033 -.298* .275 -.259 Education heterogeneity .066 .112 -.265 -.211 Shared complexity leadership .625** .510** .258 t .118 Job role heterogeneity X shared complexity leadership
.068 -.031 .040 -.042
Industry tenure heterogeneity X shared complexity leadership
.045 -.087 -.313* -.381**
Function heterogeneity X shared complexity leadership -.118 .145 -.143 .438**
Education heterogeneity X shared complexity leadership
.006 .147 .398* .146
Adjusted R2 .428** .392** .154 t .149* ∆ in adjusted R2 .316** .341** .094 t .101*
n = 59. Standardized coefficients (β) are reported. t p < 0.10 level 2-tailed; * p < 0.05 level 2-tailed; ** p < 0.01 level 2-tail
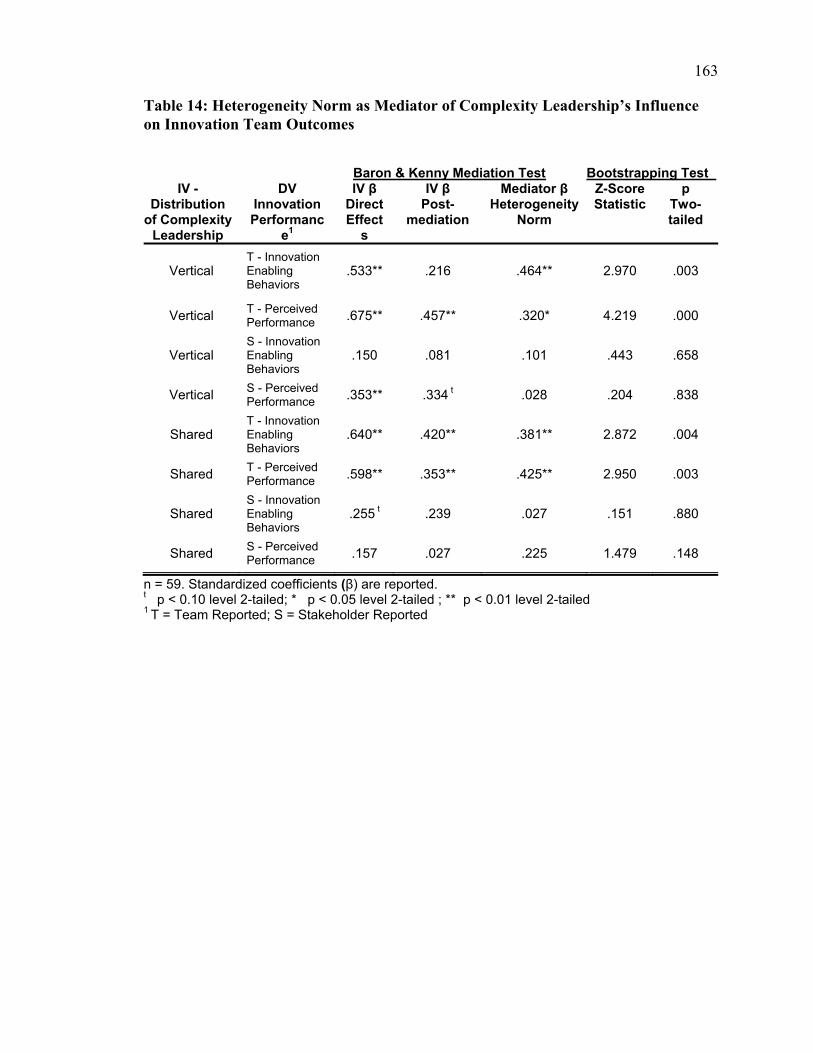
163
Table 14: Heterogeneity Norm as Mediator of Complexity Leadership’s Influence on Innovation Team Outcomes
Baron & Kenny Mediation Test Bootstrapping Test_
IV - Distribution
of Complexity Leadership
DV
Innovation Performanc
e1
IV β Direct Effect
s
IV β Post-
mediation
Mediator β Heterogeneity
Norm
Z-Score Statistic
p Two-tailed
Vertical T - Innovation Enabling Behaviors
.533** .216 .464** 2.970 .003
Vertical T - Perceived Performance .675** .457** .320* 4.219 .000
Vertical S - Innovation Enabling Behaviors
.150 .081 .101 .443 .658
Vertical S - Perceived Performance .353** .334 t .028 .204 .838
Shared T - Innovation Enabling Behaviors
.640** .420** .381** 2.872 .004
Shared T - Perceived Performance .598** .353** .425** 2.950 .003
Shared S - Innovation Enabling Behaviors
.255 t .239 .027 .151 .880
Shared S - Perceived Performance .157 .027 .225 1.479 .148
n = 59. Standardized coefficients (β) are reported. t p < 0.10 level 2-tailed; * p < 0.05 level 2-tailed ; ** p < 0.01 level 2-tailed 1 T = Team Reported; S = Stakeholder Reported
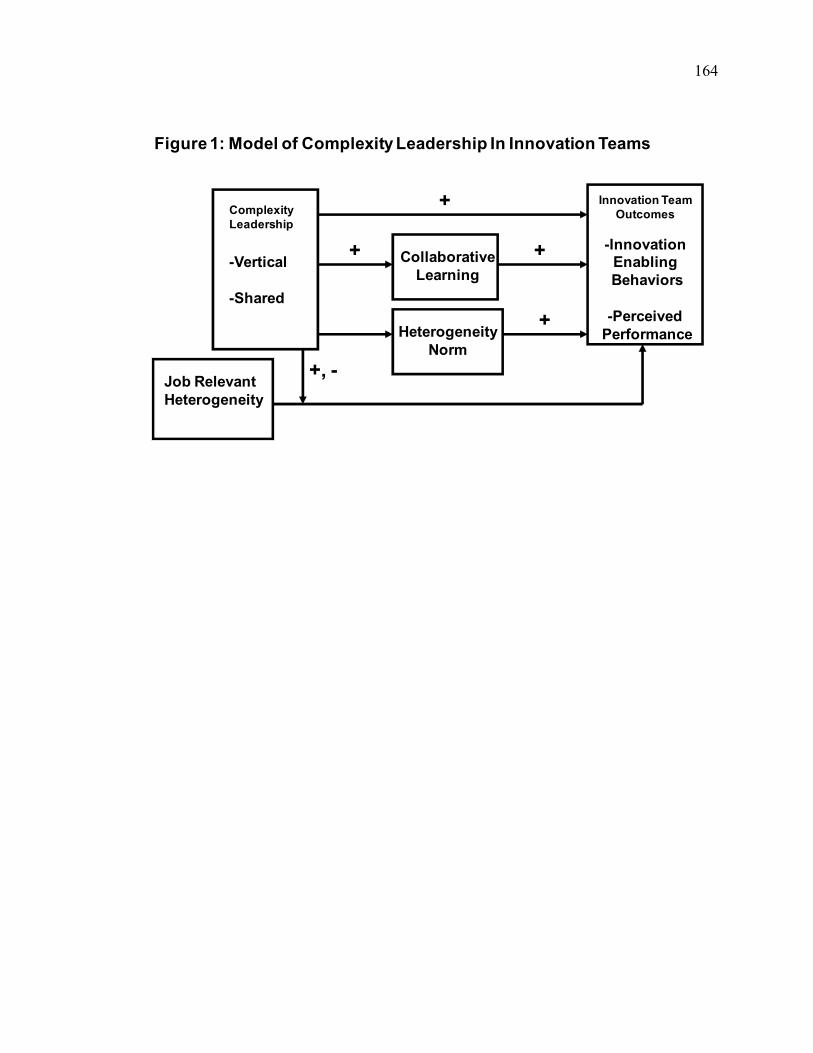
164
Figure 1: Model of Complexity Leadership In Innovation Teams
CollaborativeLearning
Job Relevant Heterogeneity
Innovation Team Outcomes
-Innovation EnablingBehaviors
-PerceivedPerformanceHeterogeneity
Norm
Complexity Leadership
-Vertical
-Shared
+
+ +
+
+, -

165
Figure 2: Study Model and Hypotheses
CollaborativeLearning
Job Relevant Heterogeneity
Innovation Team Outcomes
-Innovation EnablingBehaviors
-PerceivedPerformanceHeterogeneity
Norm
H.1
H.2a
H.4
H.3
Complexity Leadership
-Vertical
-Shared
H.2b, c

166
Figure 3: Moderation of the Effect of Function Heterogeneity on Stakeholder Perceived Performance by Vertical Complexity Leadership Stakeholder - Perceived Performance
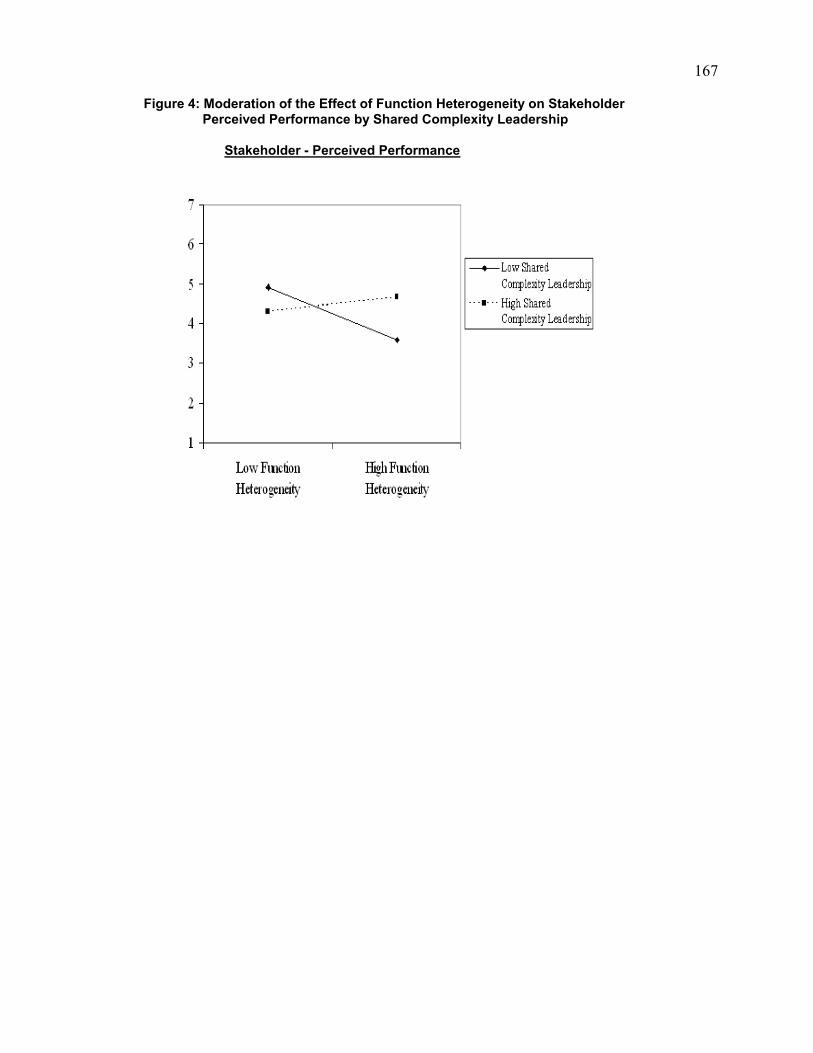
167
Figure 4: Moderation of the Effect of Function Heterogeneity on Stakeholder Perceived Performance by Shared Complexity Leadership Stakeholder - Perceived Performance
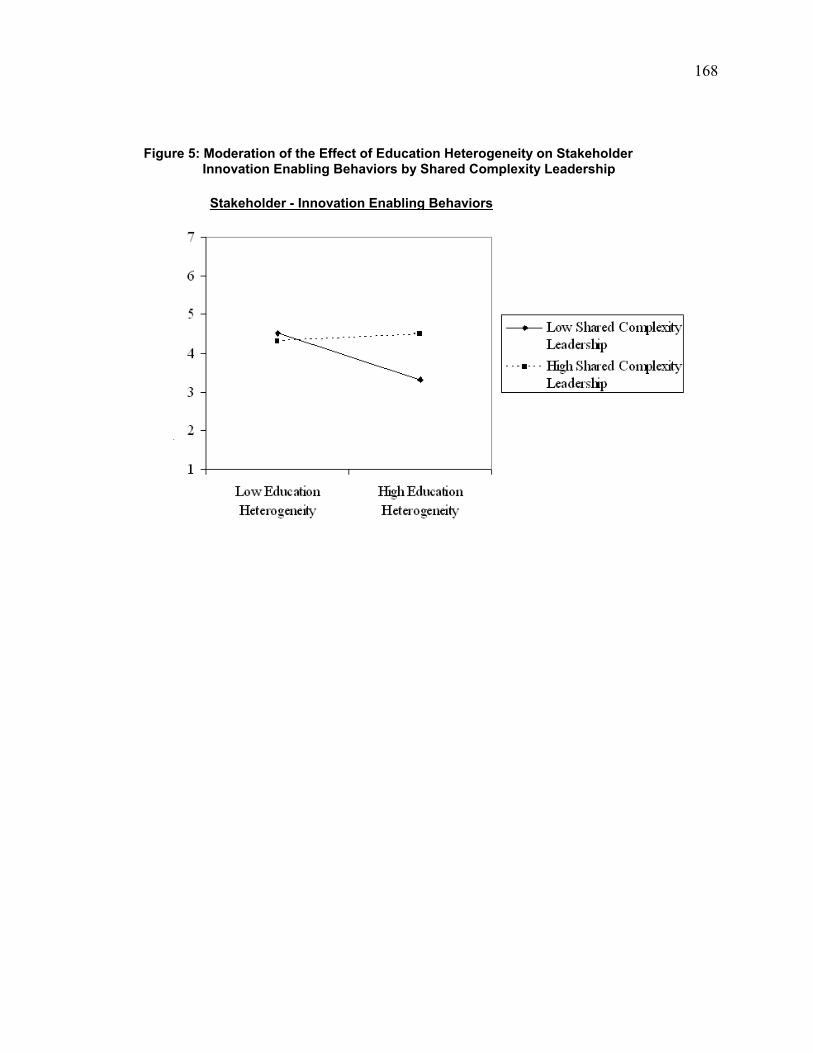
168
Figure 5: Moderation of the Effect of Education Heterogeneity on Stakeholder Innovation Enabling Behaviors by Shared Complexity Leadership Stakeholder - Innovation Enabling Behaviors
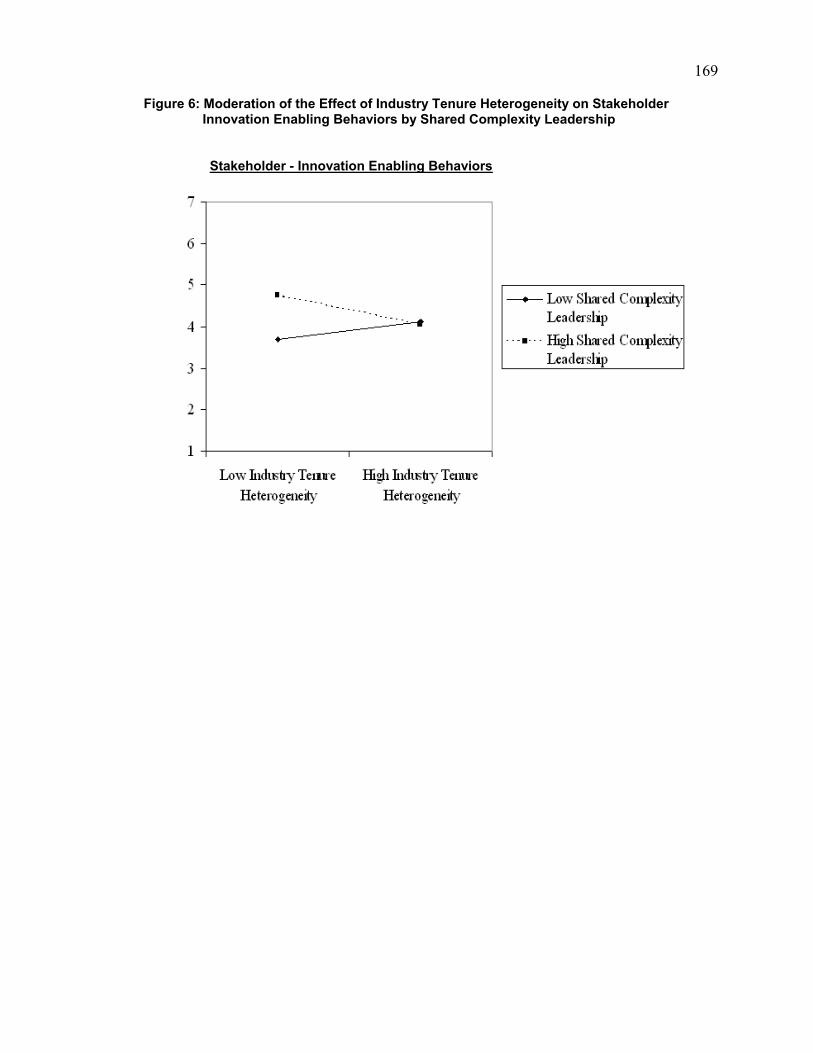
169
Figure 6: Moderation of the Effect of Industry Tenure Heterogeneity on Stakeholder Innovation Enabling Behaviors by Shared Complexity Leadership Stakeholder - Innovation Enabling Behaviors

170
Figure 7: Moderation of the Effect of Industry Tenure Heterogeneity on Stakeholder Perceived Performance by Shared Complexity Leadership Stakeholder - Perceived Performance

171
Figure 8: Summary of Model Findings
CollaborativeLearning
Job Relevant Heterogeneity
HeterogeneityNorm
H.1
H.2a
H.4
H.3
H.2b, c
Complexity Leadership
-Vertical
-Shared
Innovation Team Outcomes
-Innovation EnablingBehaviors
-PerceivedPerformance
LegendSupport Some Support Very Limited Support
172
VITA
EMILIO DELIA
1946 Born December 26 in Newark, NJ 1964 Graduate from St. Benedict’s Prep, Newark, NJ 1969 B.A. in Theology, St. Peter’s College, Jersey City, NJ 1969-1970 Teacher, Bruce Street School for Deaf Children, Newark, NJ 1970-1972 Counselor, Mount Carmel Guild, Newark, NJ 1972-1976 Computer Systems Analyst, Prudential Financial, Roseland, NJ 1976-1998 Vice President of Services and Strategy, AT&T Co., Basking Ridge, NJ 1983-1985 MBA, Finance Concentration, Rutgers Business School, Newark, NJ 1998-2010 Executive Coach, Truid, LLC, Newfoundland, NJ 2004 From Competition to Cooperation, Coauthor E. Fredericks, IUniverse 2005-2010 Studies for Ph.D in Management, Rutgers Business School, Newark NJ 2006 Instructor, MBA Executive Leadership Course, Rutgers Business School 2007-2008 President, Educated Search Inc., Las Vegas, NV 2011 Ph.D. in Management, Rutgers Business School, Newark, NJ