a farm gate-to-consumer value chain analysis of the maize ...
95
MSU Agricultural Economics Web Site: http://www.aec.msu.edu MSU Food Security Group Web Site: http://www.aec.msu.edu/fs2/index.htm MSU is an affirmative-action, equal-opportunity employer MSU International Development Working Paper No. 111 January 2011 A FARM GATE-TO-CONSUMER VALUE CHAIN ANALYSIS OF KENYA’S MAIZE MARKETING SYSTEM by Lilian Kirimi, Nicholas Sitko, T.S. Jayne, Francis Karin, Milu Muyanga, Megan Sheahan, James Flock, and Gilbert Bor Department of Agricultural, Food, and Resource Economics Department of Economics MICHIGAN STATE UNIVERSITY East Lansing, Michigan 48824 MSU International Development Working Paper
-
Upload
nguyendung -
Category
Documents
-
view
217 -
download
1
Transcript of a farm gate-to-consumer value chain analysis of the maize ...

MSU Agricultural Economics Web Site: http://www.aec.msu.edu
MSU Food Security Group Web Site: http://www.aec.msu.edu/fs2/index.htm
MSU is an affirmative-action, equal-opportunity employer
MSU International
Development
Working Paper No. 111
January 2011
A FARM GATE-TO-CONSUMER VALUE CHAIN
ANALYSIS OF KENYA’S MAIZE MARKETING
SYSTEM
by
Lilian Kirimi, Nicholas Sitko, T.S. Jayne, Francis Karin, Milu
Muyanga, Megan Sheahan, James Flock, and Gilbert Bor
by
Author
Department of Agricultural, Food, and Resource Economics
Department of Economics
MICHIGAN STATE UNIVERSITY
East Lansing, Michigan 48824
MSU International Development Working Paper

MSU INTERNATIONAL DEVELOPMENT PAPERS
The Michigan State University (MSU) International Development Paper series is designed to
further the comparative analysis of international development activities in Africa, Latin
America, Asia, and the Near East. The papers report research findings on historical, as well
as contemporary, international development problems. The series includes papers on a wide
range of topics, such as alternative rural development strategies; nonfarm employment and
small-scale industry; housing and construction; farming and marketing systems; food and
nutrition policy analysis; economics of rice production in West Africa; technological change,
employment, and income distribution; computer techniques for farm and marketing surveys;
farming systems and food security research.
The papers are aimed at teachers, researchers, policy makers, donor agencies, and
international development practitioners. Selected papers will be translated into French,
Spanish, or other languages.
Copies of all MSU International Development Papers, Working Papers, and Policy Syntheses
are freely downloadable in pdf format from the following Web sites:
MSU International Development Papers
http://www.aec.msu.edu/fs2/papers/idp.htm
http://ideas.repec.org/s/ags/mididp.html
MSU International Development Working Papers
http://www.aec.msu.edu/fs2/papers/idwp.htm
http://ideas.repec.org/s/ags/midiwp.html
MSU International Development Policy Syntheses
http://www.aec.msu.edu/fs2/psynindx.htm
http://ideas.repec.org/s/ags/midips.html
Copies of all MSU International Development publications are also submitted to the USAID
Development Experience Clearing House (DEC) at: http://dec.usaid.gov/

A FARM GATE-TO-CONSUMER VALUE CHAIN ANALYSIS OF
KENYA’S MAIZE MARKETING SYSTEM
by
Lilian Kirimi, Nicholas Sitko, T.S. Jayne, Francis Karin, Milu Muyanga,
Megan Sheahan, James Flock, and Gilbert Bor
January 2011
This study represents a joint collaboration between the Tegemeo Institute of Egerton
University, ACDI-VOCA, Moi University, and Michigan State University. The study is
funded by the Bill and Melinda Gates Foundation under the Guiding Investments in
Sustainable Agricultural Markets (GISAMA) Initiative.
Kirimi is a research fellow at the Tegemeo Institute. Sitko and Jayne are research fellow and
Professor, International Development, respectively, at Michigan State University (MSU).
Karin is a senior research assistant at Tegemeo Institute. Muyanga is a research fellow at
Tegemeo Institute. Sheahan is a graduate research assistant at MSU. Flock is an analyst with
ACDI-VOCA, and Bor is a senior lecturer at Moi University.

ii
ISSN 0731-3483
© All rights reserved by Michigan State University, 2011.
Michigan State University agrees to and does hereby grant to the United States Government a
royalty-free, non-exclusive and irrevocable license throughout the world to use, duplicate,
disclose, or dispose of this publication in any manner and for any purposes and to permit
others to do so.
Published by the Department of Agricultural, Food, and Resource Economics and the
Department of Economics, Michigan State University, East Lansing, Michigan 48824-1039,
U.S.A.

iii
ACKNOWLEDGMENTS
This study was made possible by a grant from the Bill and Melinda Gates Foundation to
Michigan State University, which partnered with Egerton University‘s Tegemeo Institute of
Agricultural Policy and Development in carrying out this study. Partners in research and
logistical support also include ACDI/VOCA, the Kenyan Ministry of Agriculture, and Moi
University. The study builds on over 10 years of investment in longitudinal rural household
survey data implemented and managed by the Tegemeo Institute and funded by
USAID/Kenya.
The study has also benefited from information provided by Joshua Ariga, Sophie Walker,
Steve Collins, and many representatives of government and private firms involved in Kenya‘s
maize value chain. The authors also wish to thank Patricia Johannes for her editorial and
formatting assistance. The views expressed in this document are exclusively those of the
authors, and do not necessarily reflect the views of any organization involved in carrying out
the study.


v
EXECUTIVE SUMMARY
A. Background
Maize is the most important staple food in Kenyans‘ diets, providing roughly a third of the
caloric intake for Kenya‘s population. Maize is also the central crop in Kenyan agriculture,
being grown by 98% of Kenya‘s 3.5 million smallholder farmers.
Maize marketing and trade policy in Kenya has been dominated by two major challenges.
The first challenge concerns the classic food price dilemma: how to keep farm prices high
enough to provide production incentives for farmers while at the same time keeping them low
enough to ensure poor consumers‘ access to food. The second major challenge has been how
to effectively deal with food price instability, which is frequently identified as a major
impediment to smallholder productivity growth and food security. In attempting to cope with
these interrelated challenges, policymakers have grappled with issues of the appropriate role
of the state in marketing and pricing, and the extent to which variable import tariffs and trade
controls can promote the achievement of national policy objectives.
A third and as yet inadequately appreciated maize policy challenge, one that is facing the
agricultural sector more generally, is the growing problem of access to land and the shrinking
size of smallholder farms. Partly as a result of declining landholding sizes in Kenya, most
rural farm households have become net buyers of maize. The potential for transforming
smallholder farmers from maize buyers into surplus producers is becoming increasingly
difficult as population growth and land pressures continue unabated. Over half of the
smallholder farms in Kenya are less than 1.5 hectares. In this context, a major, yet
underappreciated, agricultural policy issue is how to achieve broad-based smallholder-led
agricultural growth under conditions of increasingly acute land pressures. Identifying the
appropriate role and potential of maize intensification in densely populated rural areas is
needed to address this important policy question.
B. Objectives
Developing appropriate maize marketing and trade policies in the context of a growing
structural deficit in maize and ever shrinking smallholder farm sizes requires a detailed
understanding of the structure and performance of Kenya‘s maize value chain.
Understanding how the value chain has developed in turn requires an understanding of the
market liberalization process in Kenya, as this has been the major policy thrust affecting the
industry over the past 20 years. This study is a follow-up to the Tegemeo study of Kenya‘s
maize value chain carried out in the late 1990s by Nyoro, Kiiru, and Jayne (1999). This study,
conducted in 2009, describes the operation of Kenya‘s maize value chain two decades after
the liberalization process began. A broader objective of the study is to provide a full picture
of Kenya‘s maize value chain from the farm gate to the retailing of maize meal to consumers;
to assess the competitiveness of maize markets in Kenya; to identify major trends in maize
prices, maize meal prices, and marketing margins charged at various stages of the system;
and to identify actions by the public sector to overcome production and marketing problems
and support the Kenyan government‘s national policy objectives of food security and
smallholder-led development.

vi
C. Main Findings at the Farm Level of the Value Chain
1. Land fragmentation and decreasing land-size holdings: One of the major findings of the
study concerns farm structure. Most of Kenya‘s smallholder farmers reside in increasingly
densely populated rural areas facing major land pressures. Balanced panel data from four
survey years (1997, 2000, 2004, and 2007) show that farm sizes in Kenya declined by 15%
over the 10-year panel period. About one-third of the smallholder farms nationwide are less
than 1.0 hectares in size. There is very little scope for increasing farm production based on
increasing the amount of land in smallholder farming areas. Even with major improvements
in the performance of the maize value chain, a large percentage of smallholders will continue
to be unable to produce a maize surplus that would enable them to link to markets. As rural
populations continue to grow (albeit at a slower rate than in earlier decades), access to quality
farm land is going to increasingly be a problem that will preclude many rural households
from participating as sellers in grain markets, unless there is tremendous growth in food crop
yields.
2. A relative decline in the importance of maize as a share of gross farm revenue: Balanced
panel data show that households produced roughly the same quantity of maize in each of the
four survey years (1997, 2000, 2004, and 2007). Because the inflation-adjusted value per unit
of maize declined over this 10-year period, the real value of production declined. The
proportion of households selling maize increased from 35% of households in 1996/97 to 49%
in 2006/07. The increased proportion of households selling maize may be partially due to a
major rise in the use of fertilizer on maize over the 1997-2007 period, which has contributed
to maize productivity gains; 54% of households used fertilizer on maize in 1997 compared to
70% in 2007. Yet the total quantity of maize sales declined by 12% over the same period.
This suggests that though a larger fraction of households is selling maize the mean quantities
sold per selling household is declining.
3. High degree of differentiation and market concentration within the smallholder sector:
Smallholder households included in the nationwide survey can be divided into three groups:
(i) the largest smallholder sellers of maize who accounted for 50% of the total marketed
maize output; (ii) the remaining households that sold maize during the year who accounted
for the other 50% of the marketed output; and (iii) those households that sold no maize during
the 12-month marketing season. Data show that 2% of the farms account for 50% of the
overall marketed maize surplus from the smallholder sector. These farm households appear to
enjoy substantially higher welfare levels, in terms of asset holdings, crop income, and non-
farm income, than the rest of the rural population. The relatively elite smallholder farmers
had roughly 2 to 6 times as much land and productive assets as the non-selling households, 6
to 9 times more gross revenue from the sale of all crops, and 5 to 7 times as much total
household income. This concentration of surplus production and marketing by a relatively
few farmers is one of the most important points to be borne in mind when thinking about the
effects of policy instruments designed to alter the mean level of food prices. At least in the
short run, policies that put upward pressure on maize prices benefit only a small minority of
producers, while directly hurting the majority.
4. Evidence of the importance of marketing training on farm income: The prices received by
farmers selling maize in the same month and in the same village show a high degree of
variability. This variation suggests that marketing savvy – the ability of farmers to negotiate
prices and identify buyers – plays a significant role in their ability to obtain remunerative
prices for their maize. Marketing savvy is shown to be enhanced through market skills
training. Based on price data collected from participants in ACDI/VOCA‘s Kenya Maize

vii
Development Program (KMDP) and from nearby villages where training was not
administered we find that KMDP recipients received 9.9% higher prices on average (22.1
shillings vs. 20.1 shillings per kg). To examine the training effect more precisely, we
regressed these prices on a training dummy variable, distance of the household to the nearest
market town and a village dummy to capture spatial price differences. OLS results indicate
that the KMDP recipients received, on average, 1.8 shillings per kg more than non-recipients
did (a 9.2% price difference), significant at the 5% level.
D. Main Findings at the Middle Levels of the Value Chain
1. Kenya’s introduction into the East African Community has resulted in an improvement in
the regional trade policy environment. Since January 2005, regional maize trade between
Uganda, Tanzania, and Kenya has not been subjected to any taxation by the Kenyan
government with the exception of a 2.75% inspection fee. A reduction in regional trade
barriers is very much in Kenya‘s interests because the country is a food importer and it can
generally procure maize more cheaply from its regional neighbors than it can from the world
market.
2. With the exception of the 2008-09 crisis period, grain-marketing policies in Kenya have
become more stable over time. The NCPB‘s role in the market has become more clear and
truncated especially since the National Rainbow Coalition (NARC) government took power
in 2002. A major source of uncertainty continues to revolve around the timing of changes in
import tariff rates, which remain highly unpredictable.
3. The structure of Kenya’s maize market and the relative importance of its various actors
change significantly depending on national production levels: In a normal or good year,
domestic production from small- and large-scale farmers forms the major source of domestic
supply. Smallholder maize sales go largely to small-scale assemblers or brokers, who collect
and bulk for onward sale to large wholesalers. Large-scale millers are the next major link in
the chain, buying grain primarily from the large wholesalers, the NCPB, and from smaller
traders. The large millers sell mainly to a decentralized system of informal retailers (street
kiosks, dukas, multipurpose retail shops, and traditional retail markets) and to a lesser extent
to the more high-end consumers who shop at supermarkets. Posho millers who operate in
retail markets are important players in some areas. Consumers buy grain and pay a fee to
custom-mill their grain into posho meal. This option provides the means to produce maize
meal relatively inexpensively and is preferred by the urban poor and most rural households,
especially in the western parts of the country.
In a year when the main harvest in Western Kenya is poor, the country is more reliant on
imports. If supplies can be imported from Uganda and Tanzania, this tends to be the first
option pursued by wholesalers and millers because (since January 2005) there are no import
restrictions or barriers except for the 2.75% import inspection fee and transport costs, which
are relatively low. However, if the required quantities cannot be obtained from the region,
Kenya then becomes dependent on the world market. It is at this point that Kenyan
wholesalers and millers lobby for a waiver of the 50% duty on maize imported through
Mombasa port. In years when imports constitute a major share of the marketed supplies, the
structure of the maize value chain changes considerably. The most significant change is that
the marketing channels become more concentrated and less competitive. Import contracts
through Mombasa tend to be large volume orders placed by large millers, wholesalers, and
the NCPB. Small-scale assemblers, itinerant traders, and small millers in the informal
marketing channels are less active in drought years because they depend almost totally on

viii
small-scale farmers for their supplies, most of whom have little to sell during drought years.
With grain being scarce in local informal markets during such years, consumers are
increasingly dependent on the large-scale millers (who obtain their supplies from world
markets or from the NCPB) for their maize meal. Without competition from the informal
milling and retailing sector, large-scale millers and retailers are able to raise their margins,
which is economically damaging for poor consumers.
4. Evidence of growing investment in private sector grain assembly and improvements in
grain marketing conditions for farmers: Farmer focus group discussions (33) and individual
interviews with surplus producing farmers (450) indicate that small-scale farmers have a
variety of potential markets through which to sell maize. Of the available options, small-scale
assemblers operating at the village level are shown to be the most important market channel
utilized by small-scale farmers. One of the most important findings is that in virtually all
villages chosen for farmer focus group discussions, including both accessible and
inaccessible areas, the response to the question "how many traders came into this village to
purchase maize from farmers in this village" was almost always more than 10. Overall, the
most commonly cited number of traders was 100, with about 27% of the responses indicating
a number between 15 and 30 and 42% quoting a figure of 50-100. With this many traders
purchasing maize in each village, the assembly traders are apparently pushing much deeper
into rural areas than the conventional wisdom would indicate. It shows the extent to which
the first stage in the system (farmer-assembly trader/first buyer) has developed and become
competitive over the years. The growing density of maize assemblers also reflects an increase
in the participation of the private sector in the maize trade following liberalization.
Data on the mean distance from the farmers‘ farms to the point of sale of maize also suggests
an expansion of private sector maize assembly. Among those farmers interviewed, the mean
distance travelled to their initial point of sale was 1.85 km, with 73.1% of the farmers selling
their maize at the farm-gate. Therefore, the majority of the traders transact with farmers for
grain right in the villages. These results closely mirror the findings based on the 10-year
Tegemeo panel data on 1,267 smallholder households to monitor changes in their access to
markets and services. Their results showed that between 1997 and 2007, the mean distance
from the farm to point of sale of maize declined from 0.9km to 0.5km. This represents a 43%
reduction in distance, and reflects an increased density of grain traders in rural areas. Their
study also shows that while in 1997, 90% of the households traveled 3.5km or less to the
point of maize sale, by 2007, 90% of the households traveled 2 km or less. This reduction in
distance to the point of maize sale again suggests that over time maize assembly traders are
penetrating deeper into the rural areas and buying maize directly in the villages, and may
reflect a growing density of maize traders.
Overall, these results suggest that over the years, there has been greater investment in private
grain trading, particularly at the assembly level. Additionally, given the high number of
traders operating in the village, these findings imply that access to markets may no longer be
defined in terms of distance to point of sale, but rather in terms of the ability of farmers to
obtain and negotiate for a remunerative price.
5. As a result of the expansion of private sector marketing options, farmers generally feel
that the maize marketing system has improved. Farmers in the 41 focus groups were asked to
indicate how the current maize marketing conditions compare to those existing 10 years ago.
Nearly 70% of the responses from the FGDs indicated that the marketing conditions had
improved, with little variation in terms of responses across the districts.

ix
6. Decreasing importance of NCPB as a market option for farmers: The study found that the
National Cereals and Produce Board purchases a relatively small proportion of maize
produced by smallholder farmers. Roughly 3% of the 1,275 farm households contained in the
Tegemeo Rural Surveys sold maize to NCPB. Nevertheless, the NCPB appears to play an
important role in the market by purchasing large volumes from large-scale farmers and from
smallholders in a few major surplus zones such as Trans Nzoia and Uasin Gishu. NCPB tends
to increase its purchases in a good production season and reduce its purchases in a poor
season to stabilize maize prices (Jayne, Myers, and Nyoro 2008).
7. The performance of the assembly sector of the value chain is highly dependent on the
functioning of downstream actors in the value chain, particularly the wholesale sector: The
primary market for maize assemblers in Kenya is the wholesaling sector. Fifty-nine percent
of the assembler traders interviewed for this report do not store any of the grain they purchase
from farmers. The majority of the assembler traders sell quickly to wholesalers bulking up
grain in the district towns. They do this mainly due to liquidity constraints: after exhausting
their limited working capital buying maize, they cannot buy more until they sell their grain to
obtain more working capital. Wholesalers are therefore instrumental for the viability of these
assembly traders, because they provide the means for assemblers to quickly sell and obtain
fresh working capital to go back into the hinterland and buy more maize from farmers.
Without the wholesalers, assembly traders could spend weeks or months with their working
capital tied up while waiting for the marketing board or another buyer to pay them.
8. Medium-scale wholesalers play a vital role in Kenya’s maize market by exploiting spatial
arbitrage opportunities: In Kenya, where harvest periods vary by region and many major
consumption centers are far removed from production areas, spatial arbitrage is critical for
mitigating grain price volatility. Wholesalers in Kenya perform this function by acquiring
maize from primary assemblers in surplus areas and quickly transporting it deficit regions or
to large-scale grain processors. Wholesalers also play a critical role during major deficit
years, by acquiring informally imported maize from Uganda and Tanzania, as well as
formally imported maize in Mombasa, and bringing it to retail markets in deficit regions.
9. Limited transportation capacity in the country limits the efficiency of maize markets
during major import periods: One of the primary bottlenecks to maize imports during high
import periods like that experienced in 2009 is transport access from the warehouses in
Mombasa to Nairobi. When imports are concentrated within a short period when the import
tariff on maize is waived, the demand for transport can outstrip supply, contributing to maize
shortages in inland areas and maize prices rising well over the cost of importation. If
imported maize requirements could be spaced over a longer period by waiving the import
tariff earlier, this would relieve transport capacity constraints and reduce the likelihood of
shortages in upland markets.
10. Contrary to the perceived wisdom that a lack of adequate storage facilities limits the
ability of farmers, traders, and processors to store grain, we find that limited storage is not
due to insufficient storage facilities but is primarily caused by disincentives for traders to
store grain. The study found an apparent contradiction of very little seasonal storage
occurring despite a great deal of storage space in the country available for rent. Interviews
with traders indicate that the problem is not inadequate storage facilities but inadequate
incentives to store due to very high risks, constraints on borrowing capital (again related to
high risks as perceived by banks and other lenders), and the features of the East African grain
market in which supplies from Uganda, Tanzania, and indeed parts of Kenya are coming on
the market at various times of the year, which can put downward pressure on prices and

x
hence affect the returns to storage. Certain behaviors by the government, most notably the
sudden changes in the import tariff rates on maize imports through Mombasa as well as
sudden changes in the NCPB‘s maize selling price, exacerbate the risks of storing grain.
These disincentives to storage contribute to a circuitous flow of maize out of surplus areas
during harvest periods, only to move back in once deficits set in. More generally, the
disincentives for traders to store grain tends to depress prices right after harvest and (because
relatively little is stored through the season) less is available for consumption later in the
season which raises prices more during these periods. In order to drive down the price of
maize grain and meal to rural and urban consumers, there is a need to address the
disincentives to on-farm and trader storage.
E. Main Findings at the Consumer Level of the Value Chain
1. Consumer data indicates the growing importance of wheat in consumers‘ diets,
particularly among more affluent consumers: The importance of maize in urban staple grain
diet is shown to have declined by 22% from 58% share in staple food in 1995 to 45% in
2003. Maize accounted for 59 and 38% of the staple carbohydrate consumption among the
20% poorest and richest households, respectively. Therefore, maize still remained the
dominant staple food among the urban poor. However, the richer urban households who are
in the top 40% of the income distribution consumed more wheat than maize. Over time, the
consumption of wheat products had grown, particularly among these higher income groups,
with its share rising by 17% from 25% in 1995 to 31% in 2003. In addition, among the urban
respondents, wheat consumption accounted for 22 and 38% of the staple food consumption of
the 20% poorest and richest households, respectively. By 2003, wheat was the dominant
staple in terms of expenditure, accounting for 43.5% of total expenditures on the main staples
compared to 32.4% of maize‘s contribution, which had declined from 41.8% in 1995.
However, expenditures on maize products exceeded those on wheat only for households in
the bottom two-income quintiles (40% of the poorest households in Nairobi), but wheat
dominated expenditures for the top three income quintiles.
2. Market channels for acquiring maize vary across income groups: The consumption of
posho meal has declined in Kenya, but remains very important for relatively poorer
households. This was attributed to a decline in the price difference between sifted meal and
posho meal perhaps resulting from greater competition in the milling sector due to the maize
market liberalization. The liberalization of the maize market led to the development of many
small-scale posho mills which provided great competition for the large-scale millers. In
response to this, the large millers reduced the degree of flour refinement in order to cut down
their costs. Consequently, the prices of maize meal have declined, thus reducing the price
difference between the posho and sifted meal. This shift in maize meal consumption patterns
may have led to a decline in the market share of the posho millers, which was high in the
period immediately following liberalization.
The majority of the households (64%) in the poorest income quintile prefer duka/shops,
spending Ksh105 million in a month on this channel (Table 18). Open markets are the next
most important means by which the poorest consumers obtain staple products, accounting for
14% of their expenditures. Among the second poorest income group, the most important
retail outlets are dukas/shops, roadside kiosks, small supermarkets, and markets. Only among
the top income quintile did national supermarkets account for more than 20% of total
expenditures on the main staple food products. Among this relatively wealthy group,

xi
duka/shops accounted for 38% of expenditures on the top four staples, while the national
supermarkets accounted for 37%.
F. Main Findings Regarding Maize Prices and Market Margins
1. Price margins at multiple stages of the value chain are low and declining: Low price
margins signal that farmers are receiving a higher proportion of the final consumer price of
maize meal over time. We also find that consumers are benefiting from lower retail maize
meal prices. Between the early 1990s and 2008, the kilograms of maize grain and meal that
was affordable with a daily wage has been rising steadily for the various employment sectors
for which data is available. Low marketing margins at this stage in the value chain suggest
competition among grain assembly traders in rural areas, a point corroborated through farmer
focus group discussions.
2. Spatial price margins between surplus and deficit regions are also low. Wholesale prices
in surplus areas are in the range of 90-95% of the prices in the main deficit market of Nairobi.
The remaining 5-10% is the portion of the wholesale maize price extracted by traders and
transporters between surplus areas and Nairobi.
3. Finally, the price margins between wholesale grain and retail maize meal have declined
significantly. After adjusting for inflation, there has been a highly statistically significant
decline in maize milling and retailing margins by Ksh 0.068 per kg per month between 1994
and 2008, or roughly Ksh 12,000 per ton (roughly US$180) over this 15-year period. The
reason for the decline in milling and retailing margins over time is associated with a
substantial increase in competition at both the milling and retailing stages of the value chain
in urban Kenya. An increase in the number of millers and retail outlets has forced price
competition to maintain their market share. By putting downward pressure on marketing
margins and retail maize meal prices, maize market liberalization has conferred important
benefits for maize consumers in Kenya.
G. Main Findings Regarding Trade Policy
1. Uncertainty over government behavior with respect to decisions on import tariff rates as
well as the NCPB pricing and marketing operations continue to stifle private investment in
maize markets: Massive food price rises in 2008 were the direct result of a combination of
factor, which can be linked to uncertainty over government intervention in maize markets,
including the role of NCPB in maize imports, delays in the removal of maize tariffs, and
transport bottlenecks between Mombasa and Nairobi. This price rise could have been avoided
if rules governing government intervention in the maize market were clearly spelled out.
H. Conclusions and Implications for Policy
Based on the findings of this study, the following actions are proposed for consideration by
the Government of Kenya:
1. Raise public investment in maize seed breeding and agronomic research to make it
possible for improvements in smallholder crop productivity. Based on research evaluating the
returns to alternative investments in agriculture, public expenditures in maize seed breeding

xii
and agronomy may constitute the single most important investment to promote broad-based
productivity growth and poverty reduction in Kenya.
2. Explore options for improving public and private extension programs to enable farmers to
adopt improved farm technologies generated from point 1.
3. Examine options for bringing more land in Kenya under potential cultivation by
smallholder farmers. Unless the land constraints in currently densely populated rural areas of
Kenya are relieved, it is unlikely that a large portion of farmers in Kenya that own less than
one hectare will be able to rise out of the semi-subsistence conditions that keep them trapped
in poverty.
4. Support training programs to enable smallholders to develop more effective marketing
strategies and to negotiate more effectively with traders, in order to raise the prices that they
receive for their maize.
5. Raise public investment in road, rail, and port infrastructure to reduce marketing costs as
well as the cost of modern inputs such as fertilizer to the farm gate. Rehabilitating the
Kenyan railway system would be a key priority. If this were done prior to 2009, maize
imports could have arrived in greater volumes much faster in early 2009 and pushed food
prices down faster.
6. When early warning estimates predict a need for large import quantities, remove the
import tariff soon enough to allow traders to import over a sufficiently long period to avoid
transport capacity constraints and domestic stockouts.
7. Review the rationale for denying import licenses when applied for by traders.
8. Consider the costs and benefits from the standpoint of governments of transitioning from
discretionary trade and marketing policy to adherence to more systematic rules-based
policies. Nurturing credible commitment in regard to trade policy is likely to promote market
predictability and therefore, lead to greater supplies and price stability in food markets during
times of domestic production shortfalls.
9. Consider whether current proposals for international stockholding would be effective in
the presence of domestic transport capacity constraints. International physical or financial
reserves would not be able to relieve localized food production shortfalls unless local
transport capacity is adequate to absorb sufficient imports within a concentrated period or
unless import licenses are provided or the state carries out or contracts for the importation
from the international stock source.

xiii
TABLE OF CONTENTS
ACKNOWLEDGMENTS ........................................................................................................iii
EXECUTIVE SUMMARY ....................................................................................................... v
LIST OF TABLES ...................................................................................................................xv
LIST OF FIGURES .................................................................................................................xv
ACRONYMS ........................................................................................................................ xvii
1. INTRODUCTION ................................................................................................................ 1
2. ANALYTICAL FRAMEWORK, METHODS, AND DATA .............................................. 3
2.1. Value Chain Analysis .................................................................................................. 3
2.2. Data ............................................................................................................................. 4
2.2.1. Sampling of Farmers and Data Collection Methods ........................................ 5
2.2.2. Sampling Strategies for Primary Assemblers and Data Collection Methods... 7
2.2.3. Sampling Strategies for Maize Wholesalers and Data Collection Methods .... 7
2.2.4. Sampling Strategies for Small-Scale Maize Mills (Hammer Mills) and Data ..
Collection Methods .......................................................................................... 8
2.2.5. Sampling Strategies for Large-Scale Grain Processing and Trading Firms and
Data Collection Methods .................................................................................. 8
3. AN OVERVIEW OF MAIZE MARKETING IN KENYA ................................................. 9
3.1. Main Production and Consumption Patterns and Trends ............................................ 9
3.1.1. Wheat and Rice .............................................................................................. 11
3.1.2. Potatoes and Cooking Bananas ...................................................................... 11
3.2. The Evolution of the Maize Marketing Liberalization Process in Kenya ................. 12
3.2.1. The 2008/09 Food Price Crisis ....................................................................... 17
3.2.2. Cross-Border Maize Trade and Regional Trade Policy ................................. 18
3.2.3. Summary ........................................................................................................ 19
4. ORGANIZATION OF THE MAIZE VALUE CHAIN ..................................................... 21
4.1. Overview of Kenya‘s Maize Value Chain ................................................................ 21
4.2. Farmers ...................................................................................................................... 24
4.2.1. Characteristics of Maize-producing Households ........................................... 24
4.2.2. Net Buyer/net Seller Status of Smallholder Farmers ..................................... 31
4.2.3. Maize Marketing Channels for Farmers......................................................... 33
4.2.4. On-farm Storage Issues .................................................................................. 39
4.2.5. Farmers‘ Perceptions of the Major Problems with Selling Maize ................. 41
4.2.6. Farmers‘ Perceptions of Maize Marketing Conditions and Welfare.............. 41
4.2.7. Access to Market Information ........................................................................ 42
4.3. Assembly Traders ...................................................................................................... 42
4.3.1. Brokers ........................................................................................................... 44
4.3.2. Local Assemblers ........................................................................................... 44
4.3.3. External/itinerant Buyers................................................................................ 45

xiv
4.4. National Cereals and Produce Board (NCPB) .......................................................... 45
4.5. Wholesalers ............................................................................................................... 46
4.5.1. Wholesalers‘ Storage Behavior ...................................................................... 50
4.6. Nyamakima Wholesale Market ................................................................................. 50
4.7. Large-scale Millers .................................................................................................... 51
4.8. Small-scale Posho Millers ......................................................................................... 53
4.9. Consumers ................................................................................................................. 54
4.9.1. Consumers‘ Use of Alternative Marketing Channels for Primary Staple
Products .......................................................................................................... 55
5. MAIZE PRICES AND MARKETING MARGINS ........................................................... 58
5.1. Margins between Farm-gate and Wholesale Maize Grain Prices ............................. 58
5.1.1. Differences in Farm-gate Prices Reported by Farmers .................................. 60
5.2. Margins between Rural Surplus Wholesale and Urban Deficit Wholesale Maize
Prices .......................................................................................................................... 61
5.3. Margins between Maize Grain and Processed Maize Meal ...................................... 62
5.3.1. Summary ........................................................................................................ 64
6. CONCLUSION AND POLICY IMPLICATIONS ............................................................ 65
6.1. Summary of Main Findings ...................................................................................... 65
6.2. Alternative Visions of the Role of Government in Maize Markets .......................... 67
6.2.1. Model 1: State Role Confined to Provision of Public Goods to Strengthen
Markets ........................................................................................................... 68
6.2.2. Model 2: Rules-based State Interventions to Stabilize Market Activity ....... 68
6.2.3. Model 3: Discretionary State Intervention to Provide State with Maximum
Flexibility to Achieve State Policy Objectives .............................................. 68
6.3. Implications for Government Actions to Improve the Performance of Maize Markets
in Kenya .................................................................................................................... 69
6.3.1. Trade Policy Issues......................................................................................... 70
6.3.2. Concrete Guidance ......................................................................................... 72
REFERENCES ........................................................................................................................ 74

xv
LIST OF TABLES
1. Description of Rural Districts and Sample Sizes of Interviewed Marketing Agents .........5
2. Importance of Staple Foods in Diet in Kenya ....................................................................9
3. Production and Trade of Food Staples in Kenya, 2005-2007 ...........................................10
4. NCPB Maize Trading Volumes and Price Setting, 1988/89 to 2009/10 ..........................15
5. Evolution of Maize Market Policy Reforms, 1988-2010 in section 3 ..............................16
6. Production Income Shares in the Small- and Medium-Scale Farming Sector, Kenya,
1,275 Households .............................................................................................................25
7. Farm Production Patterns of Small- and Medium-Scale Agricultural Households in
Kenya – Shillings Reflated to 06/07 real value ................................................................26
8. Contribution to Total Gross Farm Sales Revenue of Selected Enterprises, by Zone
for Different Marketing Years ..........................................................................................28
9. Attributes of Different Categories of Smallholder Farmers According to Maize Sales
Status, for Various Marketing Years (Constant 2007 Kenyan Shillings) .........................30
10. Household Characteristics According to Position in the Maize Market, Nationwide
Sample of Small-scale Households in Kenya, Pooled Data, 1997, 2000, and 2004 ........32
11. Household Maize Market Position for the 2006/2007 Production Season by Agro-
Ecological Zone ................................................................................................................33
12. Frequency of the Type of Buyers Purchasing Maize from Farmers Interviewed in the
Focus Group Discussions (N=450), Stratified by Accessible Vs. Remote Villages ........35
13. Average Price per Kilogram of Maize through Different Market Channels ....................38
14. Mean Maize Selling Price for Farmers Receiving vs. Not Receiving Marketing
Training, Kenya, May/June 2009 .....................................................................................39
15. Proportion of Maize Sold by Wholesalers within and outside the Districts .....................47
16. Percentage of Maize Sales by Medium-scale Wholesalers to Different Buyers by
District ..............................................................................................................................48
17. Percentage of Maize Sales by Medium-scale Wholesalers to Different Buyers from
March-May 2009 ..............................................................................................................49
18. Consumer Expenditures (Ksh Millions) and Market Share (%) of Alternative Retail
Channels for Primary Staple Products (Maize, Wheat, Rice, and Cooking Banana
Products), by Income Group, 2003 ...................................................................................56
LIST OF FIGURES
1. Net Grain Exports, Kenya, 1975-2007 .............................................................................10
2. Nairobi Local and Import Parity Prices, January 2006-August 2009 ...............................17
3. Maize Import Tariff Rate through Mombasa Port, Kenya, 1994-2009 ............................18
4a. Maize Marketing Channel Diagram: Typical Year of Small National Maize
Deficits..............................................................................................................................22
4b. Maize Marketing Channel Diagram: Major National Deficits - Less Typical. ................23
5. Frequency of Maize Traders Operating in the Visited Villages by Accessibility ............36
6. Proportion of Maize Sold to Different Buyers by District ...............................................37
7. Frequency of Maize Prices Received by Farmers in Trans Nzoia District in May
2009 ..................................................................................................................................38
8. Percentage of Farmers Storing Maize for at Least 4-5 Months after Harvest in
Accessible and Inaccessible Villages, 2009 .....................................................................40
9. Alternative Retail Channels for Sifted Maize Meal, 2003 ...............................................56
10. Farm-gate and Wholesale Maize Grain Prices in Eldoret ................................................59

xvi
11. Farm-gate Prices in Accessible Villages in Nakuru District vs. Wholesale
Nakuru ..............................................................................................................................60
12. Farm-gate Prices in Remote Villages in Nakuru District vs. Wholesale Nakuru .............60
13. Farm-gate Prices in Accessible Villages in Trans Nzoia vs. Wholesale Eldoret .............60
14. Farm-gate Prices in Remote Villages in Trans Nzoia vs. Wholesale Eldoret ..................60
15. Wholesale/Farm-gate Prices in Eldoret Compared to Nairobi .........................................62
16. Wholesale/Farm-gate Prices in Nakuru Compared to Nairobi .........................................62
17. Price Trends for Retail Sifted Maize Meal and Wholesale Maize Grain in Nairobi,
Kenya ................................................................................................................................63
18. Trend in the Difference between Maize Wholesale Prices and Sifted Flour Retail
Prices in Nairobi, 1994 to 2008 ........................................................................................63
19. Competing Visions of Staple Food Market Development................................................67

xvii
ACRONYMS
ACDI-VOCA Agricultural Cooperative Development International/Volunteers in Overseas
Cooperative Assistance
AFRICOG African Centre for Open Governance
CMA The Cereal Millers Association
COMESA Common Market for Eastern and Southern Africa
CPI Consumer Price Index
CRF Clean Report of Finding
EAC East African Community
FGDs farmer focus group discussions
GBHL Grain Bulk Handlers Limited
GISAMA Guiding Investments in Sustainable Agricultural Markets Initiative
GoK Government of Kenya
KBS Kenya Bureau of Standards
KMDP Kenya Maize Development Program
Ksh Kenyan Shilling
MOA Ministry of Agriculture
MSU Michigan State University
MT metric tons
NARC National Rainbow Coalition
NCPB National Cereals and Produce Board
NFMP National Food and Nutrition Programme
OLS Ordinary Least Squares
SED Single Entry Document
US$ U.S. Dollars


1
1. INTRODUCTION
Maize is the most important cereal crop in Kenya. It forms an important part of the food and
feed system, and contributes significantly to income generation for rural households. It is the
main staple food for the people of Kenya, providing more than a third of the caloric intake.
Maize is also the primary ingredient used in animal feeds in Kenya, accounting for over 80%
of feed rations. In terms of land usage, maize accounts for about 56% of cultivated land in
Kenya. About 98% of the 3.5 million small-scale farmers in Kenya are engaged in maize
production. The small- and medium-scale sector produces about 75% of the nation‘s maize
crop, while the large-scale sector (farms over 25 acres) produce the other 25%. On average,
in the last five years, 1.8 million hectares are planted to maize annually, with annual
production ranging between 26 and 36 million bags (2.3 and 3.3 million metric tons (MT))
depending on weather and market conditions. National maize consumption is about 37
million bags (2.9 million MT) annually. Shortfalls in production are met through imports
from Uganda, Tanzania, and the world market. Yet, despite the centrality of maize to the
Kenyan food system, the country has for the last several decades been trending toward a
structural deficit in maize. Effectively coping with recurrent maize deficits is critical for
enhancing food security in Kenya and promoting economic growth in the smallholder farmer
sector.
Maize marketing and trade policy in Kenya has been dominated by two major challenges.
The first challenge concerns the classic food price dilemma: how to keep farm prices high
enough to provide production incentives for farmers while at the same time keeping them low
enough to ensure poor consumers‘ access to food. The second major challenge has been how
to effectively deal with food price instability, which is frequently identified as a major
impediment to smallholder productivity growth and food security. In attempting to cope with
these interrelated challenges, policymakers frequently rely on the use of state-run maize
marketing boards to procure and distribute maize, tariffs on maize imports and exports, and
bans on informal cross border trading.
A third and as yet inadequately appreciated maize policy challenge, one that is facing the
agricultural sector more generally, is the growing problem of access to land and the shrinking
size of smallholder farms. Partly because of declining landholding sizes in Kenya, most rural
farm households have become net buyers of maize. The potential for transforming
smallholder farmers from maize buyers into surplus producers is becoming increasingly
difficult as population growth and land pressures continue unabated. Over half of the
smallholder farms in Kenya are less than 1.5 hectares. In this context, a major, yet
underappreciated, agricultural policy issue is how to achieve broad-based smallholder-led
agricultural growth under conditions of increasingly acute land pressures. Identifying the
appropriate role and potential of maize intensification in densely populated rural areas is
needed to address this important policy question.
Developing appropriate marketing policies in the context of a growing structural deficit in
maize and ever shrinking smallholder farm sizes requires a detailed understanding of the
structure and performance of Kenya‘s maize value chain. Understanding how the value chain
has developed in turn requires an understanding of the market liberalization process in
Kenya, as this has been the major policy thrust affecting the industry over the past 20 years.
Kenya‘s maize market liberalization process started in the late 1980s and intensified in the
early 1990s, as a strategy to increase marketing efficiency and stimulate economic growth.
Nearly two decades after the liberalization of maize marketing in Kenya, debate continues
about the extent to which the private sector is meeting the needs of farmers and consumers

2
and the appropriate role of government in the maize market. It was expected that
liberalization would bid up maize producer prices, induce new entry by private traders,
improve smallholders‘ access to markets, and so induce greater production and input
intensification. The removal of maize movement controls during liberalization was expected
to improve trade between surplus and deficit areas, reduce transaction costs, and make maize
more available for purchase across the country with more intra- and inter-regional trade.
Market liberalization was also anticipated to promote competition in trade and milling and
hence reduce marketing margins between retail sifted flour and wholesale maize grain and
between surplus and deficit areas. This study assesses the extent to which these intended
changes have occurred.
This study is a follow-up to the Tegemeo study of the maize value chain in the late 1990s by
Nyoro, Kiiru, and Jayne (1999). This study, conducted in 2009, is intended to provide an
evidence-based description of the operation of the maize marketing system in Kenya two
decades after the liberalization process began. Therefore, the study provides a useful
comparison on the changes identified 10-years earlier by Nyoro, Kiiru, and Jayne (1999) and
informs how the maize marketing system has evolved since that time as the market has been
progressively liberalized.
The broader objective of the study is to provide a full picture of Kenya‘s maize value chain
from the farm gate to the retailing of maize meal to consumers, to assess the competitiveness
of maize markets in Kenya, and to identify actions by the public sector to overcome
production and marketing problems and support the Kenyan government‘s national policy
objectives of food security and smallholder-led development. The specific objectives are to:
1. Undertake a detailed organizational mapping of the maize marketing system and
document how it has changed over time;
2. Identify the structure, behavior, and other key characteristics of the players along the
value chain;
3. Examine trends in maize grain (domestic and import parity) and meal prices in
various markets/towns and marketing margins of chain players;
4. Identify the main barriers to entry and expansion for players at various stages in the
value chain;
5. Assess whether intended changes in the maize marketing system due to liberalization
have occurred; and
6. Consider the policy and programmatic implications for the Government of Kenya.
The remainder of the paper is organized as follows. Section 2 describes the conceptual
framework and data. Section 3 presents an overview of maize production and consumption
trends in Kenya and describes the evolution of the maize marketing liberalization process in
Kenya. Section 4 describes the organization of the maize marketing chain from the farm-gate
to the consumer based on in-depth interviews of marketing participants and surveys on
farmer and consumer behavior. Section 5 analyzes trends in maize prices, farm-gate to
wholesale price spreads, and maize-maize meal marketing margins. Section 6 summarizes the
main findings of the study and their implications for policy actions by government.

3
2. ANALYTICAL FRAMEWORK, METHODS, AND DATA
2.1. Value Chain Analysis
As a product moves from the producer to the consumer, a number of transformations and
transactions take place along a chain of interrelated activities, and value is added successively
at each stage of the chain. The term value chain is used to characterize the set of
interconnected and coordinated links and linkages that take place as a product moves from
the primary production unit to the final consumer. Kaplinsky and Morris (2001) define the
chain as the full range of activities that are required to bring a product from conception,
through the intermediary stages of transformation, delivery to final consumers, and final
disposal after use.
Production, processing, and distribution of agricultural products are increasingly being
organized into value chains, where flows of inputs, products, financial and information
resources take place among farmers, processors, retailers and other economic actors. Value
chains do not evolve in a deterministic process, but adapt and respond to local conditions, the
policy and institutional environment, market power, and consumer preferences, among other
things. Some of these factors shaping value chain evolution may not be optimal from a social
welfare standpoint. The aim of value chain analysis, therefore, is to analyze the organization
and behavior of all the participants in the value chain, to diagnose the constraints and
problems that they face, and to identify public actions that may enhance the performance of
the value chain and contribute to national policy objectives. It is recognized that the meaning
of ―performance‖ and ―national policy objectives‖ may vary, sometimes greatly, among
different groups and stakeholders in society. Strategies and policy changes broadly
considered to promote value chain performance and national policy objectives may adversely
affect some stakeholders. This report identifies particular strategies spelt out in the last
section of this report after consideration of their broad effects on the following national
policy objectives: consumers‘ access to food, national food security, reduced and more stable
consumer prices, increased and more stable farm-gate prices, improvements in smallholder-
farm incomes, and a reduction in the costs incurred by the Government of Kenya in achieving
these objectives.
Value chain analysis recognizes that different arrangements of actors may affect outcomes
along the chain by influencing capabilities and levels of bargaining of the actors. Hence, the
analysis focuses on institutional arrangements that link producers, processors, marketers, and
distributors, recognizing that power differentials among them may influence outcomes along
the chain. The analysis can be useful in:
creating a shared vision among chain participants with regard to challenges and
opportunities, hence facilitating the development of collaborative relationships;
promoting enterprise development;
enhancing food quality and safety;
determining the quantitative measurement of value addition and understanding of the
distribution of returns amongst the various players;
promotion of coordinated linkages among producers, processors and retailers; and
improvement of an individual firm‘s competitive position in the market place.

4
The methodology specifically involves:
Identifying the outline of the chain and the position of the various economic agents
within it–all who contribute to production, transformation and marketing of a specific
product;
Identifying the roles and functions of these agents, including those who perform
multiple roles;
Grouping agents into categories which are homogeneous from the point of view of
economic, technical and/or socio-economic analysis;
Showing interactions among agents;
Quantifying the flows corresponding to the activities of the actors both in physical
and monetary terms;
Mapping key policies and institutions along the value chain that influence the
functioning of the chain; and
Establishing key drivers, trends, and issues affecting the value chain and it actors.
Understanding how the maize sub-sector can become more competitive requires a systemic
view of the markets, and the participants that comprise them. Improving the competitiveness
of the sub-sector in a meaningful way requires a framework that examines the fabric of
relationships between participants in the sub-sector to identify and prioritize the opportunities
and constraints to improving industry competitiveness.
2.2. Data
This study used four kinds of data: (i) interviews of maize assemblers, wholesalers, retailers,
and millers; (ii) farmer focus group discussions in four maize-surplus producing regions and
two maize-deficit regions; (iii) panel data from the Tegemeo Institute/Michigan State
University rural household surveys; and (iv) maize production, consumption, and price
information from the Ministry of Agriculture and Food and Agricultural Organization of the
United Nations.
Regarding data sources (i) and (ii), interviews were conducted in May, June, and September
2009 from a range of actors in the maize marketing system through farmer focus group
discussions and key informant interviews. The data were collected by two separate research
teams and included collaborators from Tegemeo Institute, Michigan State University, Moi
University, and ACDI-VOCA. Research was primarily conducted in six districts: Nakuru,
Trans Nzoia, Kisii, Bomet, Bungoma, and Machakos1. These districts were selected due to
the centrality of maize production as a livelihood strategy to farmers, while also including
both maize surplus and deficit districts. Generally speaking, Machakos and Kisii are maize
deficit regions, while Bomet, Nakuru, Trans Nzoia, and Bungoma tend to be surplus regions.
1 These refer to the larger districts before the creation of new districts.

5
Structured survey instruments were prepared prior to this fieldwork, based on a previous
value chain study conducted in Malawi in October 2008 (following Jayne et al. 2010b).
Separate instruments were prepared for the various key actors in the maize value chain
including farmers, primary assemblers, small- to medium-scale wholesalers, small-scale
maize millers, retailers, and large-scale traders and millers. These survey instruments were
designed to explore, in a rigorous way, the structure, conduct, and behavior of Kenya‘s maize
market. Yet, structured survey instruments often fail to capture the diversity and market
flexibility exhibited by many market actors. For example, many people who act as maize
assemblers during the harvest period become maize retailers, providing maize directly to
local consumers, as scarcities set in. Additionally, due to the agro-ecological variability in
Kenya, many wholesalers and primary assemblers lack a central location from which they
operate. Instead, they continuously move around the country, sourcing maize in surplus areas
and transporting it to deficit areas. Thus, structured questions specific to their home districts
may not be relevant to their operations. Because of this diversity, we combined the structured
survey instruments with semi-structured interviews questions, which seek to explore in detail
the specificity of an individual‘s experiences and business operations.
For the purpose of this study, specific regions/districts within the country were identified
purposively as sites for analysis as shown in Table 1. The criteria for the selection of districts
were the following:
1. Maize is the primary crop grown in local farming systems. This selection criterion
ensured that multiple actors in the value chain, including producers, assemblers, and
wholesalers could be interviewed within a single region; and
2. The major maize surplus-producing districts were purposively selected as well as at
least two deficit districts in each country, to explore variations in the marketing
behavior of actors operating within high surplus and low surplus/deficit regions.
In addition to the research conducted in rural districts, interviews were conducted with key
informants, such as owners of large-scale milling companies, grain trading firms, or
government officials.
2.2.1. Sampling of Farmers and Data Collection Methods
Within each region of analysis, villages were identified and focus group discussions
conducted with farmers using a semi-structured survey instrument. Farmer surveys were
conducted in a focus group format in order to better understand maize marketing issues
within a given region, rather than the experiences of only a few individuals. We hypothesize
that relative isolation from urban markets plays a critical role in farmers‘ ability to participate

6
Table 1. Description of Rural Districts and Sample Sizes of Interviewed Marketing
Agents
Districts covered: 8 Bomet, Bungoma, Kisii, Nakuru, Trans Nzoia,
Siaya, Gem, Machakos
Farmer Focus Group Discussions:
Isolated villages 15
Accessible villages 26
Total 41
Interviewee sample size
Farmers 534
Primary assemblers 46
Wholesalers 36
Small-scale millers 7
Large grain trading / processing firms 8
Source: Tegemeo/Michigan State University Maize Value Chain Survey 2009.
Note: While 41 FGD‘s were carried out in nine districts among 534 small-scale farmers, for the majority of the
subsequent analysis farm-level data collected in Siaya and Gem districts were excluded because of late data
entry and integration with the information from other districts. Therefore, most of the farmer analysis relies on
data collected from 33 villages in six districts with 450 farmers.
in the maize market. To test this hypothesis, we conducted focus group discussions in villages
considered isolated from markets and villages considered accessible to markets. Obviously,
this distinction is open to subjective interpretation. For example, a village located a long
distance (more than 30 km) from a tarmac road may not in fact be isolated if it is still in close
proximity to a rural market that is regularly serviced by transportation services. Villages were
categorized as isolated or accessible based on several criteria: proximity to a rural market
center, distance from tarmac roads, conditions of the roads, the opinion of farmers
interviewed, and the opinion of the district agricultural officer. To assist us in locating
villages that met our sampling criteria, we sought the advice of district agricultural officers.
Additionally, we identified villages with the help of Tegemeo Institute, which has collected
baseline data in several villages within our sample districts since 1997, as well as villages that
are currently enrolled in ACDI-VOCA‘s Kenya Maize Development Program (KMDP).
While purposively sampling villages that have been enrolled in programs designed to
improve farmers‘ knowledge of and performance in maize markets – such as those involved
in the KMDP – makes the data non-random, it does perform an important comparative
function. By sampling villages that have been exposed to marketing programs and nearby
villages with similar characteristics that have not, we are able to measure the impact of these
programs on prices received by farmers for maize. This has implications on possible
recommendations for future interventions. The data contains 17 villages that received training
and 16 nearby villages that did not receive training.
Several sampling criteria informed the villages selected for focus group discussions:
1. villages had to contain a relatively high number of surplus maize producers, in order to
ensure that focus group participants could provide insights into local maize marketing
issues; and

7
2. villages were then stratified based on their relative isolation and accessibility from
regional maize markets. This was done in order to provide empirical data on the
differences in marketing behavior and structure between villages with varying degree
of market accessibility.
Within each village, 10-15 farmers were selected to participate in the focus group discussion.
These farmers were selected because they were self-identified as maize farmers who sold
maize. Farmer surveys were conducted in two parts. The first section involved focus group
discussions. This section sought to explore the conduct and behavior of maize farmers in that
village. In the second section of the farmer survey, focus group participants were surveyed
individually in order to collect specific maize marketing data from farmers. In this case, data
were collected about individual farmer‘s maize sales, timing of these sales, buyer type,
distance traveled to the sales point, and the mode of transport used when applicable.
2.2.2. Sampling Strategies for Primary Assemblers and Data Collection Methods
Primary assemblers represent the next link in the regional maize value chain. By our
definition, primary assemblers are private sector maize buyers who buy the majority of their
stocks directly from farmers. The primary assemblers interviewed for this research were
identified in two ways. First, during the course of the farmer focus group discussions farmers
were asked to identify by name 5-6 primary assemblers who regularly service their village.
Often times, these assemblers were local residents, while in other cases the assemblers lived
outside of the community. Second, assemblers were sampled randomly at rural and peri-
urban market areas or along the side of the road where they were buying maize.
A semi-structured survey instrument was used to collect marketing data from primary
assemblers. This instrument explores the buying and selling practices of primary assemblers,
their relationships with other actors in the value chain, the constraints they face in developing
and expanding their business, and the risks they perceive in the marketing system. In total, 46
primary assemblers were interviewed for this research.
2.2.3. Sampling Strategies for Maize Wholesalers and Data Collection Methods
By our definition, maize wholesalers are private sector maize buyers who buy the majority of
their stocks from primary assemblers. We generally found two different kinds of wholesalers
in the markets, differentiated by their scale: district-level wholesalers vs. large multi-district
and multi-country traders that are discussed in Section 4.5. District-level maize wholesalers
interviewed for this report were identified in several ways. First, several wholesalers were
identified during the course of interviews with large-scale processing and trading firms.
These wholesalers generally source maize in a limited number of districts (they may
primarily operate in one district where they live and have built up close connections with
farmers in this district) and supply maize for the larger trading and processing firms through
formal or informal contracts. Second, district-level wholesalers were identified and
interviewed during regional market days, where truckloads of maize are brought to the
market by wholesalers to be sold to local maize retailers. Third, in some regions wholesalers
own retail shops, from which they conduct their maize trading business. These wholesalers
were identified with the assistance of local community members, such as primary assemblers,
agricultural extension officers, and farmers.

8
Data from district-level wholesalers were collected through semi-structured interviews. These
interviews sought to explore the buying and selling practices of wholesalers, their
relationships with other actors in the marketing chain, the constraints they face in expanding
and maintaining their businesses and the risks they perceive in the maize marketing system.
2.2.4. Sampling Strategies for Small-Scale Maize Mills (Hammer Mills) and Data Collection
Methods
Generally, small-scale hammer mills are local grain processing businesses that provide rural
communities and the urban poor with a means for grinding their own maize stocks. The
small-scale mills interviewed for this report were identified in several ways. First, when
possible mill owners were interviewed following farmer focus group discussions. Second,
mill owners in rural and peri-urban market areas were interviewed. Third, millers in urban
areas, who provide maize milling services to the urban poor, were interviewed where
possible.
Data from hammer mill owners were collected through semi-structured interviews. These
interviews sought to understand the maize acquisition strategies of mill owners, the daily
utilization of milling equipment, the mill‘s storage strategies, the constraints to entering into
and expanding the milling business, and the risks associated with owning and operating a
mill. In total, seven small-scale mills were interviewed for this study.
2.2.5. Sampling Strategies for Large-Scale Grain Processing and Trading Firms and Data
Collection Methods
Large-scale market actors were identified based on our knowledge of the national maize
markets and by other actors in the value chain. Data were collected from eight large-scale
trading companies using semi-structured interview strategies. Interviews were conducted with
either the CEO or CFO of the company. These interviews sought to explore the seasonal
variation in the buying and selling practices of these firms, the relative importance of various
market actors to their maize acquisition strategies, the risks associated with the maize milling
and trading industry, the potential for warehouse receipt systems, and the role of the
government in structuring their business strategies.
This data is supplemented by data from the 10-year panel rural household survey and
monthly price information from the Market Information Research Bureau of the Ministry of
Agriculture and the Ministry of Trade and Industry.

9
3. AN OVERVIEW OF MAIZE MARKETING IN KENYA
3.1. Main Production and Consumption Patterns and Trends
According to FAO Stat (2009), Kenyans consume 2,155 kilocalories of food per day on
average. Of this, 1,183 kilocalories (55%) are in the form of the main staples: maize, wheat,
beans, potatoes, plantains, and rice. Over the last 40 years, caloric intake per person appears
to have been roughly constant over time in Kenya, dipping in the early 1990s but rising
gradually since then.2
Maize is the main staple food in Kenya, accounting for 65% of total staple food caloric intake
and 36% of total food caloric intake (FAO Stat 2009, Table 2).3 The average person
consumes 88 kgs of maize products per year. Wheat is the second most important staple
nationally, accounting for 17% of staple food consumption in Kenya. However, recent urban
consumption surveys indicate that wheat products have overtaken maize in terms of
expenditures in urban areas, and the share of rice in urban food consumption is also rising
(Muyanga et al. 2005).
Maize has inferior good characteristics in the sense that its share in staple food expenditures
is highest among the poor. Maize accounts for nearly 20% of total food expenditures among
the poorest 20% of urban households, declining to 1% of total food expenditures among the
wealthiest 20% (Muyanga et al. 2005).
Beans are the third most important staple food nationally, accounting for 9% of staple food
calories and 5% of total food calories in the national diet (Table 3).
Individually, cooking bananas, potatoes, and rice constitute less than 5% of staple food
calories and 3% or less of total food calories.
2 The temporary drop in caloric intake per person during the early 1990s was associated with a period of
negative per capita national income growth and negative per capita agricultural growth.
3 According to the FAO Stat website, 2003 was the most recent year for which data is available, so these figures
may be slightly outdated.
Table 2. Importance of Staple Foods in Diet in Kenya
Commodity Quantity consumed Daily caloric intake Share of caloric intake
(kg/person/year) (kcal/person/day) (percent)
Maize 88 768 65%
Wheat 26 196 17%
Plantains 23 56 5%
Potatoes 31 60 5%
Beans 11 103 9%
Total 180 1183 100%
Source: FAO 2009

10
Table 3. Production and Trade of Food Staples in Kenya, 2005-2007
Commodity Production Imports Exports Imports as a percentage of
apparent consumption
Exports as a
percentage of
production
(‗000 tons) (‘000 tons) (‗000 tons) (%) (%)
Maize 3,027 108 25 3.5% 0.8%
Wheat 360 612 2 63.1% 0.5%
Potatoes 855 0 0 0% 0%
Plantains 602 0 0 0% 0%
Beans 447 40 3 8.2% 0.6%
Rice 39 248 1 86.6% 1.9%
Total 5330 1009 31
Source: FAOStat 2009. Figures are based on the mean of 2005, 2006 and 2007 production levels.
Note: Apparent consumption is production plus imports minus exports and non-food uses.
Production data: http://faostat.fao.org/site/567/default.aspx#ancor
Trade data: http://faostat.fao.org/site/535/default.aspx#ancor
Because national maize production is not keeping pace with the growth in national demand,
imported wheat and rice are increasingly filling the residual food needs gap. For this reason,
the share of wheat and rice in staple food expenditures are rising, leading to more diversified
basket of staples over time. Figure 1 shows trends in maize, wheat, and rice net exports over
time (exports minus imports). Figure 1 shows an increasing staple food deficit in Kenya over
time. Wheat products are filling most of the deficit.
Figure 1. Net Grain Exports, Kenya, 1975-2007
-2000
-1750
-1500
-1250
-1000
-750
-500
-250
0
250
500
000
Met
ric to
ns
1975
1977
1979
1981
1983
1985
1987
1989
1991
1993
1995
1997
1999
2001
2003
2005
2007
Year
All Grains Maize Wheat Rice
Source: FAOSTAT 2010
Kenya
11
In most years, the country imports maize informally from Uganda and Tanzania. In years of
poor maize production, imports of wheat and maize from international sources typically make
up the shortfall not met by informal regional imports.4 Maize imports as a percentage of
national consumption is only 3.5%. However, of the 3,027,000 tons of maize produced
annually (on average over the 2005, 2006, and 2007 seasons), at most 1,000,000 hits the
market, thus recorded official imports account for over 10% of supplies circulating in Kenyan
markets. If informal regional imports were recorded, the share of imports would be even
higher.
Maize production and marketed sales in Kenya are highly concentrated. While almost all
farmers in Kenya grow maize, it is estimated that 2% of farmers in the smallholder sector
account for over 50% of the national marketed supply (Jayne, Myers, and Nyoro 2008). If the
large-scale sector were included, the concentration of marketed supply would be even greater.
3.1.1. Wheat and Rice
Wheat is produced by smallholder and large-scale producers, but the latter account for the
lion‘s share of national production. Production is unable to keep pace with consumption
requirements and the country imports over 60% of national wheat consumption. Wheat
imports appear to be growing rapidly as the country becomes increasing food deficit due to
urbanization and population growth.
Rice plays a similar role as wheat, in that importation is growing rapidly in response to the
rising gap between national staple food production and consumption requirements. Very little
rice is produced in the country, but it is becoming a major staple in urban areas.
3.1.2. Potatoes and Cooking Bananas
These crops play a role in Kenya that is similar to cassava in some countries of central and
southern Africa, in the sense that the crops provide a consumption shock-absorber to annual
variations in production of the main staple, maize (Haggblade, Longabaugh, and Tschirley
2009). In years of national maize shortfalls, potatoes can be pulled out of the ground and
plantains can be harvested to substitute for maize in the diets. In years when maize is
bountiful, potatoes can continue to be stored in the ground for at least some period of time.
Neither potatoes nor plantains are traded across national boundaries to any significant degree.
Yet their role in reducing the magnitude of food imports in major deficit years is likely to be
significant.
4 Wheat imports have risen at an annual rate of 26,000 tons per year since the early 1990s and have exceeded
600,000 MT since 2005. Using an OLS regression of Kenya‘s national wheat imports on national maize and
wheat production and a time trend over the period 1990-2007 indicates that a decline in maize production of one
ton is associated with a 160kg increase in wheat imports, other factors constant. This effect is imprecisely
measured however, with a significance level of 0.13.

12
3.2. The Evolution of the Maize Marketing Liberalization Process in Kenya
Food security in Kenya has generally been viewed as synonymous with maize security. This
is because maize is not only the main staple food but also the most common crop grown by
the rural poor for food (Nyoro, Kiiru, and Jayne 1999). The importance attached to maize by
policy-makers in Kenya can be inferred from the emphasis laid on maize in current and past
national food policies.
Attempts to reform Kenya‘s maize marketing and pricing system began in the late 1980s. Up
until that time, the Government set producer and into-mill prices for maize grain and prices
for maize meal sold by millers and retailers to consumers. These prices were pan-territorial
and pan-seasonal, adjusted once per year at the beginning of the marketing season. The
government marketing board, known as the National Cereals and Produce Board (NCPB),
had a longstanding monopoly on internal and external trade. Informal private trade across
district boundaries was illegal, as was cross-border trade. Traders were required to apply for
movement permits to allow them to transport grain across district boundaries. Despite
government attempts at suppression, some private maize trade existed in Kenya even during
the control periods before the liberalization process began in the late 1980s.
The Cereal Sector Reform Program began in 1987/88. The European Union supported the
program as part of the country‘s overarching structural adjustment policies. At first, the
Government of Kenya (GoK) and donors agreed to legalize inter-district maize trade, with the
maximum volume of maize trade to be progressively raised over time. The reform agreement
also called for the NCPB to reduce its market share (i.e., maize purchased as a proportion of
total maize traded) over time, by widening the margin between its maize purchases and
selling price, which would have provided greater scope for the private sector to operate. In
fact, the NCPB‘s trading margin declined in the early 1990s, which had the opposite effect of
making it unprofitable for the private sector to engage or invest in many types of marketing
activities, especially long-distance trade.
The reform process intensified in late 1993, when, under pressure from international lenders,
the government eliminated movement and price controls on maize trading, deregulated maize
and maize meal prices, and eliminated direct subsidies on maize sold to registered millers
(Jayne and Kodhek 1997). By 1995, private traders were allowed to transport maize across
districts without any hindrance.
The reform process was expected to raise competition by encouraging more private sector
participation in the market and thereby reduce costs in the marketing system. In practice, the
implementation of the reforms has most likely exacerbated the risks and costs of private
sector investment. This is because the reforms have been marked by frequent and usually
unanticipated changes in trade tariffs, quantity restrictions, and regulatory changes facing
private traders. The discretionary policy tools used by the government to influence market
prices and supplies, and which raised market uncertainty for traders include: (i) frequent and
unannounced changes in maize import tariff rates; (ii) export bans; (iii) the behavior of the
NCPB, in particular the prices it sets for maize purchase and sale, and the funds allocated for
this purpose by the Treasury, which then determine the extent to which the NCPB can defend
its official pricing structure and influence market prices; and (iv) regulatory changes
regarding the amount of freedom the private sector was permitted in maize marketing.
In addition to these sources of uncertainty, the liberalization process in Kenya has created
additional risks for private investment associated with the uncertainty over the eventual

13
dispensation of NCPB assets. Private investment in dedicated capital outlays, such as storage
facilities, has been impeded by the high degree of uncertainty over the disposition of the
NCPB‘s storage facilities and other assets. New private investment in storage facilities could
be vulnerable to huge losses if the NCPB continued to be a major player in the market,
offered prices to farmers and millers that did not rise through the marketing season (pan-
seasonal prices), or set a narrow margin between its buying and selling prices that could be
underwritten by the treasury – all of which happened during much of the 1990s. For these and
other reasons to be explored below, private investment in grain marketing facilities did not
proceed as rapidly as anticipated. Table 5 provides a detailed chronology of these
interventions.
Prior to market liberalization in the late 1980s, the NCPB purchased between 5-8 million
bags of maize per year. Even during the early years of liberalization, the NCPB received
enough public funds to purchase between 3-6 million bags per year, which was more than
half of domestically marketed maize output. Thus, the NCPB remained the dominant player
in the maize market even 6-7 years into the liberalization process. This is not surprising
considering that the NCPB set its maize purchase prices considerably higher than prevailing
market prices. In the maize breadbasket areas of Kenya, the incomes and living standards of
many farmers, especially large-scale farmers, depended on the NCPB continuing to offer
support prices for maize. By offering above-market support prices, the NCPB used its market
power and access to treasury subventions to discourage private sector competition and
investment in maize wholesaling and storage.
Starting in the 1995/96 marketing year, and under pressure from external donors, the
government dramatically reduced the NCPB‘s operating budget. This forced the NCPB to
scale back its purchases substantially to about 1 million bags per year between 1995 and 2000
(Table 4). The reduction in NCPB maize purchases from 3-8 million to 1 million bags led to
intensive lobbying by commercial maize farmers for increased purchases. A year before the
national elections, the government increased the NCPB‘s budget for the 2000/01 year. Since
2000, the NCPB‘s maize purchases have been trending upward. In drought years, when
market prices are already relatively high, the NCPB tends to purchase relatively small
volumes. In normal or good years, the NCPB‘s purchases from farmers have exceeded three
million bags. This is believed to be roughly 25-35% of the total maize sold by the small and
large farm sector in Kenya, and is approaching the scale of operations played by the NCPB
during the pre-reform era.
Most of the maize purchased by the NCPB now appears to be directly from large-scale
farmers in the maize surplus parts of the country, where unit procurement costs are low due
to scale economies. The Tegemeo/MSU household surveys have tracked maize selling and
buying behavior of 1,313 small farm households in 1996/97, 1999/00, and 2003/04. Since the
major withdrawal of the NCPB in 1995, the survey data show that smallholder farmers in the
aggregate sell 96% of their maize to one of two types of buyers: private traders/brokers or
consuming households. The NCPB accounts for 4% or less of household maize sales,
although it is likely that some traders buying maize from farmers sell it to NCPB. About
28.6% of the households in the Tegemeo panel sample are located in the prime maize-surplus
districts of Trans Nzoia, Uasin Gishu, upper Kakamega, Nakuru, upper Narok, and Bomet. In
this High-Potential Maize Zone, we find that 9% of the maize selling households sold maize
to the NCPB. The other 91% of the households selling maize in the High-Potential Maize
Zone sold to private buyers. Over the entire nationwide sample, only 2% of the households
sold to the NCPB, while 34% sold to private buyers. The remainder of the sample did not sell
maize. Yet, as will be shown later, the NCPB indirectly influences millions of small farmers

14
and urban consumers through the upward pressure that its operations exert on maize market
prices.
The 2007 National Food and Nutrition Programme (NFNP) is a draft government document
that attempts to address the shortcomings in earlier policy documents. In particular, the
NFNP shifts the focus away from maize self-sufficiency to a more comprehensive policy of
food access, diversity, and nutritional status (Republic of Kenya 2007). It acknowledges that
high staple food prices, while favorable to farmers who can produce a surplus, directly hurt
not only urban consumers but also a large portion of rural small-scale farmers who are net
buyers of staple food. The NFNP emphasizes increased availability and accessibility to
diverse foods to meet the basic minimum food nutritional requirements. It proposes a gradual
removal of import duties on maize, wheat, and rice, promotion of cross-border trade in food
items, controlled importation of subsidized foods, and educating local authorities and
administrators on importance of free movement of food items. By proposing appropriate
reforms in domestic and external trade policy, the NFNP brings into perspective the
importance of perceiving food security in the broader context of regional market integration
and globalization rather than just as a localized issue.

15
Table 4. NCPB Maize Trading Volumes and Price Setting, 1988/89 to 2009/10
YEAR
TOTAL
OUTPUT
(000 MT)
(A)
NCPB MAIZE PURCHASE AND SALE PRICE
(KENYAN SHILLING (KSH) PER 90KG BAG)
NCPB MAIZE
PURCHASES
(000 MT)
(F)
NCPB MAIZE
SALES
(000 MT)
(G)
OFFICIAL
EXPORTS
(000 MT)
(H)
OFFICIAL
IMPORTS
(000 MT)
(I)
-------- NOMINAL -------- ----- INFLATION-ADJUSTED -----
(2005=100)
PURCHASE
PRICE
(B)
SALE
PRICE
(C)
PURCHASE
PRICE
(D)
SALE
PRICE
(E)
1988/89
1989/90
1990/91
1991/92
2761
2631
2290
2340
201
221
250
300
326
337
337
358
1725
1680
1645
1649
2703
2561
2215
1961
643.8
551.3
235.3
318.9
669.6
735.2
167
110
160
19
0
0
0
75
1992/93
1993/94
1994/95
2430
2089
3060
420
950
920
646
1280
1280
1679
2549
1960
2582
3434
2728
493.4
467.6
540.0
257.4
512.8
67.7
0
0
2
0
89
121
1995/96
1996/97
1997/98
1998/99
1999/00
2000/01
2001/02
2002/03
2003/04
2004/05
2005/06
2006/07
2007/08
2008/09
2009/10
2699
2160
2214
2400
2322
2160
2776
2441
2714
2459
2918
3248
2931
2367
2443
600
1127
1162
1009
1200
1250
1000
1052
1358
1400
1250
1300
1300
1950
2300
1500
887
1100
1318
1209
1436
1300
1250
1265
1680
1950*
1770*
1500*
1335
1435-1835#
1750-1910
1235
2232
2172
1764
1923
1812
1414
1408
1670
1566
1250
1161
1111
1615
1825
2176
2463
2113
2301
1884
1768
1693
2066
2181
1770
1339
1148
1189-1520
100.8
62.8
151.5
34.9
177.2
311.5
257.7
89.1
162.0
314.1
135.3
407.2
32.0
78.3
111.3
54.3
14.6
123.3
145.1
74.1
23.7
196.4
136.7
144.0
375.6
97.6
219.6
308.6
0.0
154
221
9
13
37
7
6
0
48
14
4
18
22
14
1.5
0
0
565
0
52
498
472
24
109
273
40
60
48
149
1410
Note: * NCPB maize selling price changed from pan-territorial to province-specific in 2004. Prices shown are for Nairobi and Central Provinces. # revised four times during
2008/09 starting at the 1435 Ksh/bag and ending at 1835 Ksh/bag.
Source: NCPB data files, except for maize production statistics, which come from the Ministry of Agriculture. Official imports include both NCPB and recorded private
sector imports. Further disaggregation of import data is contained in Appendix 1.
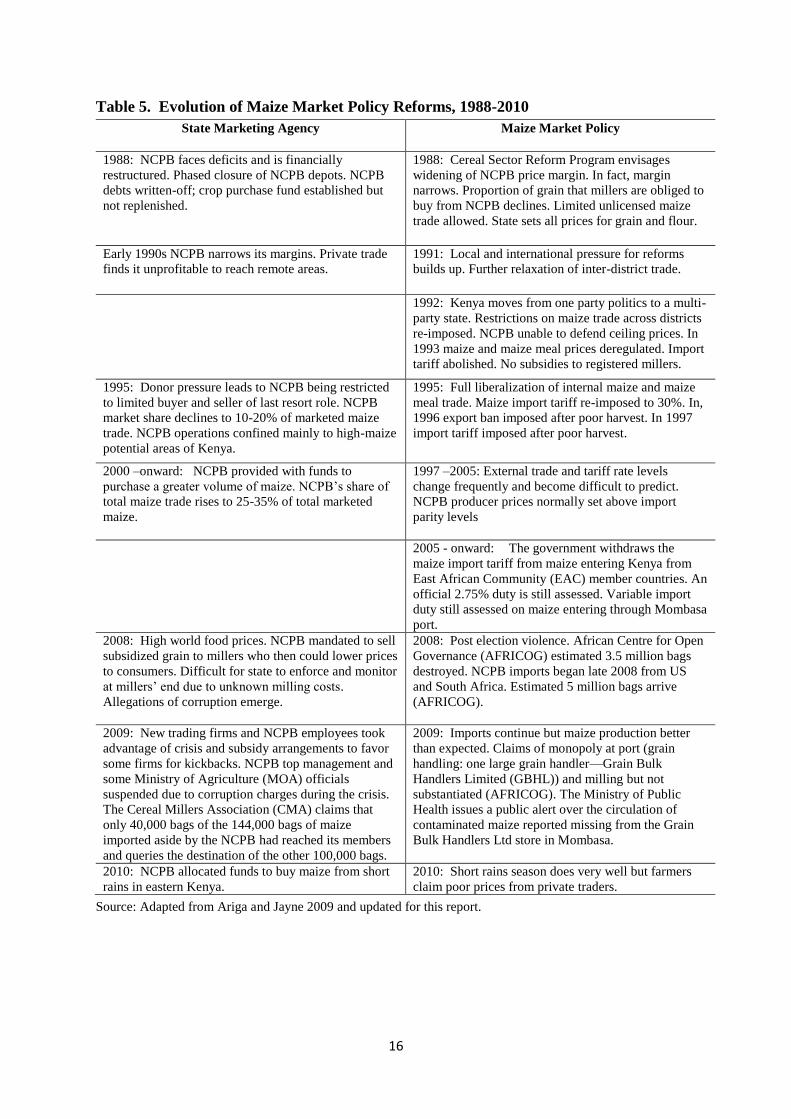
16
Table 5. Evolution of Maize Market Policy Reforms, 1988-2010
State Marketing Agency Maize Market Policy
1988: NCPB faces deficits and is financially
restructured. Phased closure of NCPB depots. NCPB
debts written-off; crop purchase fund established but
not replenished.
1988: Cereal Sector Reform Program envisages
widening of NCPB price margin. In fact, margin
narrows. Proportion of grain that millers are obliged to
buy from NCPB declines. Limited unlicensed maize
trade allowed. State sets all prices for grain and flour.
Early 1990s NCPB narrows its margins. Private trade
finds it unprofitable to reach remote areas.
1991: Local and international pressure for reforms
builds up. Further relaxation of inter-district trade.
1992: Kenya moves from one party politics to a multi-
party state. Restrictions on maize trade across districts
re-imposed. NCPB unable to defend ceiling prices. In
1993 maize and maize meal prices deregulated. Import
tariff abolished. No subsidies to registered millers.
1995: Donor pressure leads to NCPB being restricted
to limited buyer and seller of last resort role. NCPB
market share declines to 10-20% of marketed maize
trade. NCPB operations confined mainly to high-maize
potential areas of Kenya.
1995: Full liberalization of internal maize and maize
meal trade. Maize import tariff re-imposed to 30%. In,
1996 export ban imposed after poor harvest. In 1997
import tariff imposed after poor harvest.
2000 –onward: NCPB provided with funds to
purchase a greater volume of maize. NCPB‘s share of
total maize trade rises to 25-35% of total marketed
maize.
1997 –2005: External trade and tariff rate levels
change frequently and become difficult to predict.
NCPB producer prices normally set above import
parity levels
2005 - onward: The government withdraws the
maize import tariff from maize entering Kenya from
East African Community (EAC) member countries. An
official 2.75% duty is still assessed. Variable import
duty still assessed on maize entering through Mombasa
port.
2008: High world food prices. NCPB mandated to sell
subsidized grain to millers who then could lower prices
to consumers. Difficult for state to enforce and monitor
at millers‘ end due to unknown milling costs.
Allegations of corruption emerge.
2008: Post election violence. African Centre for Open
Governance (AFRICOG) estimated 3.5 million bags
destroyed. NCPB imports began late 2008 from US
and South Africa. Estimated 5 million bags arrive
(AFRICOG).
2009: New trading firms and NCPB employees took
advantage of crisis and subsidy arrangements to favor
some firms for kickbacks. NCPB top management and
some Ministry of Agriculture (MOA) officials
suspended due to corruption charges during the crisis.
The Cereal Millers Association (CMA) claims that
only 40,000 bags of the 144,000 bags of maize
imported aside by the NCPB had reached its members
and queries the destination of the other 100,000 bags.
2009: Imports continue but maize production better
than expected. Claims of monopoly at port (grain
handling: one large grain handler—Grain Bulk
Handlers Limited (GBHL)) and milling but not
substantiated (AFRICOG). The Ministry of Public
Health issues a public alert over the circulation of
contaminated maize reported missing from the Grain
Bulk Handlers Ltd store in Mombasa.
2010: NCPB allocated funds to buy maize from short
rains in eastern Kenya.
2010: Short rains season does very well but farmers
claim poor prices from private traders.
Source: Adapted from Ariga and Jayne 2009 and updated for this report.

17
3.2.1. The 2008/09 Food Price Crisis
In response to a poor 2008 main harvest, civil disruption following the December 2007
national elections, rising world food prices, and the continuation of a 50% tariff on maize
imports through the port of Mombasa, local food prices rose sharply in 2008. Figure 2
presents Nairobi wholesale maize price trends denominated in U.S. dollars. Note that 2007
price levels were relatively average despite the surge in world food prices that had already
begun. High world prices in 2007 and early 2008 no doubt exerted upward pressure on
Kenyan maize prices by mid-2008, when the market adjusted to an import parity price
surface in anticipation of the need for imports. However, because of delays in government
importation and government‘s decision to maintain the 50% tariff on imports through
Mombasa throughout 2008, maize prices stayed at levels almost 50% above world prices by
late 2008 despite the tumbling world prices starting in September 2008. Maize prices usually
decline by November or December in Kenya as the main season harvest hits the market. The
fact that prices continued to exceed $300 per ton at this time could have been an indicator of
a food crisis to come.
In January 2009, Kenya‘s food crisis took a new turn as allegations of corruption over the
issuing of import licenses, reported diversion of over 100,000 tons of imported maize to
Sudan, and a lack of transparency over the sale of subsidized NCPB grain (AFRICOG 2009).
On January 16, 2009, President Mwai Kibaki declared a state of emergency and launched an
international appeal for US$ 463 million to feed roughly six million people who were
estimated to be food insecure. In January, the World Food Programme pledged to feed 3.2
million people following the government‘s declaration of a food crisis in the country. The
import duty on maize was finally lifted on January 28, 2009, allowing importers to buy maize
from the international market and bring it into the country duty free.
Figure 2. Nairobi Local and Import Parity Prices, January 2006-August 2009
100
200
300
400
500
600
700
2006:01 2007:01 2008:01 2009:01
US
D p
er
metr
ic t
on
import parity (tariff removed
January 28, 2009)
Nairobi wholesale
Source: Ministry of Agriculture Market Information Bureau for Nairobi wholesale prices; Kenya Bureau of
Statistics for exchange rates; SAFEX and Tegemeo Institute for import parity prices.

18
3.2.2. Cross-Border Maize Trade and Regional Trade Policy
Evidence indicates that the costs of maize production in eastern Uganda are typically lower
than in most areas of Kenya (Nyoro, Kirimi, and Jayne 2004), and import tariffs were deemed
necessary to stem the inflow of imported maize from Uganda. However, since the border is
relatively porous, illegal cross border trade was common, estimated at 100,000 to 250,000
metric tons per year (Ackello-Ogutu and Echesseh 1997). It is alleged that relatively high
NCPB support prices encouraged maize imports from Uganda at the same time that official
trade policy attempted to suppress it. Illegal cross-border trade appears to have been impeded
somewhat by transaction costs, including bribery payments to police, extra handling charges
associated with offloading maize at the border, smuggling it across the border, and on-
loading maize onto trucks on the Kenya side of the border. This confusion was compounded
by the fact that these export bans, import bans, and major changes in import tariff rates as
shown in Figure 3 were not anticipated by market participants as the government in most
cases never consulted with them or provided prior announcement of trade policy changes.
Imposing an import ban or high tariff rates benefits the large maize producers (a relatively
small group) who are generally able to market their surplus at relatively higher prices
compared to the situation that could have existed without bans. Conversely, a much larger
group of net-maize buying rural households and urban consumers were adversely affected to
the extent that import tariffs raised domestic maize prices. However, the distributional effects
were likely to be relatively small. A recent VAR analysis indicates that maize import tariffs
over the 1995-2004 period raised mean domestic prices by roughly 4%, although in several
particular years, the import tariff raised domestic price levels by well over 10% (Jayne,
Myers, and Nyoro 2008).
Figure 3. Maize Import Tariff Rate through Mombasa Port, Kenya, 1994-2009
0
10
20
30
40
50
60
1994 1996 1998 2000 2002 2004 2006 2008
perc
enta
ge o
f ci
f M
omba
sa p
rice
(%
)
Source: Ministry of Trade and Industry 2010.
19
However, since 2005, Kenya‘s maize trade policy has stabilized considerably. It has
complied with regional initiatives under the Common Market for Eastern and Southern Africa
(COMESA) and the East African Community (EAC) to eliminate tariffs within the region
and harmonize regional and international trade policies. Since January 2005, the tariff on
maize imported into Kenya from Tanzania and Uganda has been limited to a 2.75%
government levy. Imports of maize grain from Mombasa continue to attract a 50% tariff.5
While formal maize import tariff rates are being harmonized in the region, numerous non-
tariff barriers to regional trade remain. Though a Single Entry Document (SED) is required
for custom clearance for COMESA countries, Kenya has additional requests for other
information that makes it difficult for traders to fill these forms, which delays custom
clearance. Before being cleared through customs, one might need a combination of the
following forms: (i) original invoice; (ii) Import Declaration Form; (iii) Pre-Shipment
Inspection (Clean Report of Finding-CRF); (iv) Certificate of Origin; (v) Phytosanitary
Certificate; (vi) Quality Standards Certificate (issued by Kenya Bureau of Standards (KBS));
and (vii) Safety Standards Certificate, among others. The issuance of most of the import
documents is centralized at the capitals or at major towns, which means that maize traders
have to travel long distances to obtain the documents. Non-tariff barriers in the form of
cumbersome trade regulations have constrained official regional trade and increased informal
unregistered cross-border trade. However, unregistered or unrecorded cross-border trade
incurs additional transaction costs, bribe payments, and handling costs that are most likely
paid for by producers and consumers in the form of lower producer prices and higher
consumer prices. This is one area that further research can provide useful information in
estimating the costs of these non-tariff barriers and how they compare with official tariff
rates.
3.2.3. Summary
The salient features of Kenya‘s maize marketing system from the start of liberalization in the
late 1980s until 2009 are:
1. Private trade has been progressively liberalized from the late 1980s until 1995 when
the liberalization process was complete. However, government has continued to
intervene heavily in maize and maize meal markets, both through the operations of
the National Cereals and Produce Board, and through ad hoc changes in trade
policies, tariff rates, bans, and quotas. These highly discretionary government actions
cause substantial uncertainty for private firms and hence the anticipated rate of rapid
investment and upgrading of marketing facilities immediately after liberalization did
not occur.
2. Kenya‘s introduction into the East African Community has resulted in an
improvement in the regional trade policy environment. Since January 2005, regional
maize trade between Uganda, Tanzania, and Kenya has not been subjected to any
taxation by the Kenyan government with the exception of a 2.75% inspection fee. A
reduction in regional trade barriers is very much in Kenya‘s interests because the
5 One other area that is being addressed by COMESA is the harmonization of food safety standards and SPS
requirements. Each country has its own standards that may be different from the others and this will impose
additional costs for traders who have to meet varied quality standards. The harmonization of the various
standards will reduce costs for traders and raise the volume of trade. The setting of regionally harmonized
quality and product standards is in progress.

20
country is a food importer and it can generally procure maize more cheaply from its
regional neighbors than it can from the world market.
With the exception of the 2008-09 crisis period, grain marketing policies in Kenya have
become more stable over time. The NCPB‘s role in the market has become clearer and
truncated especially since the National Rainbow Coalition (NARC government took power in
2002. A major source of uncertainty continues to revolve around the timing of changes in
import tariff rates, which remain highly unpredictable.

21
4. ORGANIZATION OF THE MAIZE VALUE CHAIN
4.1. Overview of Kenya’s Maize Value Chain
This section examines the organization and behavior of the maize value chain from the farm-
gate to the consumer‘s table, and documents how it has evolved in the post-reform era.
The movement of maize grain from the farm-gate to the consumer involves a series of stages.
Fieldwork from this study and that of Nyoro, Kiiru, and Jayne (1999) indicates that there are
seven major categories of actors in the maize value chain: farmers, primary assemblers (also
known as ―brokers‖ in Kenya), wholesalers, the NCPB, posho millers, large-scale millers,
and retailers. The current overall structure of the maize market is similar to what it was a few
years after liberalization. However, the numbers of players at each node has increased
substantially, particularly at the assembly stage. Each group of players is diverse and
interactions /transactions among players at different chain nodes lead to a complex system
with many marketing channels.
A description of the chain follows. The relative importance of actors and marketing channels
varies depending on the quality of the harvest. Figure 4a presents a market channel diagram
representative of a normal or good harvest year, while Figure 4b shows a poor harvest
situation when imports form a large share of total supply. The depth of shading and thickness
of the arrows denote volume of flow.
In a normal or good year, domestic production from small- and large-scale farmers forms the
major source of domestic supply. According to wholesalers, imports from neighboring
countries account for 25-30% of total domestic supply in an average harvest year, while the
world market supplies relatively little, especially when import tariff rates are high.
Smallholder maize sales go largely to small-scale assemblers or brokers, who collect and bulk
for onward sale to large wholesalers with buying depots in the towns of major production
areas. Large-scale farmers sell both to wholesale traders and to the NCPB. Large-scale
millers are the next major link in the chain, buying grain primarily from the large
wholesalers, the NCPB, and from smaller traders. The large millers sell mainly to a
decentralized system of informal retailers (street kiosks, dukas, multipurpose retail shops, and
traditional retail markets) and to a lesser extent to the more high-end consumers who shop at
supermarkets. Posho millers who operate in retail markets are important players in some
areas. Consumers buy grain and pay a fee to custom-mill their grain into posho meal. This
option provides the means to produce maize meal relatively inexpensively and is preferred by
the urban poor and most rural households, especially in the western parts of the country.
In a year when the main harvest in Western Kenya is poor, the country is more reliant on
imports. If supplies can be imported from Uganda and Tanzania, this tends to be the first
option pursued by wholesalers and millers because (since January 2005) there are no import
restrictions or barriers except for the 2.75% import inspection fee and transport costs, which
are relatively low. However, if the required quantities cannot be obtained from the region,

22
Figure 4a. Maize Marketing Channel Diagram: Typical Year of Small National Maize
Deficits
Note: the shaded boxes signify the main channels in terms of volume during this phase of the marketing season.
The thickness of the arrow signifies the volume of flow. Dashed lines represent minor flows.
Informal imports
from
Tanzania/Uganda
Rural
consumers
Wholesale
traders
Brokers /
Local
assemblers
WFP,
NGOs
Large-scale
farmers
Posho
millers
Urban consumers
Processors,
animal feeders
National Cereals
and Produce
Board
External
itinerant
traders
Supermarkets
Medium- and
large-scale
millers
Kiosks/dukas/
traditional retail
markets
World
market
imports
Maize surplus smallholder
farmers

23
Figure 4b. Maize Marketing Channel Diagram: Major National Deficits - Less Typical
Note: the shaded boxes signify the main channels in terms of volume during this phase of the marketing season.
The thickness of the arrow signifies the volume of flow. Dashed lines represent minor flows.
Informal imports from
Tanzania/Uganda
Rural
consumers
Wholesale
traders
Brokers /
Local
assemblers
WFP,
NGOs
Large-scale
farmers
Posho
millers
Urban consumers
Processors,
animal feeders
National Cereals
and Produce
Board
External
itinerant
traders
Supermarkets
Medium- and
large-scale
millers
Kiosks / dukas /
traditional retail
markets
World market imports
Maize surplus smallholder
farmers

24
Kenya then becomes dependent on the world market. It is at this point that Kenyan
wholesalers and millers lobby for a waiver of the 50% duty on maize imported through
Mombasa port. In years when imports constitute a major share of the marketed supplies, the
structure of the maize value chain changes considerably as shown in Figure 4b. The most
significant change is that the marketing channels become more concentrated and less
competitive. Import contracts through Mombasa tend to be large volume orders placed by
large millers, wholesalers, and the NCPB. Small-scale assemblers, itinerant traders, and small
millers in the informal marketing channels are less active in drought years because they
depend almost totally on small-scale farmers for their supplies, most of whom have little to
sell during drought years. With grain being scarce in local informal markets during such
years, consumers are increasingly dependent on the large-scale millers (who obtain their
supplies from world markets or from the NCPB) for their maize meal. Without competition
from the informal milling and retailing sector, large-scale millers and retailers are able to
raise their margins somewhat, as is documented in Section 5.3.
4.2. Farmers
4.2.1. Characteristics of Maize-producing Households
Using the 10-year balanced panel of 1,275 rural farm households surveyed by the Tegemeo
Institute in 24 districts in 1997, 2000, 2004, and 2007 we provide a description of the
economic and cropping characteristics of small-scale farmers in Kenya. This will provide a
foundation for understanding the role of farmers in the maize market.
Table 5 indicates that maize accounts for a declining share of total crop income in Kenya.
The share of maize in total income declined from 15.6% in 1996/97 to 11.4% in 2006/07,
while fresh fruits and vegetables have taken up an increasing share. Other than this small shift
in income shares from maize to horticultural crops, there are no other discernible trends in
rural farm income shares.
Table 6 presents data on farm production and marketing patterns. Over 96% of all farm
households cultivate maize. The balanced panel of households produced roughly the same
quantity of maize in each of the four survey years even though mean farm sizes declined by
15% over the 10-year panel period. Because the inflation-adjusted value per unit of maize
declined over this 10-year period, the real value of production declined. The proportion of
households selling maize increased from 35% of households in 1996/97 to 49% in 2006/07.
The increased proportion of households selling maize may be partially due to a major rise in
the use of fertilizer on maize over the 1997-2007 period; 54% of households used fertilizer on
maize in 1997 compared to 70% in 2007. Yet the total quantity of maize sales declined by
12% over the same period. This suggests that though a larger fraction of households are
selling maize, the mean quantity sold per selling household is declining. Analysis of
subsequent years will be needed to determine whether these are robust trends or not.

25
Table 6. Production Income Shares in the Small- and Medium-Scale Farming Sector,
Kenya, 1,275 Households
1996/1997
marketing
year
1999/2000
marketing
year
2003/2004
marketing year
2006/2007
marketing
year
% of total income
Crop production (of which) 41.1 49.9 37.9 41.1
Maize 15.6 14.0 13.4 11.4
Other cereals, roots, tubers 5.1 5.5 4.8 3.1
Beans and oilseeds 3.9 4.0 3.0 2.4
Industrial cash crops 8.3 11.9 7.4 9.5
Horticulture 8.0 13.0 7.4 12.5
Other crops 0.2 1.4 1.8 2.3
Animal products 22.8 16.6 32.9 22.3
Off-farm activities 36.1 33.5 29.2 36.6
Source: Tegemeo Rural Household surveys
Note: see documentation for crops included in the various categories.
The percentage of marketed maize production is relatively high when compared to other
countries in the region. In Malawi, for example, roughly 15% of the maize produced by the
smallholder sector is sold (Jayne et al. 2010b). By contrast, the Tegemeo data indicate that
the mean household sales as a proportion of production is roughly 45%.
Despite the relatively commercialized nature of maize production in Kenya, maize accounts
for a declining share of households‘ gross farm sales revenue, being as high as 30.1% in
1996/97 and as low as 16.2% in 2006/07. This points to a trend towards increasing
diversification in farmers‘ crop marketing behavior.
Table 7 presents data on various crops‘ contribution to total gross farm sales revenue by
region. It is apparent that maize is the dominant source of crop sales income in only one
region, the High-Potential Maize Zone. Across all 24 districts surveyed, maize accounts for
only 11% of total household farm sales revenue. Table 7 shows a fairly diversified crop
commercialization pattern, in which industrial cash crops such as tea, coffee, and sugarcane
are the dominant source of crop sales revenue in two or three regions (Western Transitional,
including Bungoma and parts of Kakamega Districts; and the Central Highlands zone), while
fresh fruits and vegetables and animal products (mainly dairy) are the greatest source of crop
revenue in several other zones. Over time and at the national level, there appears to be no
major shifts in the importance of certain crops in overall commercialization patterns.

26
Table 7. Farm Production Patterns of Small- and Medium-Scale Agricultural Households in Kenya – Shillings Reflated to 06/07 Real Value
% producing
Total
production
(MT)
Gross Value of
Production
(000 KSH) -
real value % selling
Total sales
(MT)
Gross Value of
Sales (000
KSH) - real
value
Sales as % of
production - mean
across households
Sales as % of
production -
national
% of total gross farm
sales revenue -
national
Consumed on
farm (MT)
Maize + other grains
1996/1997 96.9 2,477 65,028 35.3 1,535 41,495 48.5 63.8 30.1 942
1999/2000 96.4 2,663 59,518 43.1 1,414 31,497 42.6 52.9 19.4 1,248
2003/2004 98.4 2,500 44,370 49.8 1,390 24,671 45.9 55.6 21.2 1,110
2006/2007 98.0 2,476 31,394 49.1 1,315 16,747 47.0 53.3 16.2 1,161
Roots and Tubers 1996/1997 56.5 693 8,586 20.1 284 3,811 48.2 44.4 2.8 409
1999/2000 77.1 1,052 10,838 29.8 428 4,251 44.5 39.2 2.6 625
2003/2004 82.4 1,006 8,301 33.6 428 3,684 46.0 44.4 3.2 578
2006/2007 69.8 663 4,634 30.3 290 2,103 52.5 45.4 2.0 373
Oilseeds, beans, legumes
1996/1997 87.3 226 9,017 24.3 83 3,141 49.3 34.8 2.3 143
1999/2000 93.0 275 10,560 31.5 88 3,337 42.6 31.6 2.1 187
2003/2004 94.7 280 8,851 38.1 95 2,994 44.2 33.8 2.6 185
2006/2007 93.4 243 6,953 34.2 80 2,081 43.5 29.9 2.0 164
Horticulture 1996/1997 66.0 1,960 23,632 47.5 1,293 16,035 60.5 67.9 11.6 667
1999/2000 97.3 4,209 40,169 75.6 2,236 22,601 43.5 56.3 13.9 1,973
2003/2004 99.1 3,884 32,809 81.6 2,092 17,877 40.4 54.5 15.3 1,792
2006/2007 99.3 3,265 24,072 80.8 1,791 13,734 42.8 57.1 13.3 1,474
Tea 1996/1997 12.1 648 18,344 12.0 635 17,929 99.4 97.7 13.0 14
1999/2000 13.2 717 25,953 13.2 713 25,799 98.6 99.4 15.9 4
2003/2004 14.5 739 17,755 14.4 734 17,661 99.0 99.5 15.1 5
2006/2007 15.1 797 19,062 15.1 797 19,062 100.0 100.0 18.5 0
Sugar cane 1996/1997 5.5 2,917 9,257 5.5 2,906 9,226 96.5 99.7 6.7 12
1999/2000 9.8 6,707 20,289 9.8 6,707 20,289 100.0 100.0 12.5 0
2003/2004 6.1 3,788 9,040 5.9 3,749 8,947 98.8 99.0 7.7 39
2006/2007 6.0 3,699 7,726 6.0 3,674 7,673 99.7 99.3 7.4 25
Coffee 1996/1997 18.1 170 4,329 16.5 155 3,912 97.8 90.4 2.8 15
1999/2000 21.7 255 12,451 21.2 250 12,218 97.5 98.1 7.5 5
2003/2004 19.1 167 2,538 18.4 160 2,420 98.2 95.4 2.1 7
2006/2007 18.5 125 2,532 17.7 125 2,520 99.7 99.5 2.4 0
Dairy 1996/1997 63.1 1,811 44,197 63.1 996 24,308 55.0 55.0 17.7 815-b
1999/2000 69.0 1,793 53,602 50.8 960 28,231 54.6 52.7 17.4 832
2003/2004 68.9 2,151 47,384 52.3 1,137 24,687 49.7 52.1 21.2 1,011
2006/2007 68.5 2,006 33,588 54.7 1,229 20,299 57.4 60.4 19.7 777
Other animal products
1996/1997 82.0 a 21,888 35.8 a 15,895 85.1 72.6 11.5 a
1999/2000 60.0 a 844 57.4 a 15,566 182.3 1843.2 9.4 a
2003/2004 57.8 a 9,019 51.0 a 12.403 -155.9 137.5 10.6 a
2006/2007 59.2 a 5,201 68.6 a 18,100 -14.7 348.0 17.5 a

27
Table 7. Farm Production Patterns of Small- and Medium-Scale Agricultural Households in Kenya – Shillings reflated to 06/07 real value,
continued.
% producing
Total
production
(MT)
Gross Value of
Production
(000 KSH) -
real value % selling
Total sales
(MT)
Gross Value of
Sales (000
KSH) - real
value
Sales as % of
production - mean
across households
Sales as % of
production -
national
% of total gross farm
sales revenue -
national
Consumed on
farm (MT)
Other crops 1996/1997 5.0 51 2,437 3.9 30 1,913 92.1 78.5 1.4 21
1999/2000 39.8 2,162 5,653 7.6 142 1,145 66.5 20.3 0.7 2,019
2003/2004 48.5 5,173 6,322 9.1 519 1,303 68.2 20.6 1.1 4,653
2006/2007 53.9 3,086 5,765 8.3 207 955 68.0 16.6 0.9 2,879
Total 1996/1997 49.2 10,954 206,715 26.4 7,916 137,665 64.3 70.5 100.0 3,038
1999/2000 57.7 20,345 239,877 34.0 13,043 164,935 76.1 239.4 100.0 7,302
2003/2004 59.0 20,443 186,390 35.4 10,560 116,647 22.4 69.2 100.0 9,884
2006/2007 58.2 16,941 140,927 36.5 9,944 103,276 42.5 91.0 100.0 6,997
Source: Tegemeo Rural Household surveys. See documentation for crops included in the categories.
Notes: a - not applicable to this category.
b – estimated sales based on ratio of sales to product for the other years of the panel.

28
Table 8. Contribution to Total Gross Farm Sales Revenue of Selected Enterprises, by Zone for Different Marketing Years
Zones Marketing
year
Number of
households
Median (mean)
land holding size Maize
Roots/
tubers
Beans/
oilseeds
Industrial
cash crops Other crops
Fruits and
vegetables
Animal
products
Gross farm revenue
000' US US$ per
household
Coastal Lowlands 1996/1997
75
3.9 (4.8) 1.3 0.7 .3 .0 .0 31.7 66.0 13.5 179.8
1999/2000 2.8 (5.3) 6.8 5.7 2.1 .0 .0 55.2 30.1 17.3 230.2
2003/2004 4.0 (6.0) 3.8 27.9 .4 .0 .1 33.5 34.3 33.7 449.2
2006/2007 3.8 (5.0) 4.5 5.1 3.4 .0 .0 53.3 33.7 20.9 278.2
Eastern Lowlands 1996/1997
145
4.5 (5.9) 3.5 1.6 3.7 2.2 3.4 49.2 36.4 62.5 431.3
1999/2000 5.3 (6.3) 8.8 3.5 6.3 2.1 1.6 46.9 30.9 68.2 470.5
2003/2004 5.4 (6.8) 9.6 1.6 6.2 0.2 5.0 43.3 34.1 56.6 390.5
2006/2007 4.8 (6.8) 7.0 0.9 4.7 0.7 2.0 43.5 41.2 95.9 661.6
Western Lowlands 1996/1997
153
2.6 (3.2) 13.3 1.4 4.4 29.7 1.5 3.3 46.5 29.2 191.2
1999/2000 2.9 (3.4) 16.9 2.5 2.6 42.8 0.5 13.6 21.2 39.1 255.4
2003/2004 3.1 (4.0) 8.1 2.0 4.4 32.4 0.9 26.9 25.3 53.1 347.2
2006/2007 2.4 (3.0) 17.6 1.1 2.4 36.7 1.0 16.0 25.2 51.6 337.4
Western Transitional 1996/1997
14
4.5 (5.2) 4.5 2.8 2.2 59.4 0.0 10.1 21.0 110.0 743.0
1999/2000 4.6 (5.5) 4.6 1.1 2.0 72.1 0.4 7.4 12.4 192.9 1,303.3
2003/2004 3.9 (5.0) 11.4 2.2 2.5 54.1 0.1 10.5 19.2 126.9 857.2
2006/2007 4.1 (4.9) 8.9 1.7 2.6 56.6 0.1 6.8 23.3 158.2 1,069.0
High Potential Maize
Zone
1996/1997
346
4.0 (6.9) 56.7 0.5 3.0 6.3 2.1 4.2 27.2 554.7 1,603.3
1999/2000 4.2 (7.3) 42.7 0.8 2.3 10.9 0.8 6.8 35.7 489.3 1,414.2
2003/2004 3.9 (5.4) 39.2 1.0 2.9 10.8 1.2 8.8 36.0 613.5 1,466.1
2006/2007 3.8 (5.5) 31.4 0.6 2.3 11.2 1.2 5.2 48.0 613.5 1,773.0
Western Highlands 1996/1997
129
2.8 (3.2) 6.3 0.0 2.1 20.1 0.0 28.9 42.5 44.5 344.9
1999/2000 2.5 (3.2) 6.9 0.2 4.0 29.4 1.2 31.5 26.8 72.7 563.3
2003/2004 2.4 (3.0) 10.4 0.7 3.2 21.6 2.8 27.8 33.5 66.9 518.7
2006/2007 2.8 (3.0) 7.0 0.2 2.5 37.2 1.5 20.6 31.0 95.9 743.3
Central Highlands 1996/1997
242
2.8 (3.5) 1.4 8.3 0.4 47.3 0.4 14.1 28.2 274.3 1,133.0
1999/2000 2.4 (3.3) 1.4 6.0 0.5 58.5 0.5 13.6 19.5 368.4 1,522.1
2003/2004 2.5 (3.2) 1.6 5.9 0.6 48.7 0.3 14.7 28.2 253.1 1,045.7
2006/2007 2.3 (2.7) 1.4 5.2 0.5 51.4 0.6 14.4 26.6 389.4 1,608.9

29
Table 8. (Continued) Contribution to Total Gross Farm Sales Revenue of Selected Enterprises, by Zone for Different Marketing Years
Zones Marketing
year
Number of
households
Median (mean)
land holding size Maize
Roots/
tubers
Beans/
oilseeds
Industrial
cash crops Other crops
Fruits and
vegetables
Animal
products
Gross farm revenue
000' US US$ per
household
Marginal Rain
Shadow
1996/1997
37
3.0 (3.5) 0.9 1.6 1.2 0.0 0.0 48.5 47.8 14.0 378.4
1999/2000 2.8 (2.9) 0.0 1.3 0.5 0.0 0.2 34.3 63.8 17.5 473.7
2003/2004 3.0 (3.3) 5.3 2.7 4.5 0.0 0.7 36.2 50.6 20.5 552.8
2006/2007 3.0 (3.1) 2.9 2.0 1.3 0.0 0.0 41.1 52.7 35.2 952.5
Total
1996/1997
1,275
3.7 (5.0) 11.0 2.1 2.2 20.6 0.9 23.7 39.4 1,102.8 625.6
1999/2000 3.4 (5.1) 11.0 2.6 2.5 27.0 0.7 26.2 30.1 1,265.3 779.1
2003/2004 3.5 (4.7) 11.2 5.5 3.1 21.0 1.4 25.2 32.7 1,118.0 703.4
2006/2007 3.2 (4.4) 10.1 2.1 2.5 24.2 0.8 25.1 35.2 1,460.6 928.0
Source: Tegemeo Rural Household surveys
*Categories are derived from Table 2 data. Cereals = Maize + other grains, Roots/Tubers and Beans / oilseeds are the same, Industrial cash crops= Tea, Sugarcane and
Coffee, Animal products = Dairy and Other animal products, Fruits and vegetables = Horticulture, Other crops = other crops.

30
Table 9. Attributes of Different Categories of Smallholder Farmers According to Maize Sales Status, for Various Marketing Years
(Constant 2007 Kenyan Shillings)
Biggest maize sellers
accounting for 50% of
total maize sales
(n= 20 in 1996/97)
(n= 24 in 1999/2000)
(n=26 in 2003/04)
(n=27 in 2006/07)
Other maize sellers
accounting for the other
50% of total maize sales
(n= 383 in 1996/97)
(n= 457 in 1999/2000)
(n=538 in 2003/04)
(n=544 in 2006/07)
Farm households growing
but not selling maize
(n= 822 in 1996/97)
(n= 738 in 1999/2000)
(n=678 in 2003/04)
(n=675 in 2006/07)
Farm households not
growing maize
(n= 50 in 1996/97)
(n= 56 in 1999/2000)
(n=33 in 2003/04)
(n=29 in 2006/07)
Total
(n= 1275 for all
years)
Attribute Marketing year ---------- Mean Values ---------
Total household income
(Ksh)
1996/1997 1,418,230 369,311 231,356 177,597 289,306
1999/2000 1,349,117 350,958 236,265 257,355 299,248
2003/2004 753,742 330,011 180,193 251,508 256,952
2006/2007 584,046 230,256 166,732 201,650 203,467
Gross value of
crop sales
(Ksh)
1996/1997 837,870 104,647 48,024 22,976 76,441
1999/2000 685,747 115,244 65,871 60,668 95,007
2003/2004 310,561 84,143 36,337 47,810 62,398
2006/2007 213,749 57,720 39,974 24,984 50,884
Gross value of maize sales
(Ksh)
1996/1997 500,904 26,620 - - 16,501
1999/2000 483,692 22,877 - - 17,304
2003/2004 244,245 19,693 - - 13,643
2006/2007 166,417 14,381 - - 9,885
Value of productive assets (Ksh)
1996/1997 2,261,097 280,981 111,849 104,264 196,071
1999/2000 1,063,858 174,726 87,793 127,572 139,072
2003/2004 806,654 166,205 72,451 91,462 127,475
2006/2007 198,585 65,671 49,365 32,926 59,108
Value of income from
livestock products (Ksh)
1996/1997 160,445 81,193 37,169 24,512 51,831
1999/2000 238,066 50,957 32,243 29,479 42,703
2003/2004 206,665 60,427 25,972 28,654 44,238
2006/2007 115,376 35,568 23,271 21,287 30,423
Area under crops (acres)
1996/1997 26.6 5.4 3.5 3.0 4.4
1999/2000 27.4 6.5 3.7 3.0 5.1
2003/2004 15.1 5.6 3.4 5.6 4.7
2006/2007 15.4 5.2 3.3 1.8 4.4

31
Table 8 disaggregates smallholder households included in the nationwide survey into three
groups: (i) the largest smallholder sellers of maize who accounted for 50% of the total
marketed maize output; (ii) the remaining households that sold maize during the year who
accounted for the other 50% of the marketed output; and (iii) those households that sold no
maize during the 12-month marketing season. The data in Table 8 demonstrate that 2% of the
farms account for 50% of the overall marketed maize surplus from the smallholder sector.
These farm households appear to enjoy substantially higher welfare levels, in terms of asset
holdings, crop income, and non-farm income, than the rest of the rural population. The
relatively elite smallholder farmers had roughly 2 – 6 times as much land and productive
assets as the non-selling households, 6 – 9 times more gross revenue from the sale of all
crops, and 5 – 7 times as much total household income.
When a broader set of staples are aggregated together (maize, cassava, sweet potato, millet
and sorghum) more than 55% of the sales of staples are still accounted for by 10% of the
farmers with the largest sales. This concentration of surplus production and marketing by a
relatively few farmers is one of the most important points to be borne in mind when thinking
about the effects of policy instruments designed to alter the mean level of food prices. At
least in the short run, policies that put upward pressure on maize prices benefit only a small
minority of producers, while directly hurting the majority.
A second implication of the substantial differentiation within the smallholder farm sector is
that the benefits of food price support policies that raise mean prices are likely to be
extremely concentrated. This was a major outcome of the price support and stabilization
policies pursued during the pre-liberalization period, which contributed to peasant
differentiation and the subsequent stratification among smallholders in terms of their ability
to participate in markets during the post-liberalization era. The benefits of state resources
aimed at supporting food prices are directly proportional to how much a farmer can sell. In
light of the extreme concentration of land and other productive assets in the agricultural
sector, coupled with the fact that the majority of relatively asset-poor smallholders sell no
grain at all, it is clear that state-led efforts to support maize producer prices in Kenya
represent a regressive redistribution of income from the urban and rural poor to a small set of
relatively wealthy farmers.
4.2.2. Net Buyer/net Seller Status of Smallholder Farmers
Maize producers can be classified into six categories depending on their grain selling and
purchase behavior. Table 10 is based on the Tegemeo rural household panel data collected in
1997, 2000, and 2004, and shows the percentage of farming households in the sample that fall
into different categories according to their market position. The positions are described as
follows: (i) sell only–households that sold but did not buy maize; (ii) buy only–households
that bought maize and did not sell any; (iii) net sellers–households that bought and sold maize
but maize sales exceeded purchases; (iv) net buyers–households that bought and sold maize
but purchases were greater than sales; (v) neither buys nor sells–households that did not
participate in the market (autarkic); and (vi) net equal–the quantity of maize sold and bought
were equal.
As shown in Table 9, the majority of rural farm households in Kenya are only buyers of
maize, who tend to have relatively smaller farms, are poorer, and are mainly female-headed

32
households. By contrast, roughly 20% of farms (sell only, who are generally larger farms)
account for the majority of the maize marketed nationwide. In addition, about 18% of the
total households in the sample both buy and sell maize within the same year (net seller, net
buyer and net equal categories), with nearly two thirds of them being net-sellers.
In the net-seller category (sell only and net seller categories), a majority of these households
sold maize out of their marketable surplus and did not buy any maize. Results based on the
2007 Tegemeo rural household survey indicate that these households are highly concentrated
in the High Potential Maize Zone (Table 11). The other households in this category are those
who bought and sold maize but sales exceeded purchases. The largest proportion of such
households is also found in the High Potential Maize Zone.
Table 10. Household Characteristics According to Position in the Maize Market,
Nationwide Sample of Small-scale Households in Kenya, Pooled Data, 1997, 2000, and
2004
Characteristic
Household market position (% of households)
Sell Only
(n=781)
Buy only
(n=2052)
Net seller
(n=467)
Net
buyer
(n=242)
Net
equal
(n=18)
Neither
buys nor
sells
(n=412)
Total
(n=3972)
% of total
sample
19.7 51.7 11.8 6.1 0.5 10.4 100
Household
Income
(2004 Ksh per
hh)
334,188 175,409 275,006 184,375 243,950 213,775 223,176
Crop Income
(2004 Ksh per
hh)
182,093 86,702 153,616 90,908 157,080 102,893 115,580
Household
Wealth
(2004 Ksh per
hh)
273,390 58,662 118,840 61,862 31,590 110,435 113,401
Land Cultivated
(acres) 7.5 2.6 4.8 3.0 2.4 3.6 4.0
Household Size
(adult
equivalents)
6.2 6.2 6.2 6.3 6.9 5.8 6.2
Female-headed
households (%) 12% 49% 7% 16% 5% 11% 100%
Source: Adapted from Ariga and Jayne (2009).

33
Table 11. Household Maize Market Position for the 2006/2007 Production Season by
Agro-Ecological Zone
Zone
Household market position (% of households)
Sell only Buy only Neither buys nor sells Net seller Net buyer
Eastern Lowlands 7.2 15.9 15.3 11.2 17.9
Western Lowlands 6.3 22.7 14.5 4.2 25.0
Western Transitional 11.8 10.9 11.1 16.1 25.0
High Potential Maize
Zone 46.9 18.0 15.7 40.6 17.9
Western Highlands 10.1 16.1 7.7 11.9 10.7
Central Highlands 17.6 16.4 35.7 16.1 3.6
Source: Tegemeo Rural Household Survey 2007
A study by Kimenju and Tschirley (2008) provides perspective on the conditions of the
relatively small proportion of households that sell and buy maize in the same year. Results
from their study show that the contribution of off-farm business income to total household
income has increased in all zones, signifying that rural households are diversifying their
income sources by engaging in off-farm activities. Businesses that are increasingly
contributing more to household income include trading (retail shops and selling clothes), food
and beverage (hotel, butchery, fish trading), artisan activities (masonry, carpentry, weaving)
and services (tailoring, hairdressing, and barbershops, car washing). These businesses offer
opportunities for households to earn additional income and avoid distress sales. It turns out
that a relatively large share of farm households that buy and sell maize in the same year are
engaged in maize trading, perhaps as assemblers. By far the majority of maize buying
households are those that only buy maize, not buy and sell in the same year.
The proportion of households producing maize has remained high between 1997 and 2007,
averaging 99%. This indicates the importance attached to maize by most rural households.
Indeed, nearly all households attempt to produce maize for their own consumption, but many
are unable to do so and are buyers or net buyers. The majority of smallholders lack access to
sufficient land and productive assets to produce a meaningful surplus. Even if they could
achieve major maize productivity gains, they would remain unable to produce a meaningful
surplus that would generate levels of income that would be substantially above the poverty
line. A critical component of making maize markets work for small-scale farmers is thus to
address the needs of the majority of farmers who are net buyers of maize. Reliable access to
maize at tolerable prices is a necessary precondition for these farmers to successfully
diversify away from maize production and into the production of higher value crops.

34
4.2.3. Maize Marketing Channels for Farmers
This section highlights the various outlets through which farmers sell their maize. The figures
presented are based on the responses obtained from 33 farmer focus group discussions
(farmer FGDs) carried out in 33 villages in the districts of Bomet, Kisii, Bungoma, Nakuru,
Machakos, and Trans-Nzoia during May-June 2009. We separately obtained specific
information from the 450 maize-selling farmers who participated in the FGDs. Out of the
total number of villages, 57.6% were identified as accessible while 42.4% were defined as
inaccessible. Accessibility was mainly defined in terms of two indicators of market access,
namely mean village-level data on distance to the nearest motorable road and the condition of
the road.
We also stratified villages according to whether they participated in farmer marketing
training under the KMDP to compare marketing behaviors between farmers receiving
marketing training and control groups without formal marketing training. Out of the total
number of villages surveyed, 48.5% were identified as receiving KMDP marketing training.
In the villages where the fieldwork was carried out, farmers have a wide range of marketing
options or outlets. There is a range of types of buyers who purchase maize from farmers,
including assemblers or small traders, large traders or wholesalers, cooperatives, NCPB,
other farmers, households in the village, schools, commercial and posho millers, and brewers.
Of these available options, the most prevalent kinds of buyers are the small and large traders.
The distribution of these types of buyers by village accessibility is as shown in Table 11.
Assemblers are the dominant maize buyers in both accessible and inaccessible villages,
followed by the large traders. These results indicate that maize assembly traders have
penetrated even the remote rural areas in Kenya, which may reflect an increase in private
sector investment in maize trade. There is also evidence of a declining role of NCPB,
particularly in the accessible areas.
According to focus group respondents, private buyers operating at the village level provide
farmers with particular advantages relative to other marketing options. First, they pay cash
immediately upon acquiring maize. Second, they purchase maize directly from farmers‘
doorstep. Third, they will occasionally offer farmers cash loans prior to harvest, which allows
farmers to deal with immediate financial demands when the need arises. Assembly traders are
also willing to purchase maize in small quantities, which is critical in a country where many
farms generate small surpluses. Finally, small-scale assemblers are not very concerned with
quality and moisture standards, which many farmers view as a barrier preventing them from
selling maize directly to large-scale mills or the NCPB. In fact, the current structure of
Kenya‘s maize market provides little incentive for farmers to produce high quality maize,
because quality rarely translates into greater returns when selling through the small-scale
assembler marketing channel.

35
Table 12. Frequency of the Type of Buyers Purchasing Maize from Farmers
Interviewed in the Focus Group Discussions (N=450), Stratified by Accessible Vs.
Remote Villages
Accessible villages* Inaccessible villages**
Number % Number %
Assembler/small trader 139 54.3 110 56.7
Large trader/wholesaler 56 21.9 47 24.2
Cooperative 0 0 2 1.0
NCPB 1 0.4 5 2.6
Other farmer/trader 2 0.8 2 1.0
Household in village 27 10.5 14 7.2
School 29 11.3 5 2.6
Miller 0 0 7 3.6
Posho mill 1 0.4 2 1.0
Brewer 1 0.4 0 0
Total 256 100 194 100
Source: Tegemeo/Michigan State University Maize Value Chain Survey 2009.
Note: * ** Accessibility was defined in terms of several indicators of market access as outlined on page 8, but
the main ones are mean village-level data on distance to the nearest motorable road and the condition of the
road.
However, despite the stated advantages of selling maize to private assemblers, farmers
complain that these buyers frequently use inaccurate measurements when buying maize and
collude to fix prices and minimize competition between them. These complaints may be well
founded. Throughout Kenya, private assemblers use plastic tins, known as gorogoro, to buy
and sell maize. Gorogoro are assumed to hold 2.25 kg of maize. Thus, 40 gorogoro is the
standard measure for a 90 kg bag of maize. Yet these plastic tins are far from standardized. In
fact, variations in size serve as one of the primary ways in which assemblers, wholesalers,
and retailers extract additional profits from maize transactions. Based on measurements of
gorogoro in Salgaa, Nakuru District, and Kapkwen, Bomet District, three different sizes of
gorogoro were identified, with sizes changing as maize moves up and down the value chain.
The tins used to buy maize from farmers held 3 kg of maize, the tins used by wholesalers to
sell maize to retailers held 2.25 kg, and the tins used by retailers to sell to consumers held 2
kg. Obviously these weights will change based on the moisture content of maize, but the
relative difference will hold constant. The consequence of this variegated form of
measurement is that, for example, if a farmer claims to have sold three 90kg bags of maize,
but the assembler measured 40 gorogoro per bag, in all likelihood the farmer sold four 90kg
bags of maize, while only being compensated for three. This is a significant loss of profit and
is one of the central complaints farmers have about the private trading system. As a result, a
great deal of distrust of the private maize marketing system exists within the smallholder
sector.
One of the most important findings is that in virtually all villages chosen for farmer focus
group discussions, including both accessible and inaccessible areas, the response to the
question "how many traders purchased maize from farmers in this village" was almost always
more than 10. Overall, the most commonly cited number of traders was 100, with about 27%
of the responses indicating a number between 15–30 and 42% quoting a figure of 50–100.

36
Figure 5 shows the distribution of traders operating in accessible and inaccessible villages
across the districts. With this many traders purchasing maize in each village, the assembly
traders are apparently pushing much deeper into rural areas than the conventional wisdom
would indicate. It shows the extent to which the first stage in the system (farmer-assembly
trader/first buyer) has developed and become competitive over the years. The growing
density of maize assemblers also reflects an increase in the participation of the private sector
in the maize trade following liberalization.
The mean distance from the farmers‘ farms to the point of sale of maize was 1.85 km, with
73.1% of the farmers selling their maize at the farm-gate. Therefore, the majority of the
traders transact with farmers for grain right in the villages. Most of the maize sold beyond the
farm gate was purchased by assemblers/small traders, schools, and wholesalers/large traders
in order of decreasing volumes, and was mainly transported by donkey carts and trucks/cars.
These results closely mirror the findings by Chamberlin and Jayne (2009). They used the 10-
year Tegemeo panel data on 1,267 smallholder households to monitor changes in their access
to markets and services. One of their access indicators was the distance (km) to point of
maize sale with private trader. Results showed that between 1997 and 2007, the mean
distance from the farm to point of sale of maize declined from 0.9km to 0.5km. This
represents a 43% reduction in distance, and reflects an increased density of grain traders in
rural areas. In addition, by 2007, over 75% of smallholder households selling maize stated
that the private trader to which they sold came to their farm or village to buy their maize.
Figure 5. Farmer Focus Group Respondents’ Estimates of the Number of Traders
Buying Maize within their Village in the 2008/09 Marketing Season
Source: Tegemeo/Michigan State University Maize Value Chain Survey 2009.
010
20
30
40
0-15
16-3
0
31-4
5
46-6
0
61-7
5
75-9
0
91-1
05
>105
0-15
16-3
0
31-4
5
46-6
0
61-7
5
75-9
0
91-1
05
>105
inaccessible accessible
pe
rcen
t of vill
ag
es
categories of number of traders operating in a village
Kenya

37
Private traders accounted for 73% of the sales transactions in 2007, while neighboring
households and the NCPB accounted for the remaining 22% and 5% of transactions,
respectively. The study also shows that while in 1997, 90% of the households traveled 3.5km
or less to the point of maize sale, by 2007, 90% of the households traveled 2 km or less. This
reduction in distance to the point of maize sale again suggests that over time maize assembly
traders are penetrating deeper into the rural areas and buying maize directly in the villages,
and may reflect a growing density of maize traders.
Overall, these results suggest that over the years, there has been greater investment in private
grain trading, particularly at the assembler level. This trend perhaps reflects a positive result
of liberalization; there is now more private sector participation in the maize market as
evidenced by the improved proximity of households to maize buyers as well as the growing
density and geographical coverage of maize assembly traders in response to the removal of
controls on maize movement and price. Additionally, given the high number of traders
operating in the village, these findings imply that access to markets may no longer be defined
in terms of distance to point of sale, but rather in terms of the ability of farmers to obtain and
negotiate for a remunerative price.
Results in Figure 6 show that the importance of the marketing channels varies by district.
While farmers in Nakuru and Kisii did not sell maize to millers, a significant proportion of
them sold maize to other households. On the other hand, in Trans Nzoia district, the
proportion of sales to NCPB and small traders were equal. Therefore, although NCPB is
generally playing an increasingly smaller role as an outlet for maize from farmers, it remains
an important channel in the larger Trans Nzoia and Bomet districts, which are maize surplus
zones and there is a deliberate move by NCPB to operate in such areas. It is important to note
that these interviews took place after the 2008 harvest, when private sector prices were high
and the NCPB therefore played a diminished role in the market.
Figure 6. Proportion of Maize Sold to Different Buyers by District
Source: Tegemeo/Michigan State University Maize Value Chain Survey 2009.

38
Table 13. Average Price per Kilogram of Maize through Different Market Channels
Marketing channel Price per kg
Assembler/small trader 21.00
Large trader/wholesaler 20.50
Cooperative 20.00
NCPB 19.80
Other farmer/trader 17.80
Household in village 26.20
School 22.35
Miller 25.10
Posho mill 19.30
Source: Tegemeo/Michigan State University Maize Value Chain Survey 2009.
The average price that farmers received for the 2008/09 maize sales was Ksh 21.50.
However, results in Table 13 show that the price per kilogram varied widely across the
marketing channels, ranging from a low of Ksh 17.80 for sales to other farmer/trader to a
high of Ksh 26.20.
The average price per kg also varied by district, with Bomet having the lowest mean price of
Ksh 19.45 and Bungoma with the highest mean price of Ksh 24.03. In addition, there was
wide intra-district variation in price, with the difference between the lowest and highest
prices being as large as Ksh 61 in Bungoma district. Within Bungoma district, prices obtained
from individual farmers within the FGDs show that the most commonly received price was
Ksh 18, but the lowest price of Ksh 9 was paid by a small trader/wholesaler for a sale made in
the month of November.
Figure 7. Frequency of Maize Prices Received by Farmers in Trans Nzoia District in
May 2009
0
10
20
30
40
50
60
70
10 15 20 25 30 35 40 45
frequency o
f observ
ations
Source: Tegemeo/Michigan State University Maize Value Chain Survey 2009.
Note: Horizontal axis: maize price received in Ksh per kg

39
Table 14. Mean Maize Selling Price for Farmers Receiving vs. Not Receiving
Marketing Training, Kenya, May/June 2009
Category of farmers Mean price (Ksh per kg) Standard deviation
All farmers (n=450) 21.5 7.1
Received training (n=279) 22.1 7.2
Have not received training (n=171) 20.1 6.0
Source: Tegemeo/Michigan State University Maize Value Chain Survey 2009.
Even within the same areas, farmers received different prices, perhaps depending on their
ability to negotiate for a good price, and to hold onto some of their grain and sell it later in
the season. For instance, Figure 7 shows that farmers within the same location obtained
widely varying prices for their maize in the same month.
Prices also varied by whether farmers had received training or not. Table 14 presents the
prices received by farmers in May and June 2009 for KMDP training recipients vs. non-
recipients. KMDP recipients received 9.9% higher prices on average (22.1 shillings vs. 20.1
shillings per kg). To examine the training effect more precisely, we regressed these prices on
a training dummy variable, distance of the household to the nearest market town and a village
dummy to capture spatial price differences. Ordinary Least Squares (OLS) results indicate
that the KMDP recipients received, on average, 1.8 shillings per kg more than non-recipients
(a 9.2% price difference), significant at the 5% level.
For a farmer selling five bags of maize, the difference of Ksh 2 per kg is equivalent to Ksh
900 of additional profit. Although market training has not yet transformed farmers‘ groups
into effective cooperative marketing enterprises, it has had a measurable effect on farmers‘
understanding of the maize market and their ability to profitably and confidently participate
in it. Developing greater understanding and comfort within these dynamic and intimidating
markets is critical both for smallholder welfare and for the future development of the region‘s
maize market.
4.2.4. On-farm Storage Issues
On-farm storage of grain plays a vital function in ensuring household food security.
However, only 13% of the maize surplus-producing households surveyed in the focus group
discussions (n=450) stored maize for at least 4-5 months after harvest with an intention to sell
it later. In accessible villages, the mean percentage of households storing grain for more than
4-5 months was 11.4%, whereas in the villages defined as remote it was 14.9%. Figure 8
shows the frequency of households storing grain at least 4-5 months.
Those that stored maize for 4-5 months after harvest generally produced larger surpluses of
maize than their neighbors produce and had access to alternative income sources. These
findings indicate that most of the smallholder sector‘s surplus maize production is sold and in
the hands of traders and other downstream marketing actors within 5 months after the main
harvest. The implications of this are very different in areas benefiting from two harvest
seasons per year – in such areas, seasonal price rises are not as pronounced as in regions with

40
only one crop season, and therefore storage for many months may offer limited temporal
arbitrage opportunities.
Figure 8. Percentage of Farmers Storing Maize for at Least 4-5 Months after Harvest
in Accessible and Inaccessible Villages, 2009
020
40
60
0 10 20 30 40 50 60 70 80 90 100 0 10 20 30 40 50 60 70 80 90 100
inaccessible accessible
pe
rcen
t of vill
ag
es
percent of farmers who store maize for 4-5 months
Kenya
Source: Tegemeo/Michigan State University Maize Value Chain Survey 2009.
The depletion of maize grain supplies in the local markets very early in the season has
implications for food security, particularly in the period just before the next harvest. If there
is grain in the local markets, consumers can buy grain and utilize local posho mills to obtain
relatively inexpensive meal. However, later in the season, scarce maize supplies in the market
preclude rural households from utilizing this option. Therefore, consumers have to rely on the
relatively expensive meal from the commercial millers, which drives up the demand and
prices for this meal.
Farmers in the FGDs indicated that the primary reasons that households with surplus maize to
sell do not store maize for more than 4-5 months after harvest are as follows. First, grain sales
are a means of coming up with needed cash for school fees, land preparation expenses, the
repayment of debts, and other cash needs. The harvest provides a means for households to
meet these pent up needs for cash. Second, on-farm storage involves costs and it is not clear
that the seasonal increases in the price of maize are large enough to compensate for the
storage costs and losses that farmers incur. A third factor limiting seasonal storage has
traditionally been the pan-seasonal pricing of the NCPB. In the surplus-producing areas of
western Kenya, it made little sense for surplus-producing farmers to invest in storage (beyond
home consumption requirements) because the NCPB‘s pan-seasonal price offered no
incentives to store. The best strategy was to sell as soon as possible. While NCPB‘s direct
presence in the market has declined over the past 15 years, its prices still exert a major
influence on market prices (Jayne, Myers, Nyoro 2008). NCPB‘s operations appear to be

41
aimed, with some degree of success, in mitigating seasonal price rises especially in high-
priced years. All of these factors also induce maize wholesalers to cease their buying
operations during the lean season period in each region because there is very little surplus left
to buy at this time. Hence, the assembly traders who depend on quick resale to wholesalers
after buying from farmers also disappear from the market later in the season. Thus, farmers‘
options for selling maize dry up considerably after 5-6 months after harvest.
The limited storage of surplus maize by farmers therefore represents a wide range of factors
including farmers‘ needs for cash, cultural factors, discretionary government operations in the
market, and traders‘ responses to these various factors. We feel it is misleading to conclude
that limited storage incentives for farmers indicates that there is something wrong with the
market or with private traders‘ response to liberalization. We do agree that if it were possible
to provide the incentives and wherewithal for farmers to store grain on the farm further into
the marketing season, this could reduce marketing costs, and therefore, drive down the cost of
food for food-deficit rural households. Because of limited local storage in many areas, grain
surpluses tend to be sold and quickly distributed to urban areas for milling by large-scale
firms instead of stored for later sale locally. The lack of storage therefore increases the
outflow of grain from deficit rural areas and subsequent backflow, which leads to redundant
transport costs and higher food costs for consumers. However, recommendations to support
local grain storage through the establishment of village grain banks and warehouse receipt
systems have often failed because they did not identify the fundamental causes of limited
grain storage. Alternative options for overcoming the constraints on grain storage are
addressed in the discussion on policy options in Section 6.
4.2.5. Farmers’ Perceptions of the Major Problems with Selling Maize
Farmers in the FGDs were asked to enumerate three or four main problems that they face
when selling their maize. They overwhelmingly identified cost of fertilizer as the primary
problem, while lack of credit, poor road conditions, and access to fertilizer featured highly as
the important secondary problems. Other problems include storage losses and lack of buyers.
The high cost of fertilizer relative to the prices received for maize discourages the use of
fertilizer among small-scale maize growers, leading to low yields and small marketable
surpluses. Additionally, the lack of credit options forces farmers to rely on local loans from
other farmers and maize traders, and to sell their maize soon after harvest in order to repay
debts incurred and purchase inputs for the coming farming season. Of the 33 focus group
discussions carried out for this research, and the hundreds of farmers represented by these
groups, none had obtained a loan for their agricultural activities through the Agricultural
Finance Cooperation. Thus, a lack of financing remains a major obstacle to expanding
smallholder maize production. While farmers do not cite lack of a market as a critical
problem, they are highly constrained in their ability to produce a marketable surplus due to
lack of credit and high fertilizer costs. Opportunities to deal with these constraints will help
improve production and productivity of maize.
4.2.6. Farmers’ Perceptions of Maize Marketing Conditions and Welfare
Farmers were asked to indicate on a scale of 1 to 3 (1=better, 2=worse, and 3=same) how the
current maize marketing conditions compare to those existing 10 years ago. Nearly 70% of
42
the responses from the FGDs indicated that the marketing conditions had improved, with
little variation in terms of responses across the districts. However, the highest proportion of
those who felt that marketing conditions were worse is within Trans Nzoia district.
In answer to the question on whether most households were better off, worse off, or the same
in terms of their standards of living at the time of the survey as compared to 10-15 years ago,
responses showed an almost split in the middle, with about a half indicating that they were
better off, while the other half pointed out that they were worse off. The better-off households
were in Nakuru and Kisii districts, while the worse-off were mainly from Trans Nzoia and
Bungoma districts.
In addition, nearly 76% of the responses showed that farmers in the interviewed villages were
shifting their land and labor over time to other crops or farming activities. Unfortunately, no
information was elicited to determine what crops these farmers were shifting toward.
4.2.7. Access to Market Information
Farmers were asked questions that sought to determine whether the uptake of mobile phones
in rural areas improved their access to market information. They were asked to indicate on a
scale of 1 to 5 (1=no difference, 2=small improvement, 3=moderate improvement, 4=large
improvement, and 5=the most important development in the past 20 years), to indicate how
much owning a phone improved their price and their ability to locate a suitable buyer for their
maize. Nearly 67% and 50% of the responses revealed that owning a cell phone had little or
no improvement on the price they received for maize, or on their ability to find a buyer,
respectively. While the majority of farmers own mobile phones, few of them are successfully
exploiting this technology to look for buyers, to negotiate a price, or even to search for price
differences among buyers. This passive approach to marketing is perhaps the result of a
common belief among farmers that private buyers collude to set prices, making price
negotiation futile. Therefore, there is need for training programs to provide farmers with
knowledge and strategies for marketing their crops.
4.3. Assembly Traders
The assembly or small traders are the first commercial purchasers of maize in the value chain
and the most important marketing output for maize-selling households in most areas. There
has been substantial recent new entry into grain assembly. The year in which they started
operating the trader business ranges from 1985 to 2008, with nearly 57% of the 46 traders
interviewed having started operations since 2002. Nearly 76% of these traders buy maize
directly from farmers in one district only; another 13% purchase in two districts. This
indicates that the small traders hardly source for maize outside the districts where they live
and operate, and further that many of these traders are themselves farmers who bulk up
surpluses of neighboring farmers. These small traders are only able to purchase low volumes
of stock due to working capital constraints.
A response to the question, ―How many other traders purchase directly from farmers in this
village‖ showed great variation with a minimum of one, a maximum of 200 and a mean of
25. The results showed that 55% of the traders indicated that there are 10-50 small traders

43
buying maize grain directly from farmers in a village. Again, this clearly indicates that the
assembly traders are apparently pushing much deeper into rural areas and that the first stage
in the maize marketing system has become increasingly competitive over the years.
A majority of traders (96%) bought maize grain independently for themselves rather than as
agents for another trader. They purchased maize directly from farmers or farmer groups and
sold it mainly to wholesalers (67%) and consuming households in the area (20%).
Fifty-nine percent of the assembler traders do not store any of the grain they purchase from
farmers. The majority of the assembler traders sell quickly to wholesalers bulking up grain in
the district towns. They do this mainly due to liquidity constraints: after exhausting their
limited working capital buying maize, they cannot buy more until they sell their grain to
obtain more working capital. Concerns about uncertain future price movements were another
reason for limited storage as expressed by traders. Therefore, the majority of assembly traders
engage in quick-turnover operations. Quick-turnover operations make heavy demands on
transportation. It is noteworthy that the vast majority of assembler traders interviewed
indicated that it was not a problem to secure truck transportation services quickly.
Wholesalers are instrumental for the viability of these assembly traders because they provide
the means for assemblers to quickly sell and obtain fresh working capital to go back into the
hinterland and buy more maize from farmers. Without the wholesalers, assembly traders
could spend weeks or months with their working capital tied up while waiting for the
marketing board or another buyer to pay them.
Of the 41% of assemblers who do store maize, most of them store for less than a month to
avoid having their working capital tied up in inventory. However, a significant minority of
assembly traders, 26.3%, do store at least 40% of the grain they buy from farmers for at least
four months. These traders who store for at least 4 months were predominantly from Kisii
and Bomet districts, areas where a sizeable portion of the nearby population become maize
buyers later in the season after their production is depleted. Therefore, the strategy of these
few assembly traders appears to be to buy grain shortly after harvest from maize surplus
households in order to meet the expected maize demand later in the season from maize deficit
households in these same areas.
Because most assemblers do not store maize for any significant amount of time and sell
quickly to wholesalers, they tend to not be concerned with issues of storage, maize quality,
and moisture content. Indeed, from a small-scale farmer‘s perspective this is considered one
of their advantages. Wholesalers also appear to take only limited account of maize quality
and moisture content when paying assemblers. Because assemblers pay no attention to maize
quality, there is little incentive for farmers to bother either. These problems create many
downstream problems for millers and raise marketing costs as will be discussed later.
Those assemblers who did store maize indicated that if they were to store a 100kg bag of
maize for 6 months, its weight after 6 months would be 97kgs. If the difference in weight is
used as a rough measure of storage losses, then this indicates that few storage losses are
expected.
Most assemblers are content to make incremental profits on every bag of maize they sell and
as such are not willing to assume the risks associated with changing their business model,
such as storing maize and exploring alternative marketing options. The profits they get are in

44
the range of Ksh100 to Ksh400 per bag of maize (US$12 to US$48 per metric ton).
Additional profits are made by using relatively large tin sizes when buying maize and small
tin sizes when selling as indicated earlier (which would then inflate actual assembler margins
to the range of Ksh130 to Ksh520, or US$16 to US$62 per metric ton).
In addition to the proceeding general discussion, the small-scale assembler group can be
broken into three sub-categories: brokers, local assemblers, and external/iterant assemblers.
4.3.1. Brokers
Brokers work to connect external, large-scale buyers/wholesalers to local farmers. They
utilize knowledge of their local region to locate maize, negotiate prices with farmers, and
assemble sufficient quantities of maize for the principal buyer. Once they have assembled
enough maize they will notify the external buyer, who will send a lorry to collect it. Because
they simply act to connect farmers with buyers, they do not need or use any type of storage
facility. Aside from a mobile phone, there are no start-up costs to enter into this business.
What a broker needs is local knowledge and external connections. By using brokers, large-
scale buyers lower the transaction costs associated with purchasing maize from small-scale
farmers. Because large-scale buyers tend to concentrate their buying efforts in a particular
region only through the main harvesting period, brokers tend to be seasonal market actors.
According to interviews with both large-buyers and brokers, brokers charge Ksh 5-10 per 2
kg tin of maize they assemble. In Kenya, 40 tins are assumed to be equivalent to a 90kg bag.
Thus, the use of a broker adds Ksh 200-400 to the price of a bag of maize.
4.3.2. Local Assemblers
Local assemblers are generally farmers who utilize the income generated from their
agricultural activities to finance maize purchases and to rent or build small temporary storage
facilities. These facilities are either concrete or wooden structures with tin roofs. In general,
local assemblers change their buying and selling practices in response to the seasonal
agricultural cycle. During the harvest period, local buyers are busy assembling maize from
small-scale farmers. Because of serious capital constraints, the maize they acquire is sold as
quickly as possible to a wholesaler. This quick sale allows them to continue to make
purchases throughout the harvest period. In general, local assemblers expect Ksh 100-200
profit per bag of maize they sell to wholesalers. The profits they make from each sale allow
them to expand their purchases or to compensate for price rises. When selling, larger local
buyers can generally acquire enough maize to fill a lorry, at which time they will notify a
wholesaler, who will come to purchase it. However, the majority of local assemblers do not
have sufficient capital to purchase the 150 bags needed to fill a lorry. Those without the
resources to purchase larger quantities of maize depend on mobile wholesalers, who bring
lorries into rural areas during the harvest period to acquire maize. Local assemblers often
have informal relationships with wholesalers in regional urban centers. Through these
relationships, assemblers can determine prices and inform wholesalers of locally available
surpluses.
Near the end of the harvest period, local assemblers frequently change their business
practices. With the profit made from earlier sales, local buyers will begin to accumulate

45
maize that they will store and then sell back to local consumers as local scarcities set in. Of
the three types of primary assembler, local buyers are the only ones who will store maize for
a significant amount of time. Thus, they perform a valuable function within their
communities, as many maize farmers will become maize buyers before the next harvest.
Additionally, unlike brokers or external buyers, local buyers will continue to buy maize
throughout the year. This is another valuable function they perform, because when farmers
need to generate cash, they frequently rely on these buyers to sell small quantities of maize to
later in the year.
4.3.3. External/itinerant Buyers
These buyers often use donkeys or bicycles to cover larger geographic areas than the other
categories of primary assemblers. Additionally, they can access regions where it is difficult
for trucks to enter. Some, such as the donkey carts that are common around Bomet and
Transmara, normally cover huge geographic areas. They frequently purchase maize directly
from farmers and then transport it, sometimes for days, to urban markets or the tea
plantations around Kericho. Others, like the bicycle traders in Trans Nzoia and Bungoma,
purchase maize directly from farmers and transport it to urban markets within the district.
Like the other primary assemblers, capital constraints and the risks associated with storing
maize mean that these buyers never store maize longer than it takes to find a buyer. Like
other assemblers, they expect a Ksh 200-400 profit per bag of maize they acquire.
4.4. National Cereals and Produce Board (NCPB)
With its substantial storage assets and government-backed purchasing power, NCPB
continues to play a major role in Kenya‘s maize markets. The NCPB‘s role in the market
appears to be correlated with expected production. NCPB tends to be more active after a good
harvest when market price levels are expected to be low. NCPB takes a less active role in a
poor production season, as during the 2008/09 marketing season in which our interviews
were conducted. Interviews with NCPB managers in Bomet, Kisii, and Trans Nzoia indicate
that only the depot in Trans Nzoia bought maize during the 2008/09 harvest period. The
reasons for this diminished role include uncompetitive pricing relative to private marketing
channels, which made it difficult to attract maize from farmers and traders, and low
production throughout the major maize growing regions. This low production is attributed to
a combination of residual effects from the post-election violence of 2008 and a subsequent
drought. According to data collected for this report, only six of the 450 maize transactions
recorded from small-scale farmers went through NCPB. Additionally, only 7% of the total
maize marketed through the wholesale sector went to NCPB (Table 16 in Section 4.5
During the period of fieldwork for this report, NCPB depots acknowledged that they were
holding stocks of imported maize. However, all NCPB depots had been ordered by the
government to stop selling maize to either consumers or mills, despite escalating maize prices
throughout the region. None of the depot managers interviewed could explain the reason
behind this sales ban. Under normal conditions, NCPB depots sell maize to individuals at
their warehouses. These individuals are primarily retailers, who will then divide the bags for
onward sale to consumers. Additionally, when mandated by the government, NCPB will sell
maize to milling companies.

46
In addition to being a major maize buyer, NCPB owns the majority of high-tech grain storage
in Kenya. The private sector and individual farmers can rent this storage for Ksh 10 per
month per bag. In addition to storage services, NCPB offers fumigation, drying, and bagging
service. NCPB fumigates maize brought to their silos but can also go to an individual‘s
storage area to spray. These services, however, are not widely utilized. Of the 36 wholesalers
interviewed for this report, only Lesiolo Grain Handlers, a large-scale grain trading and
storage firm located in Nakuru, rented storage from NCPB. The vast majority of wholesalers
were either unaware of rental opportunities with NCPB, felt it was too costly and risky to
store maize with NCPB, or simply did not store maize. Thus, while high-tech maize storage is
available through NCPB in most rural district capitals, these facilities are not being put to
use. Obstacles preventing the use of these facilities include the perceived risks associated
with storing maize, particularly price volatility and storage losses. Therefore, an expansion of
private storage facilities may not be the answer to Kenya‘s erratic maize market if available
storage is not being utilized.
4.5. Wholesalers
Wholesalers are traders operating in the district towns who purchase maize from the
assemblers. They serve as a critical link in the maize value chain. Wholesalers acquire most
of their maize from primary assemblers, but also buy directly from farmers and maize
importers.
Thirty-six of these traders were interviewed, most of whom were found in Bomet and Trans-
Nzoia districts. The year in which their operations started spans the period 1984-2009, with a
majority of the wholesalers starting up between 1997 and 2002. These traders have been in
operation longer compared to the small traders. Perhaps this reflects the tendency of the latter
to graduate into wholesale firms as their businesses expand, and also because wholesale
traders appear to have entered into the grain trading system more quickly after liberalization
than most assemblers, who require the presence of a nearby wholesaler to perform their main
operations, i.e., the quick turnaround sales from farmers to wholesalers.
Nearly 33% of these traders bought maize from three districts, while 19% bought from four
districts in the previous year. Therefore, unlike the assemblers, their purchases cover a wider
geographical area, clearly indicating the role of liberalization in enabling private traders to
transport maize across districts after the government eliminated movement and price controls
on maize trading in the early 1990s. Although wholesalers are not geographically bounded
and are extremely flexible in their buying and selling operations, most wholesalers maintain a
permanent presence in major surplus areas, including Trans Nzoia, Molo, Uasin Gishu, and
Nakuru, while having only a seasonal presence in places like Bomet and Kisii. Additionally,
wholesalers maintain a permanent presence in major urban areas such as Mombasa, Kisumu,
and Nairobi. Wholesalers tend to purchase maize in surplus areas during harvest periods and
sell maize directly to milling companies or to consumers in deficit regions through local
retailers.
Most wholesalers use their own trucks, while some will rent trucks, to acquire maize from
primary assemblers in surplus regions. Maize is purchased either through brokers, local
assemblers, or directly from farmers. In a few cases, wholesalers will forward money using

47
M-Pesa to local buyers and brokers in surplus areas to ensure that they are able to acquire
adequate stocks.
Table 15. Proportion of Maize Sold by Wholesalers within and outside the Districts
District
Market to which trader primarily sells maize
July 2008 to June 2009 March-May 2009
Within district Outside district Within district Outside district
Trans Nzoia 12.5 87.5 12.5 87.5
Nakuru 0.0 100.0 50 50
Kisii 66.7 33.3 100 0
Bungoma 60.0 40.0 80 20
Bomet 38.5 61.5 46.2 53.8
Machakos 66.7 33.3 66.7 33.3
Average 36.1 63.9 50 50
Source: Tegemeo/Michigan State University Maize Value Chain Survey 2009.
Their sales are also either within or outside the district, and the proportions sold to these two
locations vary by district and time of the year. The peak maize marketing period is usually
between December and March, while the months of March-May correspond to the low
season. During the low season, there are very few seasonal maize traders since most of them
have shifted to other business activities. Therefore, at this time, most of the grain in the rural
areas is expected to be in the hands of medium-scale wholesalers and larger traders, who have
the capacity to store maize for longer periods. Overall, about 64% of sales by medium-scale
wholesalers in the 2008/09 year were primarily outside the district of their operations (Table
15). The proportion of wholesalers‘ sales within and outside the district of operation varies
depending on the district.
For example, while the majority of the wholesalers in Trans Nzoia, Nakuru, and Bomet
districts sold their maize primarily outside their districts, those in Kisii, Bungoma, and
Machakos sold it mainly within the districts. This clearly reflects a flow of maize from the
surplus regions of Trans Nzoia, Nakuru, and Bomet into other districts that are more likely to
be maize deficit areas. In addition, during the low maize season when demand for grain is
high in the rural areas, most wholesalers in the maize deficit zones tend to sell
overwhelmingly within the district and those in the surplus areas sell relatively more outside
the district.
Table 16 shows the percentage of maize sold by medium-scale wholesalers through various
channels in the 2008/09 year and the March-May 2009 period.

48
Table 16. Percentage of Maize Sales by Medium-scale Wholesalers to Different Buyers
by District
District
Millers Traders NCPB Retailers Other channels
Trans Nzoia 63 1 29 6 -
Nakuru 55 11 - 34 -
Kisii - 33 - 40 27
Bungoma 38 - - 44 18
Bomet 12 31 - 53 4
Machakos - 42 - 57 2
Overall 30 19 7 39 6 Source: Tegemeo/Michigan State University Maize Value Chain Survey 2009.
In 2008-09, retailers served as the primary channel through which wholesalers marketed their
maize. Retailers, who operate in central marketplaces, buy maize from wholesalers and then
sell it in small quantities to local consumers. Wholesalers will often transport their maize to
various marketplaces on particular market days and sell their maize from the back of their
trucks to retailers. This is a low risk, high return marketing strategy. Prices in local markets
are verified prior to transporting maize, though competition between wholesalers in the
market can drive prices down, and retailers will buy even the lowest quality maize, though
badly damaged maize will bring a lower price. All the wholesalers interviewed during market
days indicated that they had no problem selling out their entire stocks in one day at a market.
Conversely, selling maize directly to milling companies can be a risky endeavor. During
harvest periods, trucks can queue for more than a day waiting to sell maize to milling
companies. This is costly both in terms of opportunity costs, as the truck has to sit idle at the
mill rather than be used to acquire maize, and in terms of lodging and food expenses. Once
their trucks have passed through the gate there is no guarantee that their maize will meet the
mill‘s quality demands, and therefore may not be purchased. Finally, several wholesalers
recounted the experience of waiting in long queues at the mill only to find that the mill‘s
buying price had dropped while they waited. To overcome these risks, several wholesalers
indicated that they hired a broker, who, for around Ksh 1000, can move their truck up the
queue at the mill and can ensure that maize meets quality standards. This illicit system serves
as a major barrier to entry for wholesalers without brokers, and by extension small-scale
farmers‘ maize, to reach the formal milling sector. As a result, many wholesalers avoid the
commercial milling sector entirely, and instead focus on retail whole grain markets.
Other marketing channels include selling to other traders and selling through NCPB.
Wholesalers who are located in rural market areas and do not own trucks will frequently sell
maize to other traders, who will then transport that maize to deficit regions. These
wholesalers will also frequently service their own regional markets by selling maize back to
local retailers as maize scarcities set in. Few wholesalers sold maize to NCPB in 2008-09
because most NCPB depots in our sample areas were not buying maize, or if they were
buying, they were offering prices below the prevailing market price. Only wholesalers
located around Moi‘s Bridge sold maize to NCPB in 2008-09.
Despite the challenges of selling maize to the milling sector and the advantages of selling
through retailers in local markets, wholesalers do adjust their buying and selling behavior
based on seasonal supply and demand conditions. During major harvest periods more

49
Table 17. Percentage of Maize Sales by Medium-scale Wholesalers to Different Buyers
from March-May 2009
Buyer % of maize sales to buyer
Millers 15.5
Other traders 12.8
NCPB 4.7
Retailers 63.6
Other channels 3.4
Total 100.0
Source: trader survey data collected for this study, 2009 and 2010. ?
wholesalers sell their maize to milling companies. However, as time passes from the harvest,
and deficits begin to set in around the country, wholesalers turn their attention even more to
the retail market (Table 17). This change in practice is the result of several factors. First, as
noted above, retail markets are easier to navigate and less risky. Second, because so little
maize in Kenya is treated to prevent pest damage, the quality of the maize that wholesalers
can acquire more than several months after the harvest is very low.
Finally, if the variable import tariff is low or waived, then mills may begin to import high
quality, low-cost maize from abroad, which wholesalers find difficult to compete with. Under
such conditions, during the months of March, April, and May an even greater percentage of
the maize being handled by wholesalers goes through retail, whole grain markets.
Because the majority of wholesalers do not store maize after harvest to meet local demand
during scarcity periods, they must acquire it from outside of their regions as scarcities set in.
Wholesalers will purchase maize from importers in Mombasa as well as from Tanzania,
where maize is smuggled across the border at the Sirare border crossing. As a result, even in
major surplus regions like Nakuru, imported maize from South Africa was being sold in the
wholesale market in June 2009. In Bomet, maize from Tanzania and South Africa was being
sold in May. Thus, consumers in major maize supply regions pay the price for a system in
which maize is transported out of their region after harvest and then must be transported back
in only a few months later.
When buying, selling, or transporting maize within a particular district, a tax, called cess, is
charged to wholesalers. In general, this fee equals about Ksh 20 per bag of maize. Because
districts have recently been divided, the amount of cess a wholesaler must pay when moving
from a buying to a selling point has risen dramatically. In addition to cess charges,
wholesalers are invariably charged fines by police at checkpoints along the highway.
Wholesalers complain that regardless of the condition of their truck, police will find a fault
with it or they will accuse the wholesaler of transporting illegal goods and demand that the
truck be unloaded. To avoid the time and cost of unloading the truck or hassle of contesting a
formal fine, wholesalers simply bribe the police. The total additional transport costs
associated with bribing police ranges between Ksh 1000-2000. This figure depends on the
number of checkpoints encountered on a journey. All this has a significant effect on the
consumer price of maize, as wholesalers incorporate these costs into their selling price.

50
4.5.1. Wholesalers’ Storage Behavior
Nearly 53% of the wholesalers own storage facilities, while the remaining ones rent storage
space. Wholesalers interviewed for this report indicated that a lack of financing, fear of
storage losses, and the potential for unanticipated seasonal price movements prevent them
from storing maize. Instead of storing maize from the harvest to the lean season, most
wholesalers buy and quickly sell maize for a marginal profit of Ksh 100-200 per bag.
Majority of the wholesalers indicate that there are adequate storage facilities to rent. Because
of the prevailing practice of minimizing storage time, adequate storage for most wholesalers
is a room with a roof on it that is secure from theft. In this sense, adequate storage has
nothing to do with managing maize stocks in a rigorous way to prevent pest damage and to
ensure quality.
Many traders indicate that risks of government stock releases or a sudden waiver of import
duties impedes incentives to store grain from the harvest to the lean season. Traders storing
grain in anticipation of benefiting from seasonal price rises may find the value of their stock
deteriorating after an announcement that import duties will be waived or if the NCPB releases
stocks on the market at a steep discount. For these reasons, a lot of grain is purchased at
harvest, contributing to low prices at this time, and less grain is stored for consumption later
in the season, thus contributing to higher prices in the lean season. Because of traders‘
reticence to store for any significant period of time, seasonal price rises tend to be artificially
high, except in years that the government takes steps to reduce prices in the market. Hence
there is something of a vicious cycle in which traders are reluctant to store, which contributes
to high seasonal price rises, which then invites government to intervene to push down prices,
which then further depresses traders‘ incentives to store. Section 6 discusses possible means
to address these strategic interaction problems.
4.6. Nyamakima Wholesale Market
Nyamakima is a wholesale market in Nairobi, which has many grain wholesalers and two
larger posho mills. During the month of September 2009, most of the whole grain maize
available in the market was coming from either Bomet or Sirare, Tanzania. This maize was
being purchased from traders by retailers in the market at an average price of Ksh 2400-90 kg
bag. It was then being disaggregated and sold to consumers at a price of Ksh 35-40/kg.
Wholesalers in the market indicated that although they were able to access imported maize
from Mombasa for a relatively cheaper price of Ksh 2300-90 kg bag, most declined to buy
imported maize because they felt that consumers would reject it. The reason for this is tied to
an incident that had occurred earlier in the year (2009), when imported maize was found to
have high levels of a toxic chemical and was removed from the market. As a result,
consumers feared eating imported maize and were willing to pay a premium for locally
produced maize.
Despite the rejection of imported maize by local consumers, the posho mills in the market
were buying and milling imported maize. This maize, however, was disguised within their
warehouses, where it was removed from its labeled bags and put in local bags. These posho
mills were grinding maize and selling packaged products in 5, 10, 20, 45, and 90 kg bags.
The price of a kg of milled maize from these posho mills ranged from Ksh 34-40 per kg, a
price lower than that of the sifted maize from large-scale companies, which was selling for

51
Ksh 44 per kg. The maize flour being sold by these posho mills was normally bought by
schools and retailers in the slum areas, where it was disaggregated and sold to consumers in
smaller quantities.
4.7. Large-scale Millers
This section reports on the discussions that were held with some large-scale maize millers
during the time of the survey.
In Kenya, four major milling companies and their associates account for 80% of the total
sifted maize production in the country (Kenya Maize Handbook 2009). These mills are
located primarily in major urban, deficit areas, such as Nairobi, Kisumu, Thika, and
Mombasa. In addition, milling is done in surplus areas, including Eldoret and Kitale.
Throughout Kenya, large-scale milling companies form strategic business alliances, thus
leading to a consolidation of the industry.
During normal production years, millers buy maize from Kenyan farmers and traders to meet
their own consumption demands through April, after which time some of them turn to NCPB
to meet their maize requirements. Some millers have tried to set up buying centers in rural
areas to better facilitate maize acquisitions. However, these buying centers are difficult to
manage and are open to corruption. As a result, most of the locally produced maize procured
by millers is purchased at the mill gate. Farmers and traders indicate that a great deal of
corruption exists at the gate of many mills, particularly at the level of gate security and
quality testing.
During the time of the survey, millers were 100% reliant on maize imports to meet their
milling requirements. Importing of maize in Kenya at that time was facilitated by the removal
of import tariffs, which are normally 50%, which was to be in place until January 2010.
Depending on shipping traffic in South Africa and Mombasa, maize imports can take
between 3-10 weeks to arrive in Kenya. One of the primary bottlenecks to maize imports
during high import periods like that experienced in 2009 is transport access from the
warehouses in Mombasa to Nairobi. High levels of competition for transport contribute to
higher than normal transport cost for delivering maize to Nairobi. During high import
periods, large-scale importers, including commodity traders and millers, are usually given
preferential access to port berths and thus imported maize. As a result, much of the informal
sector is denied access to imported maize, until the large companies have met their
requirements, at which time imported maize becomes more available to smaller scale traders
and the informal maize market. The smaller millers have devised marketing strategies to fight
off competition from the large-scale milers. For instance, because of their relatively small
size and limited capital, smaller millers join up and import maize collectively through one of
the large traders. Despite having relatively easy access to imported maize, some of the mills
were running at only 30% of their maize milling capacity during the time of the survey. They
indicated that this dramatic drop could be the result of decreased consumption of maize meal,
which in turn was a reflection of the high cost of maize and maize flour.
Some of the large millers own very little grain storage, with most of their warehouse and
storage facilities being rented from either private owners or NCPB. Reliance on rented
facilities adds additional costs to their operations. Additionally, limited storage, along with

52
some capital constraints, prevent such millers from acquiring all of their annual maize
requirements directly. Even in normal years, they depend on NCPB to make up for any
shortfalls. However, some millers do have sufficient storage capacity to meet their annual
milling requirements. Grain purchases are financed primarily by securing overdrafts from
local banks. As such, capital is not considered a major constraint for their business. Instead,
issues of power shortage and large demand fluctuations are seen as major constraints to their
business.
Milling companies in Kenya buy maize at their mill gate from a handful of agents, large-scale
farmers, and other direct purchases. They rarely develop buying networks in rural areas,
though some will set up satellite depots in major surplus regions. Mill managers interviewed
for this report indicate that several obstacles prevent them from purchasing maize beyond the
mill gate. First, stringent quality and moisture controls, which can be carried out at the mill,
cannot be maintained effectively in rural areas. Second, payments are done with checks,
which can only be issued at the mill. Thus, payments can be severely delayed at buying
centers, which discourages maize sellers. As a result, most mills purchase maize only at their
mill gate. The majority of this maize comes from large-scale farmers and larger wholesalers,
who can easily meet the quality demands at the mill.
Wholesalers interviewed for this report indicated that quality demands and long queues at the
mill prevented them from selling maize to large-scale mills. Others reported having to use
brokers to help them quickly pass through the mill gate and to ensure that their maize meet
quality standards. Mill managers agree that corruption at the mill gate is a problem and that it
is difficult to regulate. When complaints are made these are followed up on, but otherwise the
system operates outside of the direct control and supervision of the mill managers. This
serves as a major obstacle to incorporating small-scale farmers into the formal maize market.
If quality barriers are indeed determined by an ability to pay, rather than by objective
measurements, then only the most savvy and well-connected traders and large-scale farmers
will be able to profitably sell maize to large-scale mills. In addition, little incentive will exist
for small-scale farmers to focus on producing high quality maize if it is not quality per se that
determines whether a mill will accept maize from an individual.
Mills generally buy maize aggressively during the harvest period, using price incentives to
attract sellers when their stocks are low. Mills interviewed for this report have silos that can
store up to 5 months of reserve stocks. On average mills try to maintain at least 3 months of
stock in their mills at all times. Once locally available maize stocks have been depleted, mills
then begin to import maize or buy from NCPB, depending on the prevailing political climate.
In June 2009, the Government of Kenya indicated that it would waive import duties on maize
until December 2009. Mill managers welcomed this development and said that they would
import maize aggressively until December. The result, as one mill manager pointed out, is
that as the major maize producing regions in Kenya begin to harvest maize in October, mills
would have large stocks of imported maize and would not buy local maize aggressively.
Thus, it was anticipated that producer prices for maize in December 2009 and January 2010
could be quite low throughout Kenya. However, this was not the case; grain prices were high
during this period.
Large-scale mills produce a variety of maize products, principally sifted maize flour. These
products are then sold through regional wholesaling networks. Prices are determined by
prevailing regional market prices and not by specific costs associated with transporting flour

53
from the mill to a given location. Thus, if a number of mills are competing in a specific
region the prices can be quite low and margins small, while in other regions, where
competition is minimal, prices will be higher and margins larger. Because of this pricing
system, sifted maize prices may even be more expensive in the town where the mill is located
than in Nairobi. While most large-mills traditionally focus on selling small retail packets of
maize flour, an increasing number are expanding into wholesale operations by selling sifted
flour in 50-90 kg bags. This change had previously been resisted because large wholesale
bags of maize flour are divided up by retailers and sold to consumers in unmarked plastic
bags. This makes branding and brand recognition impossible. However, rising maize prices
and increasing competition from small-scale mills that produce wholesale maize flour has
pushed large-scale milling companies into the wholesale market.
An emerging pattern is that wheat now dominates some of the millers‘ operations, which
reflects broader trends in urban Kenya, where bread consumption is slowly surpassing that of
maize. This issue is explored further in a subsequent section.
4.8. Small-scale Posho Millers
The small-scale posho milling sector in Kenya accounts for about 60% of the total maize
meal processing in the country (Kenya Maize Handbook 2009). The posho milling sector is
also one of the fastest growing sectors of the maize value chain. According to interviews
conducted with small-scale mill owners (n=7), the number of small-scale mills has increased
over the last five years in every region under investigation. While this competition, coupled
with an expansion of more efficient, electric powered mills, has driven down the cost of
milling to Ksh 5-10 per 2.5 kg tin, it has also led to an under-utilization of fixed costs,
including machines and labor.
Small-scale millers indicate that their mills can process 30-40 bags of maize a day. However,
most do not come close to this figure. On average, small-scale mills operate at about 10%
capacity, processing 3-4 bags of maize per day. This under-utilization is the result of
excessive local competition, for example, one small village may have three mills operating in
close proximity to each other.
Most small-scale mills are not major buyers or sellers of maize, though many do keep some
maize stocks on hand to sell to customers. Due to financial constraints, those millers that are
active buyers of maize during the harvest period rarely do so in order to increase their own
stocks. Instead, during the harvest period these mills act as assemblers of maize and sell their
stocks to wholesalers. Thus, posho mills rarely have their own stocks of maize to mill.
Instead, the majority of mill owners simply offer milling services to customers who provide
their own maize. Those mills that do purchase maize do so through wholesalers and thus do
not offer competitively priced maize relative to other local options. Because of this business
model, both mills and labor often sit idle until a customer arrives to grind maize.
Some mill owners have begun to challenge the predominant fee-paying business model by
selling processed maize flour. Several of these mills have also invested in de-hullers and can
therefore produce sifted maize flour, which can compete with the large-scale milling sector in
terms of quality. A handful of mills, with the necessary financial resources and business
savvy, have begun to purchase increasingly large quantities of maize during the harvest

54
period, which they store until local scarcities drive up demand. By storing maize locally and
selling it in the form of processed maize flour, these mills can provide a high quality product
at a far lower cost than their large-scale competitors. Additionally, posho mills that process
their own maize can sell maize flour in ½ kg packets, which large-scale mills do not offer.
This is an important niche market, as many customers cannot afford to buy larger packets of
maize flour.
Significant investment in expanding the business expertise, storage capacity, and purchasing
power of small-scale mills presents a real opportunity to stabilize maize prices in maize
production areas. By encouraging these mills to become more active buyers of maize, local
demand for maize during times of scarcity can increasingly be met by these mills rather than
by wholesalers, who transport maize out of production areas during the harvest and back into
these same areas as scarcities increase. Additionally, by buying and processing their own
maize, posho mills can increase their production capacity and maximize the fixed cost
utilization of their equipment and labor, which could drive down the unit price of milling.
Finally, by becoming more active buyers within their local market, posho mills can provide a
new marketing channel for farmers who today are almost entirely dependent on small-scale
assemblers.
4.9. Consumers
A study by Muyanga et al. (2005) examined the consumption patterns of the main staple
carbohydrate products in Nairobi (maize, wheat, rice, and cooking bananas) with the aim of
updating policy makers‘ knowledge of current urban food consumption patterns.
Their findings showed that maize was the primary staple food in Nairobi in terms of
kilograms consumed per adult equivalent. Nearly 97% of the respondents reported to have
purchased maize products (maize meal, grain or green maize), while 12% indicated that they
obtained maize grain or green maize either from relatives or their own farms in the rural areas
during the month preceding the survey. A much smaller proportion (2%) of respondents
obtained maize products from their urban gardens. However, findings indicated that
households in the poorest income quintile consumed the most maize, with the consumption
declining by 7% for households in the wealthiest income quintile. In addition, the importance
of maize in urban staple grain diet was shown to have declined by 22% from 58% share in
staple food in 1995 to 45% in 2003.
The study further showed that maize accounted for 59 and 38% of the staple carbohydrate
consumption among the 20% poorest and richest households, respectively. Therefore, maize
remained the dominant staple food among the urban poor. However, the richer urban
households who are in the top 40% of the income distribution consumed more wheat than
maize. Over time, the consumption of wheat products had grown, particularly among these
higher income groups, with its share rising by 17% from 25% in 1995 to 31% in 2003. In
addition, among the urban respondents, wheat consumption accounted for 22 and 38% of the
staple food consumption of the 20% poorest and richest households, respectively.
The results also showed that on average, although maize products provided the greatest
contribution to Nairobi staple food diets in terms of kilograms consumed, there was a shift in
consumer expenditure patterns from maize to wheat. By 2003, wheat was the dominant staple

55
in terms of expenditure, accounting for 43.5% of total expenditures on the main staples
compared to 32.4% of maize‘s contribution, which had declined from 41.8% in 1995.
However, expenditures on maize products exceeded those on wheat only for households in
the bottom two-income quintiles (40% of the poorest households in Nairobi), but wheat
dominated expenditures for the top three income quintiles.
Moreover, the results also revealed a significant shift in maize meal consumption patterns.
There was a decline in the consumption of posho meal, although it remained very important
among the relatively poorer households. This was attributed to a decline in the price
difference between sifted meal and posho meal perhaps resulting from greater competition in
the milling sector due to the maize market liberalization. The liberalization of the maize
market led to the development of many small-scale posho mills that provided great
competition for the large-scale millers. In response to this, the large millers reduced the
degree of flour refinement in order to cut down their costs. Consequently, the prices of maize
meal have declined, thus reducing the price difference between the posho and sifted meal.
This shift in maize meal consumption patterns may have led to a decline in the market share
of the posho millers, which was high in the period immediately following liberalization.
Overall, the changes in urban consumption of maize indicate that liberalization has helped to
bring competition in the milling industry, thus putting a downward pressure on maize meal
prices.
4.9.1. Consumers’ Use of Alternative Marketing Channels for Primary Staple Products
Nairobi consumers use a range of alternative marketing channels for procuring their main
staple food products. These include duka shops (small retail stores), large national
supermarket chain stores, smaller supermarkets, open markets, kiosks (stalls), and posho
millers. Table 18 presents the importance of various retail channels by which urban
consumers procure their primary staple products. The table also shows the respective values
of primary staples (maize products, rice, wheat products, and cooking bananas) purchased
from each retail channel. Staples worth Ksh 473 million, representing 50% of the market
share, are sold through duka/shop in a month. Large supermarkets follow handling 17% of
the market share valued at Ksh 160millions in a month. Other important channels include
small supermarkets (12%), markets (10%), and kiosks (9%).
The importance of these retail channels varies substantially by income. The majority of the
households (64%) in the poorest income quintile prefer duka/shops, spending Ksh105 million
in a month on this channel (Table 18). Open markets are the next most important means by
which the poorest consumers obtain staple products, accounting for 14% of their
expenditures. Among the second poorest income group, the most important retail outlets are
dukas/shops, roadside kiosks, small supermarkets, and markets. Only among the top income
quintile did national supermarkets account for more than 20% of total expenditures on the
main staple food products. Among this relatively wealthy group, duka/shops accounted for
38% of expenditures on the top four staples, while the national supermarkets accounted for
37%.

56
Table 18. Consumer Expenditures (Ksh Millions) and Market Share (%) of Alternative
Retail Channels for Primary Staple Products (Maize, Wheat, Rice, and Cooking Banana
Products), by Income Group, 2003
Retail Channel
Income Quintiles
Total 1(Lowest) 2 3 4 5 (Highest)
Ksh % Ksh % Ksh % Ksh % Ksh % Ksh %
Duka/shop 105 64 81 49 94 57 105 47 88 38 473 50
Large supermarket 7 4 11 7 17 10 40 18 85 37 160 17
Small supermarket 14 8 22 13 28 17 20 9 26 11 111 12
Market 23 14 17 10 15 9 30 13 10 4 94 10
Kiosk/kibanda 10 6 29 18 7 4 24 11 18 8 88 9
Posho mill 6 4 4 2 3 2 2 1 0 0 16 2
Other6 1 1 2 1 1 1 0 0 4 2 8 1
Total 165 100 165 100 166 100 222 100 231 100 950 100
Source: 1995 and 2003 Tegemeo Institute/Michigan State University Urban Household Surveys
Considering the different retail channels specifically for sifted maize meal, we find that about
60% of the 20% poorest and the wealthiest obtain their supplies from duka/kiosk and large
supermarkets, respectively, even though there does not seem to be a marked difference in the
retail price (Figure 9).
Figure 9. Alternative Retail Channels for Sifted Maize Meal, 2003
0
10
20
30
40
50
60
70
80
1(Lowest) 2 3 4 5 (Highest) Mean Price
Tot
al N
umbe
r in
the
Inco
me
Gro
up (
%)
Shop/Kiosk Small Supermarket Large Supermarket
Source: Tegemeo Institute/Michigan State University Urban Household Survey 2003.
6 Hawker, manufacturer, factory, green grocer, neighbor, bakery, place of work, and colleagues.

57
Small supermarkets are offering a slightly lower price, yet only about 18% of Nairobi
consumers are using them as their main source of staple food products. The majority of the
households (70%) consuming the highly refined brand (Hostess) procure it from large
supermarkets while 15% buy from small supermarkets.

58
5. MAIZE PRICES AND MARKETING MARGINS
This section explores the evolution over time in vertical maize marketing margins.
Vertical margins are defined as the difference between prices at different stages of the supply
chain and represent the portion of the final price absorbed by traders, assemblers, millers,
transporters, etc. Margins between the farm-gate and rural wholesale prices represent the
margin accounted for traders and assemblers in rural areas. Margins between rural wholesale
markets and urban wholesale markets represent the portion of the final price paid to
assemblers and transporters. Finally, the difference between wholesale maize grain and retail
processed maize prices provides the margins to millers and retailers in urban areas.
An assessment of competition, or lack thereof, can be obtained by comparing the margins
with the costs involved at each stage. However, estimating the full range of costs at each
stage can be difficult, and is beyond the scope of this study. Nevertheless, some conclusions
can be derived by examining the evolution of marketing margins over time.
In general, we find that margins at all three of these levels appear to relatively small and are
diminishing with time. These observations signal that farmers are receiving a higher
proportion of the final consumer price of maize meal over time. We also find that consumers
are benefiting from lower retail maize meal prices. Between the early 1990s and 2008, the
kilograms of maize grain and meal that was affordable with a daily wage has been rising
steadily for the various employment sectors for which data is available. As a caveat to the
general story, however, farmers in remote villages receive lower prices for their grain
compared to farmers in more accessible areas and within-village price variation is substantial.
A number of potential reasons for these two observations are explained below.
A reduction in margins can occur for two reasons: (1) reductions in the cost of doing business
and (2) increased competition among intermediaries. Marketing margins should reflect the
cost of moving a good from surplus to deficit areas as well as the costs of storage and
processing from one stage to the next in the value chain. When a reduction in margins is
observed, this could naturally follow from a reduction in the cost of transportation or
transformation. For example, efficiency gains in milling technology should result in lower
milling margins assuming that the milling industry is competitive. However, if a particular
stage of the supply chain is highly concentrated, then reductions in marketing costs may not
result in reductions in marketing margins.
5.1. Margins between Farm-gate and Wholesale Maize Grain Prices
Very few studies have been carried out on maize marketing margins between farm-gate
prices and wholesale prices because of the paucity of farm-gate prices in the region. Market
information systems in the region routinely collect wholesale or retail prices only. To
overcome this problem, this study interviewed 450 farmers who sold maize in the 2008/09
crop season from 33 villages. These villages were then matched up with the wholesale
markets that they feed into to compute farm-gate to wholesale margins.

59
Figure 10. Farm-gate and Wholesale Maize Grain Prices in Eldoret
0
400
800
1200
1600
2000
2400
2800
2007:01 2007:07 2008:01 2008:07 2009:01
nom
inal K
sh p
er
90kg
bag
wholesale maize grain, Eldoret
farm-gate price
received by farmers
in Eldoret district
Source: Tegemeo/Michigan State University Maize Value Chain Survey 2009; Tegemeo Rural Household
Survey 2007.
The evidence points to generally declining margins between farm-gate and wholesale maize
grain prices. Figure 10 shows the relationship between these prices in Eldoret between early
2007 and mid 2009. The 2007 farm-gate observations come from the Tegemeo rural survey
while the 2009 observations come from the farmer focus group discussions. At these two
points in time, farmers were receiving between 80-85% of the wholesale price in the same
district.
Low margins at this level suggest competition between buyers and assemblers in rural areas,
a point corroborated by the farmer focus group discussions in the six districts studied. When
asked about the number of traders operating in villages, farmers reported an average of 83 in
remote areas and 93 in more accessible areas (see section 4.1), signaling a high level of
competition among buyers at the village level.
Another reason for low and declining margins is that the cost of transportation between the
farm-gate and wholesale markets could also be declining relative to the cost of the product.
While we do not have information of the cost of transport faced by buyers, we do observe a
decline in the distance farmers are traveling to the point of sale (Chamberlin and Jayne 2009).
Based on both the farmer interviews during 2009 as well as the Tegemeo rural surveys in
2004 and 2007, the median distance to the point of maize sale was zero, while the mean
distance to the point of sale was about 6 kilometers. These differences are due to the fact that
about 10% of the farmers who tend to have larger quantities to sell appear to prefer to arrange
transport for selling their maize directly to a wholesaler or miller in the towns, thereby
bypassing the assembly traders. The low distances involved in selling maize for most farmers
indicate that assembly buyers are willing to operate deep in the rural areas, perhaps due to the
competition previously mentioned.

60
5.1.1 Differences in Farm-gate Prices Reported by Farmers
The farm-gate price series used in the previous section represent averages across farmers in
the same geographic area. Another interesting dimension is the variation in farm-gate prices
received by farmers in the same area in the same month. While it appears that the average
farmer obtains a price not very far below the local wholesale price in the same month,
farmers within the same area report receiving sometimes vastly different prices in the same
month.
The graphs below show prices received by individual farmers in the same village versus the
nearest wholesale market maize grain price. Figures 11 and 12 show prices received by
farmers in accessible and remote villages, respectively, in the Nakuru district. Figures 13 and
14 show the same for accessible and remote villages in Trans Nzoia.
Figure 11. Farm-gate Prices in Accessible
Villages in Nakuru District vs. Wholesale
Nakuru
Figure 12. Farm-gate Prices in Remote
Villages in Nakuru District vs. Wholesale
Nakuru
1200
1600
2000
2400
2800
3200
3600
4000
2008:10 2009:01 2009:04 2009:07
nom
inal K
sh p
er
90kg b
ag
400
800
1200
1600
2000
2400
2800
3200
2008:10 2009:01 2009:04 2009:07
nom
inal K
sh p
er
90kg b
ag
Figure 13. Farm-gate Prices in Accessible
Villages in Trans Nzoia vs. Wholesale
Eldoret
Figure 14. Farm-gate Prices in Remote
Villages in Trans Nzoia vs. Wholesale
Eldoret
800
1200
1600
2000
2400
2800
3200
2008:10 2009:01 2009:04 2009:07
nom
inal K
sh p
er
90kg b
ag
800
1200
1600
2000
2400
2800
3200
2008:10 2009:01 2009:04 2009:07
nom
inal K
sh p
er
90kg b
ag
Source: Tegemeo/Michigan State University Maize Value Chain Survey 2009.

61
The first major observation is the variation in prices received by farmers in a given area and
month. Some farmers are able to obtain prices very near the local wholesale price (similar to
the average farm-gate prices from the last section) while others receive less than 50% of the
wholesale price. This suggests that farmers within the same village might have very different
access to price information, negotiating skills, or relationships with buyers. One
recommendation for helping disadvantaged farmers is to improve their access to information
via cell phones. In theory, through text messaging or calling various potential buyers, farmers
should be able to raise the prices they receive for their crops. Through farmer focus group
discussions, we learned that cell phone ownership is ubiquitous in maize growing areas of
Kenya. Over 85% of farmers in accessible villages and 75% in remote villages own a cell
phone. However, despite widespread ownership, when asked to what extent owning a cell
phone allowed them to negotiate a better price or find a buyer, a majority of farmers said the
cell phone was either not helpful or not used for these purposes. One possible area for
intervention, then, is to design development programs aimed at increasing farmers‘ ability to
use available communications technology and price information to their advantage in
negotiations with potential buyers.
A second observation is that farmers in accessible villages reported receiving slightly higher
price than those in remote areas. There is also a greater spread of price observations in a
given month in the remote villages. One reason for this might be more competition amongst
buyers in accessible villages than remote villages. While there are slightly fewer buyers
operating in remote villages, still there is an average of about 80, casting some doubts on
claims that buyers in remote areas might be using market power to offer lower prices.
Another reason might be that transportation costs are lower between the accessible village
and the wholesale market, meaning traders must offer lower prices in the more remote
villages.
A final observation is that some farmers in both villages reported receiving prices greater
than the wholesale market value. This may be because there is variation in grain transaction
prices in the wholesale markets as well as between farmers and assemblers. Although the
Ministry of Agriculture wholesale maize price reporting system reports only one price per
day, it is of course likely that there is some variation in the transaction prices around this
reported mean price. For this reason, some farmers may be receiving prices above the mean
wholesale price, although this is very infrequent.
5.2. Margins between Rural Surplus Wholesale and Urban Deficit Wholesale Maize
Prices
The next level of margins is found between wholesale markets in surplus production areas
and deficit consumption areas. For example in the wholesale markets of Eldoret and Nakuru,
two surplus maize-producing districts, maize grain is assembled for both local millers and for
transport to wholesale markets in Nairobi where there is a greater concentration of
consumers. Figures 15 and 16 show how average farm-gate and wholesale prices in these two
districts compare with Nairobi wholesale market prices.

62
Figure 15. Wholesale/Farm-gate
Prices in Eldoret Compared to
Nairobi
Figure 16. Wholesale/Farm-gate Prices in
Nakuru Compared to Nairobi
0
400
800
1200
1600
2000
2400
2800
3200
2007:01 2007:07 2008:01 2008:07 2009:01
farm-gate, Eldoret Districtwholesale, Eldoretwholesale, Nairobi
nom
inal K
sh p
er
90kg b
ag
0
400
800
1200
1600
2000
2400
2800
3200
2007:01 2007:07 2008:01 2008:07 2009:01
farm-gate, Nakuru districtwholesale, Nakuruwholesale, Nairobi
nom
inal K
sh p
er
90kg b
ag
Source: Tegemeo/Michigan State University Maize Value Chain Survey 2009; Tegemeo Rural Household
Survey 2007.
In both Eldoret and Nakuru markets, there is evidence of low spatial price differences
between local wholesale maize prices and wholesale prices in Nairobi, with the margins
relatively smaller in Eldoret than Nakuru. Wholesale prices in surplus areas are in the range
of 90-95% of the prices in the main deficit market of Nairobi. The remaining 5-10% is the
portion of the final maize price extracted by traders and transporters between surplus areas
and Nairobi. This portion is relatively low signaling either low costs of transport between the
markets or a high degree of competition among transporters and assemblers.
Note the anomaly in late 2008 where spatial wholesale price differences were larger than
average. In both Eldoret and Nakuru, the wholesale prices decreased much more significantly
than wholesale prices in Nairobi. We are attempting to study this particular period in more
detail to better understand the reasons for this divergence in wholesale price spreads between
Nairobi and these two surplus districts.
5.3. Margins between Maize Grain and Processed Maize Meal
Another type of margin to explore is that at the milling and retailing stages of the value chain.
The spread in prices observed between wholesale maize grain and retail maize meal
represents the margin charged by millers and retailers.
Figure 17 shows price trends for retail maize meal and wholesale maize grain in Nairobi
between the early 1990s and the present. In the mid-1990s, sifted maize meal prices were
considerably higher than wholesale maize grain prices. More recently, these prices have
become much closer and appear to move more synchronously. Not only are the prices closer,
representing smaller margins to millers and retails, but also both have dropped considerably
over time. Despite a 370% rise in the consumer price index (CPI) between 1996 and 2009,
the difference in nominal wholesale price of maize and the retail price of sifted flour has

63
Figure 17. Price Trends for Retail Sifted Maize Meal and Wholesale Maize Grain in
Nairobi, Kenya
10
20
30
40
50
60
70
1994 1996 1998 2000 2002 2004 2006 2008
consta
nt
2007 K
enya s
hill
ings p
er
kg
sifted maize flour, Nairobi
maize grain, wholesale Nairobi
Source: Ministry of Industry and Commerce for data on retail maize meal prices; Market Information Bureau, Ministry of Agriculture for data on maize grain wholesale prices.
increased only by 25% or so. After adjusting for inflation, there has been a highly statistically
significant decline in maize milling and retailing margins by Ksh 0.068 per kg per month
between 1994 and 2008, or roughly Ksh 12,000 per ton over this 15 year period (Figure 18).
General prices in the economy have increased 15 times as much as this milling/retailing
marketing margin. Maize market liberalization has benefited maize consumers in urban
Kenya by reducing the price of and increasing access to maize products (Jayne and Kodhek
1997).
Figure 18. Trend in the Difference between Maize Wholesale Prices and Sifted Flour
Retail Prices in Nairobi, 1994 To 2008
5
10
15
20
25
30
35
40
1994 1996 1998 2000 2002 2004 2006 2008
consta
nt
2007 K
enya s
hill
ing p
er
kg trend = - 0.068 KSh/kg per month (t-stat = 13.75)
Source: Ministry of Industry and Commerce for data on retail maize meal prices; Market Information Bureau, Ministry of Agriculture for data on maize grain wholesale prices.

64
The reason for the decline in milling and retailing margins over time is associated with a
substantial increase in competition at both the milling and retailing stages of the value chain
in urban Kenya. An increase in the number of millers and retail outlets has forced price
competition in order to continuously attract buyers. Muyanga et al. (2005) outline the
competitive nature of the milling industry with large millers operating with economies of
scale and small-scale posho millers struggling to compete.
Interestingly, a decline in margins relates to other findings by Muyanga et al. (2005). They
find that urban consumers are shifting their consumption towards sifted maize meal and away
from posho meal. In their study, the main reason given by households for the shift in
consumption was the ease of procurement and preparation. Moreover, another possible
reason might be the declining prices of processed maize products relative to less processed
posho given the reduction of margins.
The temporary surge in the margins in late 2008/early 2009 reflects a shortage of grain during
this period. Millers and retailers increased their margins greatly during this period to
compensate for the loss in volume of maize. Attempts by the government in late 2008 to push
down the price of maize meal to consumers were largely unsuccessful. Government offered
millers a subsidy in return for passing along lower prices of sifted maize flour to consumers,
yet this did not happen, largely because millers continued to require purchasing maize from
the market at relatively high prices to operate at levels to meet consumer demand.
In fact, while nominal milling/retailing margins for sifted flour were at an all time high in late
2008, the inflation-adjusted price of sifted flour was actually below average levels in the late
1990s as shown in Figure 17.
5.3.1. Summary
Margins for traders, assemblers, millers, transporters and retailers appear to be declining in
Kenya. Using farm-gate prices reported by farmers through the Tegemeo rural household
survey and farmer focus group discussions, we find that these prices are not considerably
different from rural wholesale prices. Similarly, prices in rural wholesale markets and Nairobi
markets move together and with relatively small margins. Finally, in urban Nairobi,
differences between wholesale maize grain and retail maize flour prices have been declining
with time. All three of these observations signal narrowing margins and rents extracted by
middlemen throughout the maize supply chain in Kenya, allowing a higher proportion of the
final price of maize to be captured by farmers and generally lower prices to consumers
overall.

65
6. CONCLUSION AND POLICY IMPLICATIONS
This study was conducted in 2009 to provide an up-to-date description of the operation of
Kenya‘s maize value chain. The study is conceived as a follow-up to the Tegemeo study of
the maize value chain in the late 1990s by Nyoro, Kiiru, and Jayne (1999). The study thus
provides a useful comparison of changes identified 10-years earlier by Nyoro, Kiiru, and
Jayne (1999) and informs how the maize marketing system has evolved since that time as the
market has been progressively liberalized. The study also aims to assess the competitiveness
of maize markets in Kenya and to identify actions by the public sector to overcome major
production and marketing problems and support the achievement of national policy
objectives related to food security and smallholder-led agricultural development.
6.1. Summary of Main Findings
Promoting the performance of the maize value chain so that it effectively meets the needs of
smallholder farmers and consumers will require actions from many different kinds of actors
within the maize market value chain, both in the private and public sectors. Kenya‘s maize
marketing system is complex, with many players carrying out different and sometimes
overlapping functions, and so is characterized by many alternative and competing channels,
through which maize can flow from farmers to final consumers.
One of the major findings of the study concerns farm structure. Most of Kenya‘s smallholder
farmers reside in increasingly densely populated rural areas facing major land pressures.
About one-third of the smallholder farms nationwide are less than 1.0 hectares in size.
Moreover, there is very little scope for increasing farm production based on increasing the
amount of land in smallholder farming areas. While proximity to demand centers and access
to markets are important determinants of smallholder farmers‘ ability to participate in food
markets, survey data reveal that limited land and capital are perhaps the primary constraints
preventing the majority of smallholder farmers to enter into commercialized staple food
production. Even with major improvements in the performance of the maize value chain, a
large percentage of smallholders will continue to be unable to produce a maize surplus that
would enable them to link to markets. As rural populations continue to grow (albeit at a
slower rate than in earlier decades), access to quality farm land is going to increasingly be a
problem that will preclude many rural households from participating as sellers in grain
markets, unless there is tremendous growth in food crop yields. An important conclusion
appears to be that, for the bottom 50% of the rural farm population, there is a triple burden of
providing the means to put improved and appropriate farm technology in their hands,
improving their access to land, and providing a stable market for the output that protects
against severe downward price risk. This boils down to simultaneous improvements in farm
technology (including for semi-arid conditions in which a large fraction of the smallholder
populations in the region reside), access to credit, improved rural road infrastructure, the
strengthening of land rental markets, and hospitable conditions for private investment in rural
input retailing and crop assembly. For the top 50% of smallholders ranked by land and
productive potential, the main challenges are reducing the transaction costs of marketing
output and protection against downside price risk.
There is evidence of growing private investment and new entrants into the maize marketing
system as liberalization has progressed. Farmers have many different outlets for their maize.
In particular, the first stage in the system (farmer-assembly trader/first buyer) has developed

66
and become competitive over the years. The growing number of maize assemblers definitely
reflects an increase in the participation of the private sector in the maize trade following
liberalization.
Assembly traders were by far the most common first buyer of farmers‘ maize. In virtually all
villages surveyed, there were a high number of traders operating in the villages during the
main marketing season, generally more than 30. Moreover, most farmers sold their maize at
their farms or in their villages, even in the more remote areas. A small minority of farmers
with larger quantities to sell would often organize transport to sell to millers or wholesalers in
the towns in order to fetch a higher price.
These findings imply that access to markets may no longer be meaningfully defined in terms
of distance to town markets, but rather in terms of the number of buyers competing to buy
farmers‘ maize in the villages as well as farmers‘ ability negotiate and obtain a remunerative
price that represents a high proportion of the wholesale price in regional markets. Results
showed great variation in farm-gate price even for farmers within the same village and selling
maize within the same time period such as a week. Additionally, farmers that had received
training received better prices on average. This implies that there is scope for training farmers
in order to improve their understanding of market behavior and gain both confidence and
negotiation skills in interacting with traders.
The study found that the National Cereals and Produce Board purchases a relatively small
proportion of maize produced by smallholder farmers. Roughly 3% of the 1,275 farm
households contained in the Tegemeo Rural Surveys sold maize to NCPB. Nevertheless, the
NCPB appears to play an important role in the market by purchasing large volumes from
large-scale farmers and from smallholders in a few major surplus zones such as Trans Nzoia
and Uasin Gishu. NCPB tends to increase its purchases in a good production season and
reduce its purchases in a poor season to stabilize maize prices (Jayne, Myers, and Nyoro
2008).
The study found an apparent contradiction of very little seasonal storage occurring despite a
great deal of storage space in the country available for rent. Interviews with traders indicate
that the problem is not inadequate storage facilities but inadequate incentives and risks
associated with maize storage. These include: constraints on borrowing capital, which are
related to high risks as perceived by banks and other lenders, and the multiple harvests that
occur in East African, which allow supplies from Uganda, Tanzania, and indeed parts of
Kenya to enter the market at various times, thus putting downward pressure on prices and
limiting returns to storage. Certain behaviors by the government, most notably the sudden
changes in the import tariff rates on maize imports through Mombasa as well as sudden
changes in the NCPB‘s maize selling price, exacerbate the risks of storing grain.
Because of these disincentives to store maize in many areas, grain surpluses in a given area, j,
tend to be sold and quickly distributed to deficit rural areas and to urban areas for milling by
large-scale firms instead of stored locally for later sale to meet the needs of deficit
households in area j. This tends to create a circuitous flow of grain in which maize is
exported out of certain areas directly after harvest only to be distributed back to these areas
later in the season when many households run out of their own supplies and need to buy
maize. The redundant transport costs involved inflate maize prices beyond what they would
be in a well-functioning system where the risks of storage were lower. More generally, the
disincentives for traders to store grain tends to depress prices right after harvest and (because

67
relatively little is stored through the season) less is available for consumption later in the
season which raises prices more during these periods. In order to drive down the price of
maize grain and meal to rural and urban consumers, there is a need to address the
disincentives to on-farm and trader storage.
6.2. Alternative Visions of the Role of Government in Maize Markets
Even as the liberalization process has continued, there is a consensus that the government has
a crucial role to play in developing strong output markets, but there is still debate as to what
exactly its roles are, and how they should be implemented.
Currently, there are three competing models that dominate policy discussions in Kenya, as in
much of Africa, regarding the appropriate role of the state in staple food markets as outlined
by Jayne and Tschirley (2010). These three competing visions are presented in Figure 19.
Figure 19. Competing Visions of Staple Food Market Development
Model 1 Model 2 Model 3
Rely on markets --state role limited to:
• Public goods investment
• Regulatory framework
• Strengthening of institutions / property rights
• Policies supportive of private sector entry and competition
Primary reliance on markets
- but role for rules-based state operations
• e.g., buffer stock release in response to defend stated ceiling price
• Marketing board purchases at stated floor price announced in advance
• Transparent rules for initiating state imports
• public goods investments
Role for markets and
discretionarystate
intervention
• Based on premise that private sector cannot ensure adequate food supplies in response to production shortfalls
• Justification for unconstrained role for state interventions in markets to correct for market failures

68
6.2.1. Model 1: State Role Confined to Provision of Public Goods to Strengthen Markets
This approach relies on the private sector to carry out the main direct marketing functions –
purchase/assembly from farmers, wholesaling, storage, transport, milling, and retailing. The
role of the state is confined to provision of public goods: market rules and regulations,
physical infrastructure, regulatory oversight of finance, market information, investment in
new technology, organizing farmers into groups for means of reducing costs and risks of
accessing finance, inputs, and marketing. This position is close to the Washington Consensus
framework of the 1980s and 1990s, which is now generally out of favor.
6.2.2. Model 2: Rules-based State Interventions to Stabilize Market Activity
This approach also relies on markets to carry out most of the direct food marketing functions,
but the role of the state is expanded to include direct marketing operations, especially in the
arrangement of imports, the management of food buffer stocks, and release of stocks onto
markets when prices exceed a publicized ceiling price. The rationale for state operations is
based on the premise that markets fail in some respects and direct rules-based state operations
are necessary maintain food prices within reasonable bounds. The defining feature of Model
2 is that there is pre-commitment: the rules governing state operations are determined in
advance, publicized, and followed in a non-discretionary manner. This approach appears to
be favored by many technical analysts.
6.2.3. Model 3: Discretionary State Intervention to Provide State with Maximum Flexibility
to Achieve State Policy Objectives
The defining feature of this model compared to Model 2 is that state operations are not
confined to pre-committed rules that would constrain the state‘s ability to intervene only
when these intervention criteria are met. Most governments in eastern and southern Africa are
essentially following Model 3 and have done so from the start of the liberalization process. In
practice, Model 3 has provided a highly unpredictable and discretionary approach to grain
trade policy, commonly imposing export and import bans, variable import tariffs, issuing
government tenders for the importation of subsidized grain, and selling their grain stocks to
domestic buyers at prices that are unannounced in advance and often far below the costs of
procuring it.
There are very few examples of Model 1 for staple foods to examine in Africa or perhaps
anywhere for that matter. The rationale for Model 2 is that well executed parastatal price
stabilization operations can in theory put an upper bound on food prices and protect against
downside price risk by defending floor and ceiling prices through stock accumulation and
release onto markets. Successful implementation of Model 2 requires that the marketing
boards possess a great deal of technical and management skill.
The weaknesses of Model 2 are that (1) given the long history of ad hoc state intervention in
food markets, it is not clear whether Model 2 could be regarded as a credible policy; and (2)
given constraints on available government funds for agriculture, spending on expensive
government operations in food markets reduces the amount that can be spent on public
investments that could potentially earn a higher social return.

69
Despite being the most common approach for the role of government in food markets, Model
3 is clearly vulnerable to lack of trust, cooperation, and coordination between the private and
public sectors. A discretionary approach to government operations leads to elevated risks for
private sector and tends to impede the private sector from performing functions that it would
otherwise do more confidently under Models 1 and 2. The poor performance that results from
this high degree of uncertainty and lack of coordination is often attributed to market failure.
However, a strong case can be made that the more central and underlying causes are chronic
under-investment in public goods and a lack of credible commitment in the policy
environment, leading to low levels of trust and coordination among public and private sector
actors in the staple food systems.
The Model 3 scenario is largely incompatible with the sustainable development of modern
risk management institutions. Despite the apparent potential for using market-based
instruments such as commodity exchanges and warehouse receipting systems to manage food
sector risks, there has been little use to date of these instruments in Kenya and most other
African countries for a number of reasons. Contract enforcement may be difficult for food
staples in times of local shortage. The small size of farms and traders serving the traditional
food sector in these countries, and poorly developed financial markets, also limit the liquidity
required for successful trading. Few of these countries have the market intelligence systems,
grades and standards systems, communication systems, storage and marketing infrastructure,
and experience and education to use these markets effectively.
Basis risk is another major impediment to both futures and options trading and index-based
weather insurance. And somewhat ironically, one of the most serious impediments to
innovation and development of risk management markets for Kenya may be highly
unpredictable government intervention in maize markets. These policies reduce or destroy the
incentive to participate in market-based risk management mechanisms because there is no
incentive to manage risk when prices are being stabilized via policy, and because such
policies tend to disconnect local prices from world prices which reduces the hedging potential
of the global markets. Furthermore, if government interventions are discretionary and
difficult to predict then they can add another layer of risk that individuals and firms may find
difficult to hedge using available market-based risk management instruments.
6.3. Implications for Government Actions to Improve the Performance of Maize
Markets in Kenya
The government‘s use of discretionary trade policies tends to introduce unnecessary levels of
risk and uncertainty in maize markets. This in turn tends to stifle private sector investments in
the marketing system. A more predictable and transparent set of rules governing state
involvement in markets, particularly with reference to changes in import tariff rates and
NCPB purchase and sales prices, could further reduce costs and margins in the maize value
chain. Formalized periodic consultations between the private and public sectors would also
help to ensure that future government actions that could potentially affect market supplies
and price levels could be anticipated well in advance. This would reduce risks and enable
greater coordination between private and public decisions in the market. Therefore, creating a
forum for regular consultation and coordination between the private and public sectors to
manage the potential need for maize imports and exports would enhance food security, trade,
and business.

70
There is also need to focus government budgets on a key set of public investments that
promote productivity growth throughout the maize value chain. These public investments
include rehabilitation of the road, railway, and port infrastructure in order to reduce the costs
of transacting for productivity-enhancing inputs as well as for improving farmers‘ access to
buyers.
Public investments are also needed to raise the productivity of farmers‘ land and labor
through investing in seed breeding and improved agronomic practices, and extension services
aimed to both improve farmers‘ farm husbandry and marketing skills.
Streamlining the payment of cess, so that traders pay cess only once in the district in which
the grain is produced, will also reduce marketing costs that are ultimately borne by farmers
and consumers.
Strategies for improving grades and standards will reduce the circulation of wet maize, which
increases storage losses and contributes to problems of aflatoxin (a toxic mold caused by poor
handling and drying of maize after harvest). In 2010, Kenyan officials estimated that at least
300,000 bags of maize might have been contaminated. Ultimately the impetus for the use of
grades and standards will need to originate from millers, both because they have a great deal
to gain from a reliable system of maize grading and also because they are in the best position
to enforce a system of inspection. Once wholesalers and assemblers realize that the prices
they receive for maize grain will depend on quality, they will in turn impose grading more
strictly on farmers.
Finally, a more stable and predictable policy environment that is supportive of private
investment in the value chain will ultimately be in the interests of farmers and consumers.
6.3.1. Trade Policy and Trade Logistics Issues
Nearly two decades after the liberalization of maize marketing in Kenya, the government and
the private sector are still grappling with trade policy issues. This mainly arises because of
the uncertainty of government behavior with respect to decisions on import tariff rates as well
as the NCPB pricing and marketing operations. This uncertainty stifles private investment
and makes it harder to develop and improve competitiveness in the maize value chain. This
also hampers the objective of meeting food security needs, particularly when the country is
facing a huge shortfall in production and imports are needed to bridge the gap. A case in
point is what the country went through in 2008. It was estimated that 10 million bags of
maize needed to be imported by May 2008. Initially, the imports, which started flowing in by
November 2008, were brought in by the government through the NCPB. However, these
imports failed to meet the demand due to red-tape in the procurement process, and were also
expensive (maize was obtained at cost of Ksh 3,750 per 90 kg bag which pushed up the price
of maize meal). It was not until January 2009 that the government waived the 50% import
duty, thereby providing incentives for millers and private traders to import maize from the
world market.
Analysis by the Tegemeo Institute demonstrated that this duty removal had a moderating
effect on local grain and flour prices, but this effect was not substantially evident until 5
months later. While imported maize started landing at Mombasa port within three weeks after

71
the duty was waived, the Grain Bulk Handling facility at the port was able to offload grain at
a capacity of roughly 300,000 tons per month. However, significant bottlenecks exist both at
the port and during the process of transporting grains inland, which both limit the efficiency
of the port‘s Grain Bulk Handling facility and add additional costs to the consumer price for
imported grain.
Per ton ocean shipping charges are lowest for vessels with large capacity. In the port of
Mombasa vessels suitable for hauling grain are limited to 30,000 tons by their drafts, which
cannot in any case exceed the quayside depth of 9.36 m. The normal ship discharge rate at
the port is 7,000 tons per day from the quay, which is served by the port‘s only bulk transfer
terminal. Thus a 30, 000-ton vessel requires 4-5 days to unload. Because the Port has only
one berth dedicated to bulk transfer, vessels require additional time queuing up and waiting
for access to this berth. On average a vessel requires 8-10 days to discharge in Mombasa.
Under demurrage rules, which are standard for different sized vessels in the global vessel
chartering market, the first 7days are free to the shipper and at that point charges of $15,000
per day accrue for a 30,000 grain vessel. When data was collected for this study during
November of 2009, four vessels were waiting at anchor in Mombasa while one was being
discharged.
Ocean shipping fees represent a significant share of final delivered price for most grains, but
other transport cost elements which are absorbed into the price of delivered imports are
significant as well. A break out of transport costs and related charges per ton of grain is as
follows: ocean shipping: $35 per ton; ii) Mombasa terminal charges: $12.5 per ton for flow
through. Bagging charges in the terminal can add another 10.00 per ton. Port dues and fees
add yet another $5 per ton; iii) inland transport charges to Eldoret via rail are $20 per ton.
With increasing grain imports, capacity issues at the port have become even more important
than cost issues. With one berth reserved for bulk transfer, the Port of Mombasa currently
offers a loading capacity of 300,000 tons per month. However, the operation of a single
bagging line at the GBHL terminal and the prevailing mode of distribution of bagged product
to the interior, coupled with the need to clear, clean and reset the bagging line for each
throughput lot, effectively reduces the through put capacity of the port to 200,000 tons per
month.
Inland transport capacity are also a major constraint. The Kenyan Railways system linking
Mombasa to the main population centers in central and western Kenya had stopped operating
and private transport capacity was insufficient to handle the massive grain imports that were
concentrated into weeks immediately after the import duty was lifted. Grain traders
interviewed during this period indicated that the maximum transport capacity from Mombasa
is 150,000 tons per month. This would have been sufficient to transport to upland population
centers if imports had been mobilized earlier by mid- to late-2008, but which were not
possible to stave off shortages by the time the import tariff was actually lifted in late January
2009. Consequently, rationing of maize was experienced in late 2008 and domestic prices
continued to climb upward of $350 per ton, even as the cost of importing maize to Nairobi
had fallen to the $300-320 per ton range. Because grain did not arrive at the port early enough
to transport sufficient volumes upcountry (given transport capacity constraints) to meet
demand requirements, maize market prices continued to climb during the first half of 2009
well over import parity. This state of affairs could have been avoided if the import tariff was

72
lifted much earlier, especially since national shortfalls were predicted by the early warning
systems and by local policy institutes as early as May 2008.
The compression of maize imports into a two-month period (late February-April 2009) also
generated additional marketing costs that were ultimately borne by Kenyan consumers.
Because inland road transportation was insufficient to handle the volumes imported
(estimated at 0.7 million tons), traders were forced to store their grain in facilities outside the
Mombasa port waiting for available transport to arrive. Upland transport capacity was further
constrained by the fact that fertilizer importation for the main growing season typically
occurs in February-March as well.
By September 2009, domestic maize prices were again falling in line with import parity as
imports continued to relieve the deficit and production from some areas of the country began
to hit the market.
Under such circumstances, it is imperative that the government gives a clear direction on the
duty waiver, considering that suspension of duty earlier not only promotes more timely
availability of grain in such times of a domestic shortfall, but also reduces uncertainty and
allows for adequate planning by the private sector especially millers and importers. This
underscores the need to have in place clearly defined and transparent rules for triggering
government intervention to reduce uncertainty. In addition, it is important that regular
periodic government-private sector consultations be held in order to coordinate decisions and
actions. Such a move will ensure that the country is able to deal with food security issues
during lean times as well as times of a bumper harvest.
Additionally, when the food balance sheet indicates that the need for imports is vital, a
quicker response by the government and all stakeholders is necessary for three reasons. First,
imports potentially require major budgetary allocations, particularly when large deficits are
expected, and so good planning is required. Such a response would ensure that the country
avoids situations where NCPB has insufficient funds to acquire maize for strategic reserve
either domestically or through imports. Secondly, there is a time lag between the time when
maize import orders are made and when that maize arrives in the country. This factor needs
to be put into consideration to ensure that such imports are timely. Thirdly, even when grain
importation is timely, transportation to rural areas is a major constraint, and this calls for the
improvement of the road/railway infrastructure that currently hampers the capacity to
transport grain upcountry.
Looking forward, it is important that these trade-related issues be taken into account if the
maize value chain is to perform in the best interests of Kenyan farmers and consumers.
6.3.2. Concrete Guidance
1. Raise public investment in maize seed breeding and agronomic research to make it
possible for improvements in smallholder crop productivity.
2. Explore options for improving public and private extension programs to enable
farmers to adopt improved farm technologies generated from point 1.
3. Examine options for bringing more land in Kenya under potential cultivation by
smallholder farmers. Unless the land constraints in currently densely populated rural

73
areas of Kenya are relieved, it is unlikely that a large portion of farmers in Kenya that
own less than one hectare will be able to rise out of the semi-subsistence conditions
that keep them trapped in poverty.
4. Support training programs to enable smallholders to develop more effective marketing
strategies and to negotiate more effectively with traders, in order to raise the prices
that they receive for their maize.
5. Raise public investment in road, rail, and port infrastructure to reduce marketing costs
as well as the cost of modern inputs such as fertilizer to the farm gate. Rehabilitating
the Kenyan railway system would be a key priority. If this were done prior to 2009,
maize imports could have arrived in greater volumes much faster in early 2009 and
pushed food prices down faster.
6. When early warning estimates predict a need for large import quantities, remove the
import tariff soon enough to allow traders to import over a sufficiently long time
period to avoid transport capacity constraints and domestic stockouts.
7. Review the rationale for denying import licenses when applied for by traders.
8. Consider the costs and benefits from the standpoint of governments of transitioning
from discretionary trade and marketing policy (Model 3) to adherence to more
systematic rules-based policies (Model 2). As concluded earlier, nurturing credible
commitment concerning trade policy is likely to promote market predictability and
therefore, lead to greater supplies and price stability in food markets during times of
domestic production shortfalls.
9. Consider whether current proposals for international stockholding would be effective
in the presence of domestic transport capacity constraints. International physical or
financial reserves would not be able to relieve localized food production shortfalls
unless local transport capacity is adequate to absorb sufficient imports within a
concentrated period or unless import licenses are provided or the state carries out or
contracts for the importation from the international stock source.

74
REFERENCES
Ackello-Ogutu, C. and P. Echessah. 1997. Informal Cross-border Trade in East Africa:
Implications for Food Security. In Regional Cooperation and Trade in the Greater Horn of
Africa: Proceedings of a Workshop, ed. C. Ackello-Ogutu. Washington D.C.: Publication
of the Technical Advisory Committee of the African Rural Social Sciences Research
Networks, Winrock International.
AFRICOG. 2009. The Maize Scandal. Nairobi, Kenya: Africa Centre for Open Governance.
Ariga, J. and T. S. Jayne. 2009. Private Sector Responses to Public Investments and Policy
Reforms. The Case of Fertilizer and Maize Market Development in Kenya. IFPRI
Discussion Paper No. 00921. Washington, D.C.: International Food Policy Research
Institute (IFPRI).
Chamberlin, J. and T.S. Jayne. 2009. Has Kenyan Farmers’ Access to Markets and Services
Improved? Panel Survey Evidence, 1997-2007. Tegemeo Working Paper No. 33. Nairobi,
Kenya: Egerton University, Tegemeo Institute.
FAOStat. 2009. Website for food production statistics: http://faostat.fao.org/default.aspx
Rome: Food and Agricultural Organization of the United Nations.
Haggblade, S., S. Longabaugh, and D. Tschirley. 2009. Spatial Patterns of Food Staple
Production and Marketing in South East Africa: Implications for Trade Policy and
Emergency Response. International Development Working Paper No. 100. East Lansing:
Michigan State University.
Jayne, Thomas S. and Gem Argwings-Kodhek. 1997. Consumer Response to Maize Market
Liberalization in Urban Kenya. Food Policy 22.5: 447-58.
Jayne, T.S., R.J. Myers, and J. Nyoro. 2008. The Effects of Government Maize Marketing
Policies on Maize Prices in Kenya. Agricultural Economics 38.3: 313–25.
Jayne, T.S., Nicole Mason, Robert Myers, Jake Ferris, David Mather, Margaret Beaver,
Natalie Lenski, Antony Chapoto, and Duncan Boughton. 2010a. Patterns and Trends in
Food Staples Markets in Eastern and Southern Africa: Toward the Identification of
Priority Investments and Strategies for Developing Markets and Promoting Smallholder
Productivity Growth. International Development Working Paper No. 104. East Lansing:
Michigan State University.
Jayne, T.S., Nicholas Sitko, Jacob Ricker-Gilbert, and Julius Mangisoni. 2010b. Malawi‘s
Maize Marketing System. Working Paper, Michigan State University, East Lansing.
Jayne, T.S. and D. Tschirley. 2010. Food Price Spikes and Strategic Interactions between the
Public and Private Sectors: Market Failures or Governance Failures? In FAO Commodity
Market Review, 2009/10. Rome: Trade and Markets Division, Food and Agriculture
Organization of the United Nations.
Kaplinsky, R. and M. Morris. 2001. A Handbook for Value Chain Research. Paper for IDRC.
Brighthton: Institute of Development Studies (IDS)

75
Kenya Maize Handbook. 2009. Kenya Market Development Programme. Nairobi Kenya:
Government of Kenya.
Kimenju, S. and D. Tschirley. 2008. Agriculture and Livelihood Diversification in Kenyan
Rural Households. Tegemeo Working Paper No. 29. Nairobi: Tegemeo Institute of
Agricultural Policy and Development, Egerton University. Online at: www.tegemeo.org.
Ministry of Trade and Industry. 2010. Ministry of Trade and Industry data files shared with
authors. Nairobi: Government of Kenya.
Muyanga, M., T.S. Jayne, G. Argwings-Kodhek, and Joshua Ariga. 2005. Staple Food
Consumption Patterns in Urban Kenya: Trends and Policy Implications. Tegemeo
Working Paper No. 19. Tegemeo Institute of Agricultural Policy and Development,
Egerton University. Online at: www.tegemeo.org.
Nyoro, J., M.W. Kiiru, T.S. Jayne. 1999. Evolution of Kenya’s Maize Marketing Systems in
the Post Liberalization Era. Tegemeo Working Paper No. 2. Nairobi, Kenya: Tegemeo
Institute of Agricultural Policy and Development, Egerton University.
Nyoro, J., L. Kirimi, and T. Jayne. 2004. Competitiveness of Kenya and Ugandan Maize
Production: Challenges for the Future. Tegemeo Working Paper No. 10. Nairobi:
Tegemeo Institute of Agricultural Policy and Development: Egerton University.
Republic of Kenya. 2007. Food and Nutrition Programme 2007. Nairobi: Government
Printer.