A Dynamic Structural Model of the Impact of Loyalty...
45
A Dynamic Structural Model of the Impact of Loyalty Programs on Customer Behavior Praveen K. Kopalle, Dartmouth College Scott A. Neslin, Dartmouth College Baohong Sun, Carnegie Mellon University Yacheng Sun, Indiana University Vanitha Swaminathan, University of Pittsburgh February 1, 2007 *Praveen Kopalle is Associate Professor of Business Administration and Faculty Associate, Center for Digital Strategies at the Tuck School of Business at Dartmouth, Dartmouth College, Hanover, NH 03755; Ph: 603-646-3612, Fax: 603-646-1308, email: [email protected] . Scott Neslin is Albert Wesley Frey Professor of business administration at the Tuck School of Business at Dartmouth, Dartmouth College, Hanover, NH 03755; Ph: 603-646-2841, Fax: 603-646- 1308, email: [email protected] . Baohong Sun is Associate Professor of Marketing at the Tepper School of Business, Carnegie Mellon University, 5000 Forbes Avenue, Pittsburgh, PA 15213; Tel: 412-268-6903; Fax: 412-268- 7357; Email: [email protected] . Yacheng Sun is a Doctoral Candidate in Marketing at Indiana University, Bloomington, Indiana 47405; Tel: 812-322-6498; Email: [email protected] Vanitha Swaminathan is Assistant Professor of Business Administration at the Katz school of business, University of Pittsburgh, 344 Mervis Hall, Pittsburgh, PA 15260; Ph: 412 648-1579; E-mail: [email protected] .
Transcript of A Dynamic Structural Model of the Impact of Loyalty...

A Dynamic Structural Model of the Impact of Loyalty Programs on Customer Behavior
Praveen K. Kopalle, Dartmouth College Scott A. Neslin, Dartmouth College
Baohong Sun, Carnegie Mellon University Yacheng Sun, Indiana University
Vanitha Swaminathan, University of Pittsburgh
February 1, 2007 *Praveen Kopalle is Associate Professor of Business Administration and Faculty Associate, Center for Digital Strategies at the Tuck School of Business at Dartmouth, Dartmouth College, Hanover, NH 03755; Ph: 603-646-3612, Fax: 603-646-1308, email: [email protected]. Scott Neslin is Albert Wesley Frey Professor of business administration at the Tuck School of Business at Dartmouth, Dartmouth College, Hanover, NH 03755; Ph: 603-646-2841, Fax: 603-646-1308, email: [email protected]. Baohong Sun is Associate Professor of Marketing at the Tepper School of Business, Carnegie Mellon University, 5000 Forbes Avenue, Pittsburgh, PA 15213; Tel: 412-268-6903; Fax: 412-268-7357; Email: [email protected]. Yacheng Sun is a Doctoral Candidate in Marketing at Indiana University, Bloomington, Indiana 47405; Tel: 812-322-6498; Email: [email protected] Vanitha Swaminathan is Assistant Professor of Business Administration at the Katz school of business, University of Pittsburgh, 344 Mervis Hall, Pittsburgh, PA 15260; Ph: 412 648-1579; E-mail: [email protected].

A Dynamic Structural Model of the Impact of Loyalty Programs on Customer Behavior
Abstract
We develop and estimate a dynamic structural model to determine the impact of frequency reward and customer tier components of a loyalty program on customer behavior. The contribution of this paper is: (i) we provide an integrated analysis and measurement of the impact of two critical components of a loyalty program; (ii) we develop a comprehensive model that incorporates key phenomena such as customers’ purchase and cash-in decisions, rewarded behavior, state dependence, heterogeneity, and forward-looking behavior; and (iii) our substantive results enable us to answer questions such as the strength of response to frequency reward and customer tier programs, level of heterogeneity, and the corresponding policy implications. We estimate our model using data from an airline’s loyalty program. Our findings are that a two-segment solution fits the data best both in estimation and validation samples, revealing a “service-oriented” segment that attaches a net negative value to the frequency reward but highly values the customer tier component, and a “deal prone” segment that values both frequency reward and customer tier programs.. We illustrate the points pressure and rewarded behavior effects and find that while both program components increase the number of paid flights, the paid no cash-in flights decrease under the frequency reward program.
Keywords: Dynamic choice models, customer expectations, customer tier programs, loyalty program, frequency reward, database marketing, segmentation

1. INTRODUCTION AND BACKGROUND
In a business environment marked by an increase in firm knowledge about its customers,
managers and researchers are as aware as ever of the importance of brand loyalty (Gupta, Lehmann,
and Stuart 2004; Reichheld 1996; Reichheld and Detrick 2003). Accordingly, “loyalty programs”,
designed to maintain and enhance loyalty, have become “go-to” marketing programs for many
companies (Deighton 2000; Zeithaml, Rust, and Lemmon 2001; Lewis 2004).
These programs have elicited mixed reviews. Advocates view them as mechanisms for
softening price competition (e.g., Klemperer 1987, 1995; Kim, Shi, and Srinivasan 2001), building a
database for customizing marketing efforts (Butscher 1998; Reynolds 1995), and a dominant
strategy for firms as long as the fixed cost of the program is not too high (Kumar and Rao 2003).
In addition, they note that a minority of customers contribute to most of a firm’s profits, so it is
logical to lavish attention on them (Peppers and Rogers 1997). Finally is the belief that it is less
costly to service and retain current customers than to acquire new ones (Daly 2001; Reichheld 1994;
Reichheld and Detrick 2003). Critics, however, cite the high costs of loyalty programs (Dowling and
Uncles 1997), question whether they really increase loyalty (Sharp and Sharp 1997; Hartmann and
Vierd 2006; Shugan 2005), warn they become a profit-eroding prisoner’s dilemma (Kopalle and
Neslin 2003), and question whether it is really cheaper to serve existing customers (Keiningham,
Vavra, and Aksoy 2006).
One factor that muddles this debate is that two distinct forms of loyalty programs have
emerged: frequency reward and customer tier (Shugan 2005; Zeithaml et al. 2001). Frequency
reward programs are typically of the form, “Buy X times, get one free.” These are the original
trading stamp and frequent flier programs. Customer tier programs are of the form, “Once you
qualify for our gold tier, we will provide you with special services.” Both programs usually rely on
accumulated customer sales to determine which customers get rewarded with what rewards.
1

However, they differ in two crucial respects: First is the nature of the reward. With frequency
reward programs, the reward is meaningful but ephemeral – a free flight, a rebate, a free turkey for
Thanksgiving. Customer tier programs offer, for an extended period of time, a bundle of enhanced
services such as dedicated phone lines, faster check-in service, automatic upgrades etc. Second is the
means to obtain the reward. Frequency reward programs typically require customers to proactively
trade in their points in order to receive the reward. Customer tier programs dispense their reward
automatically. Once customers qualify for a certain tier, they are notified and are treated according
to their tier status. Shugan (2005) argues that customer tier programs have more potential to build
customer loyalty rather than frequency reward programs.
In order to fully gauge the impact of “loyalty programs” on customer behavior, it is
imperative to understand both frequency reward and customer tier components. This requires
incorporation of the following phenomena:
• Forward-Looking Customers: Both forms of loyalty programs encourage customers to consider
the future ramifications of their current choices, because these choices bring them closer to
receiving a reward, be it the short-term free product or the chance to be a “Platinum” customer.
• Value of the Reward: Obviously, the degree to which customers value the reward influences
their behavior.
• Obtaining the Reward: For the frequency reward program, this requires a deliberate decision to
“cash-in.” The reward is automatically delivered for customer tier programs.
• Points Pressure: This is a direct outcome of forward-looking behavior; customers are expected
to increase purchase frequency as they get closer to the reward.
• Rewarded Behavior: This is particularly relevant for frequency reward programs. The reward
indeed is short-term, but customer affect created by the reward can translate into an increase in
loyalty (Taylor and Neslin 2005).
2

• Customer Heterogeneity: Customers are clearly heterogeneous with respect to the above
phenomena. Some customers may feel a free flight is worth any amount of effort, while others
may not stand the hassle. Some may not care about the perks provided to “Platinum” customers,
while others crave the royal treatment.
The contribution of this paper is threefold. First, we provide an integrated analysis and
measurement of the impact of two critical components (frequency reward and customer tier) of a
loyalty program. Second, we develop a comprehensive dynamic model that incorporates the key
phenomena mentioned above: forward looking behavior, value of the reward, purchase as well as
cash-in decisions, points pressure, rewarded behavior, and heterogeneity. Third, we generate
substantive results that add to our empirical knowledge base of customer response to loyalty
programs.
Previous research has shed light on some of the issues we investigate, especially forward-
looking behavior. Researchers have shown that customers are forward-looking with respect to
grocery purchases (Gönül and Srinivasan 1996; Erdem and Keane 1996; Erdem, Imai, and Keane
2003; Sun, Neslin and Srinivasan 2003; Sun 2005). Importantly, Lewis (2004) found forward-
looking behavior with respect to a frequency reward program offered by an Internet grocer.
Forward-looking behavior is represented by dynamic structural models, which structure the customer
decision process as a dynamic program. There are two benefits to these models: (1) They may
produce more accurate measures of important phenomena since they explicitly incorporate decision-
making at the most basic level, the customer utility function. For example, Sun et al. (2003)
explicitly model the process by which customers trade off current period brand choice, stockpiling,
and future inventory costs and show that dynamic structural models yield more accurate measures of
brand switching. In the context of loyalty programs, dynamic structural models might derive more
accurate estimates of reward value because they consider the customer’s decision to build up “points
3

inventory” in order to receive the reward. (2) Dynamic structural models may also be more valid for
policy analyses, by modeling at a more primitive level compared to reduced-form models, they are
able to predict the impact of major policy changes more robustly (van Heerde, Dekimpe, and Putsis
2005).
Points pressure and rewarded behavior effects have also been studied in the context of
frequency reward programs. Lewis (2004) demonstrated that customers who were close to the
required points for a reward increased their purchase frequency. Taylor and Neslin (2005) also
demonstrated a points pressure effect. Kivetz, Urmininsky, and Zheng (2006) as well as Nunes and
Drèze (2006) articulated and verified the psychological theories for the points pressure effect. The
rewarded behavior effect has also received some attention and verification (Taylor and Neslin 2005;
Lal and Bell 2003; Roehm, Pullins, and Roehm 2002; Bolton, Kannan, and Bramlett 2000).
Heterogeneous response to frequency reward programs has been demonstrated in the context
of frequency reward programs. Lewis (2004) used latent class segmentation to identify one group
that valued the frequency program reward and a second segment that did not. Taylor and Neslin
(2005) found that the rewarded behavior effect was stronger among low-volume customers and Lal
and Bell (2003) found that the best customers were more likely to redeem a reward.
While the above research provides a solid foundation for understanding the impact of loyalty
programs, most of it has focused on the frequency reward format. Also, while there has been a lot of
research on customer acquisition and retention (Blattberg and Deighton 1996; Bolton et al. 2000;
Gupta et al. 2004; Reinartz, Thomas, and Kumar 2005; Venkatesan and Kumar 2004), very little has
been learned about customer response to customer tier programs, particularly in a dynamic setting.
In addition, no research to date has explicitly modeled the customer cash-in decision in a frequency
reward program. Moreover, there has not been an integrated analysis of a loyalty program containing
both frequency reward and customer tier components. Such an analysis is warranted given that both
4

the components are viable elements of a loyalty program and therefore it is important to disentangle
the relative impact of the two types of programs. We do so in this paper. Our work is therefore
distinctive in its scope and integrating several key phenomena. Our empirical results will enable us
to answer several questions such as:
• Do customers respond at all to frequency reward and customer tier programs? If so, how
strong is the response?
• What is the total sales impact of including versus not including both the frequency reward
and customer tier components of the loyalty program?
• Are there segments, and if so, how do they differ?
• Do the benefits of the frequency reward outweigh the costs of cashing in?
• What are the magnitudes of the points pressure and rewarded behavior effects?
• What are the policy implications with respect to the effectiveness of frequency reward and
customer tier programs in increasing firm revenues?
We apply our model to the airline industry and examine the loyalty program instituted by a
major carrier. The model and analyses reveal several interesting findings, such as: (1) The forward-
looking model outperforms the myopic model on both calibration and holdout data, suggesting that
dynamic structural models are important for analyzing both frequency reward and customer tier
programs; (2) The rewards of a customer tier program are valued by customers, and customers
demonstrate points pressure effects in their efforts to qualify for a higher tier, (3) There are two
distinct segments – a “service-oriented” segment that values the customer tier reward and finds the
frequency program reward not worth the effort, and a “deal-prone” segment that values both
customer tier and frequency reward but whose valuation of the frequency reward is higher. (4) There
is a rewarded behavior effect with respect to the frequency reward, even among customers in the
5

“service-oriented” segment. We use these results to demonstrate how the model can be used to
examine the effectiveness of both frequency reward and customer tier programs.
The paper proceeds as follows. First, we describe the research setting and specify our model.
Next, we discuss the data that were available to us. Then we estimate the model, display our results,
and discuss them. Finally, we use simulations to demonstrate the points pressure and rewarded
behavior effects, and examine the policy implications regarding the total sales impact of these
programs. We conclude with implications for practitioners and researchers, and opportunities for
future research.
2. MODEL
2.1. Background
The model we develop is designed generally to be applicable to all loyalty programs
comprised of both frequency reward and customer tier components. However, our application
will be to a major airline’s loyalty program.
Regarding the frequency reward component, as described by Kopalle and Neslin (2003),
the first frequent flier program was launched by American Airlines in 1981. Over the years,
frequent flier programs have expanded rapidly, to the point that frequent flier miles have
essentially become “currency” for other reward programs such as those instituted by credit card
companies. Today, worldwide there are 120 million members of frequent-flier programs,
earning more than 650 billion miles per year (see www.FrequentFlier.com ).
For the airline we study, there are two broad classes of mileage redemption rewards: a
free upgrade (to first class) or a free flight. In other words, accumulations of R1 miles earned a
customer a free upgrade while R2 miles earned the customer a free flight (where R2 > R1). As is
the hallmark of frequency reward programs, the reward was ephemeral (both an upgrade and free
6

flight are consumed once and that is it), and the customer was required proactively to contact the
airline and cash-in their points in order to receive the reward.
The customer tier component placed customers in one of three tiers (Silver, Gold, and
Platinum) depending on how many paid miles they had flown during the past calendar year.
Membership in different tiers made the customer eligible for different bundle of benefits,
including complimentary upgrades, companion upgrades, priority lines, check-in, expedited
security screening and boarding, lounge access, confirmed reservations, service recovery
assistance, priority wait listing for reward seats etc. Note that customers do not earn any mileage
on free flights and they cannot use mileages earned through tie-in programs such as credit cards
to build customer tier status. Upon reaching a tier threshold, customers were informed of their
status and provided with the service levels commensurate with their tier during the following
calendar year and if those customers tend to fly frequently with the airline (such as the customers
in our database), they would begin receiving many of those services right away. The three tiers
were silver (T1 miles), gold (T2 miles), and platinum (T3 miles where T1 < T2 < T3). Note as is
endemic to customer tier programs, the reward consisted of enhanced services delivered for an
extended period of time (e.g., one year), and membership in a tier was automatic.
2.2. Customer Decisions
We consider i=1,…,I customers who participate in the loyalty program1. At time t=1,…,T, each
customer makes one of K decisions. We define to equal 1 if customer i makes decision k at
time t. The K decisions are:
iktD
1 Note we do not model the question of whether to “participate” itself. This is because airlines make it free, very easy and encourage customers to sign up for the reward programs. However, some loyalty programs may require enrollment fees and effort and modeling this aspect is an avenue for future research.
7

(1)
⎪⎪⎩
⎪⎪⎨
⎧
⇒⇒⇒⇒
=
miles in-cashingby airline the withfreeFly 3upgrade free anfor miles in cash and airline theFly with2
miles incashing without airline theFly with1airline thisfly withNot 0
k
The decisions of not flying with the focal airline2 and flying but not cashing in miles are always
options for the customer. The decisions of cashing in miles for a free upgrade or cashing in for a
free flight are possible only if the customer has accumulated enough miles. We define the miles
accumulated to date as “inventory”. Total mileage inventory accrues according to the following
equation:
(2) itititit InCashedMilesAccruedMilesINVINV −+=+1
where,
= Customer i’s cumulative miles inventory at the beginning of period t+1
1+itINV
= Miles added to inventory for customer i during period t. Miles can
be added by either paid trips or through transfer of miles from the airline’s “earn partners” such as credit cards. Miles flown on free trips, i.e., trips taken by cashing in miles, do not account in the accumulation of inventory.
itAccruedMiles
= Miles cashed in for either an upgrade or a free flight by customer i
in period t. itInCashedMiles
The customer’s eligibility to cash in miles for either a free trip or upgrade depends on her current
inventory and the inventory requirements--which define the reward structure of the frequency
reward component. Denote R1 as the inventory requirement for an upgrade, and R2 as the
inventory requirement for a free flight (R2 > R1). As discussed later, in our data, about 90% of
mileage cash-ins fell into the following two categories: (i) mileage to cash-in for an upgrade,
which was between 15,000 and 35,000 miles with a mode of 25,000 miles and (ii) mileage to 2 Note includes “do not fly at all” and “flying with another airline.” We simply treat these two situations as “not fly with this airline” since it is difficult to distinguish between this two situations in our dataset.
0=k
8

cash-in for a free flight, which was between 40,000 and 60,000 miles with a mode of 50,000
miles. This is consistent with the firm’s mileage requirements for an upgrade and a free flight,
both of which varied based on the distance to destination but the most frequently used values for
R1 and R2 were respectively 25,000 and 50,000 miles. Thus, the possible decisions customer i
therefore can make at time t (Dikt) are such that:
(3) ⎪⎩
⎪⎨
⎧
≥<≤
<=
2
21
1
3,2,1,02,1,0
1,0
RINVifRINVRif
RINVifk
it
it
it
Customers can choose only k=0 or k=1 if their inventory is less than the requirement for an
upgrade (see equation 1). If they are eligible for an upgrade, they can choose k = 0, 1, or 2. If
they are eligible for a free flight, they can choose k = 0, 1, 2, or 3. In essence, we have an
economic model of consumer choice under cutoffs (see Swait (2001) for a detailed discussion).
Equations 1-3 depict the customer’s decisions regarding flying and cash-in inventory for
a reward. The customer-tier component of the loyalty program does not require an analogous
cash-in decision – the customer is assigned to a tier based on his/her cumulative paid miles
during a calendar year. Thus, we define membership in a customer tier as follows:
(4) , where, ⎩⎨⎧ <≤
= +
otherwiseTINVPTif
E sitsist 0
1 1
= Indicator variable signifying that customer i is in customer tier s at period t
istE
= Minimum requirement for being included in tier s sT = Inventory of paid miles flown by customer i at period t during a
calendar year itINVP
s = 1, . . . , S signifies the customer tiers. For our application, S = 3 and T1
= 25,000, T2 = 50,000, T3 = 75,000, T4 = ∞
9

At the beginning of each calendar year the inventory of paid miles is reset to 0 and it accrues
during the year according to the following equation:
(5) , where, ititit PMilesINVPINVP +=+1
itPMiles = Paid miles added to customer i’s corresponding inventory in period t
2.3. Customer Utility
Given the above definitions, following is the utility function (Uikt) for customer i in time t
if they choose decision k (i.e., ): 13
0
=∑=k
iktD
(6) ⎪⎩
⎪⎨
⎧
=++++
=+=∑ ∑∑∑= =
−=
−=
3
1
3
112
3
211
121
0
3,2,1
00
kikt
kikti
kikti
S
sistsiiktki
ti
ikt kforDDED
kforU
εββλλ
ε
We anchor the deterministic component of customer utility at zero if the customer decides not to
fly with the airline in period t (k = 0). If the customer decides to fly with the airline, the utility
depends on the intrinsic preference with the airline, whether the customer cashes in miles, is a
member of a customer tier, and has cashed in and/or flown with the airline in the previous
period.
The first term represents a customer’s marginal utility for each of the three choices. The
sum goes from 1 to 3, representing the decisions that involve flying without cashing in (k = 1)
cashing in for either an upgrade (k = 2) or a free flight (k = 3). If the customer chooses to take a
flight but not cash in (Di1t = 1), the contribution from this term is λi11 (since Dikt will = 0 for both
k = 2 and k = 3) as it represents customer i’s utility for flying without cashing in and
incorporates that customer’s overall preference for flying with the airline. If the customer cashes
in for an upgrade, the utility from this term will be λi12 (since Di2t will equal 1 and Di3t will equal
10

zero). If the customer cashes in for a free flight, the utility will be λi13 (since Di3t will equal 1
and Di2t will equal zero).
For customers who value the cash-in rewards, we expect the corresponding marginal
utility (λi12 and λi13) to be higher than that for flying but not cashing in (λi11). However, note that
λi12 and λi13 incorporate the net benefit minus the cost of cashing in. We cannot separately
identify the benefit from the cost. For those customers to whom the cost outweighs the benefit,
λi12 and λi13 would be lower than λi11 and may even turn out to be negative. That this could
occur is suggested by the fact that many customers do not trade in their miles even though they
qualify for a reward (Wall Street Journal, December 5, 2006). This could be because either the
cost is too high (loyalty program members try to cash-in but nothing is available--- Wall Street
Journal, December 5, 2006) or the benefit from cashing-in is too low (they may not want to fly
again for any reason or just may not care much about a upgrade to first class for a short trip they
are taking). However, we do expect that λi13 > λi12, since a free flight should be more valuable to
the customer than an upgrade. That is why the inventory requirement for a free flight is greater
than that for an upgrade. However, this is an empirical question to be answered.
The second term in equation (6) represents the contribution to utility from membership in
a customer tier. As described earlier, the different customer tiers in the airline’s program offer
differing sets of benefits. In this paper, we measure the average effect across the various benefits
of being in each of the three customer tiers. If the customer is in tier s, the contribution to utility
will be λi2s. We expect λi2,s+1 > λi2s because higher tiers bring more services, and λi2s should be
greater than zero for all s, because the customer tier brings only benefits; once the mileage
requirements are met, there is no effort required to obtain the reward.
11

The third term in equation (6) represents the rewarded behavior effect. If the customer
cashed in last period and received a reward, while that reward is ephemeral, it is possible as
previous research suggests, there is a positive carryover into future periods (Taylor and Neslin
2005; Lal and Bell 2003; Roehm, Pullins, and Roehm 2002; Bolton et al. 2000). In fact, this is
one way that a frequency reward program can truly enhance loyalty. We expect βi1 ≥ 0. A value
of zero would suggest the customer just “consumes” the upgrade or free flight without
subsequent reinforcement. A positive value suggests the customer is “delighted” with the reward
(Rust and Oliver, 2000) and now has more positive affect toward the airline (see Taylor and
Neslin (2005) for further discussion of the theory behind the rewarded behavior effect).3
The fourth term in equation (6) represents purchase event feedback or state dependence.
The value of βi2 could be positive, zero, or negative. A positive βi2 could occur if on average,
when flying this airline, customer i has a positive experience that carries over to the next period.
Or it could simply mean the customer is inertial. A zero value for βi2 would mean the customer
on average does not learn anything new about the airline on average, or is “zero-order” in the
sense that in each period the customer’s decision does not depend on whether he or she flew on
the airline last period. A negative value for βi2 would suggest either that on average, the
customer has a negative experience on this airline that carries over to the next period, or is a
variety seeker, eager to sample different airlines.
While both the rewarded behavior and state dependence terms in the utility function are
first-order, they can exert a multi-period effect. This is because they change utility in period t,
3 Note we assume the same β for the rewarded behavior effect, irrespective of which reward was received last period. We do this for two reasons. First is to simplify the model. Second, this reflects the assumption that within the range of rewards we study (upgrade or free flight), there is an equal carryover effect. Essentially, we assume “it’s the thought that counts” when it comes to generating positive carryover affect due to the frequency reward.
12

which alters the chance the customer will fly with the airline in period t, which through βi2 again
alters the chance the customer will fly with the airline in period t + 1, etc.
The last term in equation (6), εikt represents unobserved time-specific determinants of
customer i’s utility for making decision k. We assume these terms can be modeled as
independent, identically distributed extreme value random variables. Our treatment of the error
term is consistent with prior research in this area (Chib, Seetharaman, Strijnev 2004; Chintagunta
2002; Erdem, Imai, Keane 2003; Sun 2005) and the use of the extreme value distribution, not
very different in shape from the normal, enables us to derive a closed form expression for the
probability the customer will make decision k. This makes it easier to conduct policy
simulations and examining the behavior implied by the results.4
Note we do not include price in the utility function. There are three reasons why we do
not feel this is a crucial omission for our application. First, the set of customers we study are
frequent business travelers; relative to leisure travelers, price is less of a concern for such
customers since they are not paying the bill and are less likely to be making the flight reservation
themselves. Second, the focus of our study is on customer response to loyalty programs, and
there is little reason to believe the reward or the customer tier program variables in equation (6)
are correlated with price. Third is a more practical, data-related constraint. The airline from
which we obtained data has not recorded the prices available to its frequent fliers. Fourth, the
λi11 term in the model will capture the average utility for the airline due to its average price, and
the error term εikt will include random variation due to price discounts.
4 An alternative approach would be a nested logit model in which we allow customers to make the cash-in decision conditional on their flying decisions. We however decided to treat the fly and cash-in decisions simply as alternative choices for two reasons: First, from customer perspective, fly and cash-in decisions are made simultaneously and inter-dependently. It does not follow a two-step process as in the nested logit model. Second, it is difficult to solve a dynamic program with a nested logit specification.
13

2.4. Forward-looking Customers
The design of the loyalty program separates purchase from reward. Customers must
accumulate inventory miles in order to reap the rewards either of the frequency reward (cash-in)
or customer tier components of the program. This naturally requires customers to be forward-
looking. They take into account future reward utilities when making current purchase decisions.
For example, customers who really value being placed in a high customer tier will consider that
each flight adds to the likelihood they will achieve this goal. The same goes for customers who
highly value the cash-in reward. In essence, a forward-looking customer primarily faces the
following inter-temporal trade-offs: (a) sacrifice current utility of cash-in for a free flight in order
to accumulate inventory of paid miles toward increasing his/her tier status, (b) not cashing in first
level reward (upgrade) in order to obtain second level reward (free ticket), (c) less usage of the
“no-fly” option, i.e., fly more frequently with the airline to improve the total mileage and the
paid mileage. This decision process can be represented by a dynamic model, whereby the
customer makes current period decisions that maximize his/her long-term utility. We express
this as:
(7) ⎪⎭
⎪⎬⎫
⎪⎩
⎪⎨⎧∑ ∑∞
= ∈
−
∈ 1
1
τ
τττ δ
ititikt Ckikik
Ck,D]DU[EMax
where δ is the per period discount factor so that future utility is discounted to its equivalent
current utility. We follow convention and assume it a value of 0.995 (Lewis, 2004; Sun 2005).
The operator is the conditional expectation operator given the customer’s information at
time t. That is, the customer knows the value of the ε’s in period t, but not in future periods. The
value function (Bellman equation), expressing the maximum expected utility the customer can
expect, given he or she is in period t, is given by:
][⋅tE
14

(8) )]},,([{),,( 11,1,,1 iktittitiiktCkDiktititit DINVPINVVEUMaxDINVPINVVitikt
+++∈− += δ
The choice set, Cit, is given by equation (3) and the state variables are (i) inventory of total miles
(INVit) which is given by equation (2), (ii) inventory of paid miles during a year (INVPit), given
by equation (5), and (iii) past decisions, Dikt-1, that appear through the state dependence terms in
equation (6). The decisions are also driven by the two components of the loyalty program as
well as the coefficients in the utility function.
2.5. Customer Expectation of Future Demand
In the above model, at any time t when evaluating expected future utility, customers need to
incorporate their expectations of their future demand for flying with this airline for all periods
from time 1+= tτ and on (Bulkley 1992). Denote iρ as the probability of flying in each period
and as the amount of paid miles if the customer flies. We assume follows a
normal distribution with mean μi and standard deviation σI, that customers know the frequency
and probability distribution of the length of trips they might take in the future, and therefore
know these parameters. We believe this is a realistic assumption for business travelers, who
travel frequently and may not know where or whether they will be flying a month from now, but
they know the probability of traveling, and conditional on the flying decision, they know the
average miles they tend to fly and the spread around that average. We estimate
τiPMiles τiPMiles
iρ , μi and σi as
the sample frequency, mean and standard deviation for each customer’s individual-specific
history.
2.6. Heterogeneity and Estimation
15

In order to account for heterogeneity in customer demand, we adopt latent class segmentation
(Kamakura and Russell 1989). Let { }2,1;3,2,1,,,, 2121 === skciciscikcic ββλλω be the vector of
coefficients to be estimated for each latent class c, and { }C...ωωω 1= . Then, the likelihood
function of the sequence of choices of all customers is:
(9) ∏∏∑∑= = = =
− ∈•∈=•=I
i
C
c
T
t
K
kciktititiktikt ciciDINVPINVDDLL
1 1 1 11 )]Pr(),,,,|1Pr([)( ωω
where c indexes latent classes and )ciPr( ∈ is the probability customer i is in latent class c. We
consider to be parameters to be estimated representing the percentage of customers that
are in each segment.
)ciPr( ∈
Given the extreme value distribution of the error term, the probability of observing
customer i in latent class c making decision k at time t is:
(10) ∑∈
− =∈=
it
ijt
ikt
Cj
V
V
ciktititikt eeciDINVPINVD ),,,,|1Pr( 1 ω
The variable Vikt is the choice-specific value function, i.e., the maximum long-term utility the
customer can expect if he or she chooses decision k. Due to the complexity of the dynamic
programming problem, we adopt simulated maximum likelihood (Keane 1993) in addition to the
interpolation method (Keane and Wolpin 1994) to estimate the model.
3. DATA
Our data are from the frequent flier program of a major U.S. airline.5 The database
contains information for two years (May 1998 to April 2000) regarding 1707 customers.
Included are the date of each trip taken by each customer, arrival and departure cities, and the 5 In order to conform to the non-disclosure requirements imposed by this airline, the name of the airline is kept anonymous.
16

length of the trip in miles. Further, each trip is accompanied by a reward code that indicates
whether a reward was redeemed on that trip, and if so how many miles were used. The database
also provides information regarding the beginning inventory of miles at the start of the two-year
period for each customer. Further, miles accumulated on other affinity programs that count
towards a reward are noted at the time these miles are credited to the customer’s inventory.
We organized the data into biweekly periods. Thus, there were 51 decision periods for
each customer during the two-year time frame. Each customer took at most one trip with the
airline in each period.6 These customers consist of 454 (26.6%) heavy users, 1014 (59.4%)
moderate users and 239 (14.0%) light users. Heavy users include those who took 40 or more
trips in the two-year period. Moderate users are defined as those who made 25 or more but less
than 40 trips during the period. Light users are those who made less than 25 trips in the two-year
period. The average customer accumulates approximately 6,500 miles during an average trip
and the average flying frequency during the two year period is about 36 trips. Approximately
75% of these customers cashed in their miles at least once during the two-year period. For
estimating the model, we chose a random sample of 200 customers.
As discussed earlier, we consider 2 levels of frequency reward and 3 levels of customer
tiers offered by the airline. For the frequency reward component, one level corresponds to a free
upgrade (25,000 mileage level) and another corresponds to a free flight (50,000 mileage level).
Apart from directly examining the miles, we further observed that for free flight cash-ins, the
customer does not receive flying mileage while such mileage is awarded for an upgrade. Figure
1a shows the frequency distribution of cash-in’s in the data. The modal cash-in frequency is one
and may reflect the costs/hassle of cashing-in an airline reward. Among those who cash-in,
6 We checked for seasonality in customers’ frequency of flying via three season dummies to represent Fall, Winter, Spring, and Summer seasons and found no significant (p < .05) evidence of seasonality.
17

Figure 1b plots the relative frequency of mileage cash-ins and as mentioned earlier, there were
primarily two classes of cash-ins: free upgrade (about 25000 miles) and a free trip (about 50000
miles). Figure 1c shows the initial inventory of miles in our data; interestingly, we find that the
high mileage redemptions were made by those individuals who have very high initial inventory
of miles to begin with. In our estimation, when we update a customer’s mileage inventory, we
use the observed redeemed miles. Further, in our data there were no instances where a cash-in
by a customer was not simultaneously accompanied by a reward (free upgrade or a free ticket).
[Insert Figures 1a, 1b, 1c About Here]
At the beginning of first calendar year, customers were assigned to different customer
tiers based on their respective inventory of paid miles. Similarly, at the end of the first calendar
year (i.e., beginning of the second calendar year), customers were reassigned to appropriate
customer tiers based on the number of paid miles flown with the airline during the first calendar
year. The respective mileages required were 25,000 flying miles (silver), 50,000 flying miles
(gold), and 75,000 flying miles (platinum).
4. RESULTS
4.1. Fit and Holdout Prediction
[Insert Tables 1a and 1b About Here]
We estimated four models: (i) myopic model with two latent segments, (ii) dynamic
model with one segment, (iii) dynamic model with two segments, and (iv) dynamic model with
three segments. The discount factor, δ, in Equation (8) is set to 0 in the myopic model while it is
set at .995 in the dynamic model. Fit statistics for the above four models are provided in Table
18

1a (the number of observations are given by 200 customers times 51 decision periods). The two-
segment dynamic model provides the best fit according to AIC and BIC.
The superiority of the two-segment dynamic model is supported by performance of the
model in a holdout sample. We applied the model to 200 customers not used in the estimation,
and calculated the same fit statistics as in Table 1a. In the holdout sample, we use the estimated
proportions of the two segments as our priors for segment membership (6.3% for the first
segment and 93.7% for the second segment) for all customers. We then update our belief for
each customer by incorporating the likelihood from his/her entire decision sequence. Finally, we
compare the posterior of the customer with the prior and assign customers with posteriors greater
than 93.7% to the second segment and others to the first segment. The corresponding fit
statistics are shown in Table 1b. The two-segment dynamic model performs best. The log-
likelihood results show the model outperforms even the three-segment dynamic model, despite
that model having nine extra parameters. On a BIC basis, the two-segment model is clearly
superior.
4.2. The Two-Segment Solution
[Insert Table 2 About Here]
Table 2 reports the mean parameter estimates and their standard errors for the two-
segment model. The results are quite interesting:
• Segment 1 derives positive utility from the frequency reward program, having positive
coefficients for the immediate value of both levels of frequency reward (λi12, λi13) and these
coefficients are higher than the marginal utility from flying without cashing-in. Also,
Segment 1 values the second-level (free flight) benefit marginally more than the upgrade
19

benefit. Segment 2 in contrast has negative utility for the immediate value of the frequency
reward program and is less likely to fly via cashing in. This is consistent with the large
number of non-cashed in miles known to exist for frequent flier programs. For these people,
the reward is not worth the hassle of cashing in. Note the parameter estimate for the free
flight is more strongly negative than that for the upgrade. This may be due to the added
hassle of finding a free flight given blackout dates, availability, etc.
• Both segments value the customer tier benefits, and in ascending order as hypothesized. The
positive coefficients for λi2s suggest that there would be a boost in customer utility once they
reach an elite tier status as they receive service benefits for an extended period of time. This
will elevates the customer purchase probability with the airline for the longer period.
• Given the first two observations, we label the first segment “deal-prone” in that they have
strong interest in the ephemeral frequency reward, which is similar to a promotion. We label
the second segment “service-oriented”, since they distinctly derive no net immediate benefit
from the frequency reward program, yet have positive value for the customer tier program.
• The “service-oriented” segment is the vast majority, 93.7%, of the sample, while the “deal-
prone” segment is 6.3%. This perhaps reflects the hassle cost many customers perceive in
cashing in miles for rewards. Also, our sample is frequent travelers, and it makes sense that
most of them would value service more than short-term deals.
• There is support for the rewarded behavior effect. The carryover coefficient for cash-in (βi1)
is positive as hypothesized. It is intuitive that this coefficient would be positive for the “deal-
prone” segment, since they value the cash-in reward. However, the effect is also positive for
the “service-oriented” segment. This may seem paradoxical given the negative net utility
they have for the immediate value of the frequency reward. However, this can be interpreted
20

as follows. The service segment will not naturally cash in because the short-term benefit is
not worth the cost. However, if some unobserved factor (captured in the error term in
equation 6) induces them to cash in a reward (e.g., perhaps their travel agent volunteers to do
most of the work for them), the value of the free flight or upgrade creates positive affect
which carries over to the next period.
• There is positive state dependence for both segments, i.e., on average, either through inertia
or a positive usage experience, flying the airline in period t tends to increase the customer’s
perceived utility of flying with the airline in period t + 1.
[Insert Table 2 About Here]
We conducted another hold-out test where we used the parameter estimates in Table 2
and segmented 1000 randomly selected customers (not used either in the estimation sample--
Table 1a or the holdout analysis--Table 1b) into one of the two segments. Based on the
segmentation, further information on the “deal-prone” versus “service-oriented” segments is
provided in Table 3. The table shows, as expected, that the “service-oriented” segment cashes in
less frequently than the deal-oriented segment, and more of them are members of customer tiers.
[Insert Table 3 About Here]
4.3. Points Pressure and Rewarded Behavior Effects
Points Pressure: Points pressure refers to the build-up in purchase frequency induced by
the goal of achieving a reward. We find evidence of points pressure for both the frequency
reward and customer tier components of the loyalty program. This is demonstrated in Figure 2,
where we use simulations of the model to calculate the likelihood of flying as the customer gets
closer to earning the reward.
21

[Insert Figure 2 About Here]
In Figure 2a, we see that the attractiveness of the customer tier program causes both
segments to increase their flying likelihood as they get closer to earning membership in a
customer tier. The flying probability is the average purchase probability across customers and
across the three customer tier levels. Figure 2b depicts the points pressure effect for the
frequency reward component. Points pressure exists for the “deal-prone” segment, but not for
the “service-oriented” segment. This is because the “deal-prone” segment values the reward so
the utility of the reward looms larger as customer’s inventory gets closer to the reward level.
This is not so for the “service-oriented” segment, who actually have net disutility for the reward.
As the customer gets closer to the frequency reward level, the customer anticipates he or she will
continue to fly without cashing in, so there is no change in maximum utility as this customer gets
closer to the reward level, and purchase likelihood remains steady.
Rewarded Behavior: Rewarded behavior refers to positive carryover after a frequency
reward is cashed in. Our goal here is to examine customer behavior prior to and after cashing-in.
Since different customers cash-in at different points in time, we rescale periods such that period
0 refers to the period of cashing-in and a period of -5 (+5) represents five periods prior to (after)
cashing-in. Figure 3 demonstrates the effect. We find evidence for this effect for both segments,
although the effect is fairly short-term.
[Insert Figure 3 About Here]
Figure 3a illustrates the case of the “deal-prone” segment. Purchase probability,
averaged across the two reward levels, increases during the cash-in period (0) because the reward
has positive utility. Then in the period after the reward is cashed in, we see that purchase
probability is still elevated. This is the positive carryover. Note, however, that the effect is not
22

that strong that it reverberates for several periods. It effectively dies out after just one period.
The rewarded behavior effect was included as a one-period lag, but if the rewarded behavior
effect were strong enough, it would exert its impact for several periods through the state
dependence term, which is positive. The point is that the rewarded behavior effect exists, and
indeed helps win back some paid flights. But the effect is not very long-term. Further,
consistent with Figure 2b, due to the points pressure effect, the purchase probability is higher in
several periods prior to the cash-in period.
Figure 3b shows the case the “service-oriented” segment. There is no increase in
purchase likelihood during the cash-in period because the immediate utility of the reward is
negative. The only reason the “service-oriented” customer would cash in would be an
unexpected “shock” to the error term for either k = 2 or 3 in equation (6). However, once the
customer has taken that free flight, there is a rewarded behavior effect in the next period. At the
outset, it may seem contradictory that the “service-oriented” segment derives negative utility
from cashing-in a reward (which reflects that the cost of redeeming a reward outweighs the
benefit) but exhibits positive state dependence with respect to cashing-in. However, such
behavior is consistent with the cognitive dissonance framework (Harmon-Jones and Mills 1999,
p. 7). Following an effort-justification paradigm (Beauvois and Joule 1996), dissonance is
aroused whenever a person engages in an unpleasant activity (such as the hassle of dealing with
an airline to redeem miles) to obtain some desirable outcome (a free upgrade or a free trip). The
higher the unpleasant effort required to obtain the outcome (the cash-in reward), the greater the
dissonance and customers reduce such dissonance by highlighting the positive aspect of the
outcome (i.e., the freebie) post-purchase, as reflected in the positive state dependence of cashing-
in (see also Dodson, Tybout, and Sternthal 1978). However, as is the case with the rewarded
23

behavior effect for the “deal-prone” segment, the impact is short-lived. It isn’t strong enough to
carry over several periods. Moreover, similar to Figure 2b, we do not see any consistent points
pressure effect prior to the cash-in period.
4.4. Policy Implications: Overall Impact of Loyalty Programs on Customer Behavior
We simulate the model to investigate the overall impact of both the frequency reward and
customer tier components of the loyalty program on the total expected number of no cash-in,
upgrade, and free flights, and the resultant total. Given that we have a dynamic structural model,
our results are less vulnerable to the Lucas critique (Lewis 2004, Sun 2005). We used the model
parameters in Table 2 to simulate four scenarios: (1) the firm employs neither the frequency
reward nor the customer tier component, (2) the firm employs both frequency reward and
customer tier components, (3) the firm employs the frequency reward but not the customer tier
component, (4) the firm employs the customer tier but not the frequency reward component.
Under each scenario, we simulate customer behavior in each of the two segments for 52 periods
and record the steady state expected number of choices per customer per period. The expected
number of flights without cashing in is calculated as the average, over customers and time
periods, of the probability of choosing k = 1, i.e., fly without cashing in. Similarly, we calculate
the expected number of upgrade flights (k=2) and cash-in flights (k=3). The results of the
simulation are presented in Table 4. and yield several conclusions:
[Insert Table 4 About Here]
First, without any program, “deal-prone” customers are less likely to fly this airline than
the “service-oriented” customers (0.6603 flights per customer per period versus 0.7297). This is
due to the fact that the baseline utility of flying (λi11) for the deal-prone segment is low.
24

Second, both segments respond to the customer tier program. This can be seen by
comparing the base case scenario (1) to the customer tier only scenario (4). For the deal prone
segment, the expected number of total flights per customer per period increases from 0.6603 to
0.7261 (all of these are flights with no cash (k=1) because there are no cash-ins with the
customer tier program). For the service-oriented segment, the number of flights increases from
0.7297 to 0.7740. This is because both segments have positive coefficients for the customer tier
program. As a result, there is a points pressure effect (Figure 2a) as customers strive to reach a
higher customer tier, and an increase in utility for both segments once they reach that tier (λi21,
λi22, λi23 in Table 2).
Third, the deal prone segment responds to the frequency reward program whereas the
service-oriented segment does not. This can be seen most clearly in the frequency reward only
scenario (3). For the deal prone segment, the expected number of upgrade flights per customer
per period is 0.0696, and the expected number of cash-in free flights is 0.0517. For the service-
oriented segment, the corresponding numbers are only 0.0014 and 0.0004. This reflects the
positive utility the deal prone segment has for cashing in contrast to the negative utility the
service-oriented segment has for this program (λi12, λi13, in Table 2).
Fourth, while the frequency reward program generates many free cash-in flights, the net
number of paid flights –flights with no cash-in plus flights with upgrades – increases. Focusing
on the deal prone segment that reacts to the program, under the frequency reward only scenario
(3), the number of flights with no cash-in decreases (from 0.6603 to 0.6375), but this is offset by
the number of cash-in upgrades, 0.0696. As a result, the number of paid flights goes from
0.6603 to 0.6375 + 0.0696 = 0.7071. While there is a net increase in the number of paid flights,
it is interesting that the number of no cash-in flights decreases. On one hand, points pressure and
25

rewarded behavior effects increase the number of no cash-in flights. However, some of the cash-
in upgrades, as well as the unpaid for cash-in free flights, are substituting for no cash-in flights.
In this case the balance turns out so there still is an increase in the total number of paid flights.
Fifth, there is little cannibalization between the two program components. The increase
in the number of paid flights when including both components is only slightly less than the sum
of the gains from including both components separately. In the deal prone segment, the number
of paid flights increases by 0.0468 (0.7071-0.6603) when the frequency program is offered
alone, and by 0.0658 (0.7261-0.6603) when the customer tier program is offered alone. If there
were no cannibalization, when we offered both programs, the total number of paid flights would
be 0.6603+0.0468+0.0658 = 0.7729. In fact, the total number of paid flights when both
programs are offered turns out to be 0.7016+0.0697 = 0.7713, hardly any cannibalization. The
same trend holds for the service-oriented segment. This says that even within segment, the
customer’s efforts to achieve both customer tier status and free upgrades and flights do not
interfere with each other. In terms of the number of paid flights, the firm is better off including
both components of the program.
5. SUMMARY AND DISCUSSION
We have developed and estimated a dynamic structural model for evaluating the impact
of both the frequency reward and customer tier components of loyalty programs. The model
captures forward-looking behavior, in that when customers make current decisions of whether to
fly, they take into account the impact on their points inventory, which brings them closer to
receiving a reward or maintaining their customer tier status. The model captures the ephemeral
aspect of the frequency reward program, in that the reward operates for just one period, and we
26

model the customer’s decision of whether it is worth it for him or her to cash in inventory for the
reward. In tandem, the model also captures the long-term benefits of the customer tier program,
where once the customer meets the requirement for assignment to a specific tier, the customer
receives the benefits for a longer term.
The results are quite interesting and confirm many of our expectations. We find as
expected that customers are quite heterogeneous with respect to their response to these programs.
We find a “deal-prone” segment that values the frequency reward program as well as the
customer tier program, and a “service-oriented” segment that finds the frequency reward not
worth the effort, yet highly values the customer tier. The “service-oriented” segment is the vast
majority in our sample. We conjecture this is due to the customers in our sample all being
frequent fliers – averaging 0.71 flights per two-week period, or about 18 flights per year with the
focal airline alone. More flights, even for free, are not very attractive to such people. Plus, for
business travelers, the hassle costs of cashing in and finding a non-blacked-out flight are very
high.
We find as expected that both customer segments value the benefits of higher customer
tiers more than lower tiers. This is more of a validity test than a finding, since one would expect
that customers, all else equal, prefer the more services provided by higher tiers. The “deal-
prone” segment seems to value a free flight a little more than an upgrade, and indeed, for the
frequent flier, one could imagine an upgrade to be close to the value of a free flight.
We also find, as hypothesized, significant points pressure effects, whereby customers
increase purchase likelihood as they get closer to a reward, and rewarded behavior effects,
whereby cashing in the ephemeral frequency reward in the form of a free flight or an upgrade has
a positive impact on purchase likelihood in the subsequent period.
27

In terms of the total impact of each program, both loyalty program components increase
the number of paid flights. The customer tier impact is simple. It increases the number of paid
flights through points pressure encouraging the customer to rise to a high tier, and then delivers
positive utility once the customer gets to that tier. The frequency reward impact is more
complex because this program widens the customer’s choice set to include upgrade cash-ins
(which are paid flights) and free-flight cash-ins (which are not paid for). Both of these can
cannibalize the number of no cash-in paid flights. In fact, we find that the number of no cash-in
paid flights does decrease under the frequency reward program, but this is more than offset by
the number of upgrade cash-ins.
This work has several implications for managers and researchers: From a managerial
perspective, our results have several implications:
• Loyalty programs consist of two distinct components – customer tier and frequency reward.
These components elicit different responses and need to be managed separately.
• The customer tier component is probably closer to what a loyalty program should be in terms
of actually increasing loyalty (Shugan 2005). Like any reward program, there is a points
pressure effect as customers increase their purchase rate to make it to a high tier. Then the
reward program continuously reinforces purchase behavior because it delivers a consistently
higher level of service.
• At the outset, loyalty programs, particularly the frequency reward program, may appear
unsuccessful because the number of no cash-in paid flights may decrease. However, this
could be offset by an increase in upgrade cash-in flights that are paid for, so the total number
of paid flights increases.
28

• For the frequency reward component, paid flights (either including or not including upgrade
cash-ins) can be maximized by setting program requirements correctly. If program
requirements are lax, there will be minimal points pressure, but many cash-ins and hence
ample rewarded behavior. If the requirements are tough, there will be more points pressure,
but not many cash-ins so less rewarded behavior. The optimal design will strike the right
balance. To probe this, we conducted simulations to determine the frequency reward levels
that would improve the number of paid no-cash-in flights. The current requirements for the
frequency reward component are 25,000 (free upgrade) and 50,000 (free flight) miles. We
varied the free upgrade requirement from 10,000 miles to 60,000, and the free flight
requirement from 20,000 to 120,000, both in steps of 10,000. In order to focus on the
frequency rewards, the customer-tier program was turned off in this case. We found that
while lower mileage requirements would encourage more flying, overall there was a
significant cannibalization of paid no cash-in flights. We found that when the mileage
requirements for the two reward levels were increased to 60,000 and 120,000 miles, the
expected number of paid no cash-in flights increased to about .74 compared to .723 when the
requirements were 25,000 and 50,000.
• The customer tier program also presents challenging design issues. If the tier requirements
are too lax, there is not much points pressure, but once the customer reaches a tier, paid
flights increase because the customer receives continuously better service. If the
requirements are too tough, we get more points pressure, but it takes customers longer to
reach a tier, and many may not make it. This in turn diminishes the elevated purchase
probability that is associated with a customer receiving continued higher service levels upon
reaching an elite tier. To focus on the customer tier program, we turned off the frequency
29

reward program and varied the mileage requirements for silver, gold, and platinum tiers from
10,000, 20,000, and 30,000 miles to 40,000, 70,000 miles and 100,000 miles in steps of
10,000 miles. We found that the expected paid flights improve from .77 (current case
without a reward program) to about .79 where the respective mileage requirements for the
three customer tiers are 10,000, 20,000, and 30,000 miles. These are easier requirements
than currently used by this airline. Evidently, the long-term increase in paid flights due to
improved service is stronger than the points pressure effect needed to get there. However,
note of course that this might not maximize profits. The costs of providing extended services
may be convex in the number of customers in a given tier. E.g., the cost to an airline of
providing personal service calls and uncrowded airport lounges may rise exponentially as a
function of the number of customers promised this service.
• Consistent with our findings, it is interesting to observe that firms have recently been moving
toward tougher requirements for frequency rewards (e.g., through the “inflation” in award
points, New York Times, December 24, 2006) while emphasizing the benefits of a customer
tier programs (New York Times, December 26, 2006).
For researchers, we have the following implications:
• It is feasible and advisable to study in the same model both the frequency reward and
customer tier components of loyalty programs. The effects of these programs are quite
different so researchers need to make the distinction between the two when examining
“loyalty programs.”
• We reinforce previous research that identified points pressure and rewarded behavior effects.
However, we show that points pressure only occurs if customers value the reward! The
30

“service-oriented” segment in our sample exhibited no points pressure in building up toward
the frequency reward, because they did not attach positive utility to the reward.
• The finding that a frequency reward can provide net negative utility suggests further research
is needed to study the positive and negative aspects of these rewards. We are able to estimate
the net benefits minus costs because we model the cash-in decision, and we believe this is a
contribution. However, further research is needed to better understand how to minimize the
perceived costs of cashing in, and in fact, whether it is worth it.
• We also need to better understand the circumstances under which it is better for firms to offer
free product versus other types of rewards (e.g., Kim, Shi, and Srinivasan 2001) or combine
currencies for cash-in (e.g., Drèze and Nunes 2004). The benefit to the firm of offering free
product is low marginal cost, e.g., in the case of free flights, free overnight stays at hotels,
etc. While in our sample, the frequency reward program actually resulted in a reduced
number of flights without cash-ins, there was indeed a net increase in paid flights total due to
upgrade cash-ins. However, in programs that only include free products and not upgrades, the
free product would cannibalize existing sales.
There are several avenues for extending this research. First is simply generalization. Our
model or extensions of it need to be applied to different venues; different industries. Second, an
ideal model should include competition. We could not do this because as in most database
marketing situations, we only had data on customer behavior with our client company. It should
not be hard to extend our framework to include competition; one would just extend customer’s
choice set. However, finding the data would be difficult. For instance, no airline that we know
of has data on the complete choice behavior of any given set of customers. Further, as suggested
by Shugan (2002), monopolistic characterizations are often useful. Third, as mentioned above,
31

future work should delve deeper into our finding that the net value of a frequency reward can be
negative. What are the factors that decrease perceived costs and increase perceived value (see
Kivetz and Simonson (2002, 2003), Kwong and Soman (2006), and Roehm, Pullins, and Roehm
(2002) for insights on the value side of the equation)? In an economic equilibrium sense, should
programs be designed so that in fact the net value of the reward is negative for a certain
percentage of the population?
These future research topics undoubtedly just illustrate a few additional avenues. The
importance of loyalty programs in the management community, plus we hope the insights
illustrated by the results of this paper, demonstrate the value of these future endeavors.
32

References Beauvois, Jean-Léon, and Joule, Robert-Vincent. 1996. A radical dissonance theory.
London: Taylor and Francis. Blattberg, Robert C. and John A. Deighton. 1996. Manage marketing by the customer
equity test. Harvard Business Review. 74 (July-August), 136-44. Bolton, Ruth N., P.K. Kannan and Matthew D. Bramlett. 2000. Implications of loyalty
program membership and service experiences for customer retention and value. Journal of the Academy of Marketing Science. 28 (1), 95-108.
Bulkley, George. 1992. The role of loyalty discounts when consumers are uncertain of the
value of repeat purchases. International Journal of Industrial Organization. 10, 91-101. Butscher, Stephan A.. 1998. Limited loyalty programs create strategic databases. Marketing
News. 31 (October 27), 13. Chib, Siddhartha, P. B. Seetharaman, and Andrei Strijnev. 2004. Model of brand choice
with a no-purchase option calibrated to scanner-panel data. Journal of Marketing Research. 41 (May), 184-196.
Chintagunta, Pradeep. 2002. Investigating category pricing behavior in a retail chain.
Journal of Marketing Research. 39 (May), 141-154. Daly, Donal. 2001. eCRM – Building relationships online? Seattle24x7, accessed
at http://www.seattle24x7.com/advisorx/donaldaly.htm on November 21, 2006. Deighton, John A. 2000. Frequency programs in service industries. in Handbook of
Services Marketing and Management. Dawn Iacobucci and Teresa A. Swartz, eds. Dodson, Joe A., Alice M. Tybout, and Brian Sternthal. 1978. Impact of deals and deal
retraction on brand switching. Journal of Marketing Research. 15 (1), 72-81. Dowling, Grahame R. and Mark Uncles. 1997. Do customer loyalty programs really
work?. Sloan Management Review. 38 (4), 71-82. Drèze, Xavier and Joseph C. Nunes. 2004. Using combined-currency prices to lower
consumers’ perceived cost. Journal of Marketing Research. 41 (February), 59-72. Erdem, Tülin, Susumu Imai, and Michael P. Keane. 2003. Brand and quantity choice
dynamics under price uncertainty. Quantitative Marketing and Economics. 1 (1), 5-64. Erdem, Tülin, and Michael P. Keane. 1996. Decision-making under uncertainty: capturing
dynamic brand choice processes in turbulent consumer goods markets. Marketing Science. 15 (1), 1-20.
33

Gönül, Füsun and Kannan Srinivasan. 1996. Estimating the impact of consumer
expectations of coupons on purchase behavior: A dynamic structural model. Marketing Science. 15 (3), 262-279.
Gupta, Sunil, Donald R. Lehmann, and Jennifer Ames Stuart. 2004. Valuing customers.
Journal of Marketing Research. 41 (1), 7-18. Harmon-Jones, Eddie and Judson Mills. 1999. Cognitive dissonance: Progress on a
pivotal theory in social psychology. Washington, DC: American Psychological Association.
Hartmann, Wesley R. and V. Brian Viard. 2006. Do frequency reward programs create
switching costs?” Working Paper. Graduate School of Business, Stanford University. Kamakura, Wagner A., and Gary J. Russell. 1989. A probabilistic choice model for market
segmentation and elasticity structure. Journal of Marketing Research. 26 (4), 379-390. Keane, Michael P. 1993. Simulation estimation for panel data models with limited
dependent variables. G. S. Maddala, C. R. RAo, H. D. Vinod, eds. Handbook of Statistics. North Holland, Amsterdam, The Neterhlands, 545-572.
Keane, Michael P., Kenneth I. Wolpin. 1994. Solution and estimation of dynamic
programming models by simulation. Review of Economics and Statistics. 76(4) 648-672.
Keiningham, Timothy L., Terry G. Vavra, and Lerzan Aksoy. 2006. Managing through
rose-colored glasses. Sloan Management Review. 48 (1), 15-18. Kim, Byung-Do, Mengzhe Shi and Kannan Srinivasan. 2001. Reward programs and tacit
price collusion. Marketing Science. 18 (3), 59-76. Kivetz, Ran and Itamar Simonson. 2002. Earning the right to indulge: Effort as a
determinant of customer preferences toward frequency program rewards. Journal of Marketing Research. 39 (2), 155-170.
Kivetz, Ran and Itamar Simonson. 2003. The idiosyncratic fit heuristic: Effort advantage as
a determinant of consumer response to loyalty programs. Journal of Marketing Research, 40 (4), 454-467.
Kivetz, Ran, Olege Urmininsky, and Yuhuang Zheng. 2006. The goal-gradient hypothesis
resurrected: Purchase acceleration, illusionary goal progress, and customer retention. Journal of Marketing Research. 43 (1), 39-58.
Klemperer, Paul D. 1987. Markets with consumer switching costs. Quarterly Journal of
Economics. 102 (2), 375-394.
34

Klemperer, Paul D. 1995. Markets when consumers have switching costs: An overview
with applications to industrial organization, macroeconomics, and international trade. Review of Economic Studies. 62 (213), 515-539.
Kopalle, Praveen and Scott A. Neslin. 2003. The economic viability of frequency reward
programs in a strategic competitive environment. Review of Marketing Science. 1 (1), Accessed at http://www.bepress.com/romsjournal/vol1/iss1/ on November 21, 2006.
Kumar, Nanda and Ram Rao. 2003. Effect of loyalty card programs on supermarket prices.
Working Paper. School of Management, University of Texas at Dallas. Kwong, Jessica Y. Y. and Dilip Soman. 2006. The role of fluency in the decision to spend
loyalty program points. Working Paper. University of Toronto. Lal, Rajiv, and David E. Bell. 2003. The impact of frequent shopper programs in grocery
retailing. Quantitative Marketing and Economics. 1 (2), 179-202. Lewis, Michael. 2004. The influence of loyalty programs and short-term promotions on
customer retention. Journal of Marketing Research. 41 (3), 281-292. New York Times. 2006. I’m elite and you’re not. December 26. New York Times. 2006. Hotel reward programs: That ‘free’ hotel stay gets less free.
December 24. Nunes, Joseph C. and Xavier Drèze. 2006. The endowed progress effect: how artificial
advancement increases effort. Journal of Consumer Research. 32 (March), 504-512. Peppers, Don, and Martha Rogers. 1997. Enterprise one to one. New York: Doubleday. Reichheld, Frederick F. 1994. Loyalty and the renaissance of marketing. Marketing
Management. 2 (4), 10-21. Reichheld, Frederick F. 1996. The loyalty effect: the hidden force behind growth, profits,
and lasting value. Boston: Harvard Business School Press. Reichheld, Frederick F., and Christine Detrick. 2003. Loyalty: A prescription for cutting
costs. Marketing Management. 12 (5), 24-25. Reinartz, Werner, Jacquelyn S. Thomas, and V. Kumar. 2005. Balancing acquisition and
retention resources to maximize customer profitability. Journal of Marketing. 69 (January) 63-79.
Reynolds, Jonathan. 1995. Database marketing and customer loyalty: Examining the
evidence. European Retail Digest. Oxford, UK: Oxford Institute of Retail Management.
35

Issue 7 (July), 31-38. Roehm, Michelle L., Ellen Bolman Pullins, and Harper A. Roehm Jr. 2002. Designing
loyalty-building programs for packaged goods brands. Journal of Marketing Research. 39 (2), 202-213.
Rust, Roland T., and Richard L. Oliver. 2000. Should we delight the customer. Journal of
the Academy of Marketing Science. 28 (1), 86-94. Sharp, Byron and Anne Sharp. 1997. Loyalty programs and their impact on repeat-purchase
loyalty patterns. International Journal of Research in Marketing. 14 473-486. Shugan, Steven M. 2002. Editorial: marketing science, models, monopoly models, and why we
need them. Marketing Science. 21(3) 223-228. Shugan, Steven M. 2005. Brand loyalty programs: Are they shams?” Marketing Science.
24 (2), 185-193. Sun, Baohong. 2005. Promotion effect on endogenous consumption. Marketing Science. 24
(3), 430-443. Sun, Baohong, Scott A. Neslin and Kannan Srinivasan. 2003. Measuring the impact of
promotions on brand switching under rational consumer behavior. Journal of Marketing Research. 40 (4), 389-405.
Swait, Joffre. 2001. A non-compensatory choice model incorporating attribute cutoffs.
Transportation Research Part B. 35, 903-928. Taylor, Gail Ayala. and Scott A. Neslin. 2005. The current and future impact of a retail
frequency reward program. Journal of Retailing. 81 (4), 293-205. van Heerde, Harald J., Marnik G. Dekimpe, and William P. Putsis Jr., 2005. Marketing models
and the Lucas critique. Journal of Marketing Research. 42 (1), 15-21. Venkatesan, Rajkumar and V. Kumar. 2004. A customer lifetime value framework for
customer selection and resource allocation strategy. Journal of Marketing. 68 (4) 106- Wall Street Journal. 2006. Making use of frequent-flier miles gets harder. December 5, D5. Zeithaml, Valarie A., Roland T. Rust, and Katherine N. Lemon. 2001. The customer pyramid:
creating and serving profitable customers. California Management Review. 43 (4), 118-142.
36
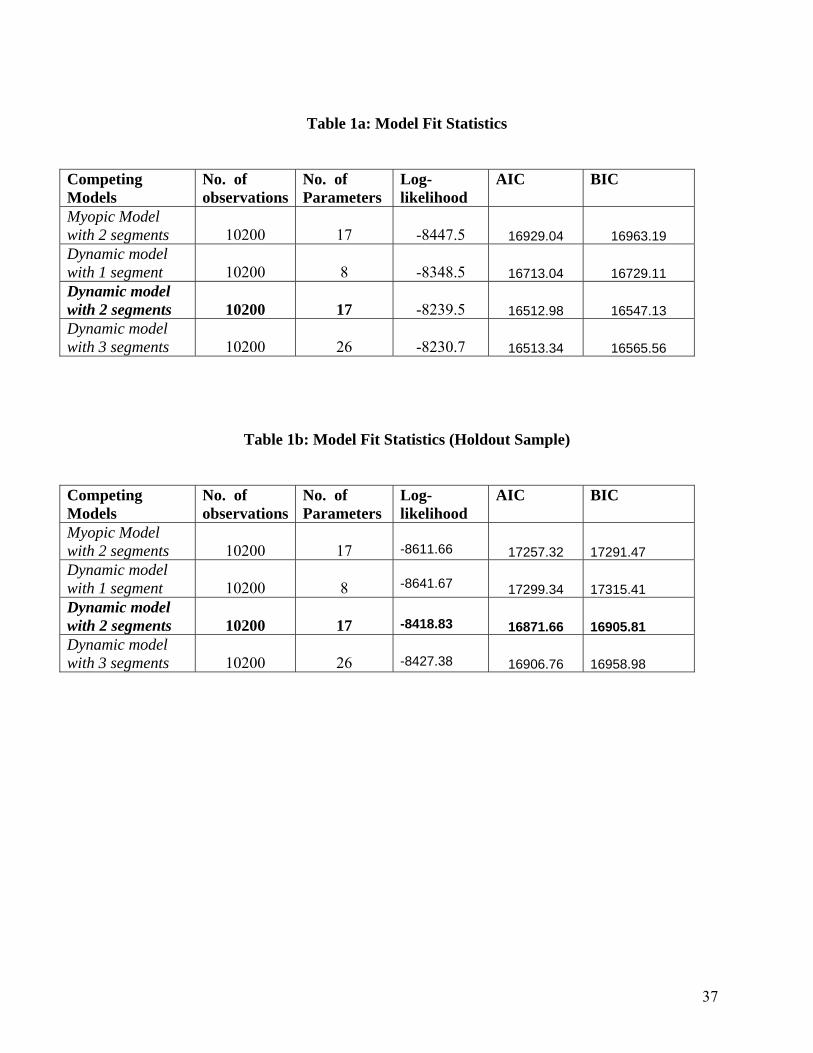
Table 1a: Model Fit Statistics
Competing Models
No. of observations
No. of Parameters
Log-likelihood
AIC BIC
Myopic Model with 2 segments
10200
17
-8447.5 16929.04 16963.19
Dynamic model with 1 segment
10200
8
-8348.5 16713.04 16729.11
Dynamic model with 2 segments
10200
17
-8239.5 16512.98 16547.13
Dynamic model with 3 segments
10200
26
-8230.7 16513.34 16565.56
Table 1b: Model Fit Statistics (Holdout Sample)
Competing Models
No. of observations
No. of Parameters
Log-likelihood
AIC BIC
Myopic Model with 2 segments
10200
17
-8611.66
17257.32 17291.47
Dynamic model with 1 segment
10200
8
-8641.67 17299.34 17315.41
Dynamic model with 2 segments
10200
17
-8418.83 16871.66 16905.81
Dynamic model with 3 segments
10200
26
-8427.38 16906.76 16958.98
37

Table 2. Parameter Estimates (Dynamic Model with Two Latent Segments)
Segment 1 (6.3%) “Deal-prone”
Segment 2 (93.7%) “Service-oriented”
Parameter Estimates
Standard Errors
Parameter Estimates
Standard Errors
Utility of fly and no cash in (base utility, λi11)
0.615 0.117
0.751 0.038 Utility of first-level cash-in (λi12)
1.562 0.071
-5.49 1.043
Utility of second-level cash-in (λi13)
1.765 0.121
-9.89 1.651
Utility of first customer-tier (λi21)
0.322 0.133
0.055 0.054
Utility of second customer-tier (λi22)
0.539 0.115
0.141 0.048
Utility of third customer-tier (λi23)
0.748 0.095
0.224 0.042
Inertia of cash-in (βi1)
0.445 0.111
0.603 0.100
Inertia of flying (βi2)
0.424 0.146
0.375 0.033
38

Table 3
Characteristics of Segments in a hold-out sample of 1000 customers (.937 cut-off value)
Summary of Characteristics of Two Segments
Characteristics Segment 1:
“Deal-prone” Segment 2:
“Service Oriented”
Mean (Std. Dev)
Mean (Std. Dev)
Miles earned from flying per flight
7,222 (407)
7,963 (5407)
Flying Frequency in 51 periods
37 (12.4)
35.3 (7.9)
Frequency Reward Cash-ins in 51 periods
2.7 (1.5)
1.2 (0.56)
Percent qualifying for no automatic reward
9.2
2.1
Percent qualifying for first level customer tier
90.8
97.9
Percent qualifying for second level customer tier
87.8
93.2
Percent qualifying for third level customer tier
82.2
86.9
39

Table 4. Impact of Frequency Reward and Customer Tier Components on Expected Number of Flights
Segment 1: “Deal-Prone” Segment Expected # of
Total Flights Expected # of Flights With No Cash-in (k = 1)
Expected # of Cash-In Upgrades (k = 2)
Expected # of Cash-in Free Flights (k = 3)
1. Neither Component
0.6603
0.6603
0
0
2. Both
0.8230
0.7016
.0697
0.0516
3. Frequency Reward Component Only
0.7588
0.6375
.0696
0.0517
4. Customer Tier Component Only
0.7261
0.7261
0
0
Segment 2: “Service-Oriented” Segment Expected # of
Total Flights Expected # of Flights With No Cash-in (k = 1)
Expected # of Cash-In Upgrades (k = 2)
Expected # of Cash-in Free Flights (k = 3)
1. Neither Component
0.7297
0.7297
0
0
2. Both
0.7744
0.7729
.0015
0.00004
3. Frequency Reward Component Only
0.7302
0.7288
.0014
0.00004
4. Customer Tier Component Only
0.7740
0.7740
0
0
40

Figure 1a: Frequency of Cash-ins (N=1732)
Percent customers Cashing-in
0.00%
20.00%
40.00%
60.00%
80.00%
100.00%
0 1 2 3 4 5 6
Number of Cash-ins
Perc
ent C
ashi
ng-in
Figure 1b: Frequency of Mileage Redemption
00.05
0.10.15
0.20.25
0.30.35
0.40.45
0.5
1 2 3 4 5 6
Mileage Redeemed
Rel
ativ
e Fr
eque
ncy
Upgrade15,000-35,000
Free Flight40,000-60,000
80,000 100,000 120,000 180,000
Figure 1c: Frequency of Initial Mileage Inventory
0
0.05
0.1
0.15
0.2
0.25
0-249
99
2500
0-4999
9
5000
0-7499
9
7600
0-9999
9
1000
00-124
999
1250
00-149
999
1500
00-174
999
1750
00-199
999
2000
00 and
UP
41

Figure 2. Demonstrating the Points Pressure Effect: The Relationship between Closeness to Customer Tier or Cash-In Reward and Probability of Flying
Figure 2a
0.87
0.89
0.91
0.93
0.95
-10 -8 -6 -4 -2 0
Closeness to Customer Tier ('000 miles)
Fly
Prob
abili
ty
Deal-Prone Service Oriented
Figure 2b
0.70.730.760.790.820.850.880.91
-10 -8 -6 -4 -2 0
Closeness to Cash-in Reward ('000 miles)
Fly
Prob
abili
ty
Deal-Prone Service Oriented
42

43
Figure 3: The Rewarded Behavior Effect: The Relationship between Reward Cash-In and Subsequent Probability of Flying *
Figure 3a
Deal-Prone Segment: Flying Probability
0.87
0.89
0.91
0.93
0.95
-20 -10 0 10 20
Period (Cash-in at Period=0)
Fly
Prob
abili
ty
Figure 3b
Service-Oriented Segment: Flying Probability
0.50.550.6
0.65
0.70.750.8
-20 -15 -10 -5 0 5 10 15 20
Period (Cash-in at Period=0)
Fly-
prob
abili
ty
*Based on simulation assuming no customer tier program.