A dualresponsive “- turn on” bifunctional receptor ...
31
S1 A dual-responsive “turn-on” bifunctional receptor: chemosensor for Fe 3+ and chemodosimeter for Hg 2+ Sujay Mukhopadhyay a , Rakesh Kumar Gupta a , Arnab Biswas a , Amit Kumar a , Mrigendra Dubey a , Maninder Singh Hundal b and Daya Shankar Pandey* a a Department of Chemistry, Faculty of Science, Banaras Hindu University, Varanasi - 221 005 (U.P.) India b Department of Chemistry, Guru Nanak Dev University, Amritsar- 143005 (Punjab), India Contents 1. General information …….S2-S3 2. Syntheses of L1, L2 and L3 ……..S4-S5 3. IR spectra of L1-L3 ………...S6 4. 1 H and 13 C NMR spectra of L1-L3 .........S7-S9 5. ESI-MS spectra of L1-L3 ..............S10 6. UV-visible and fluorescence spectral pattern of L1-L3 …S11-S21 7. IR and NMR spectra of L1-Fe 3+ , and Hg 2+ induced hydrolyzed product …….S22 8. ESI-Mass spectra of L1−Fe 3+ , and Hg 2+ induced hydrolyzed product ……. S23 9. Isotopic mass spectral pattern of L1−Fe 3+ ……...S24 10. 1 H NMR titration spectra of L1 with Fe 3+ ……...S25 11. 1 H NMR titration spectra of L1 with Hg 2+ ……...S26 12. References ……...S27 13. Tables ....S28-S31 Electronic Supplementary Material (ESI) for Dalton Transactions. This journal is © The Royal Society of Chemistry 2015
Transcript of A dualresponsive “- turn on” bifunctional receptor ...
S1
A dual-responsive “turn-on” bifunctional receptor: chemosensor
for Fe3+ and chemodosimeter for Hg2+
Sujay Mukhopadhyaya, Rakesh Kumar Guptaa, Arnab Biswasa, Amit Kumara,
Mrigendra Dubeya, Maninder Singh Hundalb and Daya Shankar Pandey*a
aDepartment of Chemistry, Faculty of Science, Banaras Hindu University, Varanasi - 221 005
(U.P.) India
bDepartment of Chemistry, Guru Nanak Dev University, Amritsar- 143005 (Punjab), India
Contents
1. General information …….S2-S3
2. Syntheses of L1, L2 and L3 ……..S4-S5
3. IR spectra of L1-L3 ………...S6
4. 1H and 13C NMR spectra of L1-L3 .........S7-S9
5. ESI-MS spectra of L1-L3 ..............S10
6. UV-visible and fluorescence spectral pattern of L1-L3 …S11-S21
7. IR and NMR spectra of L1-Fe3+, and Hg2+ induced hydrolyzed product …….S22
8. ESI-Mass spectra of L1−Fe3+, and Hg2+ induced hydrolyzed product ……. S23
9. Isotopic mass spectral pattern of L1−Fe3+ ……...S24
10. 1H NMR titration spectra of L1 with Fe3+ ……...S25
11. 1H NMR titration spectra of L1 with Hg2+ ……...S26
12. References ……...S27
13. Tables ....S28-S31
Electronic Supplementary Material (ESI) for Dalton Transactions.This journal is © The Royal Society of Chemistry 2015
S2
General Information
Materials and methods
The solvents were dried and distilled by standard literature procedures prior to their use.1
Metal nitrates viz., NaNO3, KNO3, Ca(NO3)2∙4H2O, Mg(NO3)2∙6H2O, Co(NO3)2∙6H2O,
Ni(NO3)2∙6H2O, Cu(NO3)2∙3H2O, Zn(NO3)2∙6H2O, Cd(NO3)2∙4H2O, AgNO3, Pb(NO3)2,
Hg(NO3)2, and Fe(NO3)3.9H2O were obtained from s d fine-chem limited, Mumbai, India and
2-aminophenyl benzimidazole, p-anisidine, p-tolludine, acetanilide were procured from
Sigma-Aldrich chemicals pvt. Ltd. and were used without further purification.
Instrumental details
Elemental analyses for C, H, and N were performed on an Exeter Analytical Inc. model CE-
440 CHN analyzer. IR and electronic absorption spectra (50% aqueous-acetonitrile) were
acquired on a PerkinElmer Spectrum Version Varian 3300 FT-IR, and Shimadzu UV-1601
Spectrometers, respectively. Fluorescence spectra (50% aqueous-acetonitrile) were acquired
at room temperature on a PerkinElmer LS 55 Fluorescence Spectrometer, the excitation and
emission slit widths were set at 10.0 and 2.5 nm, respectively. 1H (300 MHz) and 13C (75.45
MHz) NMR spectra at rt were obtained on a JEOL AL300 FT-NMR Spectrometer using
tetramethylsilane [Si(CH3)4] as an internal reference. Electrospray ionization mass
spectrometric (ESI-MS) measurements were made on a Bruker Dalton-ics Amazon SL ion
trap mass spectrometer. Samples were dissolved in 100% acetonitrile with 0.1% formic
acid and introduced into the ESI source through a syringe pump at a flow rate of 100
µL/h. The capillary voltage was at 4500V, dry gas flow at 8 L/min, and dry gas at 300 °C.
The MS scan was acquired for 2.0 min and spectra print outs were averaged of over each
scan.
X-ray Structure Determination.
Crystals suitable for X-ray single crystal analyses for L1, L2 and L3 were obtained by slow
diffusion of methanol over a dichloromethane solution of the respective compounds. X-ray
data on these compounds were collected on a Bruker Kappa Apex-II Diffractometer at RT
with Mo-Kα radiation (λ = 0.71073 Å) at Department of Chemistry, Centre for Advanced
Studies, Guru Nanak Dev University, Amritsar, India. Structures were solved by direct
methods (SHELXS 97) and refined by full-matrix least squares on F2 (SHELX 97).2 All the
S3
non-H atoms were treated anisotropically. H-atoms attached to the carbon were included as
fixed contribution and geometrically calculated and refined using SHELX riding model.
Computer program PLATON was used for analyzing interaction and stacking distances.3
CCDC deposition Nos. 1034021, 1034019, 1034022 (L1, L2 and L3) and 1034020 (CMQC)
contains the supplementary crystallographic data for this paper. The data can be obtained free
of charge via http://www.ccdc.cam.ac.uk/conts/retrieving html (or from the CCDC, 12 Union
Road, Cambridge CB2 1EZ, UK; Fax: +44-1223-336033; E-mail: [email protected]).
General method of UV−vis and fluorescence titration
Spectroscopic properties of L1, L2, L3, L1−Fe3+, and L1−Hg2+ were investigated by
monitoring absorption and fluorescence changes by addition of the nitrate salts of cations in
water, including Na+, K+, Ca2+, Mg2+, Al3+, Cu2+, Ag+, Cr3+, Mn2+, Co2+, Ni2+, Fe3+, Zn2+,
Cd2+ and Hg2+. The excitation wavelengths for all the fluorescence experiments are chosen
with respect to the absorbance maxima of probes and the λex are kept constant in the total
fluorescence titration experiments and no correction for the absorbed light was made.
Calculation of limit of detection (LOD)
Quantitative responses of L1, L2, L3 toward Fe3+ and Hg2+ were investigated using linear
calibration plots from fluorescence spectral studies. Dynamic range for determination of LOD
for these ions has been found to be linear. The LOD has been evaluated using 3σ/s, where σ is
the standard deviation of the blank signals and s is the slope of the linear calibration plot.
Theoretical Calculations
Molecular structure of L1−Fe3+ was designed using ChemBioDraw Ultra software and 3D
views of the structures were optimized by minimizing energy of the molecule using MM2
mode using the same software. Optimization and energy calculations were performed on
Gaussian09 with a density functional theory (DFT) in the B3LYP mode in the ground state.4-5
The basis set 6-31G(d,p) has been used for all the light atoms (C, H , N, O), while LANL2DZ
for the metal atom (Fe) with an effective-core pseudo-potential.6
S4
Syntheses of the L1-L3.
2-chloro-3-formylquinoline and its methyl and methoxy derivatives were prepared following
literature procedures.7
Synthesis of L1. 2-aminophenylbenzimidazole (209 mg, 1 mmol) was added to a hot ethanolic solution of 2-
chloro-3-formyl-7-methoxyquinoline (221 mg, 1 mmol) and the contents of the flask were
refluxed for 4 hours. Upon cooling to room temperature it afforded a pale yellow precipitate
which was filtered and washed with diethyl ether. It was further dissolved in DCM and
layered with methanol to give yellow brown crystals. Yield: 93.5% (0.385 g). Anal. Calc for
C24H17ClN4O, requires: C, 69.82; H, 4.15; N, 13.57%. Found C, 69.67; H, 4.06; N, 13.43%.
IR (KBr pellets, cm-1): 462, 728, 743, 1036, 1165, 1165, 1259, 1318, 1330, 1453, 1496, 1508,
1618, 2925.1H NMR (DMSO d6, δ ppm): 3.89 (s, 3H, OCH3); 6.84 (t, 3H, phenyl); 7.01 (t,
1H, phenyl), 7.20 (m, 5H, phenyl), 7.46 (t, 1H, phenyl), 7.68 (d, 1H, phenyl), 7.82 (d, 1H,
phenyl), 8.01 (t, 2H, phenyl). 13C NMR (DMSO d6, δ ppm): 55.75, (OCH3), 106.29,
111.05,114.79, 118.59, 121.49, 122.39, 124.72, 127.49, 129.58, 132.11, 137.08, 143.19,
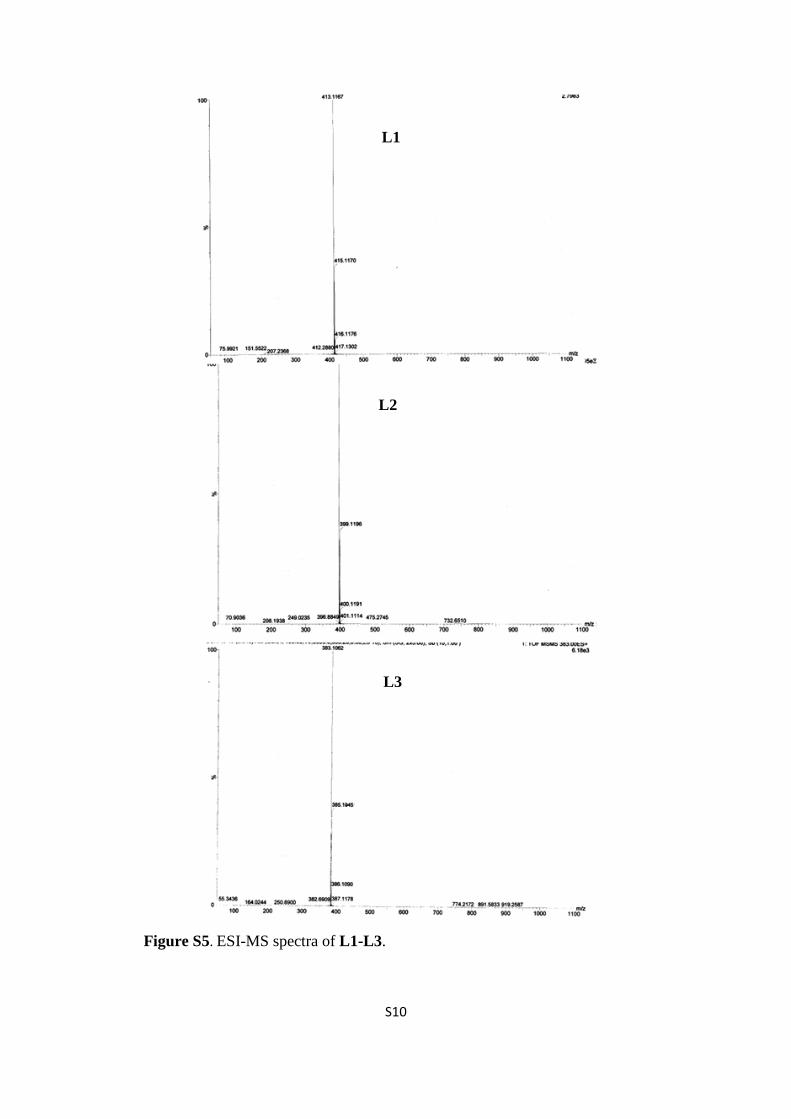
148.10, 161.95(C6H6). ESI-MS. (Calcd, found, m/z): [M + H]+ 413.1169, 413.1167.
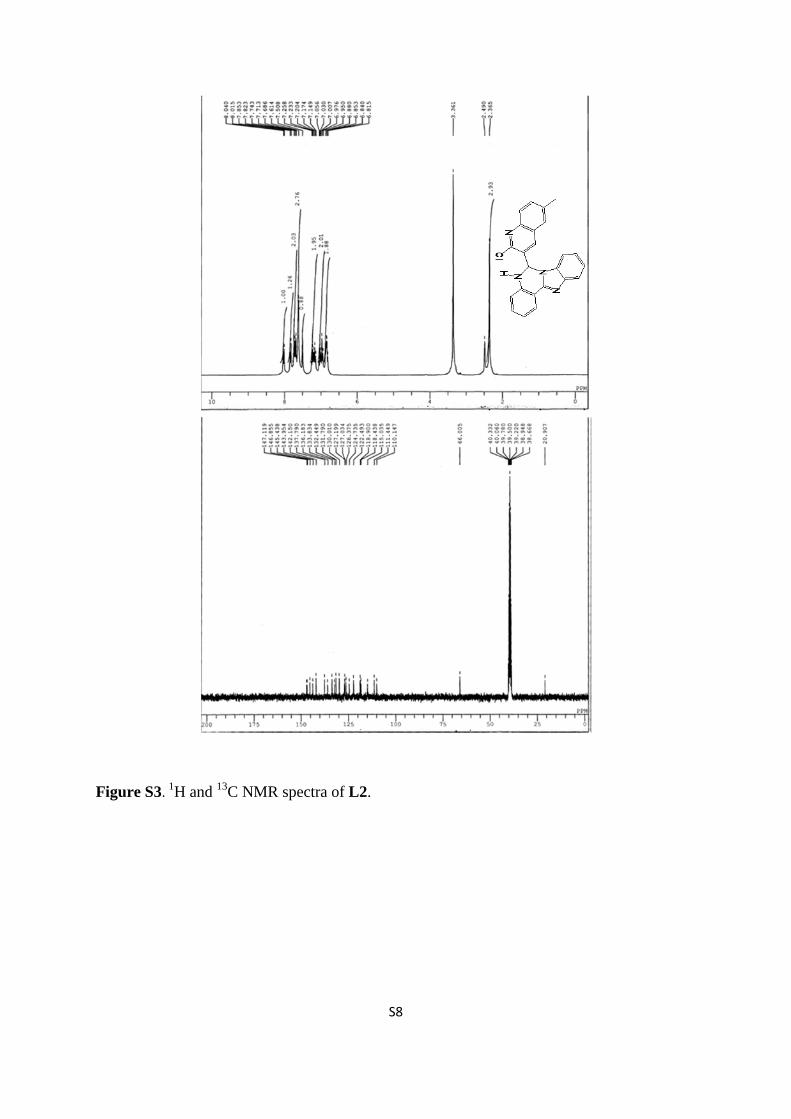
Synthesis of L2.
The probe L2 was prepared by the above procedure adapted for synthesis of L1 using 2-
chloro-3-formyl-6-methylquinoline (205 mg, 1 mmol). Orange yellow colored crystals were
obtained in excellent yield. Yield: 92.2% (0.365 g). Anal. Calc for 143.19, C24H17ClN4,
requires: C, 72.63; H, 4.32; N, 14.12%. Found C, 72.53; H, 4.26; N, 14.07%. IR (KBr pellets,
cm-1): 553, 572, 818, 844, 954, 1013, 1171, 1359, 1410, 1504, 1625, 2227, 2867, 2962.1H
NMR (DMSO d6, δ ppm): 2.36 (s, 3H, CH3); 6.85 (q, 2H, phenyl); 6.98 (t, 2H, phenyl), 7.04
(d, 2H, phenyl), 7.20 (m, 1H, phenyl), 7.56 (d, 2H, phenyl), 7.71 (t, 2H, phenyl), 7.83 (d, 1H,
phenyl), 8.03 (d, 1H, phenyl). 13C NMR (DMSO d6, δ ppm): 20.91, (CH3); 110.8, 115.04,
118.61, 122.49, 123.40, 126.87, 130.01, 132.98, 136.99, 142.15, 143.95, 145.44,
146.99(C6H6). ESI-MS. (Calcd, found, m/z): [M + H]+ 397.1220, 397.1223.
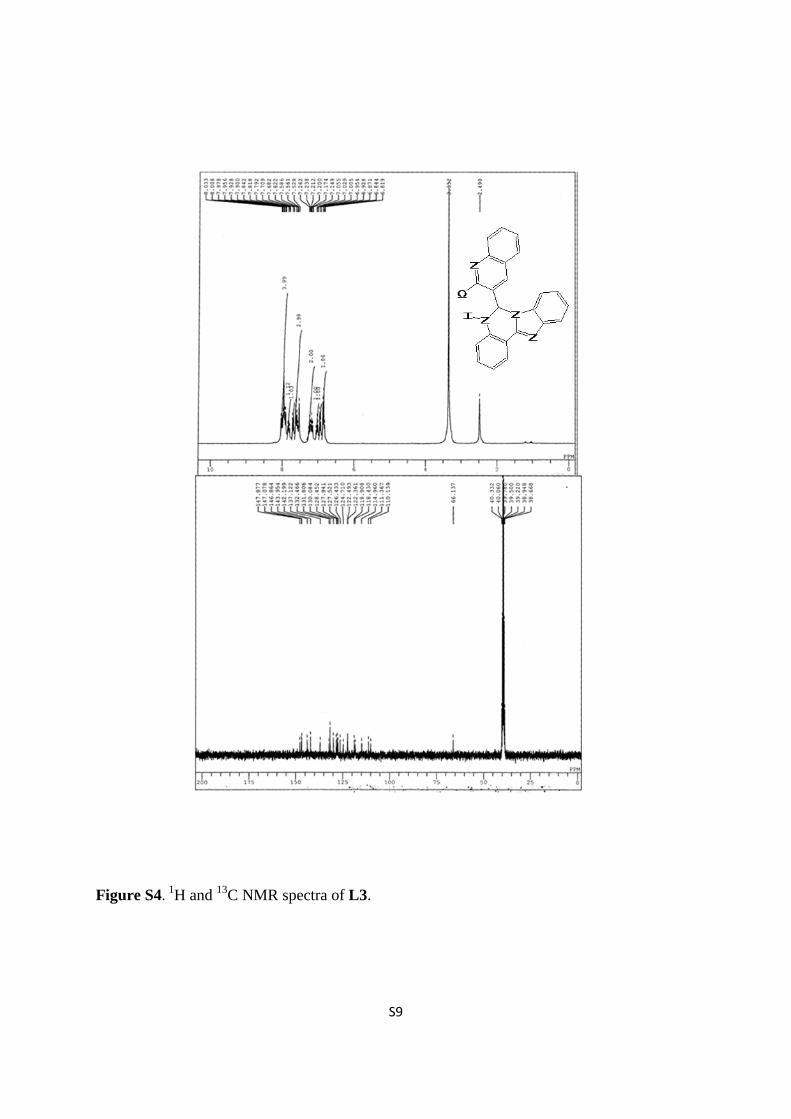
Synthesis of L3.
It was synthesized following the above procedure adapted for L1 except that 2-chloro-3-
formyl-6-quinoline (191 mg, 1 mmol) was used in place of 2-chloro-3-formyl-7-
S5
methoxyquinoline. Yellow color crystals were obtained. Yield: 93.4% (0.357 g). Anal. Calc
for C23H15ClN4, requires: C, 72.16; H, 3.95; N, 14.63%. Found C, 72.08; H, 4.08; N, 14.56%.
IR (KBr pellets, cm-1): 461, 487, 597, 744, 1030, 1264, 1306, 1330, 1388, 1452, 1491, 1617,
2933, 2962.1H NMR (DMSO d6, δ ppm): 6.84 (t, 2H, Ph); 6.94 (d, 1H, Ph), 7.03 (t, 1H, Ph),
7.20 (m, 2H, phenyl), 7.58 (q, 2H, phenyl), 7.65 (d, 1H, phenyl), 7.77 (t, 1H, phenyl), 8.00
(m, 4H, phenyl). 13C NMR (DMSO d6, δ ppm): 110.14, 111.37, 114.96, 118.61, 122.42,
124.71, 126.43, 127.97, 130.08, 132.23, 137.12, 142.20, 143.95, 147.51, 147.88(C6H6). ESI-
MS. (Calcd, found, m/z): [M + H]+ 383.1063, 383.1062.
L1, L2, and L3 were synthesized by reaction of APBI with 2-chloro-7-methoxy-quinoline-
3-carbaldehyde (CMQC), 2-chloro-6-methyl-quinoline-3-carbaldehyde, and 2-chloro-
quinoline-3-carbaldehyde, respectively. Simple synthetic strategy adopted for the preparation
of aldehydes and probes L1-L3 is depicted in Scheme 1. All these were obtained in good
yield (85-90%). The probes under investigation are non-hygroscopic, air-stable crystalline
solids, highly soluble in common organic solvents like dichloromethane, chloroform, acetone,
dimethylsulfoxide, acetonitrile, and partially soluble in methanol, ethanol.
Synthesis of L1−Fe3+.
L1 (412 mg, 1 mmol) and ferric nitrate nonahydrate (202 mg, 0.5 mmol) were mixed in
equimolecular ratio in 1:1 CH3CN:H2O mixture, and stirred overnight to ensure complete
reaction. The solvent was dried and the residue was washed several times with water and
diethyl ether. The dried sample was used for further characterization.
Hydrolysis of L1 in presence of Hg2+. The adapted procedure for the hydrolysis of L1
(342.62 mg, 1 mmol) was same as for L1−Fe3+. After thorough washing with water and
diethyl ether, dried sample was used for further characterizations.
S6
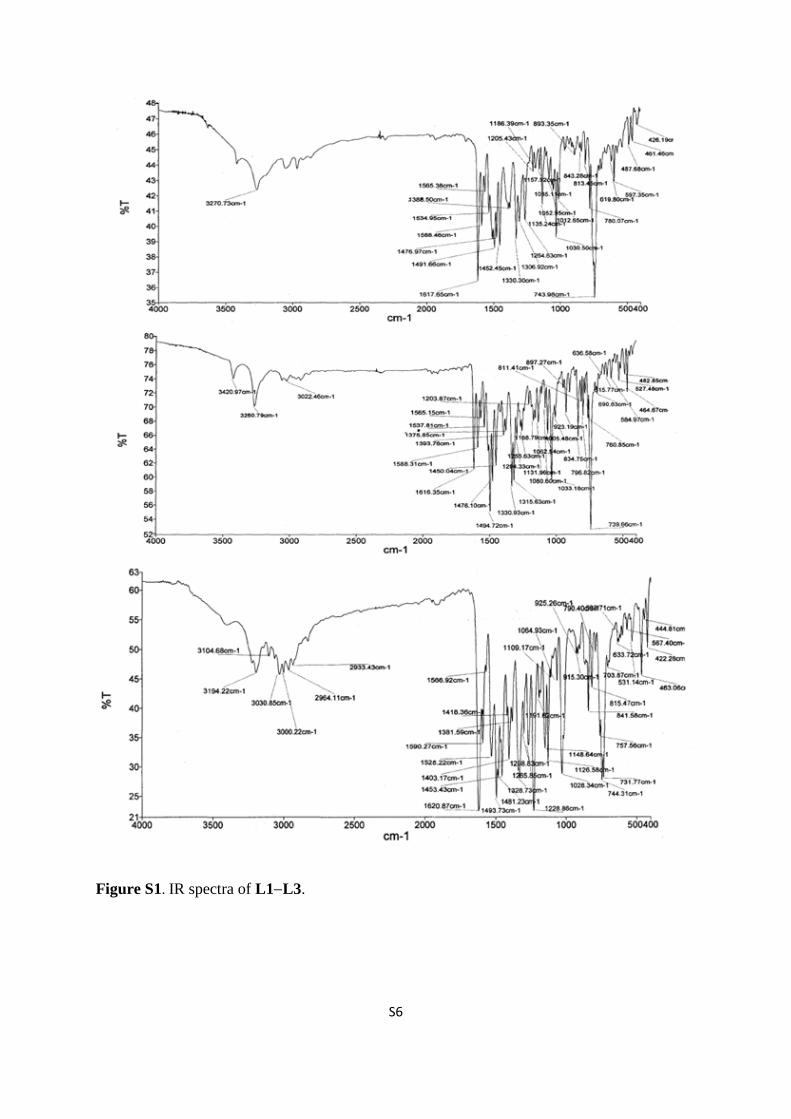
Figure S1. IR spectra of L1−L3.
S7
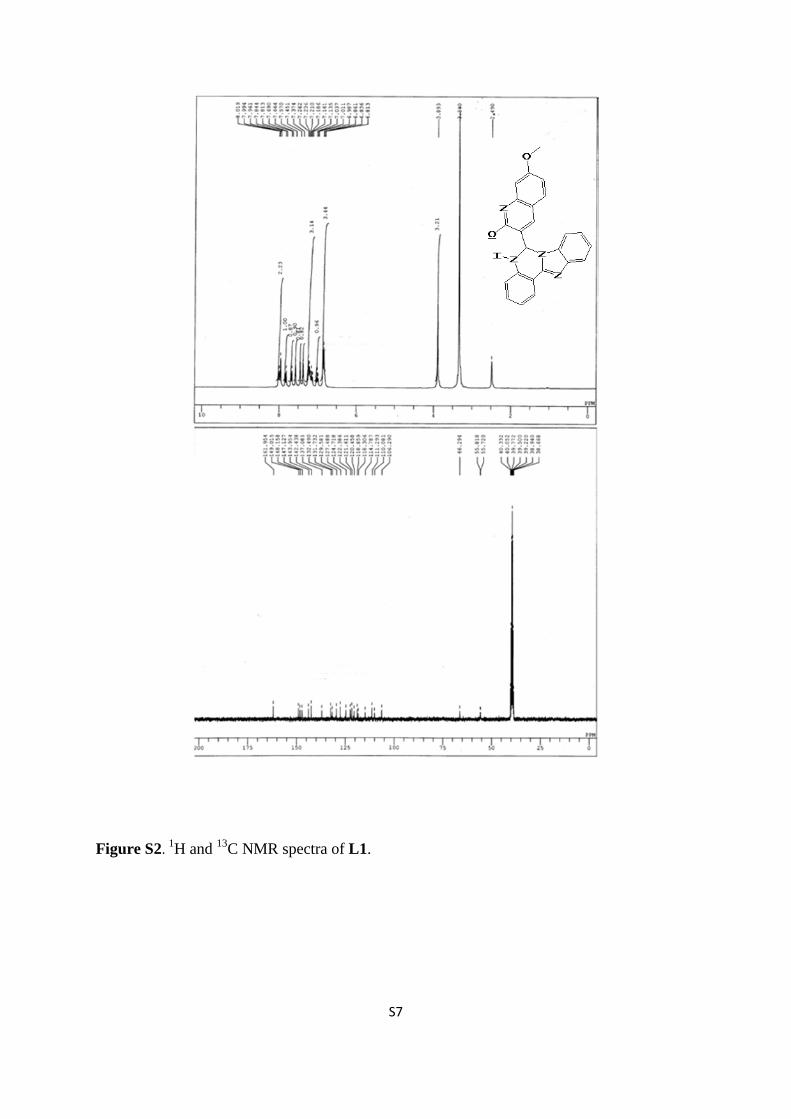
Figure S2. 1H and 13C NMR spectra of L1.
S8
Figure S3. 1H and 13C NMR spectra of L2.
S9
Figure S4. 1H and 13C NMR spectra of L3.
S10
Figure S5. ESI-MS spectra of L1-L3.
L1
L2
L3
S11
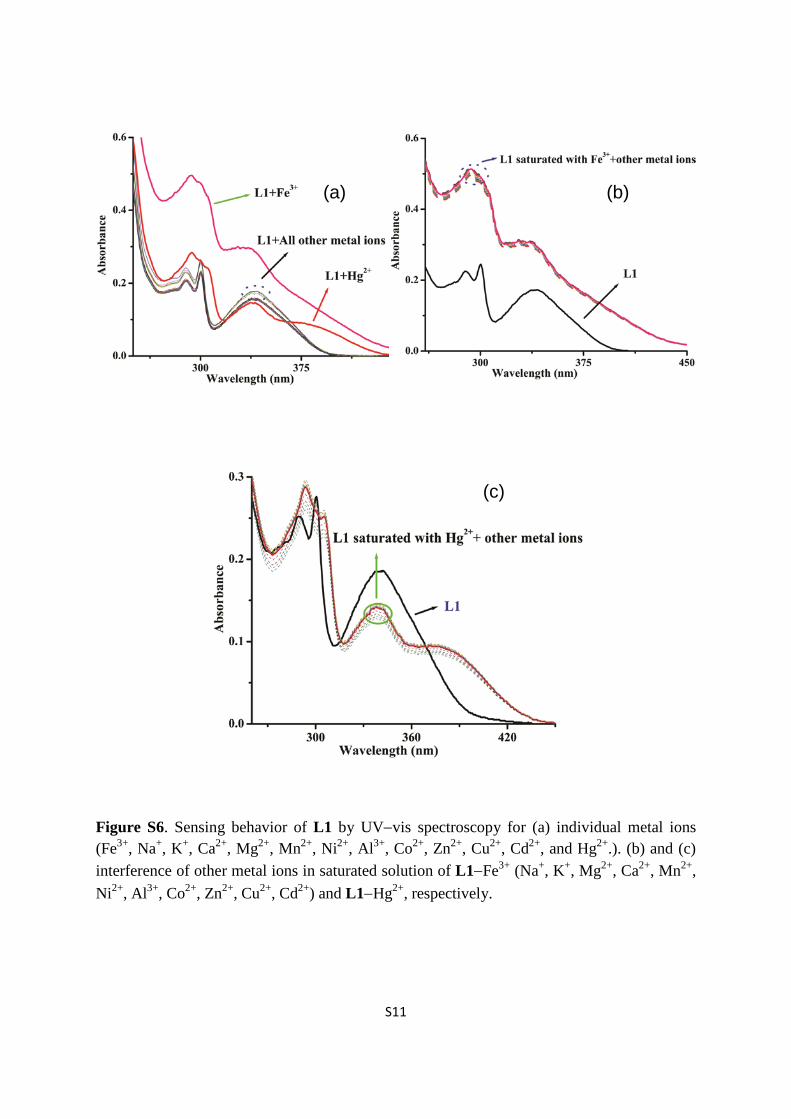
Figure S6. Sensing behavior of L1 by UV−vis spectroscopy for (a) individual metal ions (Fe3+, Na+, K+, Ca2+, Mg2+, Mn2+, Ni2+, Al3+, Co2+, Zn2+, Cu2+, Cd2+, and Hg2+.). (b) and (c) interference of other metal ions in saturated solution of L1−Fe3+ (Na+, K+, Mg2+, Ca2+, Mn2+, Ni2+, Al3+, Co2+, Zn2+, Cu2+, Cd2+) and L1−Hg2+, respectively.
(a) (b)
(c)
S12
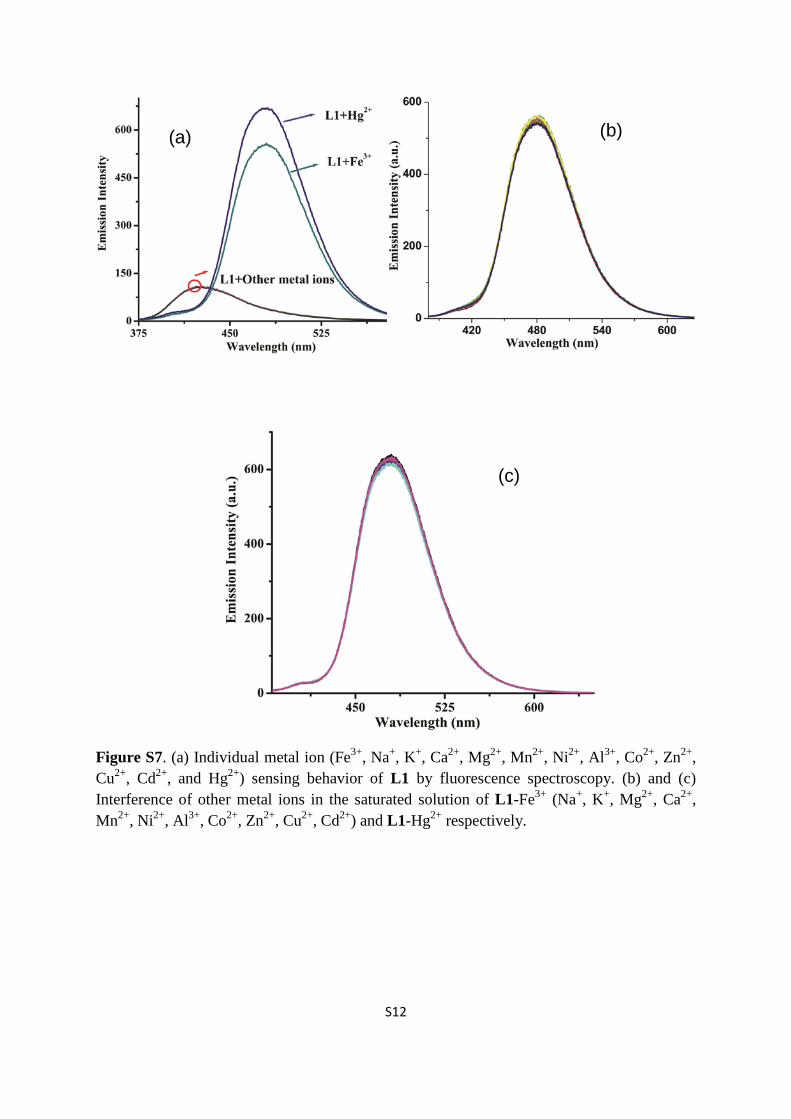
Figure S7. (a) Individual metal ion (Fe3+, Na+, K+, Ca2+, Mg2+, Mn2+, Ni2+, Al3+, Co2+, Zn2+, Cu2+, Cd2+, and Hg2+) sensing behavior of L1 by fluorescence spectroscopy. (b) and (c) Interference of other metal ions in the saturated solution of L1-Fe3+ (Na+, K+, Mg2+, Ca2+, Mn2+, Ni2+, Al3+, Co2+, Zn2+, Cu2+, Cd2+) and L1-Hg2+ respectively.
(a) (b)
(c)
S13
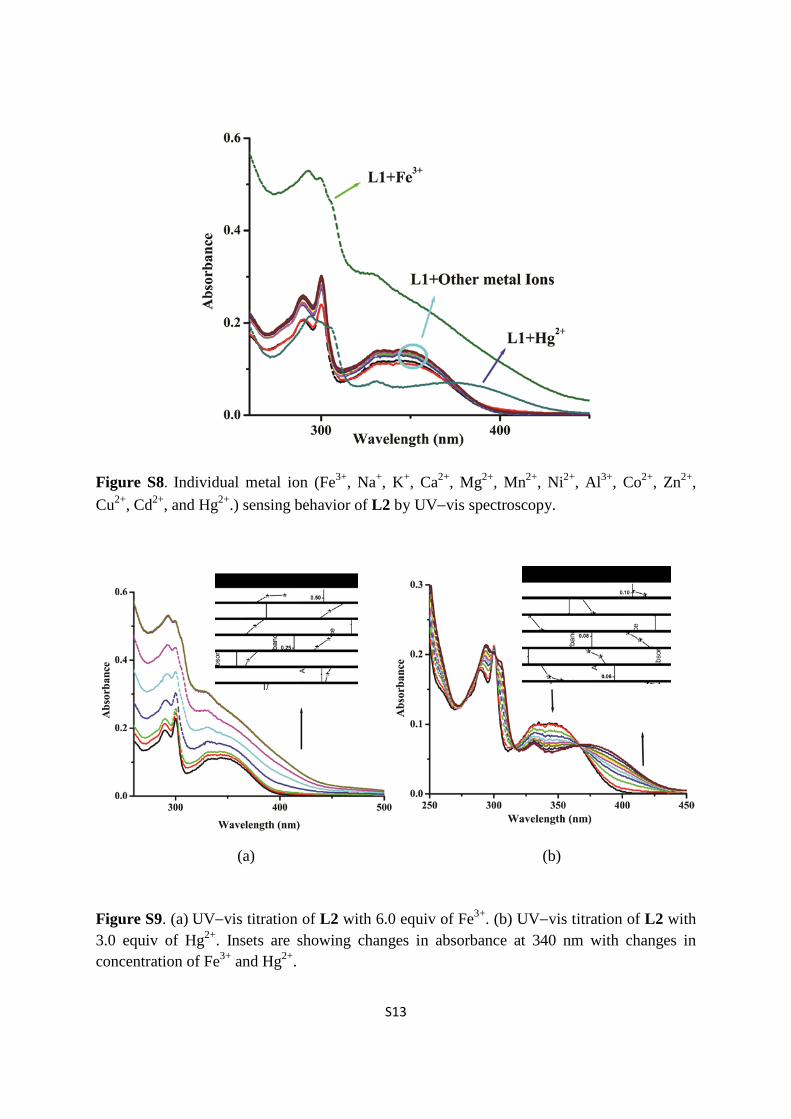
Figure S8. Individual metal ion (Fe3+, Na+, K+, Ca2+, Mg2+, Mn2+, Ni2+, Al3+, Co2+, Zn2+, Cu2+, Cd2+, and Hg2+.) sensing behavior of L2 by UV−vis spectroscopy.
Figure S9. (a) UV−vis titration of L2 with 6.0 equiv of Fe3+. (b) UV−vis titration of L2 with 3.0 equiv of Hg2+. Insets are showing changes in absorbance at 340 nm with changes in concentration of Fe3+ and Hg2+.
(a) (b)
S14
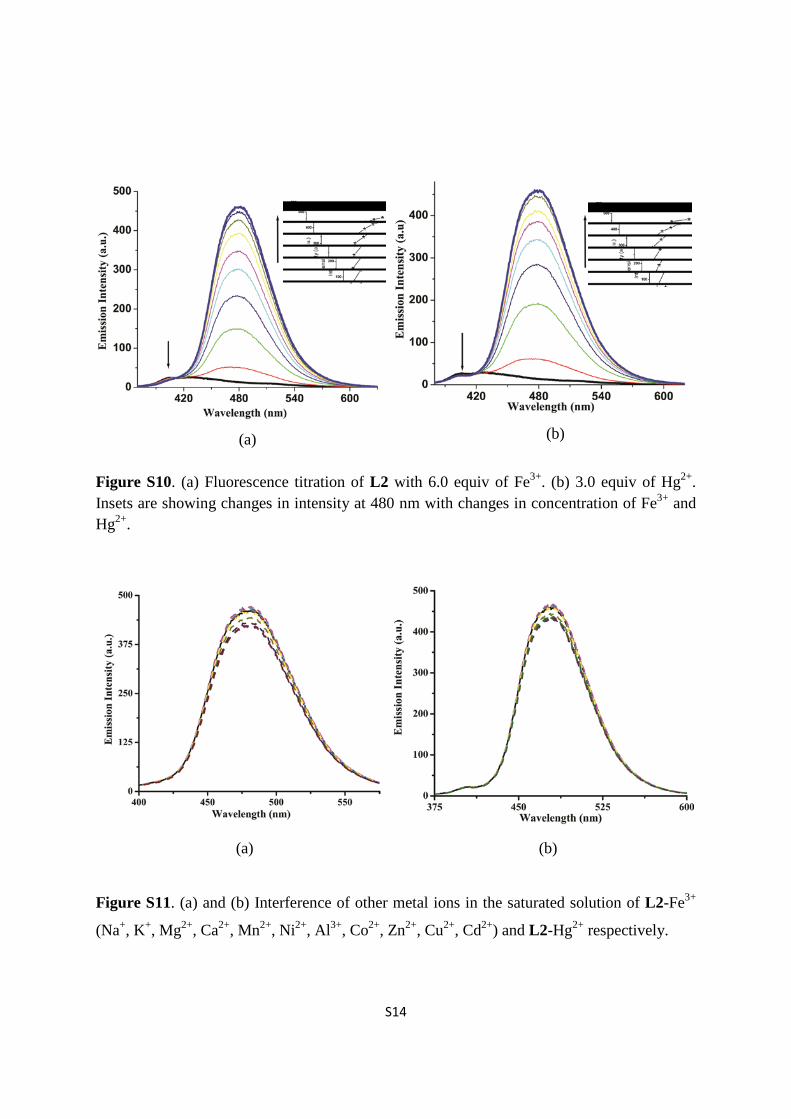
Figure S10. (a) Fluorescence titration of L2 with 6.0 equiv of Fe3+. (b) 3.0 equiv of Hg2+. Insets are showing changes in intensity at 480 nm with changes in concentration of Fe3+ and Hg2+.
Figure S11. (a) and (b) Interference of other metal ions in the saturated solution of L2-Fe3+
(Na+, K+, Mg2+, Ca2+, Mn2+, Ni2+, Al3+, Co2+, Zn2+, Cu2+, Cd2+) and L2-Hg2+ respectively.
(a) (b)
(b) (a)
S15
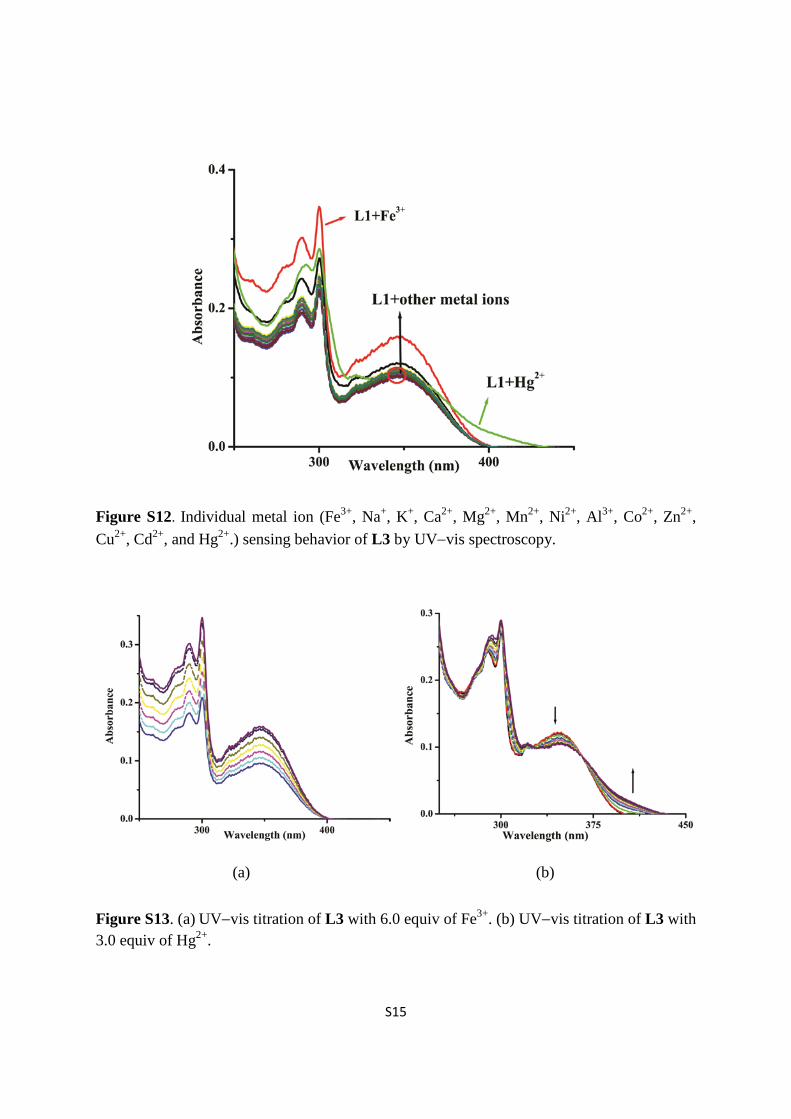
Figure S12. Individual metal ion (Fe3+, Na+, K+, Ca2+, Mg2+, Mn2+, Ni2+, Al3+, Co2+, Zn2+, Cu2+, Cd2+, and Hg2+.) sensing behavior of L3 by UV−vis spectroscopy.
Figure S13. (a) UV−vis titration of L3 with 6.0 equiv of Fe3+. (b) UV−vis titration of L3 with 3.0 equiv of Hg2+.
(a) (b)
S16
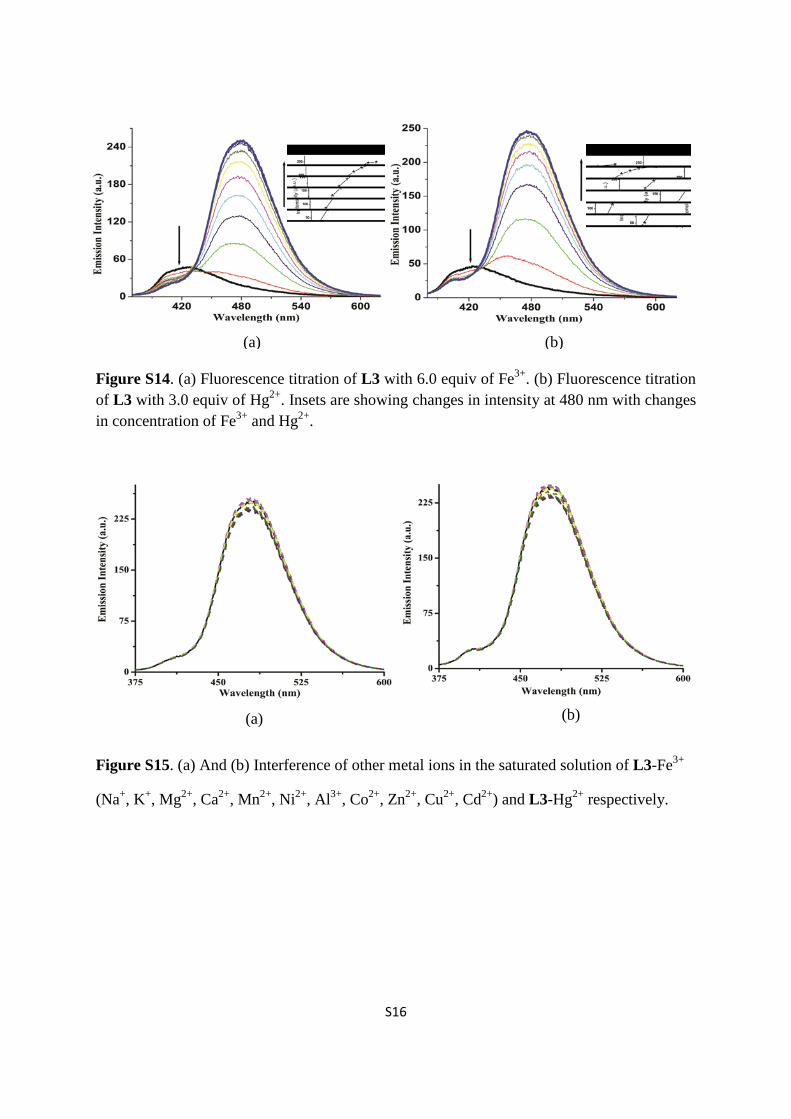
Figure S14. (a) Fluorescence titration of L3 with 6.0 equiv of Fe3+. (b) Fluorescence titration of L3 with 3.0 equiv of Hg2+. Insets are showing changes in intensity at 480 nm with changes in concentration of Fe3+ and Hg2+.
Figure S15. (a) And (b) Interference of other metal ions in the saturated solution of L3-Fe3+
(Na+, K+, Mg2+, Ca2+, Mn2+, Ni2+, Al3+, Co2+, Zn2+, Cu2+, Cd2+) and L3-Hg2+ respectively.
(a) (b)
(a) (b)
S17
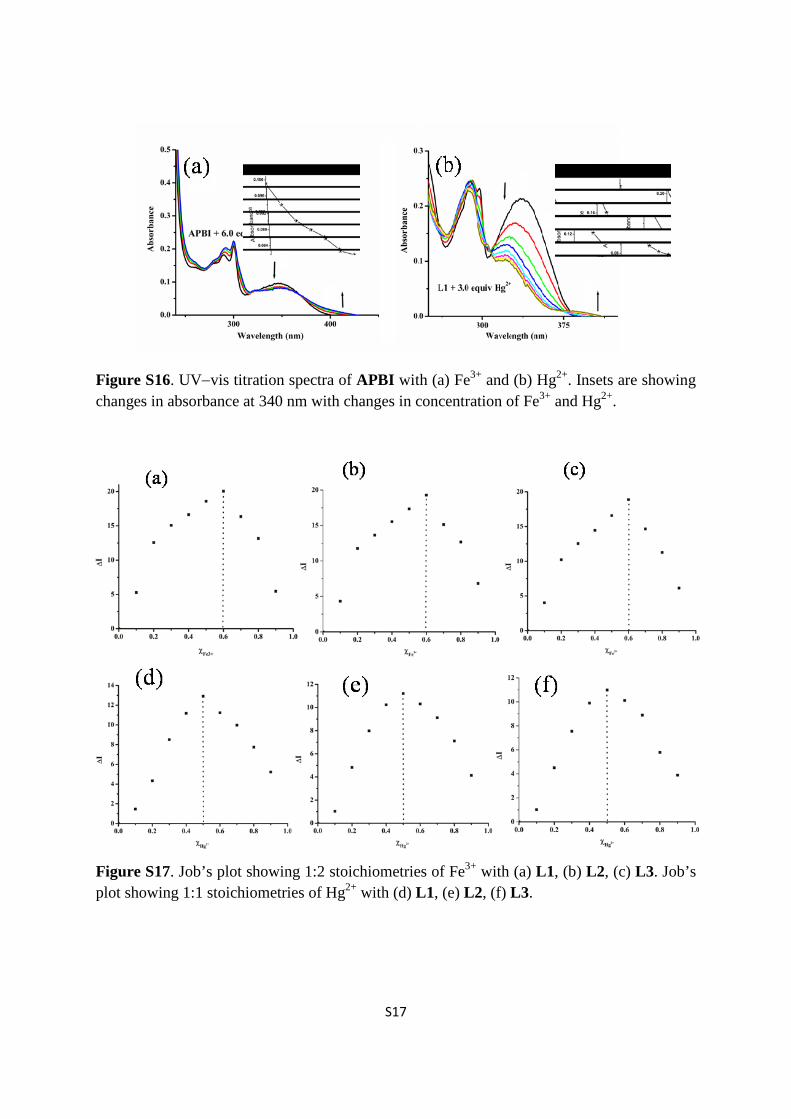
Figure S16. UV−vis titration spectra of APBI with (a) Fe3+ and (b) Hg2+. Insets are showing changes in absorbance at 340 nm with changes in concentration of Fe3+ and Hg2+.
Figure S17. Job’s plot showing 1:2 stoichiometries of Fe3+ with (a) L1, (b) L2, (c) L3. Job’s plot showing 1:1 stoichiometries of Hg2+ with (d) L1, (e) L2, (f) L3.
S18
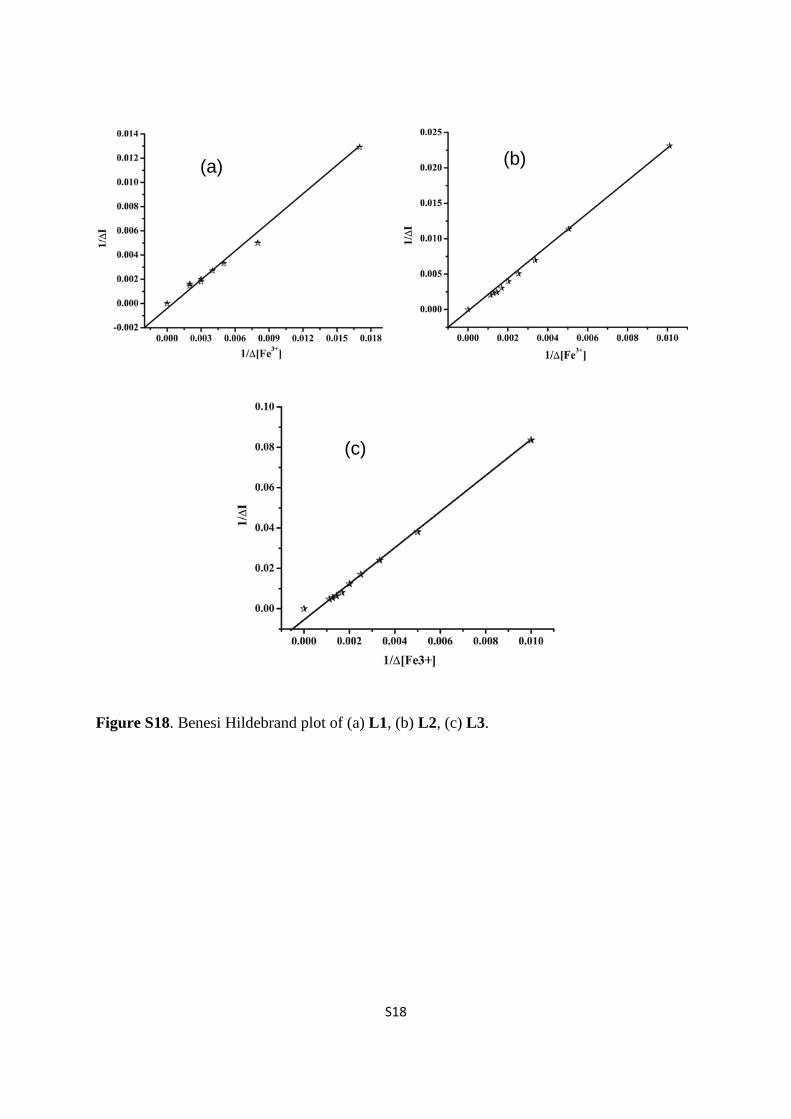
Figure S18. Benesi Hildebrand plot of (a) L1, (b) L2, (c) L3.
(a) (b)
(c)
S19
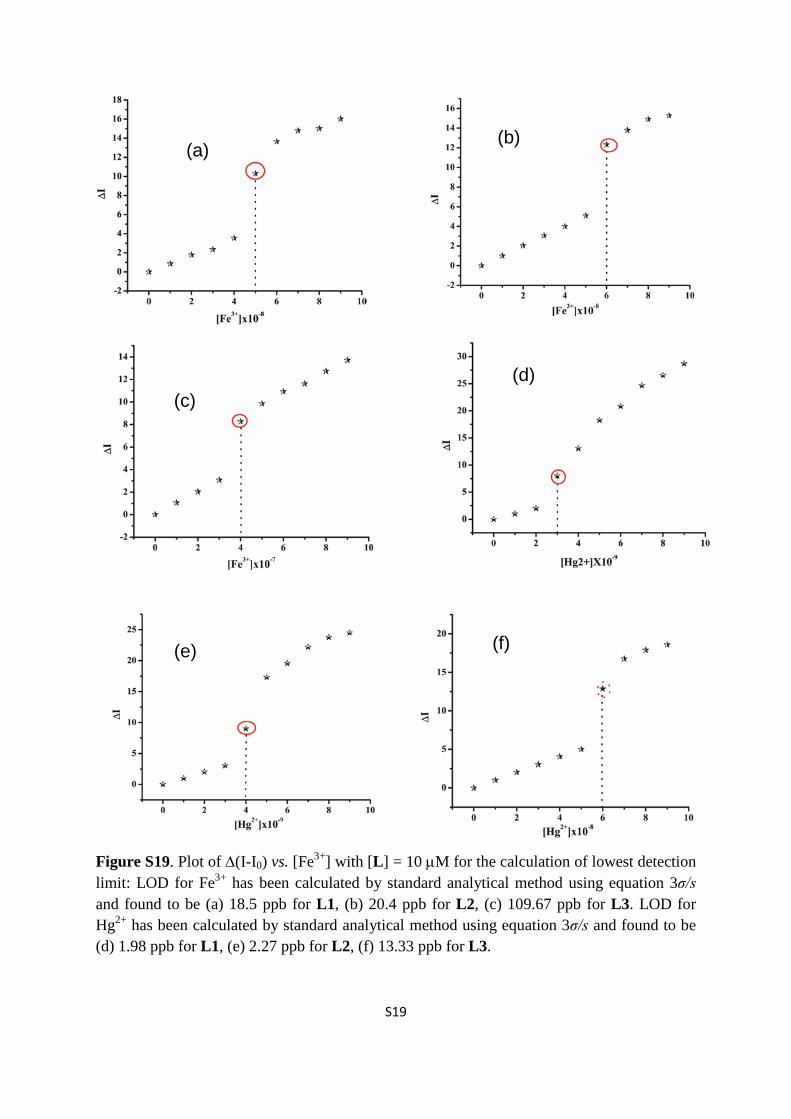
Figure S19. Plot of ∆(I-I0) vs. [Fe3+] with [L] = 10 µM for the calculation of lowest detection limit: LOD for Fe3+ has been calculated by standard analytical method using equation 3σ/s and found to be (a) 18.5 ppb for L1, (b) 20.4 ppb for L2, (c) 109.67 ppb for L3. LOD for Hg2+ has been calculated by standard analytical method using equation 3σ/s and found to be (d) 1.98 ppb for L1, (e) 2.27 ppb for L2, (f) 13.33 ppb for L3.
(a) (b)
(c) (d)
(e) (f)
S20
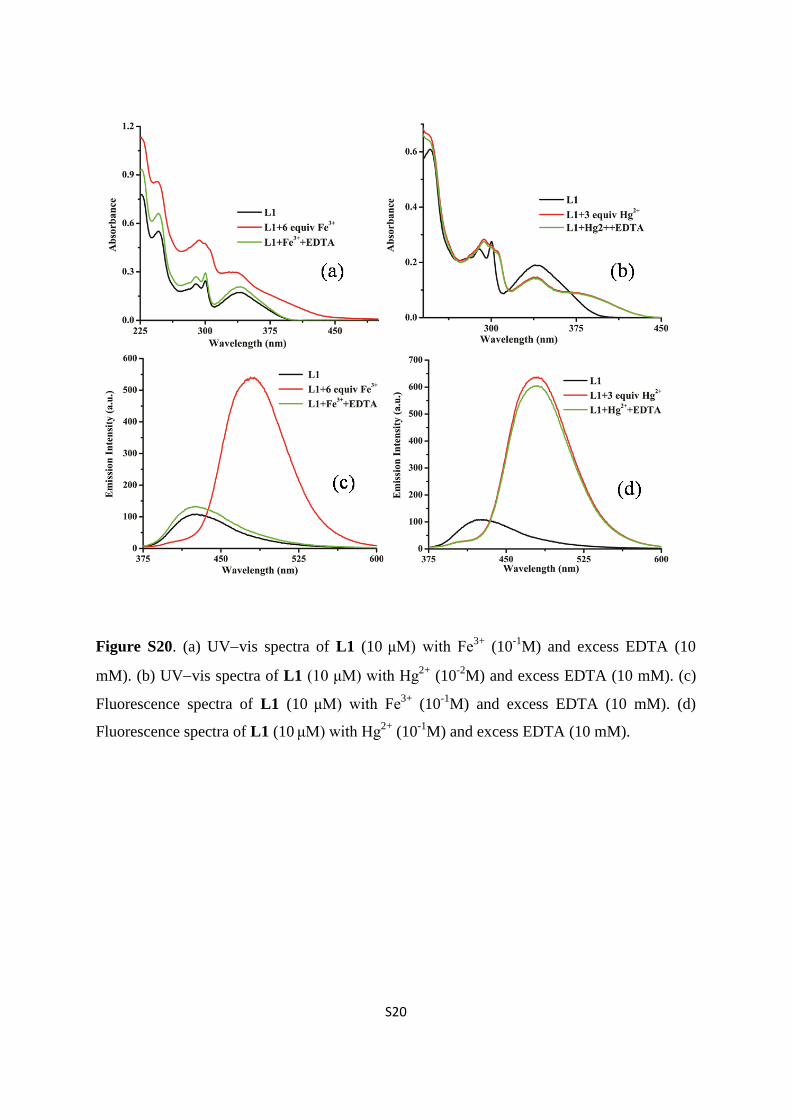
Figure S20. (a) UV−vis spectra of L1 (10 μM) with Fe3+ (10-1M) and excess EDTA (10
mM). (b) UV−vis spectra of L1 (10 μM) with Hg2+ (10-2M) and excess EDTA (10 mM). (c)
Fluorescence spectra of L1 (10 μM) with Fe3+ (10-1M) and excess EDTA (10 mM). (d)
Fluorescence spectra of L1 (10 μM) with Hg2+ (10-1M) and excess EDTA (10 mM).
S21
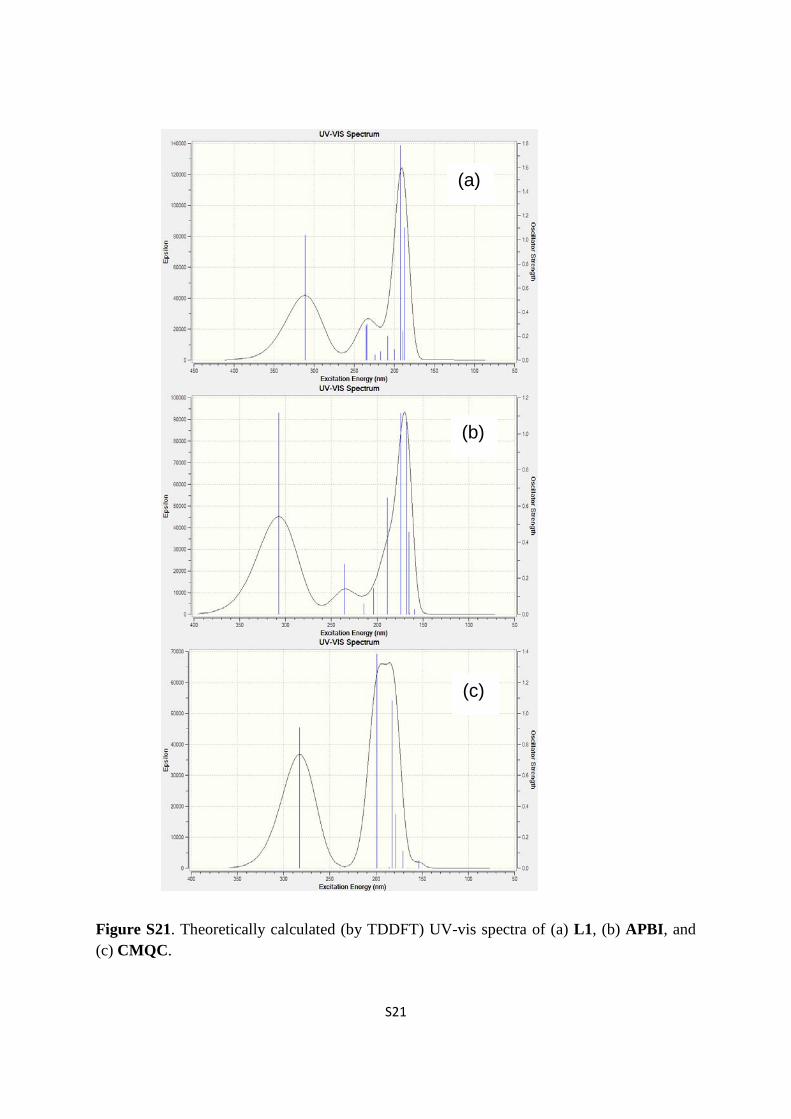
Figure S21. Theoretically calculated (by TDDFT) UV-vis spectra of (a) L1, (b) APBI, and (c) CMQC.
(a)
(b)
(c)
S22
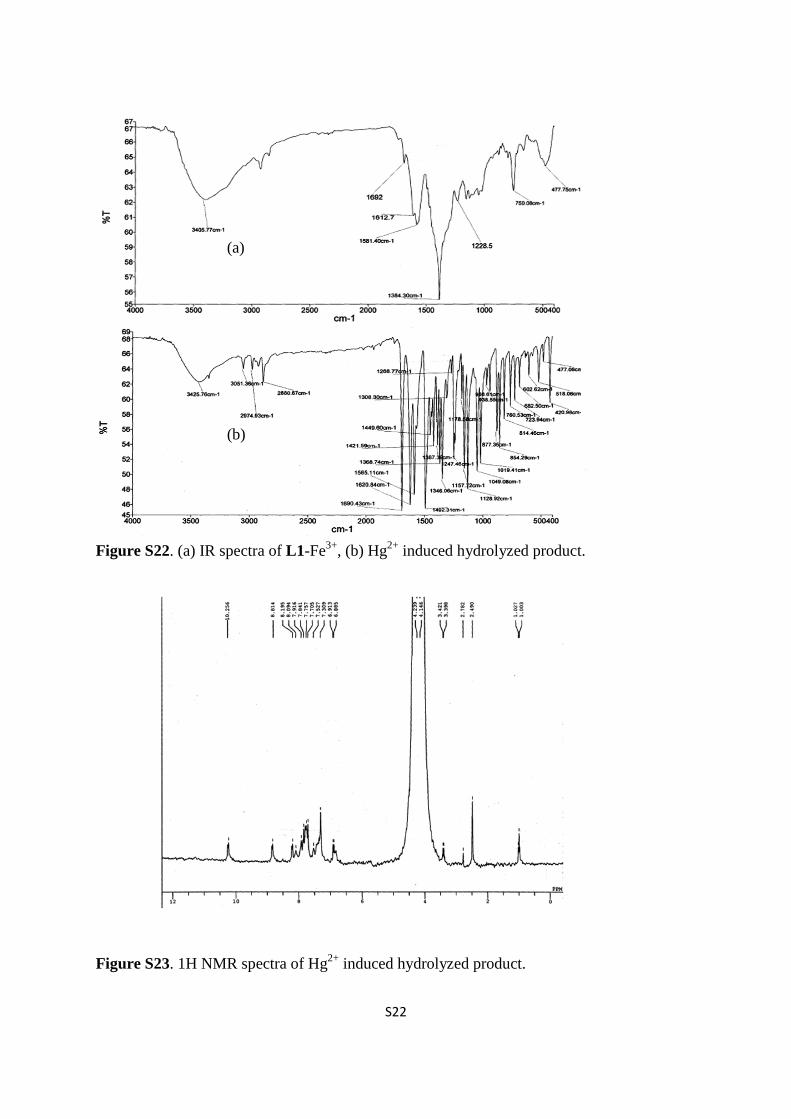
Figure S22. (a) IR spectra of L1-Fe3+, (b) Hg2+ induced hydrolyzed product.
Figure S23. 1H NMR spectra of Hg2+ induced hydrolyzed product.
(a)
(b)
S23
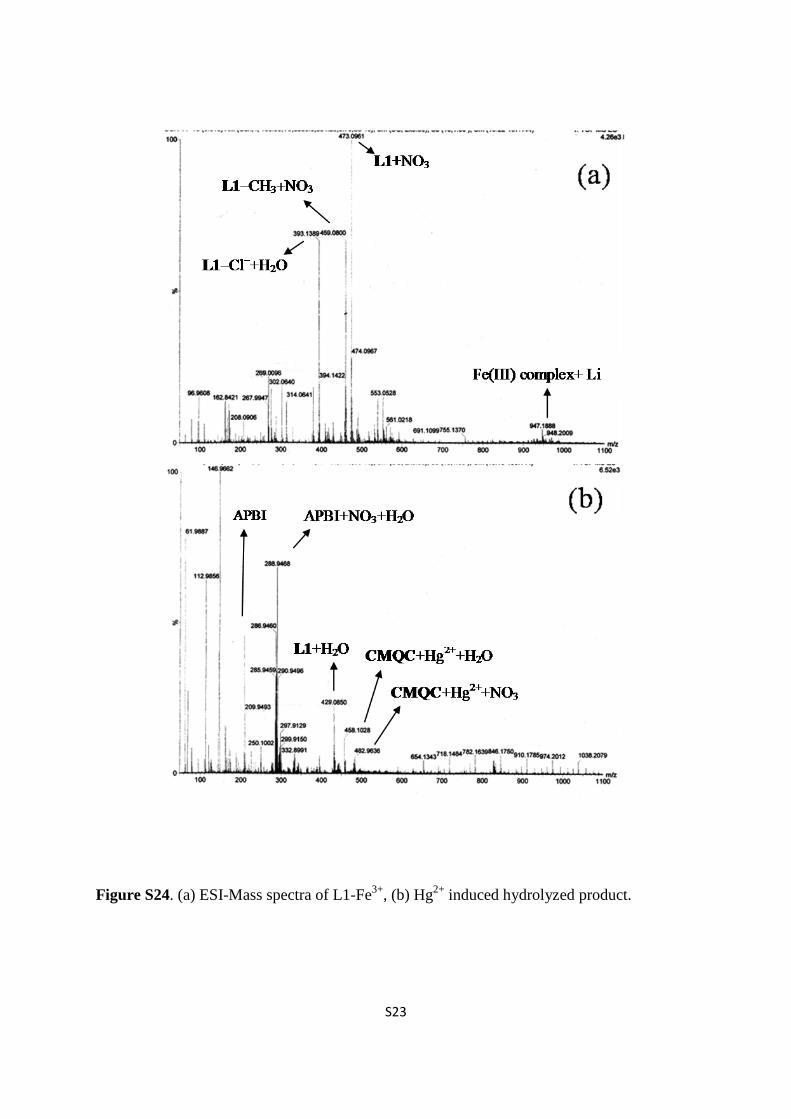
Figure S24. (a) ESI-Mass spectra of L1-Fe3+, (b) Hg2+ induced hydrolyzed product.
S24
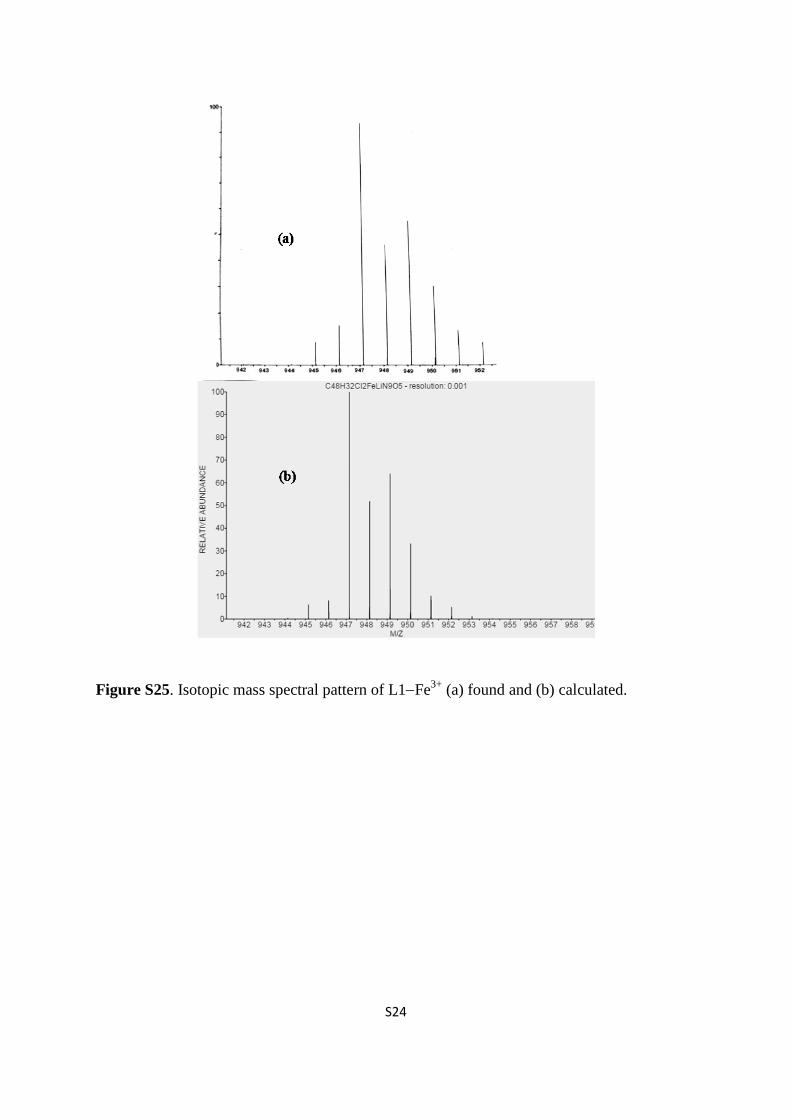
Figure S25. Isotopic mass spectral pattern of L1−Fe3+ (a) found and (b) calculated.
S25
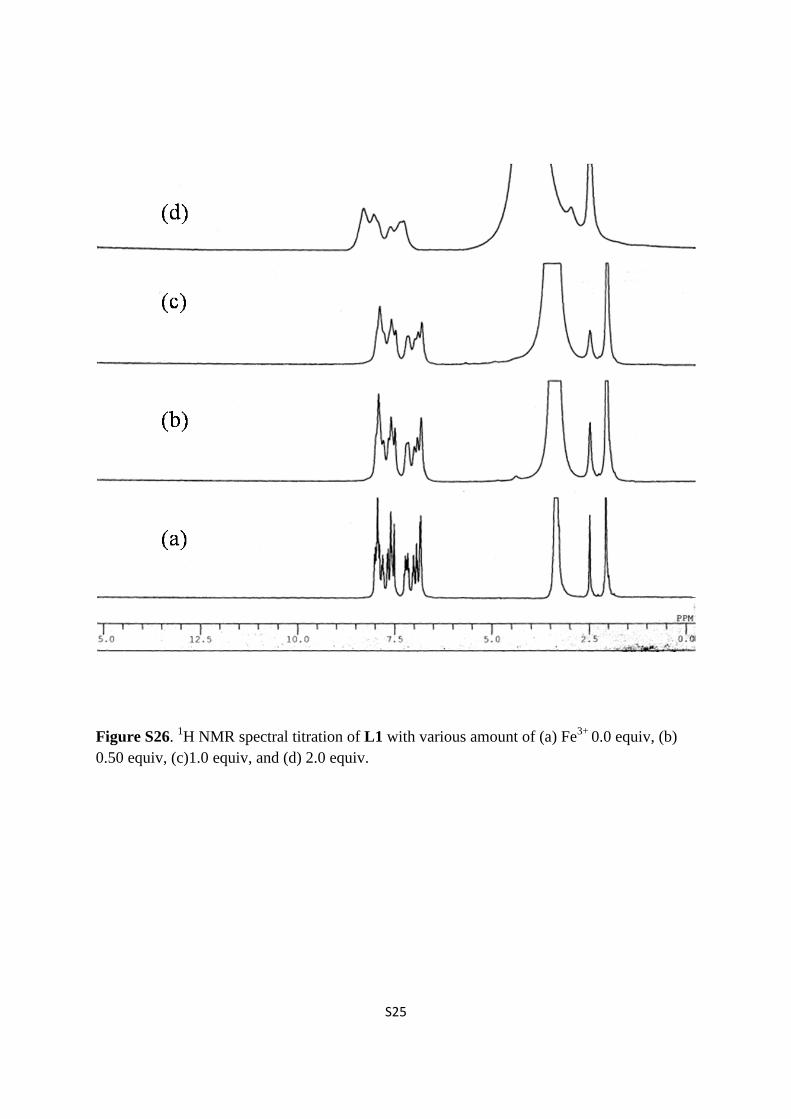
Figure S26. 1H NMR spectral titration of L1 with various amount of (a) Fe3+ 0.0 equiv, (b) 0.50 equiv, (c)1.0 equiv, and (d) 2.0 equiv.
S26
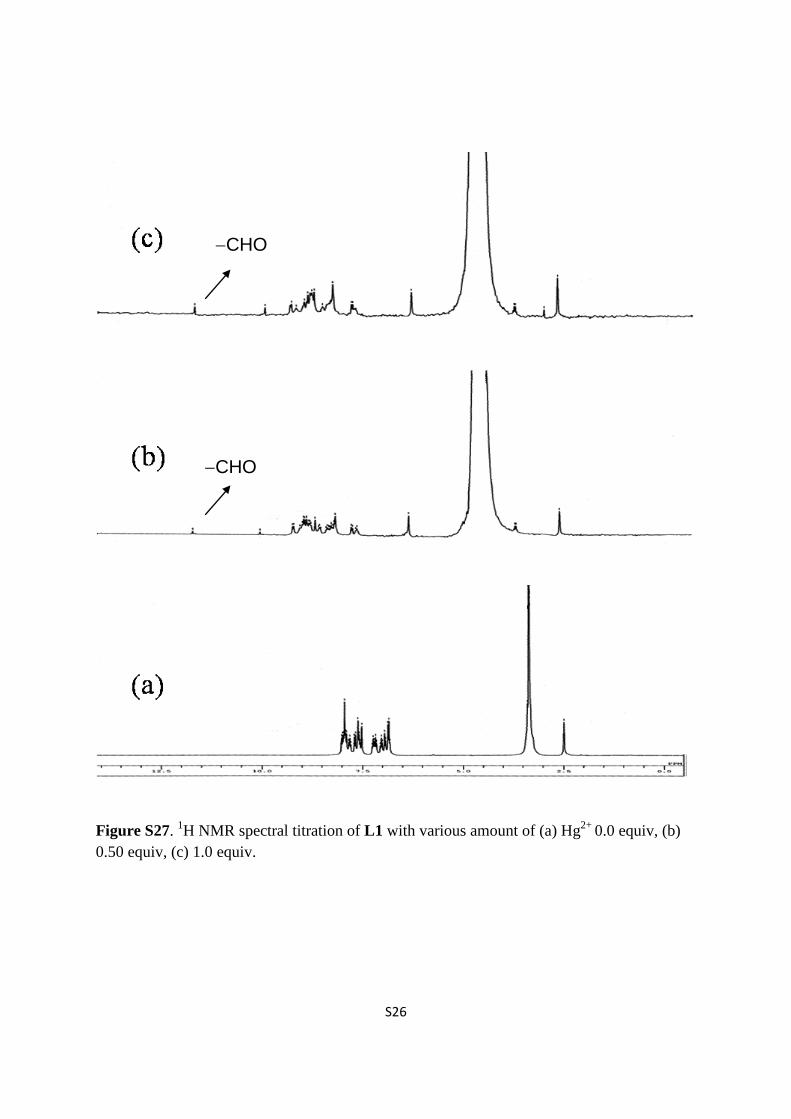
Figure S27. 1H NMR spectral titration of L1 with various amount of (a) Hg2+ 0.0 equiv, (b) 0.50 equiv, (c) 1.0 equiv.
−CHO
−CHO
S27
References:
1 D. D. Perrin, W. L. F. Armango and D. R. Perrin, Purification of laboratory Chemicals,
Pergamon, Oxford, UK, 1986.
2 L. J. Bartolottiand and K. Fluchick, In Reviews in Computational Chemistry; K. B.
Lipkowitz and D. Boyd, Ed. VCH: New York, 1996, 7, 187.
3 G. M. Sheldrick, SHELXL-97, Program for X-ray Crystal Structure Refinement; Göttingen
University: Göottingen, Germany, (1997); G. M. Sheldrick, SHELXS-97, Program for X-
ray Crystal Structure Solution; Göttingen University: Göttingen, Germany, (1997).
4 A. L.Spek, PLATON, A Multipurpose Crystallographic Tools; Utrecht University, Utrecht,
The Netherlands, (2000); A. L. Spek, Acta Crystallogr. A 1990, 46, C31.
5 M. J. Frisch, G. W. Trucks, H. B. Schlegel, G. E. Scuseria, M. A. Robb, J. R. Cheeseman,
G. Scalmani, V. Barone, B. Mennucci, G. A. Petersson, H. Nakatsuji, M. Caricato, X. Li,
H. P. Hratchian, A. F. Izmaylov, J. Bloino, G. Zheng, J. L. Sonnenberg, M. Hada, M.
Ehara, K. Toyota, R. Fukuda, J. Hasegawa, M. Ishida, T. Nakajima, Y. Honda, O. Kitao,
H. Nakai, T. Vreven, J. A. Jr. Montgomery, J. E. Peralta, F. Ogliaro, M. Bearpark,; J. J.
Heyd, E. Brothers, K. N. Kudin, V. N. Staroverov, R. Kobayashi, J. Normand, K.
Raghavachari, A. Rendell, J. C. Burant, S. S. Iyengar, J. Tomasi, M. Cossi, N. Rega, N. J.
Millam, M. Klene, J. E. Knox, J. B. Cross, V. Bakken, C. Adamo, J. Jaramillo, R.
Gomperts, R. E. Stratmann, O. Yazyev, A. J. Austin, R. Cammi, C. Pomelli, J. W.
Ochterski, R. L. Martin, K. Morokuma, V. G. Zakrzewski, G. A. Voth, P. Salvador, J. J.
Dannenberg, S. Dapprich, A. D. Daniels, Ö. Farkas, J. B. Foresman, J. V. Ortiz, J.
Cioslowski and D. J. Fox, Gaussian, Inc., Wallingford CT, 2009.
6 (a) P. Hay and W. R. Wadt, J. Chem. Phys., 1985, 82, 270; (b) W. R. Wadt and P. Hay, J. Chem. Phys., 1985, 82, 284; (c) P. Hay and W. R. Wadt, J. Chem. Phys., 1985, 82, 299.
7 Y. Zhang, Y. Fang, H. Liang, H. Wang, K. Hu, X. Liu, X. Yi, Y. Peng, Bioorg. Med.
Chem. Lett. 2013, 23, 107–111.
S28
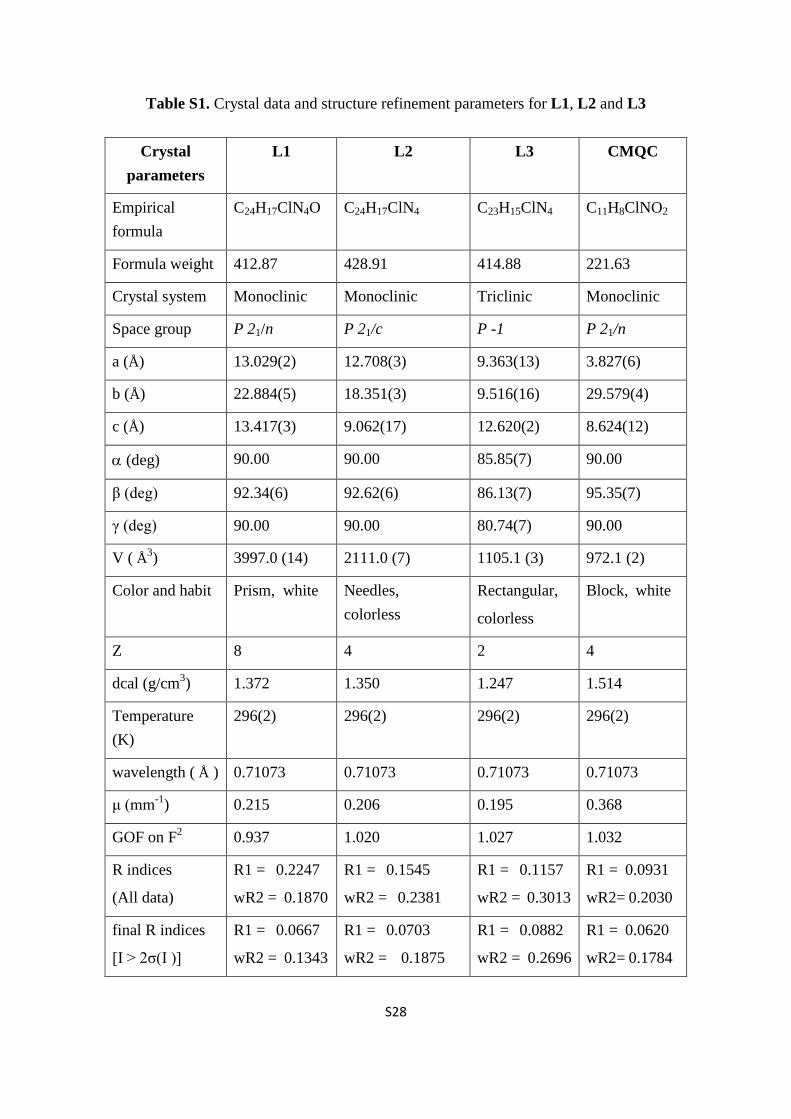
Table S1. Crystal data and structure refinement parameters for L1, L2 and L3
Crystal parameters
L1 L2 L3 CMQC
Empirical formula
C24H17ClN4O C24H17ClN4 C23H15ClN4 C11H8ClNO2
Formula weight 412.87 428.91 414.88 221.63
Crystal system Monoclinic Monoclinic Triclinic Monoclinic
Space group P 21/n P 21/c P -1 P 21/n
a (Å) 13.029(2) 12.708(3) 9.363(13) 3.827(6)
b (Å) 22.884(5) 18.351(3) 9.516(16) 29.579(4)
c (Å) 13.417(3) 9.062(17) 12.620(2) 8.624(12)
α (deg) 90.00 90.00 85.85(7) 90.00
β (deg) 92.34(6) 92.62(6) 86.13(7) 95.35(7)
γ (deg) 90.00 90.00 80.74(7) 90.00
V ( Å3) 3997.0 (14) 2111.0 (7) 1105.1 (3) 972.1 (2)
Color and habit Prism, white Needles, colorless
Rectangular,
colorless
Block, white
Z 8 4 2 4
dcal (g/cm3) 1.372 1.350 1.247 1.514
Temperature (K)
296(2) 296(2) 296(2) 296(2)
wavelength ( Å ) 0.71073 0.71073 0.71073 0.71073
μ (mm-1) 0.215 0.206 0.195 0.368
GOF on F2 0.937 1.020 1.027 1.032
R indices
(All data)
R1 = 0.2247
wR2 = 0.1870
R1 = 0.1545
wR2 = 0.2381
R1 = 0.1157
wR2 = 0.3013
R1 = 0.0931
wR2= 0.2030
final R indices
[I > 2σ(I )]
R1 = 0.0667
wR2 = 0.1343
R1 = 0.0703
wR2 = 0.1875
R1 = 0.0882
wR2 = 0.2696
R1 = 0.0620
wR2= 0.1784
S29
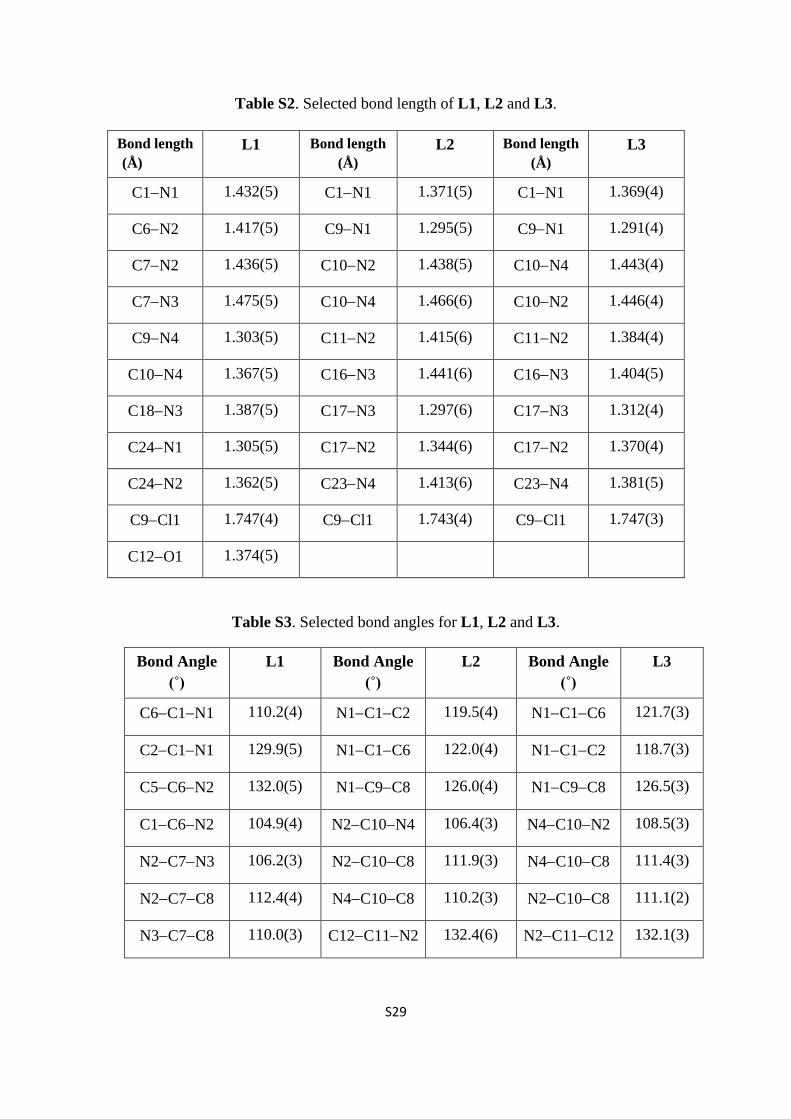
Table S2. Selected bond length of L1, L2 and L3.
Table S3. Selected bond angles for L1, L2 and L3.
Bond Angle (˚)
L1 Bond Angle (˚)
L2 Bond Angle (˚)
L3
C6−C1−N1 110.2(4) N1−C1−C2 119.5(4) N1−C1−C6 121.7(3)
C2−C1−N1 129.9(5) N1−C1−C6 122.0(4) N1−C1−C2 118.7(3)
C5−C6−N2 132.0(5) N1−C9−C8 126.0(4) N1−C9−C8 126.5(3)
C1−C6−N2 104.9(4) N2−C10−N4 106.4(3) N4−C10−N2 108.5(3)
N2−C7−N3 106.2(3) N2−C10−C8 111.9(3) N4−C10−C8 111.4(3)
N2−C7−C8 112.4(4) N4−C10−C8 110.2(3) N2−C10−C8 111.1(2)
N3−C7−C8 110.0(3) C12−C11−N2 132.4(6) N2−C11−C12 132.1(3)
Bond length (Å)
L1 Bond length (Å)
L2 Bond length (Å)
L3
C1−N1 1.432(5) C1−N1 1.371(5) C1−N1 1.369(4)
C6−N2 1.417(5) C9−N1 1.295(5) C9−N1 1.291(4)
C7−N2 1.436(5) C10−N2 1.438(5) C10−N4 1.443(4)
C7−N3 1.475(5) C10−N4 1.466(6) C10−N2 1.446(4)
C9−N4 1.303(5) C11−N2 1.415(6) C11−N2 1.384(4)
C10−N4 1.367(5) C16−N3 1.441(6) C16−N3 1.404(5)
C18−N3 1.387(5) C17−N3 1.297(6) C17−N3 1.312(4)
C24−N1 1.305(5) C17−N2 1.344(6) C17−N2 1.370(4)
C24−N2 1.362(5) C23−N4 1.413(6) C23−N4 1.381(5)
C9−Cl1 1.747(4) C9−Cl1 1.743(4) C9−Cl1 1.747(3)
C12−O1 1.374(5)
S30
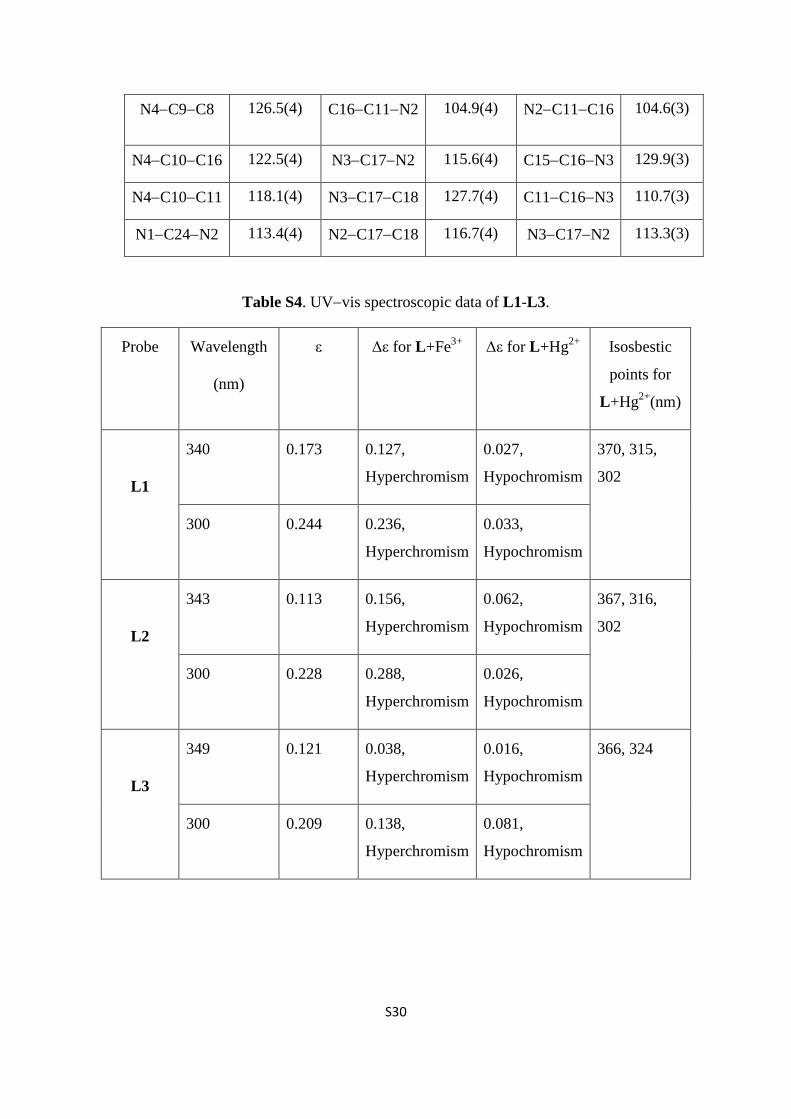
N4−C9−C8 126.5(4) C16−C11−N2 104.9(4) N2−C11−C16 104.6(3)
N4−C10−C16 122.5(4) N3−C17−N2 115.6(4) C15−C16−N3 129.9(3)
N4−C10−C11 118.1(4) N3−C17−C18 127.7(4) C11−C16−N3 110.7(3)
N1−C24−N2 113.4(4) N2−C17−C18 116.7(4) N3−C17−N2 113.3(3)
Table S4. UV−vis spectroscopic data of L1-L3.
Probe Wavelength
(nm)
ε Δε for L+Fe3+ Δε for L+Hg2+ Isosbestic
points for
L+Hg2+(nm)
L1
340 0.173 0.127,
Hyperchromism
0.027,
Hypochromism
370, 315,
302
300 0.244 0.236,
Hyperchromism
0.033,
Hypochromism
L2
343 0.113 0.156,
Hyperchromism
0.062,
Hypochromism
367, 316,
302
300 0.228 0.288,
Hyperchromism
0.026,
Hypochromism
L3
349 0.121 0.038,
Hyperchromism
0.016,
Hypochromism
366, 324
300 0.209 0.138,
Hyperchromism
0.081,
Hypochromism
S31
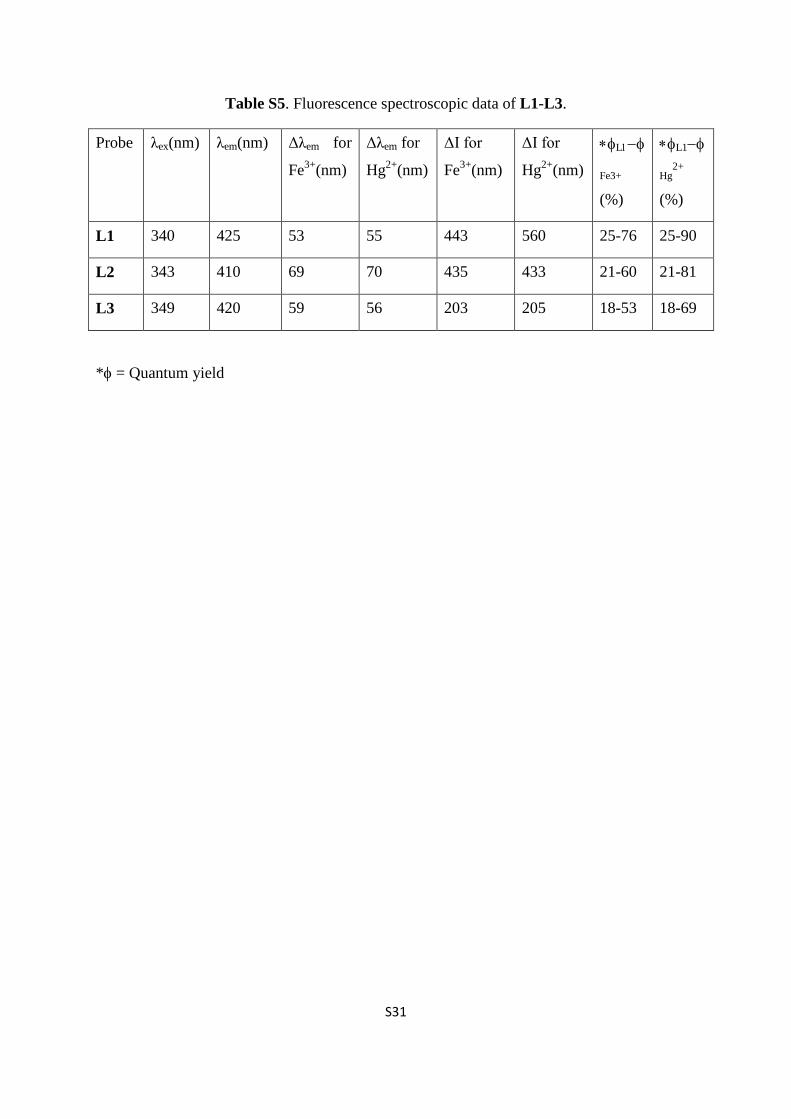
Table S5. Fluorescence spectroscopic data of L1-L3.
Probe λex(nm) λem(nm) Δλem for
Fe3+(nm)
Δλem for
Hg2+(nm)
ΔI for
Fe3+(nm)
ΔI for
Hg2+(nm)
∗φL1−φ
Fe3+
(%)
∗φL1−φ
Hg2+
(%)
L1 340 425 53 55 443 560 25-76 25-90
L2 343 410 69 70 435 433 21-60 21-81
L3 349 420 59 56 203 205 18-53 18-69
*φ = Quantum yield