A Dual-Attention-Based Stock Price Trend Prediction Model ...
12
Received August 24, 2019, accepted September 27, 2019, date of publication October 8, 2019, date of current version October 23, 2019. Digital Object Identifier 10.1109/ACCESS.2019.2946223 A Dual-Attention-Based Stock Price Trend Prediction Model With Dual Features YINGXUAN CHEN 1 , WEIWEI LIN 1,3 , AND JAMES Z. WANG 2 1 School of Computer Science and Engineering, South China University of Technology, Guangzhou 510006, China 2 School of Computing, Clemson University, Clemson, SC 29631, USA 3 Guangdong Luan Industry and Commerce Company Ltd., Guangzhou 510520, China Corresponding author: Weiwei Lin ([email protected]) This work was supported in part by the National Natural Science Foundation of China under Grant 61772205 and Grant 61872084, in part by the Science and Technology Planning Project of Guangdong Province under Grant 2017B010126002 and Grant 2018KJYZ009, in part by the Guangzhou Science and Technology Projects under Grant 201802010010, Grant 201807010052, Grant 201902010040, and Grant 201907010001, in part by the Nansha Science and Technology Projects under Grant 2017GJ001, in part by the Special Funds for the Development of Industry and Information of Guangdong Province (big data demonstrated applications) in 2017, and in part by the Fundamental Research Funds for the Central Universities, SCUT, under Grant 2019ZD26. The work of J. Z. Wang was supported in part by the NSF under Grant 1759856. ABSTRACT Modeling and predicting stock prices is an important and challenging task in the field of financial market. Due to the high volatility of stock prices, traditional data mining methods cannot identify the most relevant and critical market data for predicting stock price trend. This paper proposes a stock price trend predictive model (TPM) based on an encoder-decoder framework that predicting the stock price movement and its duration adaptively. This model consists of two phases, first, a dual feature extraction method based on different time spans is proposed to get more information from the market data. While traditional methods only extract features from information at some specific time points, this proposed model applies the PLR method and CNN to extract the long-term temporal features and the short-term spatial features from market data. Then, in the second phase of the proposed TPM, a dual attention mechanism based encoder-decoder framework is used to select and merge relevant dual features and predict the stock price trend. To evaluate our proposed TPM, we collected high-frequency market data for stock indexes CSI300, SSE 50 and CSI 500, and conducted experiments based on these three data sets. The experimental results show that the proposed TPM outperforms the existing state-of-art methods, including SVR, LSTM, CNN, LSTM_CNN and TPM_NC, in terms of prediction accuracy. INDEX TERMS Stock price, predictive models, neural networks, encoder-decoder, dual feature extraction, dual attention mechanism. I. INTRODUCTION The stock price is a highly volatile time series in the financial field. The prices of stocks are affected by many factors, such as interest rates, exchange rates, inflation, monetary policy, investor sentiment, etc. Modeling the relationship between the stock price and these factors and predicting the stock price trend is a challenging task for researchers and investors. There are many studies on the prediction and analysis of financial time series. In 1970, the Effective Market Hypoth- esis [1] indicated that the stock price is an immediate reflec- tion of stock market information. Therefore, researchers use traditional statistical methods such as regression methods, The associate editor coordinating the review of this manuscript and approving it for publication was Yongping Pan . exponential average and ARIMA [2]–[4] to predict the stock price based on historical prices. However, since the under- lying market information mined from stock price is too little, these statistical methods cannot accurately predict stock price trend. Statistical methods often assume that the time series is generated from a linear process and therefore perform poorly in non-linear stock price prediction. Machine learning and deep learning methods have been relatively successful in financial time series modeling. Compared with statistical methods, machine learning and deep learning methods have better nonlinear mapping ability. A considerable amount of research has been conducted to extract features on specific time points and then use features to model and predict the result. However, they ignore the interaction of data and short- term continuity of data fluctuations. To breach this gap, VOLUME 7, 2019 This work is licensed under a Creative Commons Attribution 4.0 License. For more information, see http://creativecommons.org/licenses/by/4.0/ 148047
Transcript of A Dual-Attention-Based Stock Price Trend Prediction Model ...

Received August 24, 2019, accepted September 27, 2019, date of publication October 8, 2019, date of current version October 23, 2019.
Digital Object Identifier 10.1109/ACCESS.2019.2946223
A Dual-Attention-Based Stock Price TrendPrediction Model With Dual FeaturesYINGXUAN CHEN1, WEIWEI LIN 1,3, AND JAMES Z. WANG21School of Computer Science and Engineering, South China University of Technology, Guangzhou 510006, China2School of Computing, Clemson University, Clemson, SC 29631, USA3Guangdong Luan Industry and Commerce Company Ltd., Guangzhou 510520, China
Corresponding author: Weiwei Lin ([email protected])
This work was supported in part by the National Natural Science Foundation of China under Grant 61772205 and Grant 61872084, in partby the Science and Technology Planning Project of Guangdong Province under Grant 2017B010126002 and Grant 2018KJYZ009, in partby the Guangzhou Science and Technology Projects under Grant 201802010010, Grant 201807010052, Grant 201902010040, and Grant201907010001, in part by the Nansha Science and Technology Projects under Grant 2017GJ001, in part by the Special Funds for theDevelopment of Industry and Information of Guangdong Province (big data demonstrated applications) in 2017, and in part by theFundamental Research Funds for the Central Universities, SCUT, under Grant 2019ZD26. The work of J. Z. Wang was supported in part bythe NSF under Grant 1759856.
ABSTRACT Modeling and predicting stock prices is an important and challenging task in the field offinancialmarket. Due to the high volatility of stock prices, traditional dataminingmethods cannot identify themost relevant and critical market data for predicting stock price trend. This paper proposes a stock price trendpredictive model (TPM) based on an encoder-decoder framework that predicting the stock price movementand its duration adaptively. This model consists of two phases, first, a dual feature extraction method basedon different time spans is proposed to get more information from the market data. While traditional methodsonly extract features from information at some specific time points, this proposed model applies the PLRmethod and CNN to extract the long-term temporal features and the short-term spatial features from marketdata. Then, in the second phase of the proposed TPM, a dual attention mechanism based encoder-decoderframework is used to select and merge relevant dual features and predict the stock price trend. To evaluate ourproposed TPM, we collected high-frequencymarket data for stock indexes CSI300, SSE 50 and CSI 500, andconducted experiments based on these three data sets. The experimental results show that the proposed TPMoutperforms the existing state-of-art methods, including SVR, LSTM, CNN, LSTM_CNN and TPM_NC,in terms of prediction accuracy.
INDEX TERMS Stock price, predictive models, neural networks, encoder-decoder, dual feature extraction,dual attention mechanism.
I. INTRODUCTIONThe stock price is a highly volatile time series in the financialfield. The prices of stocks are affected by many factors, suchas interest rates, exchange rates, inflation, monetary policy,investor sentiment, etc. Modeling the relationship betweenthe stock price and these factors and predicting the stock pricetrend is a challenging task for researchers and investors.
There are many studies on the prediction and analysis offinancial time series. In 1970, the Effective Market Hypoth-esis [1] indicated that the stock price is an immediate reflec-tion of stock market information. Therefore, researchers usetraditional statistical methods such as regression methods,
The associate editor coordinating the review of this manuscript and
approving it for publication was Yongping Pan .
exponential average and ARIMA [2]–[4] to predict the stockprice based on historical prices. However, since the under-lying market information mined from stock price is too little,these statistical methods cannot accurately predict stock pricetrend. Statistical methods often assume that the time seriesis generated from a linear process and therefore performpoorly in non-linear stock price prediction. Machine learningand deep learning methods have been relatively successfulin financial time series modeling. Compared with statisticalmethods, machine learning and deep learning methods havebetter nonlinear mapping ability. A considerable amount ofresearch has been conducted to extract features on specifictime points and then use features to model and predict theresult. However, they ignore the interaction of data and short-term continuity of data fluctuations. To breach this gap,
VOLUME 7, 2019 This work is licensed under a Creative Commons Attribution 4.0 License. For more information, see http://creativecommons.org/licenses/by/4.0/ 148047
Y. Chen et al.: Dual-Attention-Based Stock Price TPM With Dual Features
we propose a dual data feature extraction method based onone single time point andmultiple time points, combine short-term market features with long-term temporal features toimprove the accuracy of prediction. Moreover, the proposedmodel is based on the encoder-decoder framework [5]–[6],and the attention mechanism [7] is introduced in encoder anddecoder stages respectively to solve the problem that the mostrelevant features could not be concerned in a long time series.
Motivated by above-mentioned problems, this paper pro-poses a new stock price trend prediction model (TPM) basedon dual features and dual attention mechanism. The aim ofthe TPM is to predict the direction and duration of stock pricechanges. The main contributions of this paper include:
1) A new dual-feature extraction method based on differ-ent time spans is proposed, which can effectively minethe underlying market information and optimize modelprediction results. In this paper, the piecewise linearregression method and convolutional neural networkare used to extract long-term temporal features andshort-term market features of the financial time seriesin different time spans. Describing the stock marketinformation with dual features can improve the modelprediction performance.
2) Using an encoder-decoder framework, a stock pricetrend prediction model (TPM) based on the dual atten-tion mechanism is proposed. Introducing the attentionmechanism in both encoder and decoder stage respec-tively, the TPM model can adaptively select the mostrelevant spatial short-termmarket features and combinethem with long-term temporal features for prediction.
3) A performance study on our proposed TPM showsthat this proposed method outperforms the state-of-artmethods, including SVR, LSTM, CNN, LSTM_CNNand TPM_NC, under various training and testingparameters with different stock index data sets. Theperformance results show our proposed TPM demon-strates better generalization ability andmarket forecast-ing ability.
The rest of this paper is organized as follows.Section 2 introduces the related work on mining the financialtime series. The proposed preprocessing method and TPMare discussed in details in Section 3. Section 4 presentsexperiments which demonstrate the superiority of our TPM.We conclude our work in Section 5.
II. RELATED WORKIn the field of mining the financial time series, most researchmethods can be divided into two phases: data preprocessingand time series modeling. In data preprocessing phase, somepreprocessing procedure such as dimension reduction, featureselection, and feature extraction can be used to transformraw input data into representative features. Then in timeseries modeling stage, a prediction model is built to learn thetemporal dependencies of feature and predict the result.
Data preprocessing is a process that maps the originalhigh-dimensional data into low-dimensional features, filter
out the irrelevant data, and obtain the least redundantand most representative features. The data preprocessingresults often influence the effect of the prediction. In thefield of mining financial time series, feature selection andextraction, time series segmentation are often used for datapreprocessing. Feature selection and extraction can be clas-sified as filters and wrappers, depending on different fea-ture evaluation methods [8]. Filter methods choose staticstatistical characteristics of the data as evaluation criteria,while wrapper methods are refining the results dynamically.Generally, wrapper methods perform better than filter meth-ods but need more expensive computing resources. There-fore, some researchers have suggested a combined filter andwrapper method. Moradi and Gholampour [9] proposed afeature search method which combined feature correlationof local search and particle swarm optimization of globalsearch. Dong et al. [10] blended binary genetic algorithm,neighborhood rough set algorithm and ROGA algorithm forfeature extraction. Time series segmentation, decomposinghistorical data into important points or segments, have greathelp in filtering data noise, reducing dimension and savingcomputing resources. For example, Chang et al. [11] com-bined genetic algorithm and segmentation methods for iden-tifying trend points and Zhao andWang [12] used the outliersof stock volume for stock market prediction.
Modeling and learning the dependencies of financial timeseries is a challenging issue. In the last decades, machinelearning and deep learning methods have become very popu-lar in financial time series modeling. Machine learning meth-ods, such as random forest [13], artificial neural network [14],and support vector machine [15], have good nonlinear map-ping ability and easy interpretation. Chen and Hao [16] pre-dicted the stock index by applying feature-weighted SVMandfeature-weighted KNN. Thakur and Kumar [17] integratedthe random forest and weighted SVM to generate tradingsignals of decision support systems. Chandar [18] used adiscrete wavelet transform to decompose financial time seriesdata and build a fuzzy set based ANN model for predictingthe closing price of the stock. Deep learning methods, dis-cover the multi-level abstract data representations of data setby its deep neural network structure and back-propagationalgorithms, have achieved great success in image processing,speech recognition and text mining [19], such as Seq2Seq [5],GoogLeNet [20], ResNet [21], BERT [22] and have also beentried in the financial time series field [23]–[25]. For exam-ple, Zhang et al. [26] proposed a novel event representationmodel involving RBM and sentence2vec, which extractsand trains the stock price data and news text informationfor prediction. Minh et al. [27] proposed a new two-streamgated recurrent unit network (TGRU) to improve the per-formance of the prediction model. Pang et al. [28] proposedtwo LSTM models, one based on the embedded layer andthe other based on the automatic encoder. The LSTM withembedded layer shows better performance in stock marketprediction. As we discussed earlier, most of them appliedmachine learning method for feature extraction and used a
148048 VOLUME 7, 2019

Y. Chen et al.: Dual-Attention-Based Stock Price TPM With Dual Features
FIGURE 1. Detailed processes of the TPM.
single neural network for modeling. However, they ignoredthat usingmultiple different intricate structures of deep neuralnetworks, such as CNN, RNN, LSTM, can consider the char-acteristic of data more comprehensively.
III. TREND PREDICTION MODEL (TPM)The aforementioned deficiencies are summarized as follows:first, the univariate financial time series contains insuffi-cient information. Second, the traditional feature extrac-tion method is limited in studying market behavior. Third,the information learning from data with a single neural net-work is incomprehensive.
To address these issues, this paper proposes a new stocktrend prediction model (TPM) based on dual features anddual attention mechanism. This model consists of two phases.First, we use the piecewise linear regression method tosegment the financial time series and extract the historicallong-term temporal features based on the sub-sequences withdifferent time spans. The short-term spatial market featuresbased on each time point are generated through a convolu-tional neural network. Then, in the second phase of TPM,with the dual features extracted previously, a dual-attention-based trend prediction model is proposed. It is based onthe encoder-decoder framework. The encoder stage is inthe form of LSTM and the attention mechanism in encoderis applied to extract the most relevant short-term marketfeatures adaptively, then encode into a feature vector. Thedecoder stage, formed by attention-based LSTM, selectsand decodes the most relevant fusion features to predict thestock price trend. The detailed process of the TPM is shownin Fig. 1.
Given a financial time series X = X1,X2, . . . ,Xn, whereXn ∈ Rd represents the input data at time n. We decomposethe predict time series into sub-sequence sets, denoted byL =(L1,L2, . . . ,Lm). Each sub-sequence is fitted to a segmentand denoted by Lm = (sm, dm), sm is the slope of the segment,and dm is the duration of the sub-sequence, which is thetime length of the segment. The long-term temporal featurescan be extract through the sliding window ωl . At time t , thelong-term feature can be denoted by
Zt ={(sm, dm) |
∑mωlm1
dm ≤ t}
(1)
The short-term feature can be extracted from the data of thesliding window ωs and the short-term feature at time t is
St =(Xt−ωs ,Xt−ωs+1, . . . ,Xt
)(2)
The set of the short-term features is S = (S1, S2, . . . , Sk ) andthe length of each element Sk is ωs.As we discussed in Section 1, according to the long-term
features and the short-term features, our goal is to predict thestock price trend YT = (sT , dT ). More specifically, we aim tolearn a nonlinear mapping F(�) that
YT = F(ZT−1, ST−1) (3)
A. PHASE I: DATA PREPROCESSING1) FEATURE GENERATIONSince the market information provided by univariate finan-cial time series is insufficient, it is hard to model and pre-dict the stock price trend from univariate data. We choosethe basic market data such as opening price, closing price,highest price, lowest price, volume and transform them intotechnical indicators. Technical indicators are the meaningfulrules and patterns of the market proposed in [29]–[30].For example, Moving Average (MA), The Relative StrengthIndex (RSI) and Moving Average Convergence/Divergence(MACD). In addition, their lagged time series also containedas our features. The specific description of the generatedfeatures is shown in Table 1.
Collecting the five-minute interval market data of CSI300 on March 21, 2017, the closing price and several featuresmentioned above are plotted in Fig. 2. We can find that inFig. 2 (a), the closing price change of two sub-periods isvery similar, but Fig. 2 (b)-(f), other features of these twosub-periods are completely different, especially the Volumein Fig. 2 (b) and the WMSR%12 in Fig. 2 (e). Therefore, it isunreliable to predict the stock price trend only by the changeof the closing price, and we should combine multi-feature todepict the stockmarket information and improve the accuracyof prediction.
2) DUAL FEATURE EXTRACTIONa: PLR EXTRACTS THE LONG-TERM TEMPORAL FEATURESConsidering the continuity of data changes, we extract thelong-term temporal features with multiple time points bypiecewise linear regression method (PLR). The PLR method
VOLUME 7, 2019 148049

Y. Chen et al.: Dual-Attention-Based Stock Price TPM With Dual Features
TABLE 1. Description of generated features.
FIGURE 2. Changes in different features of CSI 300, on March 21, 2017.
can smooth the short-term fluctuation noise, reduce the datadimension and improve the computational performance.
There are three traditional PLR methods, bottom-up, top-down and sliding window. The sliding windowmethod is thatdividing financial time series into sub-sequences with fixedlength. If the window size is not suitable, the sub-sequencewill be incorrectly divided, which will influence the effect ofthe prediction. To avoid this, we choose the bottom-up PLRmethod which segments the time series more appropriatelyand has a relatively low fitting error compared with othermethods. The detailed algorithm is shown in Algorithm 1.
In our task, we assume that the number of data points is nand there are m segments with length d . Each segment withlength i needs θ (i) times to generate so that reach d lengthsegment from 2 length segments needs θ (d2) time. We needto check n/d segments with d length at most, thus, the timecomplexity is O(n ∗ d).
Obviously, the segment result of the time series dependson the maximum error threshold δ. Taking CSI 300 as anexample, we use the bottom-up PLR method to segmentits historical closing price. In Fig. 3 (a), when the thresh-old value δ is 2.0, the time series can be divided into
148050 VOLUME 7, 2019

Y. Chen et al.: Dual-Attention-Based Stock Price TPM With Dual Features
Algorithm 1 Bottom-Up PLR for Financial Time Series Seg-mentation
Input A financial time series X = x1, x2, . . . , xn, maxerror δ
OutputA sequence of line segments L = (L1,L2, . . . ,Lm)
1 for i = 1:⌊ n2
⌋do
2 Li = create segment(x2i−1, x2i)3 end for4 for each Li in L do5 calculate the merged cost Ci of Li and Li+1
segments6 end for7 while min(C) < max error δ do8 i = min(C)9 replace Li with the merge of Li and Li+110 delete Li+111 update the merged cost Ci with new Li and Li+1
segments12 update the merged cost Ci−1 with new Li−1 and
Li segments13 end while14 Output L
FIGURE 3. The segment results of PLR method with threshold δ = 2.0(top) and threshold δ = 4.0 (bottom).
16 sub-sequences, while in Fig. 3 (b), when the thresholdvalue δ is 4.0, there are only four sub-sequences can beobtained. With the increase of threshold value, the more datafluctuations are ignored and the fewer sub-sequences areformed. The value of the threshold influence the validity ofhistorical time series features. Each sub-sequence representsthe fluctuation of data over a time period. The slope sm andthe duration dm of each sub-sequence are generated as thelong-term temporal features in TPM to predict the stock pricetrend.
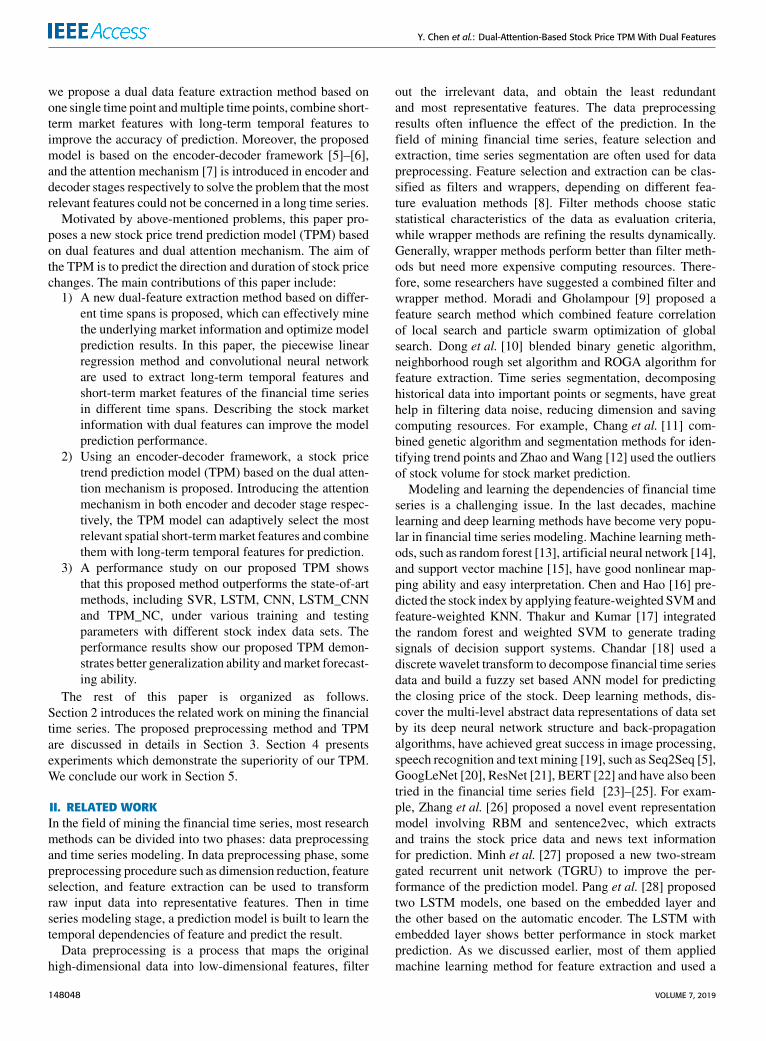
b: CNN EXTRACTS THE SHORT-TERM SPATIAL MARKETFEATURESConsidering the interaction of different data at the same timepoint, the short-term spatial market feature of each timepoint is extracted by a convolution neural network. Givenfinancial time series X = X1,X2, . . . ,Xn, we construct aMarket Matrix to describe the historical stock market whichis denoted by ST−1 = (X1,X2, . . . ,XT−1). In the MarketMatrix, each row represents one dimension of ST−1 and thenumber of rows is n, while each column represents one timepoints and the number of columns is T-1. Because the CNNpreserve the neighborhood relations and spatial locality of theinput data [31], CNN can capture the non-linear relationshipbetween the Market Matrix ST−1 and stock trend (sT , dT ),and output the spatial features of the short-term historicaltime series. ST−1 = (X1,X2, . . . ,XT−1).The detailed short-term feature extraction structure of
CNN is shown in Fig.4. In our CNN architecture, differentsize of convolution kernel is chosen such as 1 × 3, 1 × 5to extract abstract multi-level spatial market features. Theconvolution neuron for extracting features from input theMarket Matrix is given by
H ct = ∅
(bc +
∑W c∗ Xt
)(4)
where Xt denotes the input Market Matrix, ∗ is the convolu-tion operation, W c and bc are the weights and biases of con-volution neurons to be trained, ∅(�) is a non-linear activationfunction which is chosen to be the ReLU function [32].
The max pooling layer will be performed after convolutionlayers and it can reduce the size of feature maps and avoidoverfitting.We choose the same sizewith the convolution ker-nel 1×m and the max pooling operation can be described by
H i,pt = max
(H i,ct ,H
i+1,ct , . . . ,H i+m−1,c
t
)(5)
After several layers of convolution and max-pooling,we feed the outputs to a projected layer byWt = W p
∗Hpt +b
p,where W p and bp are parameters. Finally, the interaction ofdata can be depicted by the short-term spatial market vectorWMarket = (W1,W2, . . . ,WT−1), where each Wt ∈ Rm
denotes the spatial market feature at time t .
B. PHASE II: TIME SERIES MODELING BYENCODER-DECODER FRAMEWORKThe encoder-decoder framework is first proposed in textprocessing, which is usually in the form of RNN or CNN.In an encoder-decoder framework, the encoder compressesthe input information into a fixed-size vector and the decoderprocesses these vectors into the final result. However, whenthere is too much input information, the encoder cannotefficiently identify all relative information. As a result,the performance of the encoder-decoder framework will dete-riorate. The attention mechanism can optimize the prob-lem by decoding the hidden state of relevant neurons.The encoder-decoder framework is simulating the humaninformation processing process, solving the limitation of
VOLUME 7, 2019 148051
Y. Chen et al.: Dual-Attention-Based Stock Price TPM With Dual Features
FIGURE 4. The short-term feature extraction structure of CNN.
FIGURE 5. The structure of the encoder-decoder framework in TPM.
the same length of the encoding-decoding time series, andrefining and compressing the input data to generate betterprediction results.
Clearly, there is a problem that the attention-based decodercannot select relevant input data explicitly, so we introducethe attention in both encoder and decoder stage respectively.The second phase of our proposed TPM is based on thedual attention mechanism which is shown in Fig. 5. Theencoder-decoder framework can be divided into two stages.In the first stage we input the short-term spatial marketfeatures extracted by CNN into the attention-based LSTMencoder, the relevant short-term features at each time point areselected adaptively and encoded into vectors. In the secondstage, the encoded vectors and the long-term temporal fea-tures extracted by PLR are input, the LSTM decoder decodesthe relevant vectors and features based on the attention mech-anism to predict the stock price trend. Through the dualattention mechanism, we can adaptively select the most
relevant spatial market features and temporal features tomodel and predict the trend.
1) ATTENTION-BASED SHORT-TERM FEATURE ENCODERGiven the short-term spatial market features WMarket =
(W1,W2, . . . ,WT−1) extracted by the CNN. At each timepoint t , the encoder learns the mapping relationship betweenthe input featureWt and the hidden state Ht :
Ht = fen (Wt ,Ht−1; θen) (6)
whereHt ∈ Rk is the hidden state of the encoder at time t , k isthe size of the hidden state, fen(�) is a nonlinear function, andθen denotes the parameters of the encoder. We use LSTM [33]as a nonlinear function fen to capture the temporal dependen-cies and form a short-term feature encoder. A LSTM neuroncontrols the update and output of the state by a forget gate σ1,an input gate σ2 and an output gate σ3. Their operations are
148052 VOLUME 7, 2019

Y. Chen et al.: Dual-Attention-Based Stock Price TPM With Dual Features
FIGURE 6. The calculation procedure of the attention mechanism.
as follows:
ft = σ1(Wf [H t−1;Wt ]+ bf ) (7)
it = σ2(Wi[H t−1;W t ]+ bi) (8)
Ct = tanh(Wc[H t−1;W t]+ bc) (9)
ot = σ3(Wo
[Ht−1;W t
]+ bo
)(10)
Ct = ft ∗ Ct−1 + it ∗ Ct (11)
Ht = ot ∗ tanh (Ct) (12)
where σ1, σ 2, σ3 are three sigmoid functions, ∗ is theelement-wise operator, Ht−1 is the hidden state of the pre-vious time point t-1, Wt is the input at time point t ,Wf ,Wi,Wc,W o ∈ Rk×(k+m) and bf , bi, bc, bo ∈ Rk areparameters. LSTM is capable of modeling the dynamic tem-poral behavior of time series effectively and avoiding gradientvanishing or exploding issues in RNN [34].
As shown in Fig. 6, we introduce the attention mecha-nism [7] in encoder stage and divide the input featureWMarketinto
(W 1,W 2, . . . ,Wm
)according to the feature dimension
m, whereW p= (Wp,1,Wp,2, . . . ,Wp,T−1) represents the p-th
dimension feature at each time point. Given the hidden stateHt−1 and the cell stateCt−1 calculated at time t-1, the relevantdimensions of the input features are identified and used toupdate the input features of the next time t .
βp,t = va tanh(Wa [Ht−1;Ct−1]+ UaW p) (13)
αp,t =exp
(βp,t
)∑mp=1 exp(βp,t ))
(14)
Ft =(α1,tW1,t , α2,tW2,t , . . . , αm,tWm,t
)(15)
where va ∈ RT−1, Wa ∈ R(T−1)×2k and Ua ∈ R(T−1)×(T−1)
are parameters, the softmax function is chosen for calculatingthe importance αm,t of each dimension feature, update alldimensions of Wt to Ft and input them to the encoder, thenthe hidden state of the time point t is:
Ht = fen (Ft ,Ht−1; θen) (16)
Through the above steps, at each time point t , we can selectthe relevant dimensions of spatial market features, update theinput feature and the hidden state of the encoder successively,and generate the most relevant short-term feature encodevector.
2) ATTENTION-BASED LONG-TERM FEATURE DECODERThe decoder is in the form of the LSTM neurons to predictthe stock price trend. Given the long-term temporal featureZT−1 = (L1,L2, . . . ,LT−1) extracted by PLRmethod, whereT-1 is the sequence length, and Lt = (st , dt ) denotes the long-term temporal features at time point t . At each time point t ,the decoder LSTM learns the mapping relationship betweenthe encode vectorWt , the long-term feature Lt and the hiddenstate H
′
t .
H′
t = fde(Lt ,Wt ,H
′
t−1; θde
)(17)
where H ′t ∈ Rg is the hidden state of the decoder at time t ,g is the size of the hidden state, fde(�) is a nonlinear function,and θde denotes the parameters of the decoder. Similarly,we use LSTM as a nonlinear function fde to capture thetemporal dependencies and form a long-term feature decoder.The calculate procedure is similar to the encoder stage.
We also introduce the attention mechanism in decoderstage to get the related encoder hidden states of all timepoints. Given the hidden state H ′t−1 ∈ Rg and the cell stateC ′t−1 ∈ Rg of the decoder, the hidden stateHi of the encoder,the importance of the hidden state γi,t in the i-th encoder attime t can be obtained by
ηi.t = vb tanh(Wb
[H′
t−1;C′
t−1
]+ UbHi
)(18)
γi,t =exp (ηi.t)∑T−1j=1 exp
(ηi.j) (19)
where 1 ≤ i ≤ T − 1, vb ∈ Rk , Wb ∈ Rk×2g and Ub ∈Rk×k are parameters. Then, the context vector that we feed tothe decoder is given through all hidden states of the encoder(H1,H2, . . . ,Hk ) by
C′
t =
T−1∑i=1
γi,tHi (20)
After obtaining the context vector C′
t , we can combine C ′twith the long-term temporal feature Lt to generate the mixedfeature yt , that is
yt = wTc[Lt ;C
′
t
]+ bc (21)
where wTc ∈ Rk+2 and bc ∈ R2 are parameters to belearned. Finally, instead the feature Lt with the mixed featureyt , we can get the hidden state of the decoder H ′t by
H′
t = fde(yt ,H
′
t−1; θde
)(22)
Through the aforementioned formula, at each time point t ,the most relevant encoder hidden state of all time points and
VOLUME 7, 2019 148053

Y. Chen et al.: Dual-Attention-Based Stock Price TPM With Dual Features
the long-term temporal features will be chosen to generate themixed feature vectors.
Finally, we learn the nonlinear mapping function F(�)between the stock price trend and the dual features. Theprediction of stock price trend at time point t YT = (sT , dT )is given by
YT = F (ZT−1, ST−1)
= vTd (W d
[H′
T−1;C′
T−1
]+ bd )+ b
′
d (23)
where H ′T−1 and C ′T−1 represent the hidden state and con-tent vector of the decoder at time point T-1, Wd ∈ Rg×(g+k)
and bd ∈ Rg are parameters. And at last, we use a linearfunction to get the stock price trend prediction at time pointT , where vTd ∈ Rg and b
′
d ∈ R are weights and bias of thelast linear function.
We used a stochastic gradient descent method and amomentum optimizer to train the proposed model with thebatch size of 64 and the learning rate of 0.001. The squarederror function with regular terms is our object function, andthe parameters of the model will be learned through the backpropagation. The loss function is given by
Loss (W, b) =1N
N∑i=1
(Y iT − YiT )
2+ λ ‖W‖2 (24)
whereW and b represent the weights and biases to be learned,N is the number of training samples, λ is the hyper-parameterof L2 regularization, and Y iT denotes the slope and dura-tion of time T . By feeding on the extracted dual features,the slope and duration of the stock price trend can beobtained.
IV. EXPERIMENTSIn this section, three different stock indexes from China’sA-share market are chosen for experiments, including CSI300, SSE 50 and CSI 500. We collected the stock marketdata including opening price, closing price, highest price,lowest price, trading volume and turnover with a 5-minuteinterval. The data covers the period from August 31, 2005,to August 31, 2018. In our experiments, we used CSI300 data of 1,132 days including 150,336 data points, SSE50 data of 3,133 days including 150,384 data points, and CSI500 data of 3,042 days including 1,460,016 data points. Wesplit these three data sets into training, validation, and testingset with ratio 8:1:1. With these stock index data sets, weconducted extensive experiments to evaluate the predictiveperformance of our proposed TPM and other models.
A. COMPARISON MODELS AND EVALUATION METRICThe Support Vector Regression, LSTM, CNN andLSTM_CNNmodels are implemented for comparison. Thesemodels are described briefly as follows:
1) Support Vector Regression (SVR): the concatenatingof the short-term features is feed to the SVR, and theparameters of radial basis functions (RBF) are set to
c = 1, γ = 0.1 and d = 3. The prediction of the stockprice trend will be generated with the RBF-based SVR.
2) LSTM: we implemented a recurrent neural networkbased on LSTMneurons and the hidden size is set to 64.We feed the long-term temporal features into LSTM tomodel and predict the stock price trend.
3) CNN: The short-term time series are used as input data,and the stock price trends are trained and predicted bya two-layer convolutional neural network with 3 × 3convolution kernels.
4) LSTM_CNN [35]: it is a hybrid structure of CNN andLSTM.We feed the financial time series to this networkand the CNN and LSTM extract and hybrid the featuresto learn and generate the prediction.
5) TPM_NC: We implemented the TPM_NC model byremoving the CNN neurons from our TPM model.The encoder and decoder of TPM_NC model consistof LSTM neurons. The TPM_NC model encodes theshort-term time series directly and decodes them withthe long-term temporal features to predict the stockprice trend.
We set the CNNof the TPM to consist of a 1×3 convolutionkernel, and the number of LSTM neurons in the encoder anddecoder is 64. The maximum training epochs of these modelsare set to 100.Meanwhile, we adopt the early stopmethod, thedropout layer with 0.5 dropout ratio, and the L2 regularizationwith λ = 0.0001 to prevent over-fitting.In order to evaluate the performance of our TPM and other
models in the trend prediction of financial time series, the rootmean square error (RMSE) is used as evaluation metric.Specifically, assuming N is the number of samples, Yt andYt denote the predicted value and the true value respectivelyat time t , we can calculate the RMSE by
RMSE =
√√√√ 1N
N∑i=1
(Yt − Yt
)2 (25)
The lower the RMSE, the closer the predicted value is to thetrue value and the better performance of the model.
Based on these parameters settings, the market data of thethree China Stock Indexes: CSI 300, SSE 50 and CSI 500 aretrained respectively and their stock price trends are predictedseparately.
B. EXPERIMENTS RESULTS1) PREDICTION RESULTSAfter analyzing the historical stock data of China’s stockindex CSI 300, SSE 50 and CSI 500, we set the maximumerror thresholds of PLR method in long-term temporal fea-tures extraction as δCSI 300 = 2.5, δSSE 50 = 1.6, δCSI 500 =0.025, and their time step lengths T − 1 all are 96. We con-ducted the experiments with the settings in Section A. and theexperimental results are shown in Table 2.
It can be observed that in all these three data sets, ourproposed TPM out-performs other models in predicting the
148054 VOLUME 7, 2019

Y. Chen et al.: Dual-Attention-Based Stock Price TPM With Dual Features
TABLE 2. The experimental results of different methods in three stock indexes.
FIGURE 7. The slope prediction results with different thresholds of CSI 300 (left) and the duration prediction results with differentthresholds of CSI 300 (right).
FIGURE 8. The slope prediction results with different thresholds of SSE 50 (left) and the duration prediction results with differentthresholds of SSE 50 (right).
TABLE 3. The slope RMSE and duration RMSE of different methods with the time step length varies in CSI 300.
VOLUME 7, 2019 148055
Y. Chen et al.: Dual-Attention-Based Stock Price TPM With Dual Features
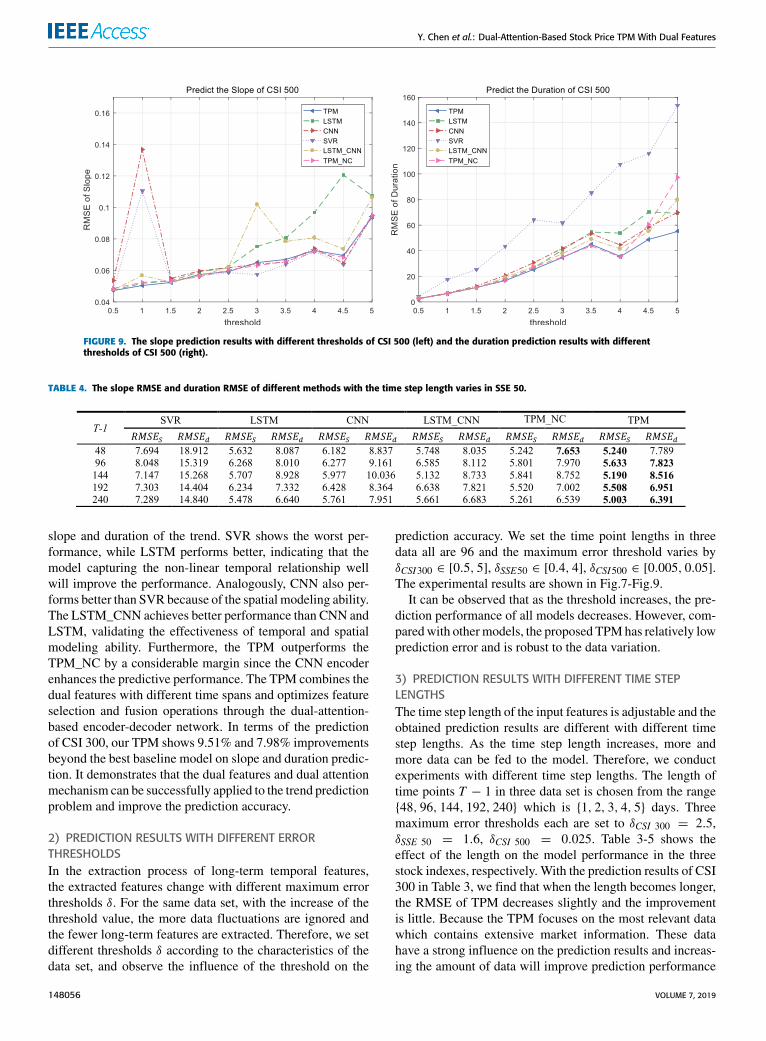
FIGURE 9. The slope prediction results with different thresholds of CSI 500 (left) and the duration prediction results with differentthresholds of CSI 500 (right).
TABLE 4. The slope RMSE and duration RMSE of different methods with the time step length varies in SSE 50.
slope and duration of the trend. SVR shows the worst per-formance, while LSTM performs better, indicating that themodel capturing the non-linear temporal relationship wellwill improve the performance. Analogously, CNN also per-forms better than SVR because of the spatial modeling ability.The LSTM_CNN achieves better performance than CNN andLSTM, validating the effectiveness of temporal and spatialmodeling ability. Furthermore, the TPM outperforms theTPM_NC by a considerable margin since the CNN encoderenhances the predictive performance. The TPM combines thedual features with different time spans and optimizes featureselection and fusion operations through the dual-attention-based encoder-decoder network. In terms of the predictionof CSI 300, our TPM shows 9.51% and 7.98% improvementsbeyond the best baseline model on slope and duration predic-tion. It demonstrates that the dual features and dual attentionmechanism can be successfully applied to the trend predictionproblem and improve the prediction accuracy.
2) PREDICTION RESULTS WITH DIFFERENT ERRORTHRESHOLDSIn the extraction process of long-term temporal features,the extracted features change with different maximum errorthresholds δ. For the same data set, with the increase of thethreshold value, the more data fluctuations are ignored andthe fewer long-term features are extracted. Therefore, we setdifferent thresholds δ according to the characteristics of thedata set, and observe the influence of the threshold on the
prediction accuracy. We set the time point lengths in threedata all are 96 and the maximum error threshold varies byδCSI300 ∈ [0.5, 5], δSSE50 ∈ [0.4, 4], δCSI500 ∈ [0.005, 0.05].The experimental results are shown in Fig.7-Fig.9.
It can be observed that as the threshold increases, the pre-diction performance of all models decreases. However, com-paredwith othermodels, the proposed TPMhas relatively lowprediction error and is robust to the data variation.
3) PREDICTION RESULTS WITH DIFFERENT TIME STEPLENGTHSThe time step length of the input features is adjustable and theobtained prediction results are different with different timestep lengths. As the time step length increases, more andmore data can be fed to the model. Therefore, we conductexperiments with different time step lengths. The length oftime points T − 1 in three data set is chosen from the range{48, 96, 144, 192, 240} which is {1, 2, 3, 4, 5} days. Threemaximum error thresholds each are set to δCSI 300 = 2.5,δSSE 50 = 1.6, δCSI 500 = 0.025. Table 3-5 shows theeffect of the length on the model performance in the threestock indexes, respectively. With the prediction results of CSI300 in Table 3, we find that when the length becomes longer,the RMSE of TPM decreases slightly and the improvementis little. Because the TPM focuses on the most relevant datawhich contains extensive market information. These datahave a strong influence on the prediction results and increas-ing the amount of data will improve prediction performance
148056 VOLUME 7, 2019

Y. Chen et al.: Dual-Attention-Based Stock Price TPM With Dual Features
TABLE 5. The slope RMSE and duration RMSE of different methods with the time step length varies in CSI 500.
marginally. Compared to other models, the TPM model hasa lower RMSE and has similar performance in predicting theSSE 50 and CSI 500 indexes, as shown in Table 4 and Table 5.It demonstrates that in stock price trend prediction, the TPMis successful with its high accuracy and robustness.
V. CONCLUSIONTraditional methods cannot extract relevant features for min-ing the financial time series. To address this issue, we proposea dual phase trend prediction model (TPM) based on dualfeatures and dual attention mechanism for financial stockmarkets. First, in the data preprocessing phase, we use thePLR method and CNN to extract the dual features which rep-resent the long-term trend of historical data and the short-termunderlying market information. Second, in the time seriesmodeling phase, we propose a new framework with short-term feature encoder and long-term feature decoder. Weintroduced the attention mechanism both in encoder anddecoder so that the most relevant dimensions of features ofall time points will be selected andmerged adaptively. Finally,the TPM can accurately predict the slope and duration of thetrend. Our experimental results show that our proposed TPMreduces the RMSE by 13.74% and 17.63% on average incomparison to other models, including SVR, LSTM, CNN,CNN_LSTM, and TPM_NC. In addition, experiments con-ducted with different thresholds and time step lengths demon-strate that the proposed TPM is not only better in predictionperformance but also robust to time and data variation.
REFERENCES[1] E. F. Fama, ‘‘Efficient capital markets: A review of theory and empirical
work,’’ J. Finance, vol. 25, no. 2, pp. 383–417, May 1970.[2] R. Gencay, ‘‘Non-linear prediction of security returns with moving average
rules,’’ J. Forecasting, vol. 15, no. 3, pp. 165–174, Apr. 1996.[3] S. M. Idrees, M. A. Alam, and P. Agarwal, ‘‘A prediction approach for
stock market volatility based on time series data,’’ IEEE Access, vol. 7,pp. 17287–17298, 2019.
[4] M. Khashei and M. Bijari, ‘‘An artificial neural network (p, d, q) modelfor timeseries forecasting,’’ Expert Syst. Appl., vol. 37, no. 1, pp. 479–489,Jan. 2010.
[5] I. Sutskever, O. Vinyals, and Q. V. Le, ‘‘Sequence to sequence learningwith neural networks,’’ in Proc. Adv. Neural Inf. Process. Syst., 2014,pp. 3104–3112.
[6] K. Cho, B. van Merriënboer, C. Gulcehre, D. Bahdanau, F. Bougares,H. Schwenk, and Y. Bengio, ‘‘Learning phrase representations using RNNencoder-decoder for statistical machine translation,’’ in Proc. Conf. Empir-ical Methods Natural Lang. Process. (EMNLP), Oct. 2014, pp. 1724–1734.
[7] D. Bahdanau, K. Cho, and Y. Bengio, ‘‘Neural machine translation byjointly learning to align and translate,’’ 2014, arXiv:1409.0473. [Online].Available: https://arxiv.org/abs/1409.0473
[8] R. C. Cavalcante, R. C. Brasileiro, V. L. F. Souza, J. P. Nobrega,and A. L. I. Oliveira, ‘‘Computational intelligence and financial markets:A survey and future directions,’’ Expert. Syst. Appl., vol. 55, pp. 194–211,Aug. 2016.
[9] P. Moradi and M. Gholampour, ‘‘A hybrid particle swarm optimization forfeature subset selection by integrating a novel local search strategy,’’ Appl.Soft. Comput., vol. 43, pp. 117–130, Jun. 2016.
[10] H. Dong, T. Li, R. Ding, and J. Sun, ‘‘A novel hybrid genetic algorithmwith granular information for feature selection and optimization,’’ Appl.Soft. Comput., vol. 65, pp. 33–46, Apr. 2018.
[11] P. C. Chang, C. Y. Fan, and C. H. Liu, ‘‘Integrating a piecewise lin-ear representation method and a neural network model for stock tradingpoints prediction,’’ IEEE Trans. Syst., Man, C (Appl. Rev.), vol. 39, no. 1,pp. 80–92, Jan. 2009.
[12] L. Zhao and L. Wang, ‘‘Price trend prediction of stock market using outlierdata mining algorithm,’’ in Proc. IEEE 5th Int. Conf. Big Data CloudComput., Aug. 2015, pp. 93–98.
[13] J. Patel, S. Shah, P. Thakkar, and K. Kotecha, ‘‘Predicting stock andstock price index movement using trend deterministic data preparationand machine learning techniques,’’ Expert Syst. Appl., vol. 42, no. 1,pp. 259–268, 2015.
[14] M. Ballings, D. Van den Poel, N. Hespeels, and R. Gryp, ‘‘Evaluatingmultiple classifiers for stock price direction prediction,’’Expert Syst. Appl.,vol. 42, no. 20, pp. 7046–7056, Nov. 2015.
[15] Y. Guo, S. Han, C. Shen, Y. Li, X. Yin, and Y. Bai, ‘‘An adaptiveSVR for high-frequency stock price forecasting,’’ IEEE Access, vol. 6,pp. 11397–11404, 2018.
[16] Y. Chen and Y. Hao, ‘‘A feature weighted support vector machine and K-nearest neighbor algorithm for stock market indices prediction,’’ ExpertSyst. Appl., vol. 80, pp. 340–355, Sep. 2017.
[17] M. Thakur andD. Kumar, ‘‘A hybrid financial trading support system usingmulti-category classifiers and random forest,’’ Appl. Soft Comput., vol. 67,pp. 337–349, Jun. 2018.
[18] S. K. Chandar, ‘‘Fusion model of wavelet transform and adaptive neurofuzzy inference system for stock market prediction,’’ in Journal of AmbientIntelligence and Humanized Computing. Berlin, Germany: Springer, 2019.doi: 10.1007/s12652-019-01224-2.
[19] Y. LeCun, Y. Bengio, and G. Hinton, ‘‘Deep learning,’’ Nature, vol. 521,no. 7553, p. 436, 2015.
[20] C. Szegedy, W. Liu, Y. Jia, P. Sermanet, S. Reed, D. Anguelov, D. Erhan,V. Vanhoucke, and A. Rabinovich, ‘‘Going deeper with convolutions,’’ inProc. IEEE Conf. Comput. Vis. Pattern Recognit., Jun. 2015, pp. 1–9.
[21] K. He, X. Zhang, S. Ren, and J. Sun, ‘‘Deep residual learning forimage recognition,’’ in Proc. IEEE Conf. Comput. Vis. Pattern Recognit.,Jun. 2016, pp. 770–778.
[22] J. Devlin, M.-W. Chang, K. Lee, and K. Toutanova, ‘‘BERT: Pre-trainingof deep bidirectional transformers for language understanding,’’ 2018,arXiv:1810.04805, [Online]. Available: https://arxiv.org/abs/1810.04805
[23] X. Ding, Y. Zhang, T. Liu, and J. Duan, ‘‘Deep learning for event-drivenstock prediction,’’ in Proc. 24th Int. Joint Conf. Artif. Intell., Jun. 2015,pp. 2327–2333.
[24] Y. Qin, D. Song, H. Chen,W. Cheng, G. Jiang, and G.W. Cottrell, ‘‘A dual-stage attention-based recurrent neural network for time series prediction,’’in Proc. 26th Int. Joint Conf. Artif. Intell., Aug. 2017, pp. 2627–2633.
[25] D. M. Nelson, A. C. Pereira, and R. A. de Oliveira, ‘‘Stock market’s pricemovement prediction with LSTM neural networks,’’ in Proc. Int. JointConf. Neural Netw. (IJCNN), May 2017, pp. 1419–1426.
[26] X. Zhang, X. Zhang, S. Qu, J. Huang, B. Fang, and P. Yu, ‘‘Stock marketprediction via multi-source multiple instance learning,’’ IEEE Access,vol. 6, pp. 50720–50728, 2018.
[27] D. L. Minh, A. Sadeghi-Niaraki, H. D. Huy, K. Min, and H. Moon,‘‘Deep learning approach for short-term stock trends prediction basedon two-stream gated recurrent unit network,’’ IEEE Access, vol. 6,pp. 55392–55404, 2018.
VOLUME 7, 2019 148057

Y. Chen et al.: Dual-Attention-Based Stock Price TPM With Dual Features
[28] X. Pang, Y. Zhou, P. Wang, W. Lin, and V. Chang, ‘‘An innovative neuralnetwork approach for stock market prediction,’’ in The Journal of Super-computing. Springer, 2018. doi: 10.1007/s1122.
[29] J. J. Murphy, Technical Analysis of the Financial Markets: A Comprehen-sive Guide to Trading Methods and Applications. New York, NY, USA:Prentice-Hall, 1999.
[30] C.-H. Su and C.-H. Cheng, ‘‘A hybrid fuzzy time series model based onANFIS and integrated nonlinear feature selection method for forecastingstock,’’ Neurocomputing, vol. 205, pp. 264–273, Sep. 2016.
[31] J. Masci, U. Meier, D. Cireşan, and J. Schmidhuber, ‘‘Stacked convolu-tional auto-encoders for hierarchical feature extraction,’’ in Proc. Int. Conf.Artif. Neural Netw., 2011, pp. 52–59.
[32] G. E. Dahl, T. N. Sainath, and G. E. Hinton, ‘‘Improving deep neu-ral networks for LVCSR using rectified linear units and dropout,’’ inProc. IEEE Int. Conf. Acoust., Speech Signal Process., May 2013,pp. 8609–8613.
[33] S. Hochreiter and J. Schmidhuber, ‘‘Long short-term memory,’’ NeuralComput., vol. 9, no. 8, pp. 1735–1780, 1997.
[34] Y. Bengio, P. Simard, and P. Frasconi, ‘‘Learning long-term dependencieswith gradient descent is difficult,’’ IEEE Trans. Neural Netw., vol. 5, no. 2,pp. 157–166, Mar. 1994.
[35] T. Lin, T. Guo, and K. Aberer, ‘‘Hybrid neural networks for learning thetrend in time series,’’ in Proc. 26th Int. Joint Conf. Artif. Intell., Aug. 2017,pp. 2273–2279.
YINGXUAN CHEN received the B.Eng. degreein computer science and technology from NorthChina Electric Power University, in 2017. She iscurrently pursuing theM.S. degree with the Schoolof Computer Science and Engineering, SouthChina University of Technology. Her researchinterests include deep learning and machinelearning.
WEIWEI LIN received the B.S. and M.S. degreesfrom Nanchang University, in 2001 and 2004,respectively, and the Ph.D. degree in computerapplication from the South China University ofTechnology, in 2007, where he is currently a Pro-fessor with the School of Computer Science andEngineering. He has published more than 80 arti-cles in refereed journals and conference proceed-ings. His research interests include distributedsystems, cloud computing, big data computing,
and AI application technologies. He is a Senior Member of CCF.
JAMES Z. WANG received the B.S. and M.Sdegrees in computer science from the Universityof Science and Technology of China and the Ph.D.degree in computer science from the University ofCentral Florida. He is currently a Professor withthe School of Computing, Clemson University,SC, USA. His research interests include storagenetworks, database systems, distributed systems,cloud computing, and multimedia technologies.He is a Senior Member of ACM.
148058 VOLUME 7, 2019


![Techniques of Trend Analysis for Monthly Water Quality Data...trend in time has received considerable attention in the last decade (see, for example, Wolman [1971], Steele et al. [1974],](https://static.fdocuments.us/doc/165x107/5f09d7537e708231d428bf67/techniques-of-trend-analysis-for-monthly-water-quality-trend-in-time-has-received.jpg)