A discussion on the control of grading machine settings ... · A discussion on the control of...
34
A discussion on the control A discussion on the control of grading machine settings of grading machine settings with regard to EN 14081 with regard to EN 14081 Markus Deublein COST E53 - Meeting WG 3 BFH Hamburg, Germany 14/15 th May 2007 Foto: Michael Meuter / LIGNUM Jochen Köhler René Steiger
-
Upload
nguyenngoc -
Category
Documents
-
view
216 -
download
0
Transcript of A discussion on the control of grading machine settings ... · A discussion on the control of...

A discussion on the control A discussion on the control of grading machine settings of grading machine settings with regard to EN 14081with regard to EN 14081
Markus Deublein
COST E53
- Meeting WG 3
BFH Hamburg, Germany 14/15th
May 2007
Foto
: M
ichae
l M
eute
r/
LIG
NU
M
Jochen Köhler
René
Steiger
[ 2 ]swiss
project
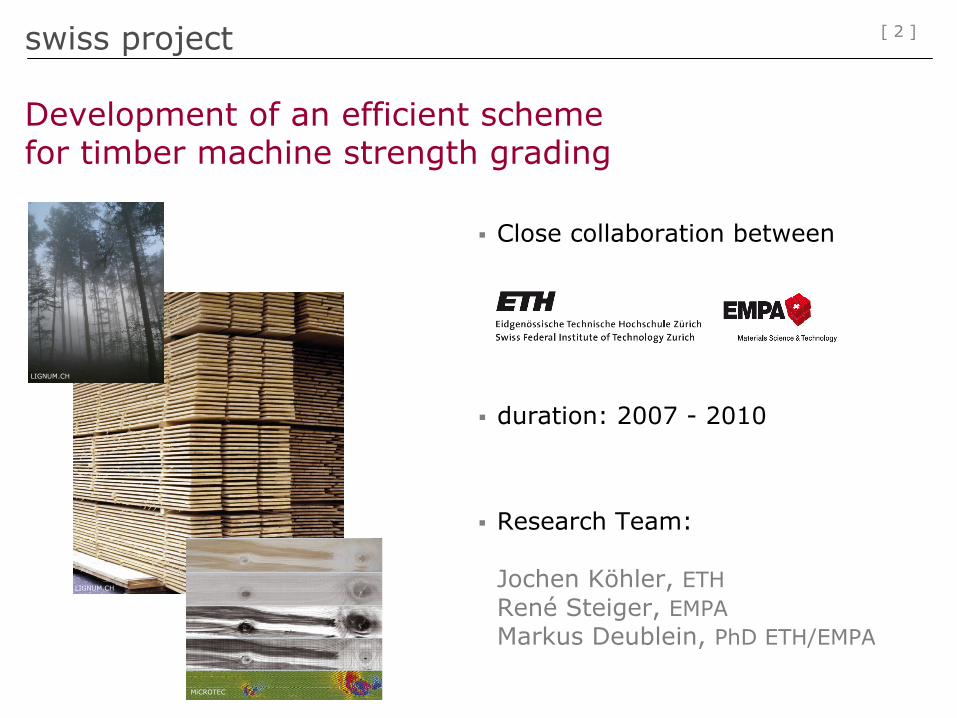
Development of an efficient scheme for timber machine strength grading
Close collaboration between
duration: 2007 - 2010
Research Team:
Jochen Köhler, ETHRené Steiger, EMPAMarkus Deublein, PhD ETH/EMPA
MiCROTEC
LIGNUM.CH
LIGNUM.CH

[ 3 ]introduction
Forestry
Harvesting Sawmill
Timber
Grading
Graded
Timber
Material
Building Codes and Regulations
Structural
Design
Timber
Research
Code Authorities
Reliability
based
Code Calibration
Grading
Rules
Extended
Requirements:
-
probabilistic
models
for
timber
material properties
Derived
Requirements:
-
sufficient
strength
-
sufficient
stiffness
- …

[ 4 ]outline
Control method given in EN14081
Alternative approach: Probabilistic modeling of timber material properties
Conclusions
[ 5 ]EN14081
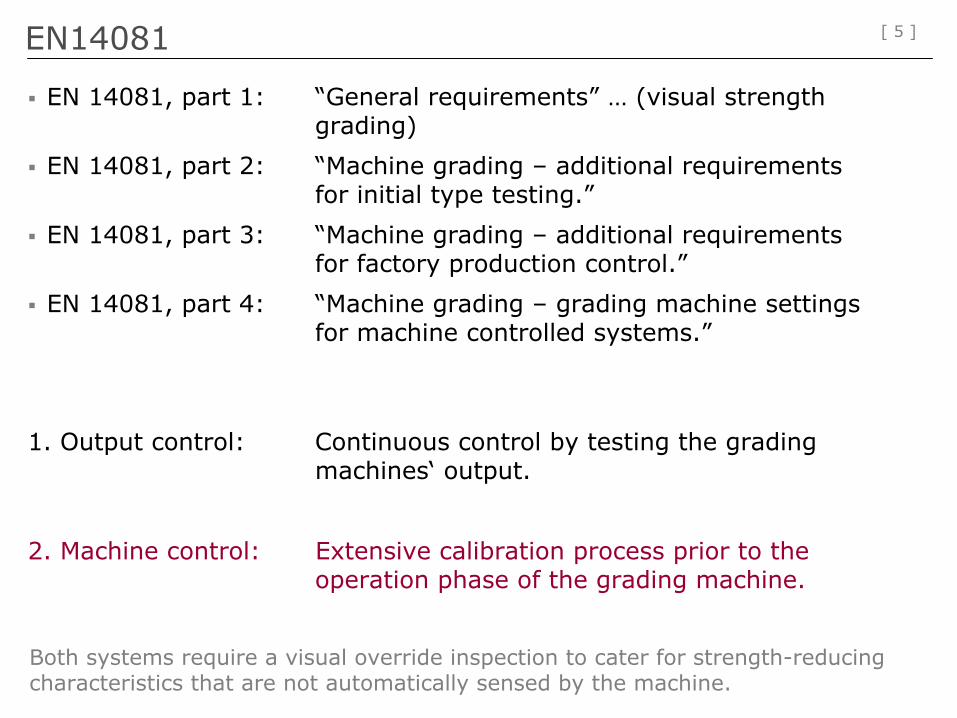
EN 14081, part 1: “General requirements” … (visual strength grading)
EN 14081, part 2: “Machine grading – additional requirements for initial type testing.”
EN 14081, part 3: “Machine grading – additional requirements for factory production control.”
EN 14081, part 4: “Machine grading – grading machine settings for machine controlled systems.”
1. Output control: Continuous control by testing the grading machines‘
output.
2. Machine control: Extensive calibration process prior to the operation phase of the grading machine.
Both systems require a visual override inspection to cater for strength-reducing characteristics that are not automatically sensed by the machine.
[ 6 ]EN14081 –
machine control
Related and important standards
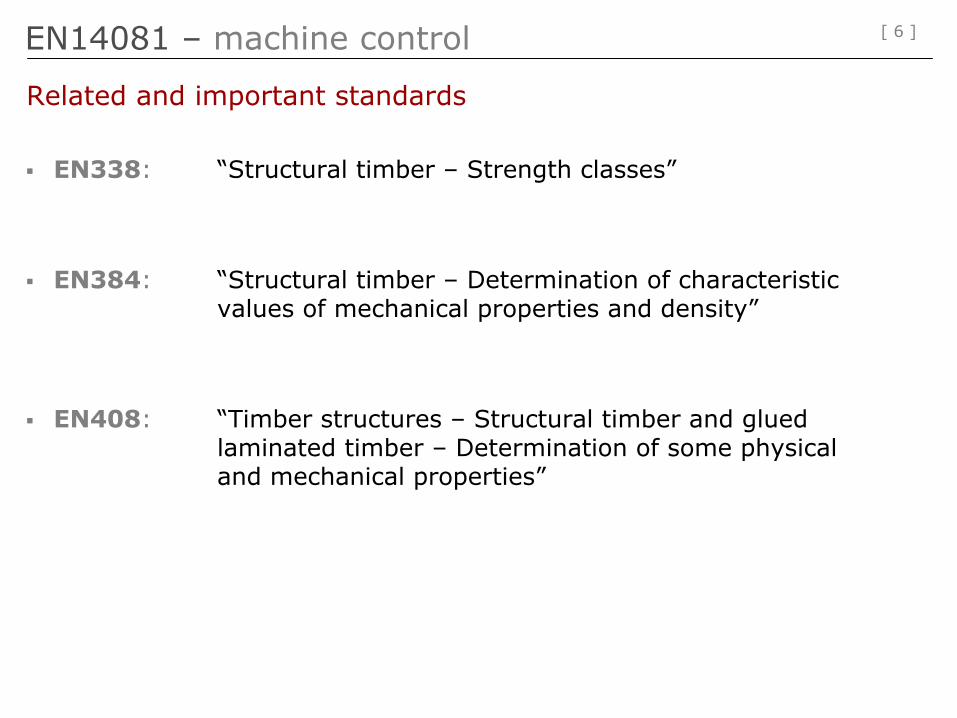
EN338: “Structural timber – Strength classes”
EN384: “Structural timber – Determination of characteristic values of mechanical properties and density”
EN408: “Timber structures – Structural timber and glued laminated timber – Determination of some physical and mechanical properties”

[ 7 ]
Production
Settings
Assessment of production settings
Applied GradingStrategy (settings)
Assigned Grades
Fulfills criterion(Cost matrix)
no
yes
EN14081 –
machine control
Indicating Property
Optimum Grades
Sample Data

[ 8 ]
Optimum grade
EN14081 –
machine control
[ 9 ]EN14081 –
machine control
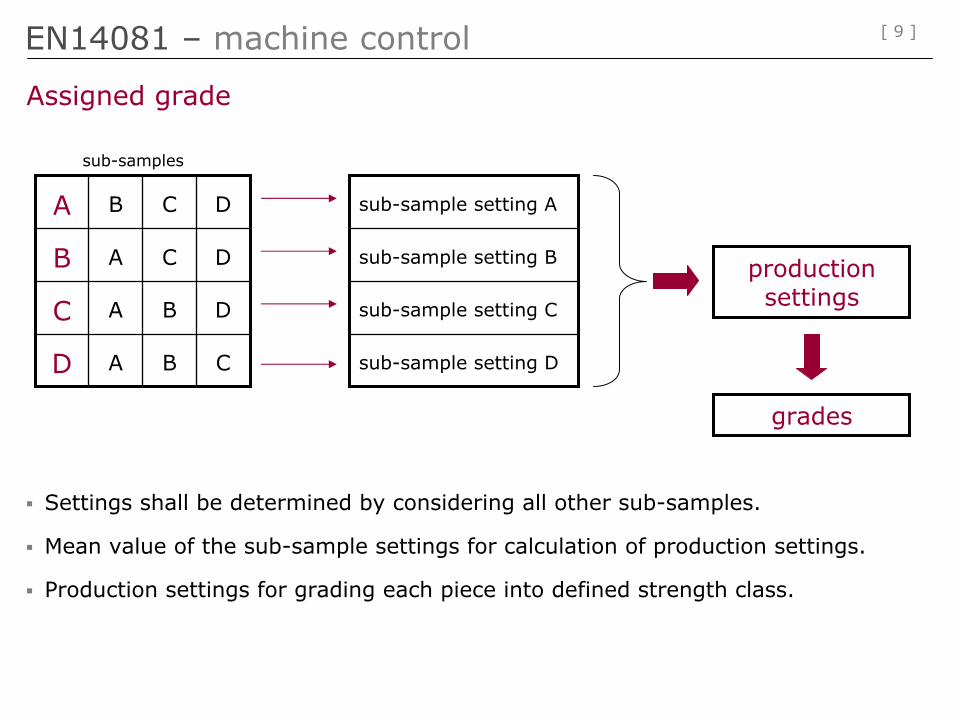
Assigned grade
Settings shall be determined by considering all other sub-samples.
Mean value of the sub-sample settings for calculation of production settings.
Production settings for grading each piece into defined strength class.
A B C D
B A C D
C A B D
D A B C
sub-sample
setting
A
sub-sample
setting
B
sub-sample
setting
C
sub-sample
setting
D
production
settings
grades
sub-samples
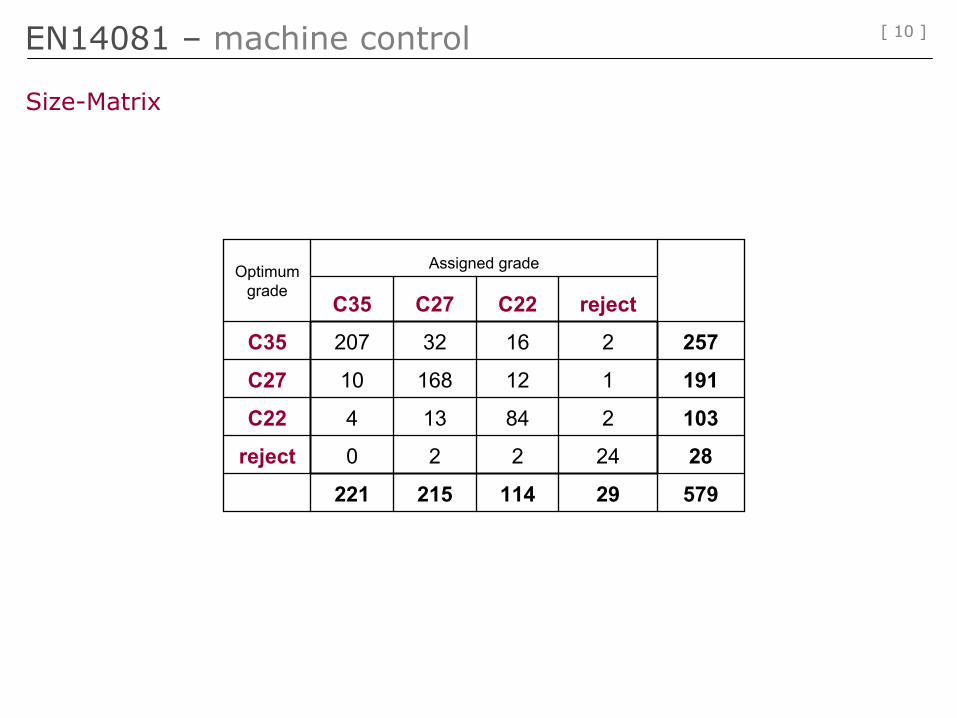
[ 10 ]EN14081 –
machine control
Optimum
grade
Assigned grade
C35 C27 C22 reject
C35 207 32 16 2 257
C27 10 168 12 1 191
C22 4 13 84 2 103
reject 0 2 2 24 28
221 215 114 29 579
Size-Matrix
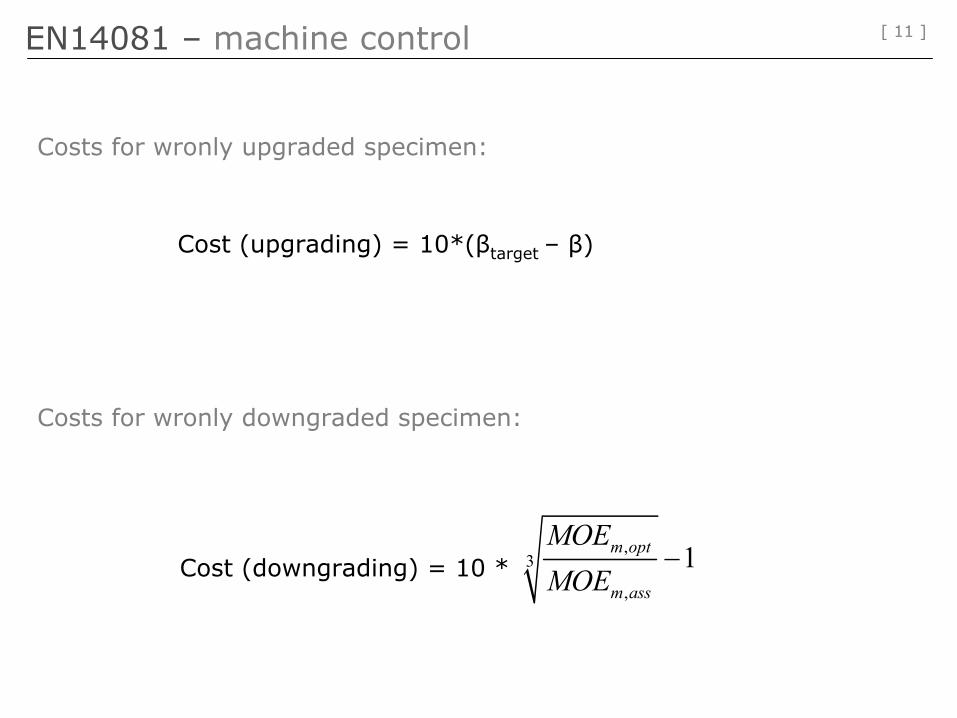
[ 11 ]EN14081 –
machine control
Cost
(upgrading) = 10*(βtarget
–
β)
,3
,
1m opt
m ass
MOEMOE
−Cost
(downgrading) = 10 *
Costs
for
wronly
upgraded
specimen:
Costs
for
wronly
downgraded
specimen:

[ 12 ]EN14081 –
machine control
Assigned
gradeOptimum
grade
Elementary
cost
matrix
given
in EN14081
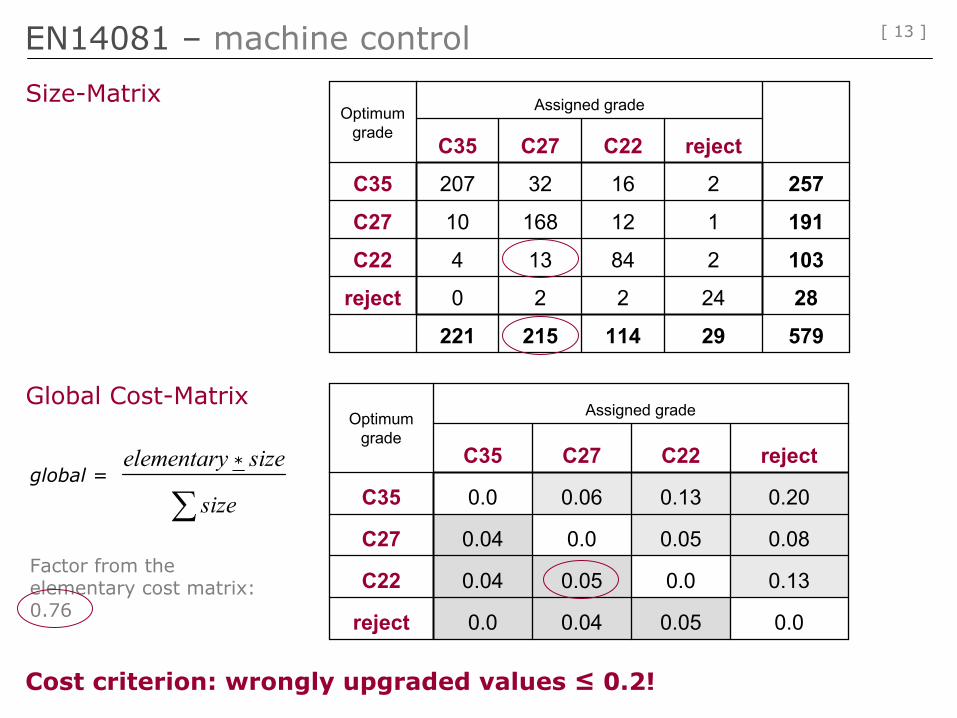
[ 13 ]EN14081 –
machine control
Optimum
grade
Assigned grade
C35 C27 C22 reject
C35 207 32 16 2 257
C27 10 168 12 1 191
C22 4 13 84 2 103
reject 0 2 2 24 28
221 215 114 29 579
Optimum
grade
Assigned grade
C35 C27 C22 reject
C35 0.0 0.06 0.13 0.20
C27 0.04 0.0 0.05 0.08
C22 0.04 0.05 0.0 0.13
reject 0.0 0.04 0.05 0.0
Global Cost-Matrix
Size-Matrix
_elementary size
size∑global =
Factor
from
the
elementary
cost
matrix: 0.76
*
Cost
criterion: wrongly
upgraded
values
≤
0.2!
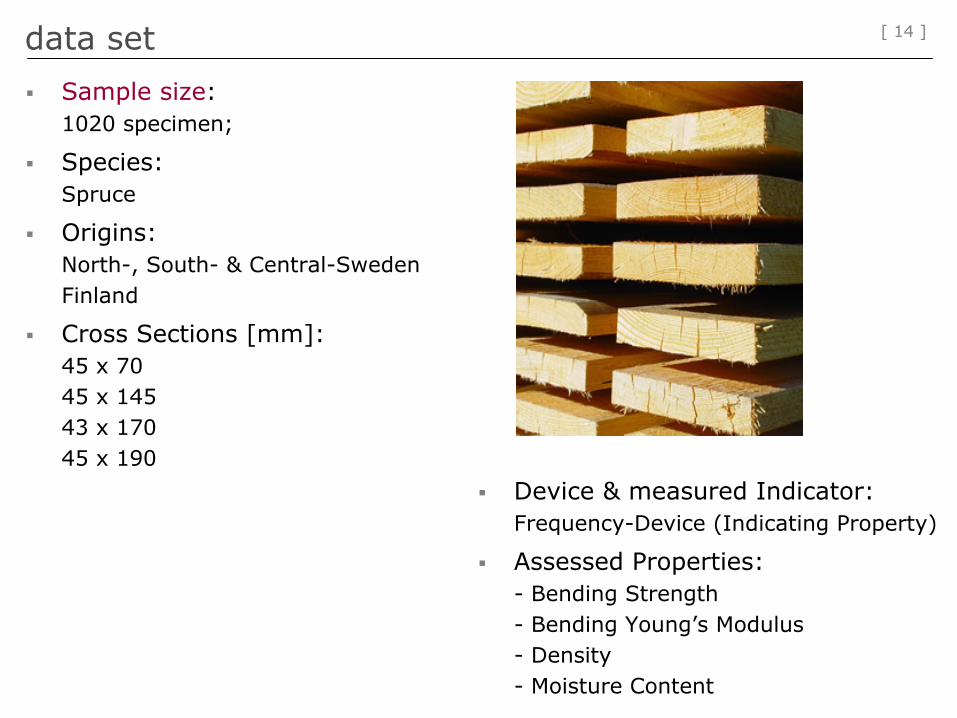
[ 14 ]data set
Sample size:1020 specimen;
Species:Spruce
Origins:North-, South- & Central-SwedenFinland
Cross Sections [mm]: 45 x 7045 x 14543 x 17045 x 190
Device & measured Indicator: Frequency-Device (Indicating Property)
Assessed Properties:- Bending Strength- Bending Young’s Modulus- Density- Moisture Content

[ 15 ]example
-
material properties
n = 152 n = 199 n = 518 n = 151 n = 1020
Bending strength
0
0.1
0.2
0.3
0.4
0.5
0.6
0.7
0.8
0.9
1
1.1
0 10 20 30 40 50 60 70 80 90 100
bending strength [Mpa]
cum
ulat
ive
dist
ribu
tion
func
tion
north sweden south sweden central sweden finland model_total sample

[ 16 ]example
-
material properties
n = 152 n = 199 n = 518 n = 151 n = 1020
Modulus
of elasticity
0
0.1
0.2
0.3
0.4
0.5
0.6
0.7
0.8
0.9
1
1.1
0 5000 10000 15000 20000 25000
modulus of elasticity [Mpa]
cum
ulat
ive
dist
ribu
tion
func
tion
north sweden south sweden central sweden finland model_total sample
[ 17 ]example
-
material properties
n = 152 n = 199 n = 518 n = 151 n = 1020
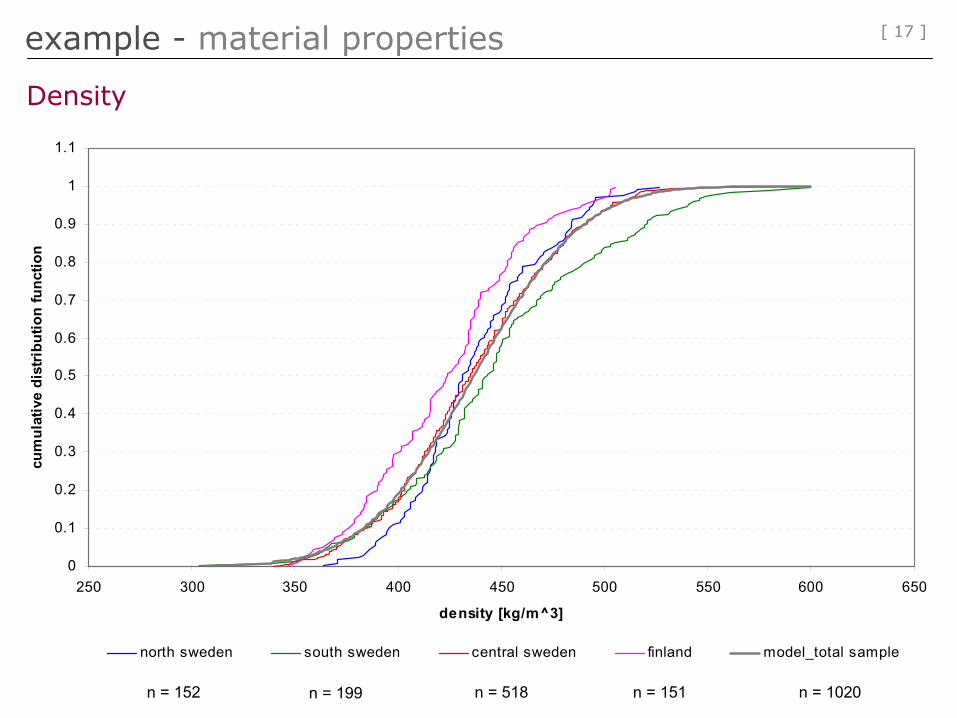
Density
0
0.1
0.2
0.3
0.4
0.5
0.6
0.7
0.8
0.9
1
1.1
250 300 350 400 450 500 550 600 650
density [kg/m^3]
cum
ulat
ive
dist
ribu
tion
func
tion
north sweden south sweden central sweden finland model_total sample

[ 18 ]results
–
EN14081
IP yield strength MOE density
C30 ≥
7000 475 31.8 14775 380
C24 < 7000 ≥
6400295 26.3 11948 369
C14 < 6400 ≥
4300249 17.8 9873 354
reject <4300 1 12.2* 6375* 367*
*=minimum value
Bending strength Modulus
of elasticity Density
C30 30 12.000 380
C24 24 11.000 350
C14 14 7000 290
Characteristic
values
given
in EN338
Characteristic
values
of the
grades according
to EN14081 (n=1020)
Production settings and characteristic values

[ 19 ]outline
Control method given in EN14081
Alternative approach: Probabilistic modeling of timber material properties
Conclusions
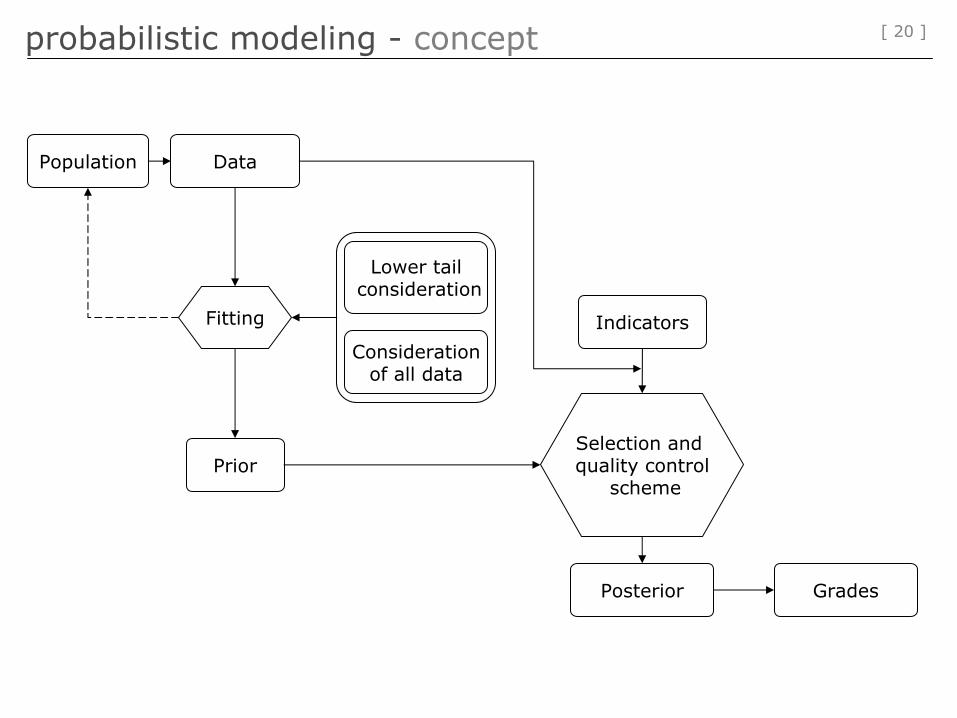
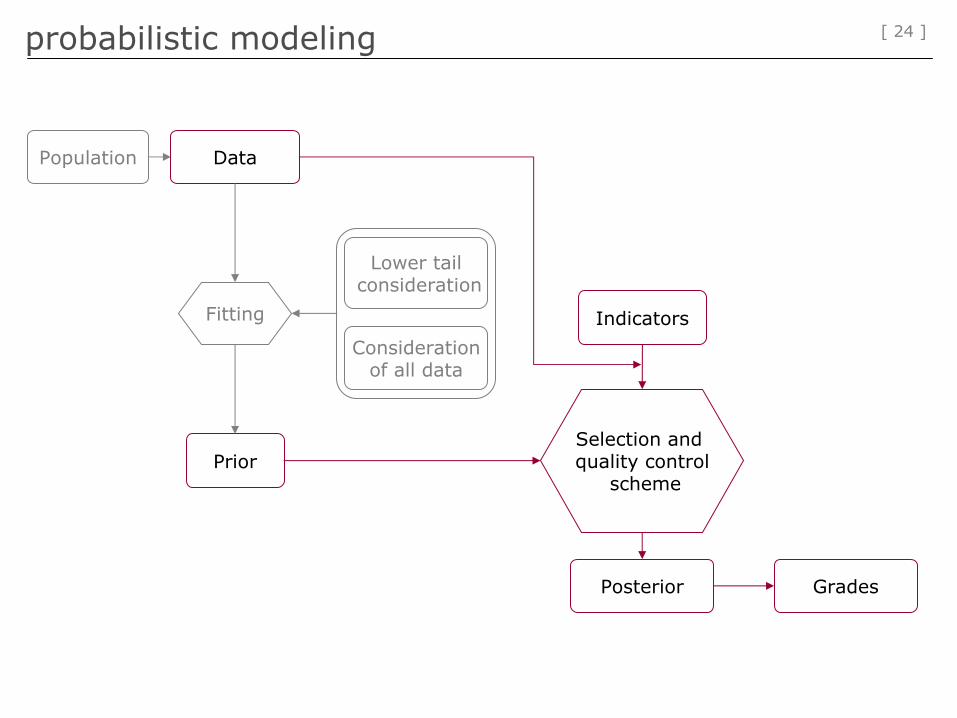
[ 20 ]probabilistic
modeling
-
concept
Data
Fitting
PriorSelection
and quality
controlscheme
Posterior
Lower
tailconsideration
Considerationof all data
Indicators
Population
Grades
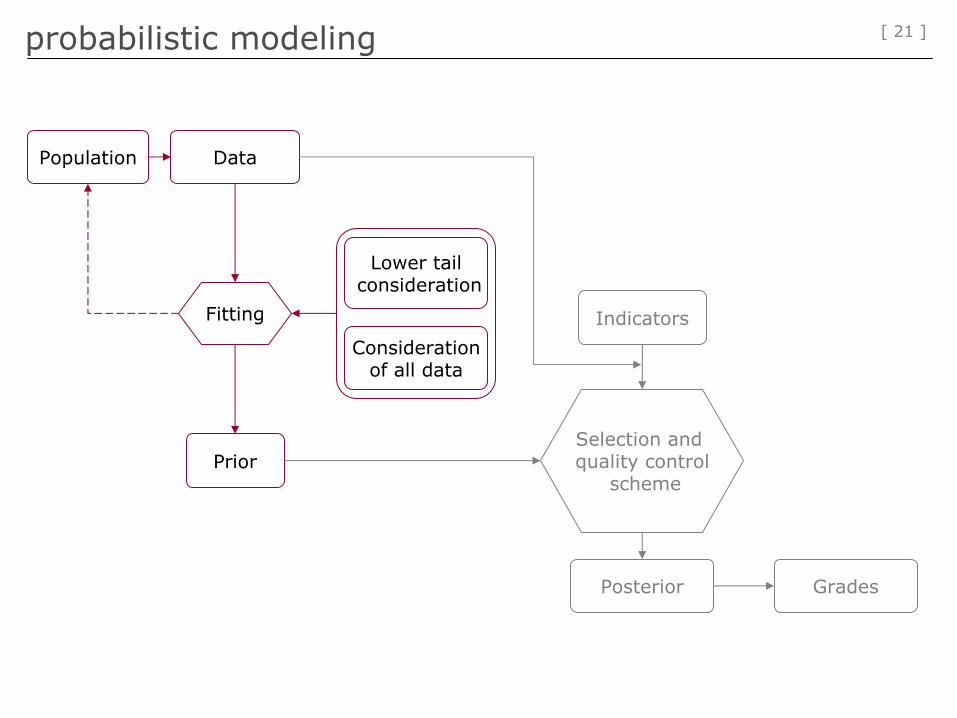
[ 21 ]probabilistic
modeling
Data
Fitting
PriorSelection
and quality
controlscheme
Posterior
Lower
tailconsideration
Considerationof all data
Indicators
Population
Grades
[ 22 ]
0
0.2
0.4
0.6
0.8
1
1.2
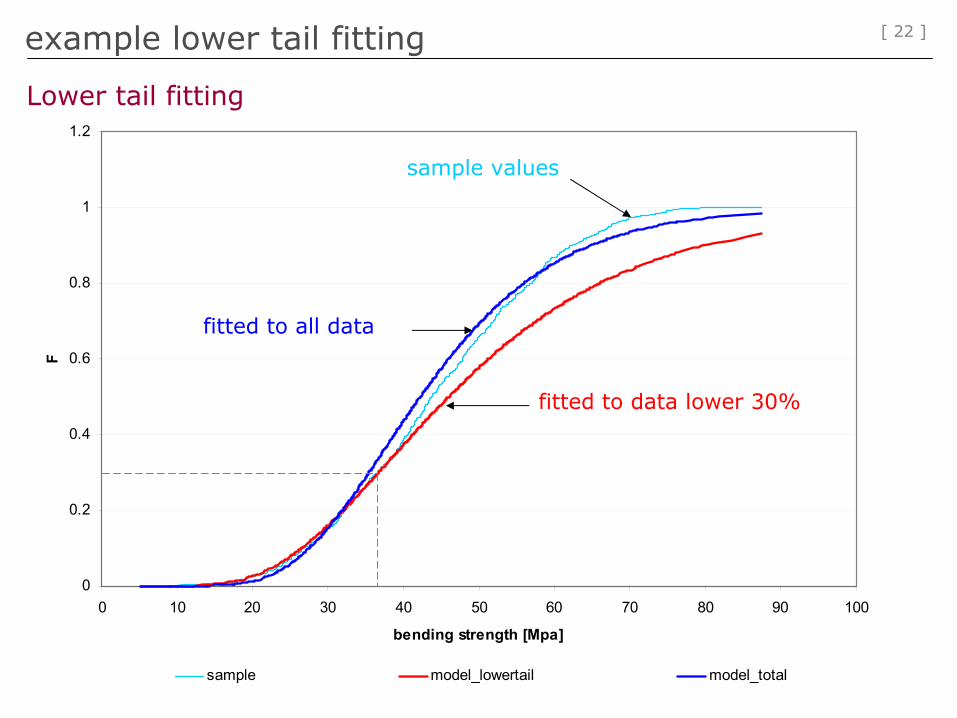
0 10 20 30 40 50 60 70 80 90 100
bending strength [Mpa]
F
sample model_lowertail model_total
example
lower
tail
fitting
Lower
tail
fitting
fitted
to data
lower
30%
fitted
to all data
sample
values

[ 23 ]
0
0.05
0.1
0.15
0.2
0.25
0.3
0.35
0.4
0.45
0.5
0 5 10 15 20 25 30 35 40 45 50
bending strength [Mpa]
F
sam ple m odel_lowertail m odel_total
example
lower
tail
fitting
Lower
tail
fitting
–
larger scale
fitted
to data
lower
30%
fitted
to all data
sample
values
[ 24 ]probabilistic
modeling
Data
Fitting
PriorSelection
and quality
controlscheme
Posterior
Lower
tailconsideration
Considerationof all data
Indicators
Population
Grades

[ 25 ]probabilistic
modeling
–
regression
analysis
3000
4000
5000
6000
7000
8000
9000
10000
0 20 40 60 80 100
bending
strength
[Mpa]
indic
atin
gpro
per
ty[-
]
n = 1020
εσ +⋅+= CaaI 10
Regression coefficients Normal distributed, with
µε
=0 and σε

[ 26 ]probabilistic
modeling
–
probability
of acceptance
An acceptance criteria may be formulated in form of
With the information from the regression analysis we assess the probability of acceptance P(AC
|σC
) by
{ }ULC bIbA ≤≤=where bL
and
bU
are lower and upper bounds for the Indicator of a particular grade.
)()( 10 UCLCC baabPAP ≤+⋅+≤= εσσ
2000
4000
6000
8000
10000
12000
14000
10 20 30 40 50 60 70 80 90
Property of Interest
Indi
cato
r
bL
bU

[ 27 ]probabilistic
modeling
–
Bayes
rule
)()(1)( CCCCC APfc
AfCC
σσσ σσ ⋅′=′′
Posterior
distribution
function
with
application
of the
Bayes
rule.

[ 28 ]
0
0.02
0.04
0.06
0 40 80 120 160Bending Strength [MPa]
Prob
abili
ty D
ensi
ty
probabilistic
modeling
–
Bayes
rule
)()(1)( CCCCC APfc
AfCC
σσσ σσ ⋅′=′′
Prior
Prior

[ 29 ]probabilistic
modeling
–
Bayes
rule
Prior Likelihood
0
0.02
0.04
0.06
0 40 80 120 160Bending Strength [MPa]
Prob
abili
ty D
ensi
ty
Prior Likelihood
)()(1)( CCCCC APfc
AfCC
σσσ σσ ⋅′=′′

[ 30 ]
0
0.02
0.04
0.06
0 40 80 120 160Bending Strength [MPa]
Prob
abili
ty D
ensi
ty
probabilistic
modeling
–
Bayes
rule
Prior Likelihood
Normalizing factor
Posterior
Prior Likelihood
Posterior
)()(1)( CCCCC APfc
AfCC
σσσ σσ ⋅′=′′
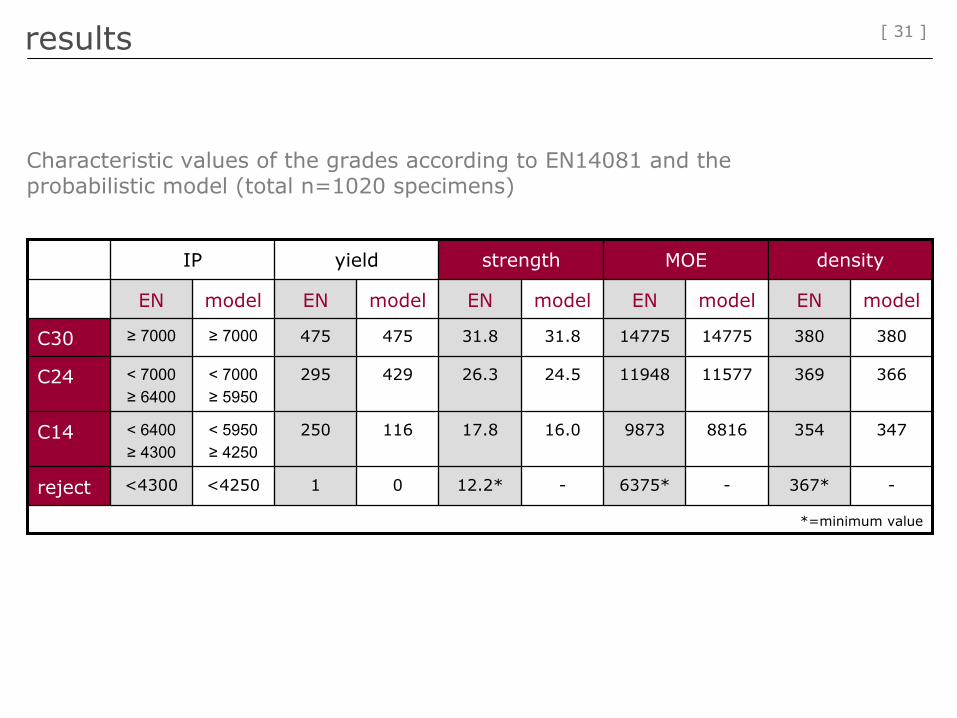
[ 31 ]results
IP yield strength MOE density
EN model EN model EN model EN model EN model
C30 ≥
7000 ≥
7000 475 475 31.8 31.8 14775 14775 380 380
C24 < 7000 ≥
6400< 7000 ≥
5950295 429 26.3 24.5 11948 11577 369 366
C14 < 6400 ≥
4300< 5950 ≥
4250250 116 17.8 16.0 9873 8816 354 347
reject <4300 <4250 1 0 12.2* - 6375* - 367* -
*=minimum value
Characteristic values of the grades according to EN14081 and the
probabilistic model (total n=1020 specimens)

[ 32 ]outline
Control method given in EN14081
Alternative approach: Probabilistic modeling of timber material properties
Conclusions
[ 33 ]
The probabilistic approach does not only concentrate on the test sample
but rather allows for a model extrapolation to the whole population.
It is a central requirement that timber material properties can be probabilistically assessed.
The grading procedure has to be considered in probabilistic modeling.
Current grading practice does not allow an explicit consideration of the grading procedure in probabilistic modeling.
The probabilistic approach is more feasible and consistent.
Uncertainties have not to be calculated afterwards (by cost-matrices) but are included in the model.
Alternative and more straight forward methods exist and it should be discussed how future codes and regulations could be advanced.
Summary