
A DETERMINISTIC APPROACH FOR CHARACTERIZING WAVE …
36
Naval Surface Warfare Center Carderock Division West Bethesda, MD 20817-5700 NSWCCD-23-TM-2012/05 January 2012 Ship Systems Integration and Design Department Technical Memorandum A DETERMINISTIC APPROACH FOR CHARACTERIZING WAVE IMPACT RESPONSE MOTIONS OF A HIGH-SPEED PLANING HULL by Michael R. Riley The Columbia Group Kelly D. Haupt and Donald R. Jacobson Combatant Craft Division (23) DISTRIBUTION STATEMENT A: Approved for public release; distribution is unlimited. NSWCCD-23-TM-2012/05 A Deterministic Approach for Characterizing Wave Impact Response Motions of a High-Speed Planing Hull
Transcript of A DETERMINISTIC APPROACH FOR CHARACTERIZING WAVE …

Naval Surface Warfare Center Carderock Division West Bethesda, MD 20817-5700 NSWCCD-23-TM-2012/05 January 2012
Ship Systems Integration and Design Department Technical Memorandum A DETERMINISTIC APPROACH FOR CHARACTERIZING WAVE IMPACT RESPONSE MOTIONS OF A HIGH-SPEED PLANING HULL by Michael R. Riley The Columbia Group Kelly D. Haupt and Donald R. Jacobson Combatant Craft Division (23)
DISTRIBUTION STATEMENT A: Approved for public release; distribution is unlimited.
NSW
CC
D-2
3-TM
-201
2/05
A D
eter
min
istic
App
roac
h fo
r Cha
ract
eriz
ing
Wav
e Im
pact
Res
pons
e M
otio
ns o
f a H
igh-
Spe
ed
Pla
ning
Hul
l

A DETERMINISTIC APPROACH FOR CHARACTERIZING WAVE IMPACT RESPONSE MOTIONS OF A HIGH-SPEED
PLANING HULL
NSWCCD-23-TM-2012/05
Post-Release Revisions
Revision Reviewer/ Approver
Date Change Description
Page, Section

i
REPORT DOCUMENTATION PAGE Form Approved
OMB No. 0704-0188 Public reporting burden for this collection of information is estimated to average 1 hour per response, including the time for reviewing instructions, searching existing data sources, gathering and maintaining the data needed, and completing and reviewing this collection of information. Send comments regarding this burden estimate or any other aspect of this collection of information, including suggestions for reducing this burden to Department of Defense, Washington Headquarters Services, Directorate for Information Operations and Reports (0704-0188), 1215 Jefferson Davis Highway, Suite 1204, Arlington, VA 22202-4302. Respondents should be aware that notwithstanding any other provision of law, no person shall be subject to any penalty for failing to comply with a collection of information if it does not display a currently valid OMB control number. PLEASE DO NOT RETURN YOUR FORM TO THE ABOVE ADDRESS. 1. REPORT DATE (DD-MM-YYYY) 31-01-2012
2. REPORT TYPE Final
3. DATES COVERED (From - To) Feb 2009 – Dec 2011
4. TITLE AND SUBTITLE A Deterministic Approach for Characterizing Wave Impact Response Motions of a High-Speed Planing Hull
5a. CONTRACT NUMBER
5b. GRANT NUMBER
5c. PROGRAM ELEMENT NUMBER
6. AUTHOR(S) Michael R. Riley, Kelly D. Haupt, Donald R. Jacobson
5d. PROJECT NUMBER
5e. TASK NUMBER
5f. WORK UNIT NUMBER
7. PERFORMING ORGANIZATION NAME(S) AND ADDRESS(ES)
8. PERFORMING ORGANIZATION REPORT NUMBER
NAVSEA Carderock Surface Warfare Center Division Combatant Craft Division 2600 Tarawa Court, #303 Virginia Beach, Virginia 23459-3239
NSWCCD-23-TM-2012/05
9. SPONSORING / MONITORING AGENCY NAME(S) AND ADDRESS(ES) 10. SPONSOR/MONITOR’S ACRONYM(S) Office of Naval Research Sea Warfare Applications Division 875 North Randolph Street, Arlington, VA 22203-1995
ONR 11. SPONSOR/MONITOR’S REPORT
12. DISTRIBUTION / AVAILABILITY STATEMENT DISTRIBUTION STATEMENT A: Approved for public release; distribution is unlimited.
13. SUPPLEMENTARY NOTES
14. ABSTRACT This report presents a new deterministic approach to analyzing wave impact data for high speed planning hulls. Full scale data is presented that illustrates how individual wave encounters may be defined and categorized according to impact sequence of events, and that the peak accelerations may vary linearly with defined parameters for subsets of wave slam types. The report builds on lessons learned from historical stochastic analysis methods, and provides a new analysis process that enhances the understanding of key elements associated with craft seaworthiness, including hull design loads, component ruggedness, and crew or passenger comfort and safety.
15. SUBJECT TERMS Peak acceleration Wave slam Planing hull Data analysis
16. SECURITY CLASSIFICATION OF:
17. LIMITATION OF ABSTRACT
18. NUMBER OF PAGES
19a. NAME OF RESPONSIBLE PERSON Kelly D. Haupt
a. REPORT Unclassified
b. ABSTRACT Unclassified
c. THIS PAGE Unclassified
See 12.
35
19b. TELEPHONE NUMBER (include area code) 757-462-4136 Standard Form 298 (Rev. 8-98)
Prescribed by ANSI Std. Z39.18

NSWCCD-23-TM-2012/05
ii
This page intentionally left blank

NSWCCD-23-TM-2012/05
iii
Contents Page
Figures ........................................................................................................................................... iv
Tables ............................................................................................................................................ iv
Administrative Information ..........................................................................................................v
Acknowledgements ........................................................................................................................v
Summary .........................................................................................................................................1
Introduction ....................................................................................................................................1
Background ............................................................................................................................ 1
Deterministic Analysis Approach .......................................................................................... 2
Typical Acceleration Data ..................................................................................................... 3
Characteristics of Individual Wave Slams ..................................................................................5
Individual Wave Slam Events................................................................................................ 5
Sequence of Events ................................................................................................................ 6
Wave Slam Parameters .......................................................................................................... 7
Type Alpha Slam ................................................................................................................. 10
Type Bravo Slam ................................................................................................................. 12
Type Charlie Slam ............................................................................................................... 12
Peak Vertical Acceleration Trends.............................................................................................16
Linear Regression ................................................................................................................ 16
Wave Slam Pulse Shapes ..................................................................................................... 17
Scaling Relationship ............................................................................................................ 17
Parametric Trends ................................................................................................................ 18
Observations .................................................................................................................................22
Conclusions ...................................................................................................................................23
Symbols, Abbreviations, and Acronyms ....................................................................................24
References .....................................................................................................................................25
Distribution ...................................................................................................................................26

NSWCCD-23-TM-2012/05
iv
Figures Page
Figure 1. Vertical Acceleration at LCG of a 36 Foot Craft .............................................................3
Figure 2. Planing Craft Peak Acceleration Histogram .....................................................................4
Figure 3. Peak Accelerations Plotted Largest to Smallest ...............................................................4
Figure 4. Cumulative Distribution Plot with A1/N Average Values .................................................4
Figure 5. Individual Wave Encounters and Wave Slam Events ......................................................5
Figure 6. Wave Slam Sequence of Events .......................................................................................7
Figure 7. Wave Slam Parameters .....................................................................................................8
Figure 8. Examples of AX and AZT Values ......................................................................................9
Figure 9. Angular Acceleration at the LCG ...................................................................................10
Figure 10. Type Alpha Slam Sequence of Events .........................................................................11
Figure 11. Type Alpha Precursor Non-Slam Event .......................................................................11
Figure 12. Type Bravo Wave Slam Sequence of Events ...............................................................12
Figure 13. Type Charlie Wave Slam Sequence of Events .............................................................13
Figure 14. Peak Vertical Acceleration Linear Trends ...................................................................16
Figure 15. Normalized Wave Slam Pulse Shapes ..........................................................................17
Figure 16. AX versus AZT Wave Slam Parameters .........................................................................18
Figure 17. Type Alpha Wave Slam Trends ...................................................................................19
Figure 18. Type Bravo and Charlie Wave Slam Trends ................................................................20
Figure 19. Impact Energy Partitioning ...........................................................................................21
Tables Page
Table 1. Wave Slam Characteristics ..............................................................................................14
Table 2. Wave Slam Parameters ....................................................................................................15

NSWCCD-23-TM-2012/05
v
Administrative Information The work described in this report was performed by the Combatant Craft Division (Code
23) of the Ship Systems Integration and Design Department at the Naval Surface Warfare Center, Carderock Division (NSWCCD). This effort was sponsored by the Office of Naval Research, Sea Warfare Applications Division (Code 333), Arlington, VA, and funded under document numbers N0001408WX20581 and N001408WX20619.
Acknowledgements The authors would like to thank Dr. Peter Paul Rispin, Office of Naval Research, for
directing the investigation of combatant craft wave-slam physics and dynamic analysis response methodologies, and Mr. Dan Sheridan, DJS Associates, Inc., for his insights and management oversight. Dr. Timothy Coats, Director of Research and Development, Combatant Craft Division, was also instrumental in leading the analysis project, and his earlier work established a solid foundation for continuing work.

NSWCCD-23-TM-2012/05
vi
This page intentionally left blank
NSWCCD-23-TM-2012/05
1
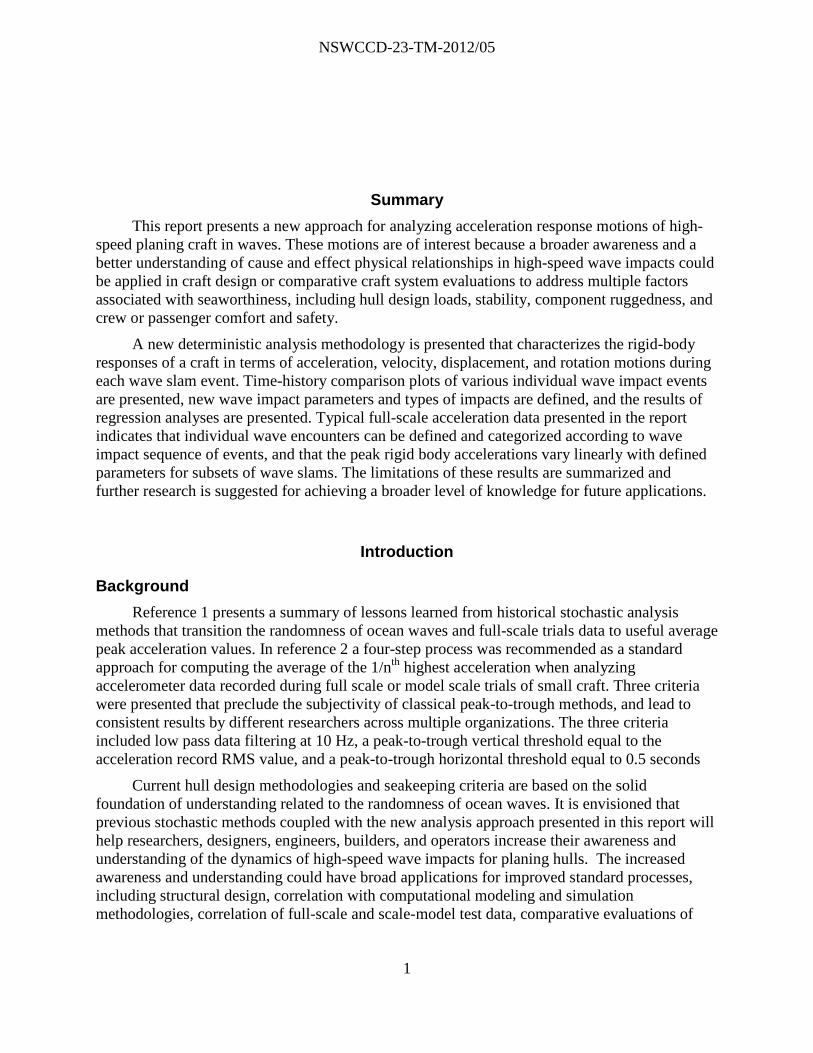
Summary This report presents a new approach for analyzing acceleration response motions of high-
speed planing craft in waves. These motions are of interest because a broader awareness and a better understanding of cause and effect physical relationships in high-speed wave impacts could be applied in craft design or comparative craft system evaluations to address multiple factors associated with seaworthiness, including hull design loads, stability, component ruggedness, and crew or passenger comfort and safety.
A new deterministic analysis methodology is presented that characterizes the rigid-body responses of a craft in terms of acceleration, velocity, displacement, and rotation motions during each wave slam event. Time-history comparison plots of various individual wave impact events are presented, new wave impact parameters and types of impacts are defined, and the results of regression analyses are presented. Typical full-scale acceleration data presented in the report indicates that individual wave encounters can be defined and categorized according to wave impact sequence of events, and that the peak rigid body accelerations vary linearly with defined parameters for subsets of wave slams. The limitations of these results are summarized and further research is suggested for achieving a broader level of knowledge for future applications.
Introduction
Background Reference 1 presents a summary of lessons learned from historical stochastic analysis
methods that transition the randomness of ocean waves and full-scale trials data to useful average peak acceleration values. In reference 2 a four-step process was recommended as a standard approach for computing the average of the 1/nth highest acceleration when analyzing accelerometer data recorded during full scale or model scale trials of small craft. Three criteria were presented that preclude the subjectivity of classical peak-to-trough methods, and lead to consistent results by different researchers across multiple organizations. The three criteria included low pass data filtering at 10 Hz, a peak-to-trough vertical threshold equal to the acceleration record RMS value, and a peak-to-trough horizontal threshold equal to 0.5 seconds
Current hull design methodologies and seakeeping criteria are based on the solid foundation of understanding related to the randomness of ocean waves. It is envisioned that previous stochastic methods coupled with the new analysis approach presented in this report will help researchers, designers, engineers, builders, and operators increase their awareness and understanding of the dynamics of high-speed wave impacts for planing hulls. The increased awareness and understanding could have broad applications for improved standard processes, including structural design, correlation with computational modeling and simulation methodologies, correlation of full-scale and scale-model test data, comparative evaluations of
NSWCCD-23-TM-2012/05
2
different craft, and development of criteria for improved ruggedness and personnel comfort and safety.
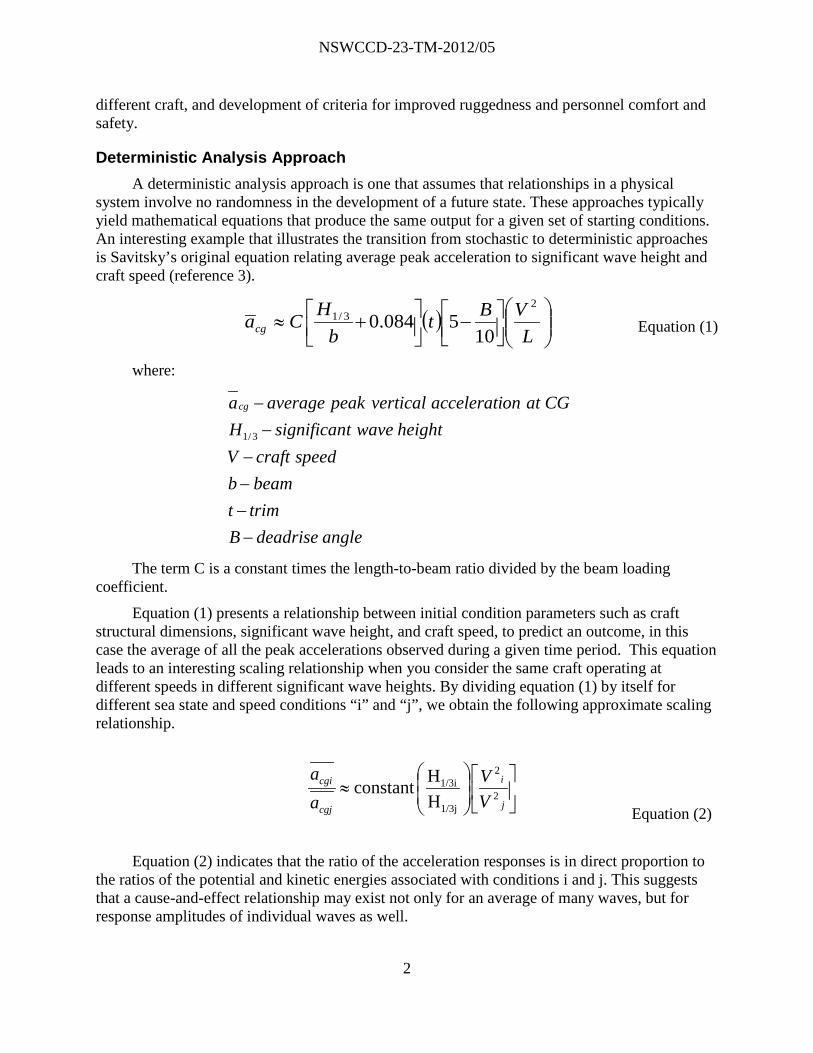
Deterministic Analysis Approach A deterministic analysis approach is one that assumes that relationships in a physical
system involve no randomness in the development of a future state. These approaches typically yield mathematical equations that produce the same output for a given set of starting conditions. An interesting example that illustrates the transition from stochastic to deterministic approaches is Savitsky’s original equation relating average peak acceleration to significant wave height and craft speed (reference 3).
( )
−
+≈
LVBt
bHCacg
23/1
105084.0 Equation (1)
where:
The term C is a constant times the length-to-beam ratio divided by the beam loading
coefficient.
Equation (1) presents a relationship between initial condition parameters such as craft structural dimensions, significant wave height, and craft speed, to predict an outcome, in this case the average of all the peak accelerations observed during a given time period. This equation leads to an interesting scaling relationship when you consider the same craft operating at different speeds in different significant wave heights. By dividing equation (1) by itself for different sea state and speed conditions “i” and “j”, we obtain the following approximate scaling relationship.
Equation (2)
Equation (2) indicates that the ratio of the acceleration responses is in direct proportion to
the ratios of the potential and kinetic energies associated with conditions i and j. This suggests that a cause-and-effect relationship may exist not only for an average of many waves, but for response amplitudes of individual waves as well.
angledeadriseBtrimtbeamb
speedcraftVheightwavetsignificanH
CGatonaccelerativerticalpeakaverageacg
−−−−−−
3/1
≈
j
i
cgj
cgi
VV
aa
2
2
1/3j
1/3i
HHconstant
NSWCCD-23-TM-2012/05
3
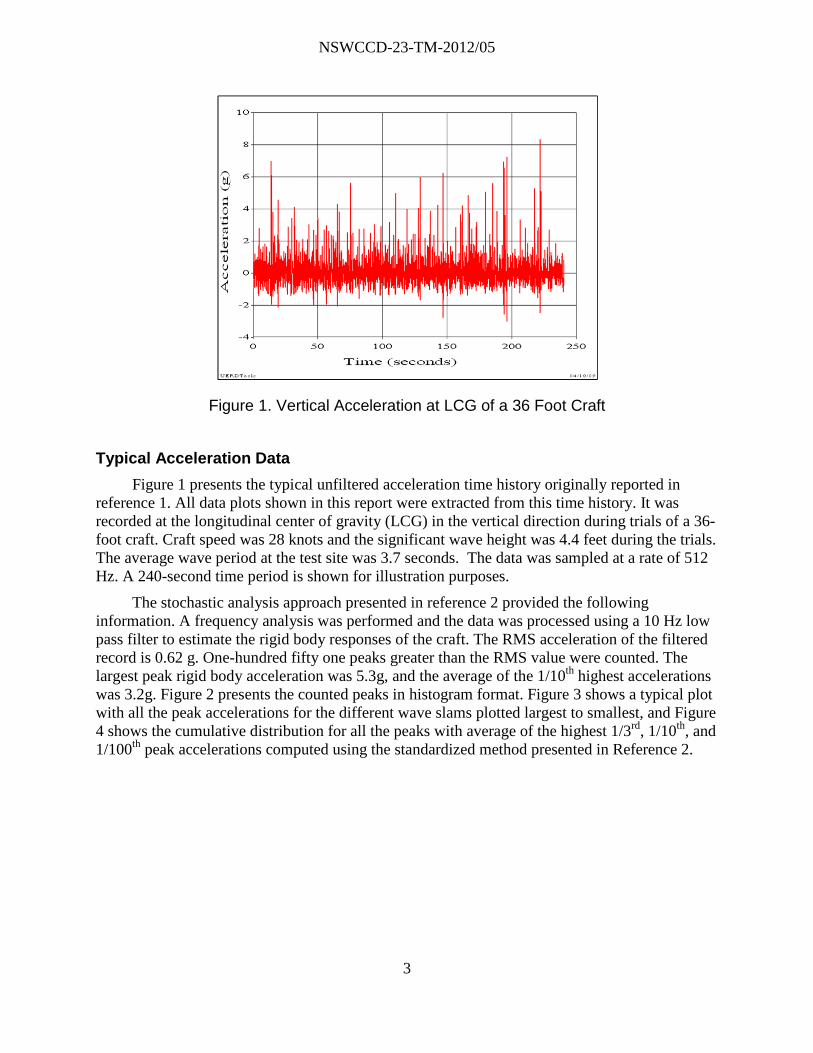
Figure 1. Vertical Acceleration at LCG of a 36 Foot Craft
Typical Acceleration Data Figure 1 presents the typical unfiltered acceleration time history originally reported in
reference 1. All data plots shown in this report were extracted from this time history. It was recorded at the longitudinal center of gravity (LCG) in the vertical direction during trials of a 36-foot craft. Craft speed was 28 knots and the significant wave height was 4.4 feet during the trials. The average wave period at the test site was 3.7 seconds. The data was sampled at a rate of 512 Hz. A 240-second time period is shown for illustration purposes.
The stochastic analysis approach presented in reference 2 provided the following information. A frequency analysis was performed and the data was processed using a 10 Hz low pass filter to estimate the rigid body responses of the craft. The RMS acceleration of the filtered record is 0.62 g. One-hundred fifty one peaks greater than the RMS value were counted. The largest peak rigid body acceleration was 5.3g, and the average of the 1/10th highest accelerations was 3.2g. Figure 2 presents the counted peaks in histogram format. Figure 3 shows a typical plot with all the peak accelerations for the different wave slams plotted largest to smallest, and Figure 4 shows the cumulative distribution for all the peaks with average of the highest 1/3rd, 1/10th, and 1/100th peak accelerations computed using the standardized method presented in Reference 2.

NSWCCD-23-TM-2012/05
4
Figure 2. Planing Craft Peak Acceleration Histogram
Figure 3. Peak Accelerations Plotted Largest to Smallest
Figure 4. Cumulative Distribution Plot with A1/N Average Values
y = -0.0458x5 + 1.2595x4 - 13.54x3 + 71.71x2 - 191.36x + 217.75
0
10
20
30
40
50
60
70
80
90
100
0.62 - 1.24g 1.24 - 1.86g 1.86 - 2.48g 2.48 - 3.1g 3.1 - 3.72g 3.72 - 4.34g 4.34 - 4.96g 4.96 - 5.68g
Acceleration Range (g)
Num
ber
of P
eaks RMS = 0.62g
y = -0.0458x5 + 1.2595x4 - 13.54x3 + 71.71x2 - 191.36x + 217.75
0
10
20
30
40
50
60
70
80
90
100
0.62 - 1.24g 1.24 - 1.86g 1.86 - 2.48g 2.48 - 3.1g 3.1 - 3.72g 3.72 - 4.34g 4.34 - 4.96g 4.96 - 5.68g
Acceleration Range (g)
Num
ber
of P
eaks RMS = 0.62g

NSWCCD-23-TM-2012/05
5
Characteristics of Individual Wave Slams
Individual Wave Slam Events A wave slam is a violent impact between a craft and an incident wave (reference 2), but not
all wave encounters necessarily result in wave slams. The term “violent” is subjective, and what may be violent or significant for one application (or one craft occupant), may not be for another. For this discussion a definition in general terms is sufficient. Figure 3 presents a 30-second segment of the 10 Hz filtered acceleration record to show numerous individual wave slams. For example, there are six wave slams observed in the figure that have peak accelerations greater than 2.0g, with numerous small amplitude peaks less than 1.0g.
The red curve in Figure 5 is the measured vertical acceleration at the LCG of the craft, and the green curve is the acceleration recorded in the longitudinal (fore-aft) direction at the same location. The amplitudes and the pulse shapes for both vertical and longitudinal responses appear to be random with little or no discernable patterns of repetition. Before pursuing a more detailed discussion of the individual pulse shapes, a review of a typical wave slam sequence of events will be beneficial.
Figure 5. Individual Wave Encounters and Wave Slam Events

NSWCCD-23-TM-2012/05
6
Sequence of Events Figure 6 illustrates the sequence of events in a typical wave slam event in the planning
regime. The top curve is one of the individual unfiltered acceleration time histories extracted from the vertical acceleration time history shown in Figure 1 for a wave slam event roughly 66 seconds from time zero. The middle curve is the velocity time history obtained by integrating the acceleration curve, and the bottom curve is the integral of the velocity to show the absolute vertical displacement of the craft at the LCG. These curves characterize the vertical rigid body motion of the craft which includes contributions from both heave and pitch responses.
At time A the minus 0.9 g vertical acceleration indicates a condition very close to a gravity free-fall phase. The relatively constant minus 0.9 g from time A to time B and the linear decrease in velocity suggests that the craft is rotating downward with the stern in the water. The drop in height from time A to B is then a combination of heave and pitch motions.
At time B the craft impacts the incident wave, the velocity reaches a minima and changes rapidly to an increasing value, and the force of the impact is seen as an almost instantaneous jump to a maximum acceleration (the beginning of the acceleration spike). In this example the peak acceleration is achieved on the order of 0.07 seconds after initial wave impact.
From time B to time C the craft continues to move down in the water, the velocity approaches zero, and the acceleration decreases rapidly toward a value of approximately 1.0 g. The decreasing acceleration is characteristic of an impact event whose initial large peak force is decreasing to an ambient value. The time period from point B to point C is on the order of 0.15 seconds.
At time C the downward motion of the craft reaches maxima, and the instantaneous velocity is zero, but forces due to buoyancy, hydrodynamic lift, and components of thrust and drag combine to produce a net positive force upward. The impact event is complete at time C and the craft motion is now dominated by wave interaction forces.
From time C to D the combined forces of buoyancy and hydrodynamic effects continue to push the craft upward, but the net force (and the acceleration) approaches zero. The hull is still in the water but gravity is rapidly overcoming forces pushing upward.
At time D gravity becomes equal to the other forces, the instantaneous acceleration is zero, and a velocity maximum is achieved.
Between time D and E the hull below the LCG rises vertically with the velocity approaching another zero point. Gravity once again dominates the other dynamic forces and at time E another peak vertical displacement is achieved, the instantaneous velocity is zero, and another wave impact sequence of events begins.
The duration of the wave slam event (i.e., the impact duration) from time B to C is roughly 0.15 seconds. From time C to D (approximately 0.45 seconds) buoyancy and hydrodynamic lift forces dominate gravity to yield an upward force (i.e., positive acceleration). From time D until the next wave encounter gravity dominates the other forces as the hull moves above its static and planing draft line.

NSWCCD-23-TM-2012/05
7
Figure 6. Wave Slam Sequence of Events
Wave Slam Parameters Previous scale-model impact testing by Chaung demonstrated that individual wave slam
events are complex dynamic interactions between a speeding craft and a moving wave with many parameters of interest, including craft speed, wave celerity, impact angle (trim, dead rise, buttock), wave slope (crest, trough, flank), and wave height (reference 4). Several of these parameters were observed to be especially helpful during close inspection of the largest

NSWCCD-23-TM-2012/05
8
amplitude peaks found in the Figure 1 acceleration record. Analysis of thirty wave slams with peak vertical accelerations greater than 2.0g identified five parameters useful for characterizing wave slam response amplitudes and pulse shapes. Figure 5 illustrates the first three. The significance of each is described in the paragraphs that follow.
The red curve in Figure 7 illustrates the vertical acceleration for a single wave slam event, and the green curve is the longitudinal acceleration (fore-aft). The peak vertical acceleration (AZ) has historical significance as the parameter used to characterize the maximum vertical response amplitude. According to Newton’s second law it is directly proportional to the maximum instantaneous load applied to the hull during the wave slam event.
The second vertical parameter shown in Figure 7 is the vertical transition acceleration (AZT) that occurs at the time when craft velocity crosses zero (point C in Figure 5). At this point in time the impact event is completed, the craft has reached its maximum downward motion, and the dominant vertical forces acting on the craft are due to wave dynamics. This value represents the transition of the acceleration curve from the wave impact period to an ambient acceleration value that characterizes the beginning of the subsequent non-impact period. In this case the vertical ambient value is dominated by wave hydrodynamics. In general AZT will be referred to as the “transition acceleration” whose amplitude depends upon the impact sequence of events. It is characteristic of the beginning of the hydrodynamic phase just after the impact event, and tends to indicate whether the impact occurred on a wave leading flank, or crest, or a trough. Larger values tend to indicate a leading flank impact, and lower values tend to indicate a wave trough impact or perhaps an impact on the back side of a wave. Among the thirty slam events with peak vertical acceleration greater than 2.0g, the magnitude of the plateau acceleration varied from 0.085g to 1.47g. Figure 8 shows example values greater than and less than 1.0g.
Figure 7. Wave Slam Parameters
The third parameter shown in Figure 7 is the peak longitudinal acceleration (AX); the maximum negative amplitude of the green curve. It is always a negative value that occurs within milliseconds after each wave impact. During the wave impact, as the craft is moving vertically

NSWCCD-23-TM-2012/05
9
down in the water, drag and added mass effects decelerate the forward motion of the craft; hence the negative value. The magnitude of AX is a general indicator of tending to be a skimming impact with little deceleration, or a more plunging impact (deeper depth) with larger (deceleration) amplitudes. The magnitude of the peak deceleration varied from 0.15g to 1.7g for the thirty wave slam events (in the Figure 1 time history) with peak vertical acceleration greater than 2.0g. Figure 8 shows AX amplitudes equal to -1.0g and greater than -1.0g.
Another gage installed at the craft’s LCG measured pitch rate in degrees per second. A six-second sample of its derivative, the angular acceleration in degrees per sec2, is shown as the red curve in Figure 9. The blue curve is the longitudinal acceleration to illustrate the occurrence of wave slam events. The angular acceleration is the fourth parameter of interest because it is useful to understand the sequence of events during individual wave slams. In this investigation a positive angular acceleration indicates a “bow-up” moment is rotating the bow upward, and a negative value indicates a bow-down rotation. The red curve indicates before each wave slam there is a bow down moment (caused by gravity and perhaps a thrust component) applied to the craft, and when impact occurs there is a bow-up moment applied. The fifth parameter of interest is the pseudo-vertical drop height (H) in feet between points A and B shown in Figure 7.
Close inspection of the five parameters led to interesting trends and the ability to categorize individual slams into one of three categories depending upon the sequence of events observed in the slam event. Each slam category, labeled A, B, and C, are described in the following sections.
Figure 8. Examples of AX and AZT Values

NSWCCD-23-TM-2012/05
10
Figure 9. Angular Acceleration at the LCG
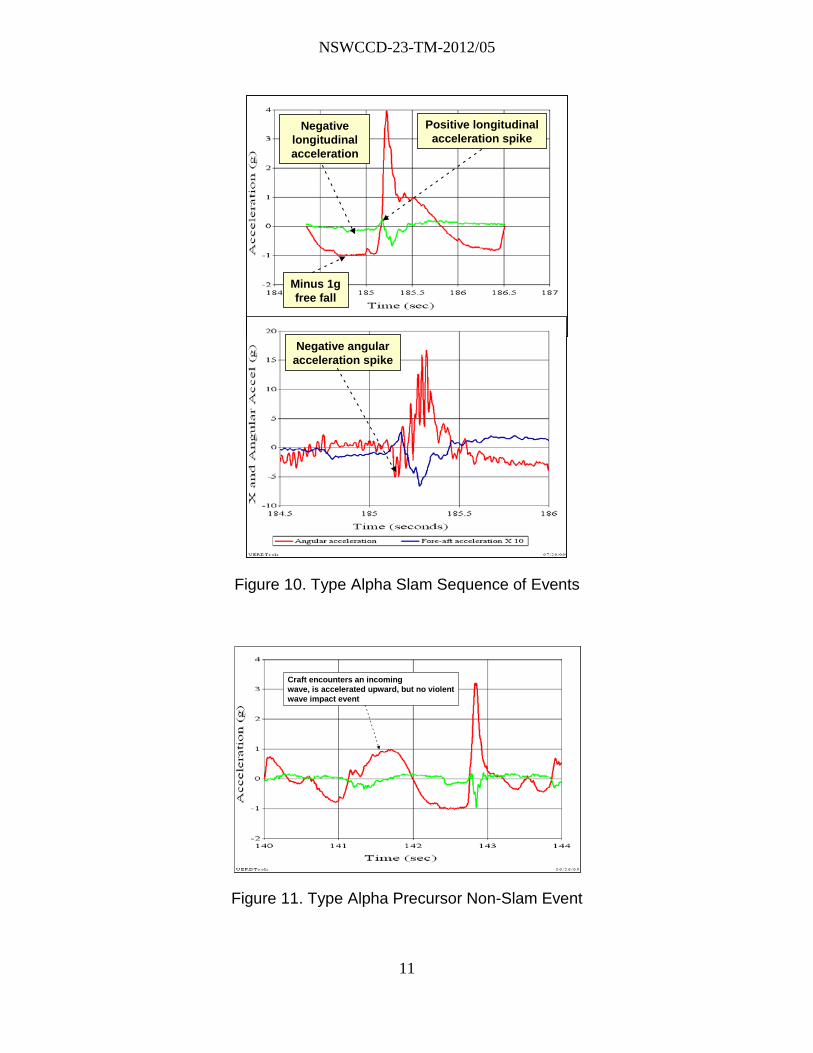
Type Alpha Slam Figure 10 illustrates the Alpha slam, or type A. The upper red curve shows that it is
characterized by a -1g vertical free fall and a negative longitudinal acceleration (green curve) just before wave impact. The fore-aft (longitudinal) positive acceleration spike seen in the green curve indicates a force pushes forward on the LCG briefly at the beginning of the impact. The lower red curve shows a short duration negative angular acceleration spike (bow-down moment while the longitudinal acceleration spike occurs) followed rapidly by a positive angular acceleration (bow-up moment). Eight of the thirty slams observed in the Figure 1 record with vertical peaks greater than 2g were Alpha slams.
All of the Type Alpha slams (except for one) are also characterized by a precursor wave encounter that is a non-slam (non-violent) event. This is illustrated in Figure 11 where there is a small perturbation at the 141 second time that indicates a low amplitude wave impact, but the majority of the response is dominated by smooth shapes due to hydrodynamic and buoyancy forces pushing up on the craft. The very low AX value (green curve) associated with the non-slam event tends to indicate a wave skimming (or planning) wave encounter.
The data in Figures 10 and 11 suggest the following plausible description of the Type Alpha slam sequence of events. The long duration of the upward force in the precursor wave contributes to a launch and free fall sequence of events. A stern-first water entry causes a brief bow down moment, which in turn introduces the forward acceleration spike, followed by impact with the incoming wave that causes the bow-up moment and the sharp rise in vertical acceleration.
Bowdown
moment
Bow upmoment
Bowdown
moment
Bow upmoment
NSWCCD-23-TM-2012/05
11
Figure 10. Type Alpha Slam Sequence of Events
Figure 11. Type Alpha Precursor Non-Slam Event
Negative longitudinalacceleration
Positive longitudinalacceleration spike
Negative angularacceleration spike
Minus 1gfree fall
Negative longitudinalacceleration
Positive longitudinalacceleration spike
Negative angularacceleration spike
Minus 1gfree fall
Craft encounters an incomingwave, is accelerated upward, but no violentwave impact event
Craft encounters an incomingwave, is accelerated upward, but no violentwave impact event

NSWCCD-23-TM-2012/05
12
Type Bravo Slam The Bravo Slam, or Type B, is similar to the Alpha Slam, but there is no indication of a
stern-first impact. Eighteen of the thirty wave slams with vertical peak acceleration greater than 2.0g were Bravo slams.
As shown in Figure 12, the pre-impact period is characterized by a -1.0 g vertical acceleration (or close to it), a negative longitudinal acceleration, and insignificant angular acceleration (close to zero) just prior to impact. This is consistent with a sequence of events described as a free fall event with loss of thrust and little or no bow-down rotation when the keel impacts the water.
Figure 12. Type Bravo Wave Slam Sequence of Events
Type Charlie Slam The third Type C category, or Charlie wave slam, is shown in Figure 13. In the upper plot
the green curve shows there is a small positive longitudinal acceleration that indicates continuous thrust before the impact. Like the Bravo slam there is no longitudinal acceleration spike (no
Negative longitudinalacceleration
No positive longitudinal
acceleration spike
No negative angularacceleration spike
Free fallevent
Negative longitudinalacceleration
No positive longitudinal
acceleration spike
No negative angularacceleration spike
Free fallevent

NSWCCD-23-TM-2012/05
13
stern-first impact). In the lower red plot the small negative angular rotation indicates a continuous bow-down moment before the impact, which is consistent with the negative vertical acceleration in the upper red curve.
The sequence of events indicates the energy of the impact is due primarily to the relative horizontal velocity between the craft and the incident wave, and has little to do with significant vertical drop at the LCG. Prior to the slam there is forward thrust and a small bow down moment, but there is no free-fall event prior to the slam. Only four of the thirty slams with peak vertical accelerations greater than 2.0g were Charlie slams.
Figure 13. Type Charlie Wave Slam Sequence of Events
The Charlie slam is also characterized by the lowest amplitude peak vertical accelerations (2.1g to 2.6g). Alpha and Bravo slams on the other hand have peak vertical accelerations greater than 3.0 g, ,most likely due to the potential energy of the free fall or large bow down rotations just prior to impact.
Positive small longitudinalacceleration (thrust)
No positive longitudinal
acceleration spike
No free fallbefore impact
Continuous negative moment
prior to impact
Positive small longitudinalacceleration (thrust)
No positive longitudinal
acceleration spike
No free fallbefore impact
Continuous negative moment
prior to impact
NSWCCD-23-TM-2012/05
14
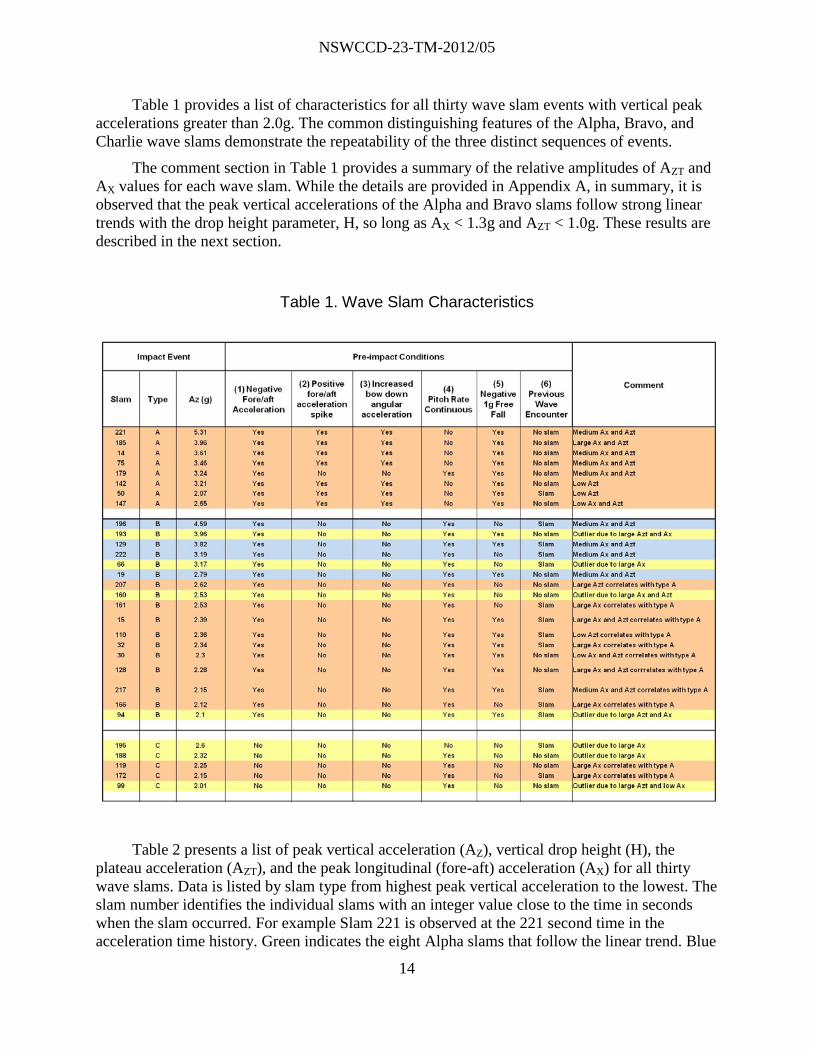
Table 1 provides a list of characteristics for all thirty wave slam events with vertical peak accelerations greater than 2.0g. The common distinguishing features of the Alpha, Bravo, and Charlie wave slams demonstrate the repeatability of the three distinct sequences of events.
The comment section in Table 1 provides a summary of the relative amplitudes of AZT and AX values for each wave slam. While the details are provided in Appendix A, in summary, it is observed that the peak vertical accelerations of the Alpha and Bravo slams follow strong linear trends with the drop height parameter, H, so long as AX < 1.3g and AZT < 1.0g. These results are described in the next section.
Table 1. Wave Slam Characteristics
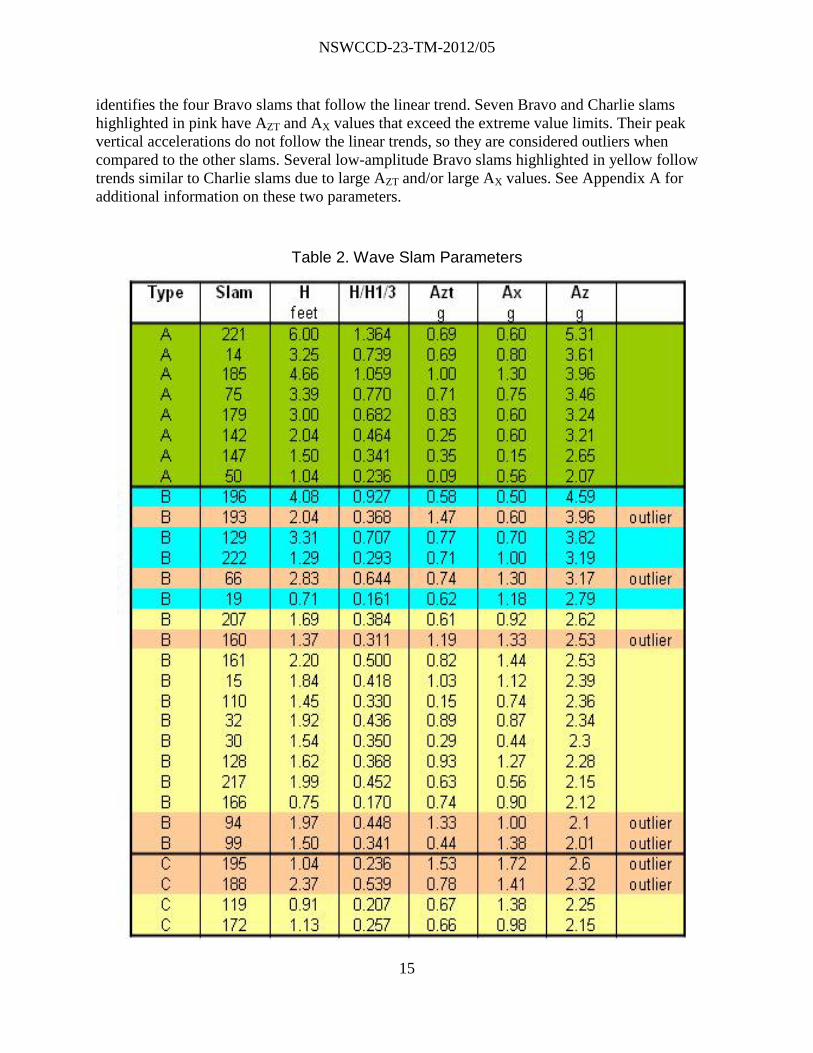
Table 2 presents a list of peak vertical acceleration (AZ), vertical drop height (H), the plateau acceleration (AZT), and the peak longitudinal (fore-aft) acceleration (AX) for all thirty wave slams. Data is listed by slam type from highest peak vertical acceleration to the lowest. The slam number identifies the individual slams with an integer value close to the time in seconds when the slam occurred. For example Slam 221 is observed at the 221 second time in the acceleration time history. Green indicates the eight Alpha slams that follow the linear trend. Blue
NSWCCD-23-TM-2012/05
15
identifies the four Bravo slams that follow the linear trend. Seven Bravo and Charlie slams highlighted in pink have AZT and AX values that exceed the extreme value limits. Their peak vertical accelerations do not follow the linear trends, so they are considered outliers when compared to the other slams. Several low-amplitude Bravo slams highlighted in yellow follow trends similar to Charlie slams due to large AZT and/or large AX values. See Appendix A for additional information on these two parameters.
Table 2. Wave Slam Parameters

NSWCCD-23-TM-2012/05
16
Peak Vertical Acceleration Trends
Linear Regression Figure 14 shows that within wave slam Alpha and Bravo categories there are clear linear
trends with the drop height (H) parameter when AX < 1.3g and AZT < 1.0g (correlation coefficients greater than 0.93). The lower amplitude Charlie wave slams (including lower amplitude Bravo slams identified in Table 2) show only slight correlation with drop height. This result is not surprising in light of the Charlie slam sequence of events dominated by forward motion and vertical acceleration due to wave impact. Clearly, the Alpha and Bravo slam sequence of events is dominated by the pre-impact free fall or bow-down rotation events. The combination of forward momentum (kinetic energy) and free fall (potential energy) results in higher energy impacts with subsequent larger peak vertical acceleration values. It appears the Alpha slams have lower peak vertical accelerations due to the stern-first impact.
Figure 14. Peak Vertical Acceleration Linear Trends
There are seven Bravo and Charlie slam outliers that are not plotted in Figure 14. Their status as an outlier is clearly shown to be related to extreme values of AX > 1.3g and/or AZT >1.0g. It appears the low amplitude Bravo slams identified in Table 2 acted more like Charlie slams due to large AZT and/or large AX values. Additional discussions related to AX and AZT values and angle of impact variation are presented in Appendix A.

NSWCCD-23-TM-2012/05
17
Wave Slam Pulse Shapes The repeatable nature of the large amplitude wave slams are demonstrated by the shape of
the acceleration pulses during the impact period. Figure 15 presents eight representative wave slams from Table 2 with expanded time scales to show the impact period and the hydrodynamic plateau. Each was normalized by dividing by the peak value so that the maximum is 1g. The left plot shows five Alpha and Bravo wave slams having original peak values from 3.1g to 3.8g. Three more slams (Alpha and Bravo) with original peaks of 1.9 g, 4.5g, and 5.3g are compared in the plot on the right. The fourth red curve on the right is the average of the five curves on the left. In general the wave slam events (time B to C in Figure 3) rise from zero to a maximum in 50 to 80 msec, and have a total duration on the order of 200 msec or less.
Figure 15. Normalized Wave Slam Pulse Shapes The good correlation illustrates the repeatability of the Alpha and Bravo wave slam events
and suggests that, while the energies associated with each incident wave may be random, the response of the craft to individual slams when AX < 1.3g and AZT < 1.0g is repeatable and scalable with amplitudes being a function of initial conditions just prior to each slam event.
Scaling Relationship The linear curves in Figure 14 clearly demonstrate that the peak accelerations can be
obtained by use of a scaling relationship for pseudo-drop heights Hi and Hj. For values of H normalized by dividing by the significant wave height, it can be shown that:
( )( )∆+
∆+=
j
i
cgj
cgi
HH
AA
Equation (3)
where:
Acg - peak vertical acceleration at LCG
H - drop height prior to slam / H1/3
H1/3 - average of 1/3rd highest wave heights
Slam 4, 196, 221Slam 14, 66, 75, 129, 179 Slam 4, 196, 221Slam 14, 66, 75, 129, 179

NSWCCD-23-TM-2012/05
18
The constant delta in equation (3) is 0.68 for Type Alpha slams, and 1.13 for Type Bravo slams.
The ability to compute peak vertical acceleration for a craft operating at a constant speed as a function of pseudo-drop height adds new deterministic information to the existing statistical information. The information extracted from the original 240-second acceleration time history by statistical methods includes the RMS baseline value, the computed average of the highest 1/nth acceleration peak values, the peak acceleration histogram, and the probability distribution. The new deterministic information expands the knowledge extracted from an acceleration record including the scaling relationship to interpolate or extrapolate peak accelerations for individual slams of different pseudo-drop heights for a given craft speed.
Parametric Trends Analyzing complex data that has been subjected to a 10 Hz low pass filtering process (to
better estimate rigid body response motions) makes necessary a simplifying assumption: trends may be observed, but not all data will fit the trends. It is a challenge for the analyst to find the trends and identify if possible physical explanations for why outliers do not fit the trend. A second assumption is often helpful: trends manifest themselves better and with less scatter for larger amplitude data (higher energy) than for lower amplitude data.
Figure 16. AX versus AZT Wave Slam Parameters
Figure 16 shows a plot of AX versus AZT values for all thirty wave slams in the original 240 second acceleration record with peak vertical accelerations (rigid body estimates) greater than

NSWCCD-23-TM-2012/05
19
2.0g. The data points are labeled Type Alpha, Bravo, and Charlie slams according to the observed sequence of events. The parameter AZT is of interest because it tends to indicate if a wave impact occurred on the crest, flank, or trough of an incident wave. Lower values would tend to indicate an impact in a wave trough or the back side of a wave (when net positive hydrodynamic and buoyant forces are smallest), and increasing values would tend to indicate an impact on the leading flank or crest of a wave. The parameter AX is of interest because it tends to indicate a skimming impact for lower values, or a deeper plunging impact for larger values. Type Alpha and Bravo wave slams have been described; the Type B and C subset will be discussed in a following section.
The general observation identifies several data points in the lower left corner of the plot characterized by skimming and trough or trailing flank impact conditions. There is a larger data population in the center of the plot roughly outlined by the dashed red lines, and there are several data points to the right of AZT equal to 1.0g, and above AX equal to 1.15g. All type Alpha and Bravo wave slams with AZ > 3.0g that exhibit linear trends have AZT < 1.0g and AX < 1.3g. This suggests that linear trends are observed for sequences of events characterized by wave impacts on the crest or on the trailing flank of a wave, and the impact is not one of the deeper plunging impacts.
The angle of incidence is another impact parameter identified by Chaung (reference 4). The magnitudes of vertical peak acceleration AZ and longitudinal peak acceleration AX are used as vector indicators in Figure 17 to estimate angle of impact trends. All thirty data points are included in the plot, but Type Alpha slam data is highlighted by the circle and square symbols to illustrate an interesting trend.
Figure 17. Type Alpha Wave Slam Trends

NSWCCD-23-TM-2012/05
20
Six of the eight Type Alpha slams plotted as circles indicate that AZ increases as the amplitude of AX increases. This is illustrated in the lower left corner of the plot to show increasing vector amplitudes in both directions. This suggests a trend where the impact angle does not change significantly regardless of drop height (H) during the free fall event. Figure 18 illustrates the opposite trend.
In Figure 18 Type Bravo slams with medium values of AZT (0.58g to 0.76g) are plotted as circles. The trend indicates that AZ decreases as the amplitude of AX increases. This trend is illustrated in the lower left corner of the plot and shows that the angle of impact is tending to change more significantly than the Type Alpha slams shown in Figure 17.
Figure 18. Type Bravo and Charlie Wave Slam Trends
Another interesting trend involves the four Charlie slams and seven Bravo slams, plotted as triangles. All have low peak vertical accelerations (AZ) less than 2.6g. The value of AZ is relatively constant as the amplitude of AX increases. The seven outlier data points with AZT or AX greater than 1.3g are plotted as squares.
The trends are interesting, but additional data analysis is required to identify more clearly the effect of the angle of impact. Further evidence of strong trends related to the vertical and longitudinal partitioning of impact energy is illustrated in Figure 19.
The ratio of vertical to longitudinal peak accelerations is an indicator of the energy distribution, or partitioning, in the different directions (vertical and fore-aft). The strong trends shown in Figure 19 demonstrate further that the three types of wave slams involve different physical sequences of events and energy partitioning. The solid black line is an exponential trend for the four Bravo slams with medium AZT and AX values. The Alpha slam data also follows this trend well. All of these data points involve free fall events or a large bow down angular rotation prior to impact.

NSWCCD-23-TM-2012/05
21
The subset of seven Bravo slams and four Charlie slams with AZ less than 2.6g is shown by the yellow triangles. This data is also well defined by an exponential trend.
Figure 19. Impact Energy Partitioning
The Bravo slam trend line in Figure 19 is given by the following equation with a 0.9909 correlation coefficient.
XA
X
Z eAA 9647.1192.23 −=
Equation (4)
The trend line for the eleven low amplitude Bravo and Charlie slams (yellow triangles) is given by the following equation with a 0.9287 correlation coefficient.
XA
X
Z eAA 075.1157.7 −=
Equation (5)

NSWCCD-23-TM-2012/05
22
Observations The high-speed craft vertical and longitudinal acceleration data presented in this report
indicates that within each slam subset (Type Alpha, Bravo, Charlie), the data may be able to be partitioned further to identify impact conditions that range from (1) a skimming (planing) impact to a more plunging (more severe) impact based on AX values, and (2) from impacts on a wave trailing flank (or trough) to a more severe impact on the leading flank (or wave crest) based on AZT values. It is interesting to note that the peak vertical accelerations for the outlier impacts (AX >1.3g and AZT >1.0g) do not exceed the largest peak vertical accelerations for the non-outlier data points. For example, the largest outlier acceleration is 3.96g (Slam 193B), but the non-outlier (linear trend) accelerations for Alpha and Bravo slams are as high as 5.39g and 4.59g. This indicates the largest vertical accelerations occur in the non-outlier data, therefore using the non-outlier data encompasses the full range of vertical accelerations from smallest (in this case limited to 2g) to the largest peak accelerations. Omitting outlier data based on Xg and Ig values does not therefore omit important high-amplitude slam events. The outlier data points tend to have ratios of ACG/ AX less than 2.5, while the linear trending Alpha and Bravo slams have ratios greater than 2.5. The linear trending data corresponds to more energy partitioning in the vertical direction (and thus better correlation with pseudo-drop height), while the outliers tend to correspond to impacts where more energy is distributed in the fore-aft direction upon impact (i.e., less energy in the vertical direction, thus little or no correlation with pseudo-drop height).
The results presented in this report are intended to convey an approach to analyzing individual wave slam events. It conveys a process focused on understanding acceleration record frequency content, understanding rigid body motions of the craft, and understanding how one acceleration record could be thought of as a sequence of many wave slam events where each wave slam can be analyzed as a single test event. Once the individual elements are evaluated, the process then combines common wave slam events based on physical properties, and synthesizes data trend results. While the approach has been applied to more than one data set, it is still too early to report broad results. The intent is therefore to focus on the process to stimulate further discussion and further research, as opposed to stating broad conclusions on high-speed planing craft responses in significant seas.

NSWCCD-23-TM-2012/05
23
Conclusions The typical accelerometer data presented in this report shows how high speed planing craft
may encounter waves over a broad range of shapes and amplitudes that vary randomly in time depending upon environmental conditions. The deterministic analysis approach presented in this report suggests that the peak accelerations of the craft induced by wave impacts may not be random responses. By categorizing individual wave slams into subsets that depend upon the wave impact sequence of events (Type Alpha, Bravo, Charlie), it appears possible to identify subset trends where peak acceleration responses can be shown to be repeatable and scalable. These results suggest that while each wave is unique and random, the dynamic response of a high-speed planing craft to wave impact is not random.
The wave slam subsets observed in the typical acceleration time history presented in this report are defined as Type Alpha slams, Type Bravo slams, and Type Charlie slams. The Type Alpha slam includes a stern-first impact after a free-fall event. The Type Bravo slam includes a free fall event and/or a non-free-fall with a substantial bow-down rotation prior to keel impact. The Type Charlie slam is primarily a forward thrust into an incident wave with insignificant bow-down rotation or free-fall prior to impact.
The pseudo-drop height (H) is one of five parameters found useful for characterizing individual wave slam responses. The other four include peak vertical acceleration (aZ), peak longitudinal acceleration (AX), wave plateau acceleration (AZT), and angular acceleration. For the data presented in this report, peak rigid body acceleration values trend linearly with pseudo-drop height (H) for values of AX < 1.3g and AZT < 1.0g.
The deterministic data analysis approach presented in this report may provide valuable information that expands the knowledge extracted from acceleration responses of high-speed planing craft in waves. It provides a physics-based approach to understanding wave slam load and craft response mechanisms that may have multiple potential applications, including hull strain correlation with loads, craft ride severity comparisons for equipment and crew comfort studies, computer simulation correlation and validation, and new approaches to static “G” hull design.

NSWCCD-23-TM-2012/05
24
Symbols, Abbreviations, and Acronyms
cga ..................................................................... Average Peak Vertical Acceleration at LCG
A1/n ................................................................ Average of the 1/nth Highest Peak Acceleration
AZ .................................................................................................. Peak Vertical Acceleration
AX or Xg ................................................................................. Peak Longitudinal Acceleration
AZT or Ig ............................. Wave Plateau Acceleration, or Ambient Transition Acceleration
Bw or b ........................................................................................................Beam at Waterline
cgβ ....................................................................................................... Deadrise at Craft LCG
C or ∆ ........................................................................................................................ Constant
CCD ................................................................................................ Combatant Craft Division
ft ......................................................................................................................................... Feet
fps.................................................................................................................... Feet per Second
g ................................................................................. 32.2 ft/sec2 Acceleration due to gravity
H1/3 or h1/3 ......................................................................................... Significant Wave Height
H................................................................................................. Pseudo Vertical Drop Height
Hz ..................................................................................................................................... Hertz
L ................................................................................ Craft length or length of Beam Element
LCG ........................................................................................ Longitudinal Center of Gravity msec ..................................................................................................................... Milliseconds
N or M ............................................................................................. Number of Wave Impacts
R2 ................................................................................. Least Squares Correlation Coefficient
RMS ............................................................................................................Root Mean Square
τ Trim
V.............................................................................................................. Craft Average Speed

NSWCCD-23-TM-2012/05
25
References
1. Coats, T., Haupt, K., Jacobson, A., Jacobson, D. and Pogorzelski, D. (September 2007). “MAST 2007 Working Towards Vertical Acceleration Data Standards”, Naval Surface Warfare Center Carderock, Combatant Craft Division, MAST conference 2007 paper
2. Riley, Michael R., Haupt, Kelly D., and Jacobson, Donald, “A Generalized Approach and Interim Criteria for Computing A1/n Accelerations Using Full-Scale High Speed Craft Trials Data”, Naval Surface Warfare Center Carderock Division Report NSWCCD-23-TM-2010/13, April 2010.
3. Savitsky, Daniel and Brown, P.W. (October 1976). “Procedures for Hydrodynamic Evaluation of Planing Hulls in Smooth and Rough Water”, Marine Technology, Volume 13, No. 4. 4. Chaung, Sheng-Lun, “Slamming Tests of Three Dimensional Models in Calm Water and Waves”, Naval Ship research and Development Center Report 4095, Sep 1973.

NSWCCD-23-TM-2012/05
26
Distribution
Copies Copies Kelly Cooper (Code 331) Dr. Paul Rispin (Code 333) Dr. Robert Brizzolara (Code 333) Office of Naval Research Sea Platforms and Weapons Division 875 North Randolph Street, Arlington, VA 22203-1995 Naval Sea Systems Command PEO Ships, PMS 325G 1333 Isaac Hull Avenue, SE Building 197 Washington Navy Yard, DC 20376 Commander Naval Special Warfare Dev Group 1639 Regulus Avenue Virginia Beach, VA 23461-2299 Attn: Mr. Joseph Coles, Code N54-4
# NSWC, CARDEROCK DIVISION INTERNAL DISTRIBUTION
#
1 1 1
Code Name
1
55 57 58 23
230X 231 231 232 233 235 235 235
J. Hoyt J. Gorski T. Fu Electronic Data Library Dr. T. Coats W. Sokol D. Jacobson S. Petersen K. Beachy D. Pogorzelski K. Haupt H. Murphy
1 1 1 1 1 1 1 1 1 1 1 1
1

NSWCCD-23-TM-2012/05
27
This page intentionally left blank

NSWCCD-23-TM-2012/05