
A detailed study deciphering architecture of big data ecosystems
12
A detailed study deciphering architecture of Big Data ecosystem Tarvinder Singh Master in Business Analytics and Big Data IE Business School, Madrid Laura Conesa Pla Master in Business Analytics and Big Data IE Business School, Madrid Abstract: - What is Big Data? We may have come across this term number of times in the recent past. It is a term that describes huge amount of data, both structured and unstructured. These data sets are so huge that our traditional database systems and applications are inadequate to deal with them. Exactly it is impossible to determine the amount of data we have today. 90% of total data today is generates in last 2-2.5 years. As per IBM, we generate 2.5 exabytes (2.5 * 10^18 Bytes) of data every day, and is expected to grow 50 times by 2020. By 2020, the size of data stored will be 40 zettabytes (400 billion gigabytes). To handle this huge amounts of data, we have started developing different systems and techniques. Most of these applications are developed by open source community and some by proprietary firms. Challenges with these huge data sets include storage, retrieving, manipulation, studying and analysing efficiently to deliver insights in timely manner. In this article, we will study the working and architecture of various systems that help us to achieve the above. 1. Where does this Data come from and who uses it? The sources of this data are not new. It is just that the scale of this data has increased exponentially in last few years. This data comes from Emails, tweets, sensors, public web, banking transactions, social media, GPS, business apps, docs, archives, telecom logs, Healthcare etc. These data sources can be broadly classified to three main varieties. Social Media Data: - This data comes from social media platforms like Twitter, Facebook, Youtube, Linkedin etc Transactional Data: - This data comes from bank transactions, invoices, logistics, retail, ERP systems etc. Machine Data: - Major source of this data is sensor data from smartphones, GPS devices, industrial devices (example Aircraft carriers generate hundreds of terabytes of data), Wi-Fi logs, web logs that store user behaviour, Bluetooth devices, smart TV’s etc. This data is mostly unstructured and many times it may not make a lot of sense on its own. To get insights from this data, it may need to be combined with more structured data like customer master tables, location data, device data etc. With exponential rise of Internet of Things (IoT) and wearable sensors this data sets will grow multiple times in the coming times. Google itself processes 3.5 billion requests per day and stores and processes 10 exabytes of data. Facebook admits to have stored 100 petabytes of data (10^8 GB) and adds more than 500 terabytes of data every day. Amazon uses data from 152 million user purchases to give appropriate suggestions to the users. Twitter generates about 80 million tweets per day that makes 8 terabytes of data every day. Walmart handles more than 1 million customer transactions every hour and has stored 2.5 petabytes of data so far. This data is important because it hold very important and valuable information about the user behaviour, which
-
Upload
tarvinder-singh -
Category
Data & Analytics
-
view
110 -
download
1
Transcript of A detailed study deciphering architecture of big data ecosystems

A detailed study deciphering architecture of Big Data ecosystem
Tarvinder Singh Master in Business Analytics and Big Data
IE Business School, Madrid
Laura Conesa Pla Master in Business Analytics and Big Data
IE Business School, Madrid
Abstract: - What is Big Data? We may have come across this term number of times in the recent past. It is a term that describes huge amount of data, both structured and unstructured. These data sets are so huge that our traditional database systems and applications are inadequate to deal with them. Exactly it is impossible to determine the amount of data we have today. 90% of total data today is generates in last 2-2.5 years. As per IBM, we generate 2.5 exabytes (2.5 * 10^18 Bytes) of data every day, and is expected to grow 50 times by 2020. By 2020, the size of data stored will be 40 zettabytes (400 billion gigabytes). To handle this huge amounts of data, we have started developing different systems and techniques. Most of these applications are developed by open source community and some by proprietary firms. Challenges with these huge data sets include storage, retrieving, manipulation, studying and analysing efficiently to deliver insights in timely manner. In this article, we will study the working and architecture of various systems that help us to achieve the above.
1. Where does this Data come from and who uses it? The sources of this data are not new. It is just that the scale of this data has increased exponentially in last few years. This data comes from Emails, tweets, sensors, public web, banking transactions, social media, GPS, business apps, docs, archives, telecom logs, Healthcare etc. These data sources can be broadly classified to three main varieties.
Social Media Data: - This data comes from social media platforms like Twitter, Facebook, Youtube, Linkedin etc
Transactional Data: - This data comes from bank transactions, invoices, logistics, retail, ERP systems etc.
Machine Data: - Major source of this data is sensor data from smartphones, GPS devices, industrial devices (example Aircraft carriers generate hundreds of terabytes of data), Wi-Fi logs, web logs that store user behaviour, Bluetooth devices, smart TV’s etc.
This data is mostly unstructured and many times it may not make a lot of sense on its own. To get insights from this data, it may need to be combined with more structured data like customer master tables, location data, device data etc. With exponential rise of Internet of Things (IoT) and wearable sensors this data sets will grow multiple times in the coming times. Google itself processes 3.5 billion requests per day and stores and processes 10 exabytes of data. Facebook admits to have stored 100 petabytes of data (10^8 GB) and adds more than 500 terabytes of data every day. Amazon uses data from 152 million user purchases to give appropriate suggestions to the users. Twitter generates about 80 million tweets per day that makes 8 terabytes of data every day. Walmart handles more than 1 million customer transactions every hour and has stored 2.5 petabytes of data so far. This data is important because it hold very important and valuable information about the user behaviour, which

if used properly can help to develop new products, optimize business processes. This big data and its derivable benefits has led to a new term, DDBM (Data Driven Business Model). Businesses as such have proven to have 7-9% higher productivity as compared to similar organizations who do not utilize data driven business processes. Our study suggests that many businesses existing and new are developing business models and processes that precisely make decisions based solely capturing, cleaning and utilizing knowledge derived from data. Businesses like Netflix – 75% of users select moves based on Netflix’s recommendation engine, Uber – uses real time GPS and traffic data to calculate the travel time and fare and predicts demand of the vehicles in any area, Airbnb – its machine learning open platform Aerosolve provides dynamic pricing functionality, Spotify – suggests the kind of music you would like listen. What are the assets of these companies? Netflix does not make movies, Uber does not own cars, Airbnb does not have its own hotels. Only assets these companies have is data and their business is driven through the insights obtained from this data. These companies use data to give people exactly what they want.
2. Operations with Big Data: - Traditionally we have been performing operations like Storing, processing, manipulating, monitoring activities on our data sets. Since our data sets were not so huge and dynamic, we need no have specifically designed complex systems for the same. Most of the above were easily done in any DBMS system. Now, the nature and scale of our data has changed, systems used for the above also needs to be more specific. There are several systems, mostly open source which together make and eco system for the big data applications. We will discuss some of these systems in big data ecosystem in detail.
2.1 Data Storage and Processing with Hadoop: -
Hadoop is an open source software framework majorly used for storing and processing of the huge data sets, we now refer to as big data. It consists of computer clusters (which are referred to as nodes), built from commodity hardware for a cost-effective method. These are physically many machines that are connected to each other and work together as a single system, providing us with huge resources at a low cost. All the modules in Hadoop are designed with keeping into consideration the fact that the hardware failures are the common occurrence and they should be handled automatically by the system. Hadoop provides huge amount of processing power at low cost. For example: - 1 Hadoop cluster may consist of 50 racks and each rack may have about 20 slave machines, each machine with i7 processor and 16 GB of RAM, providing us with enormous resources at low cost. Following is the architecture of Hadoop
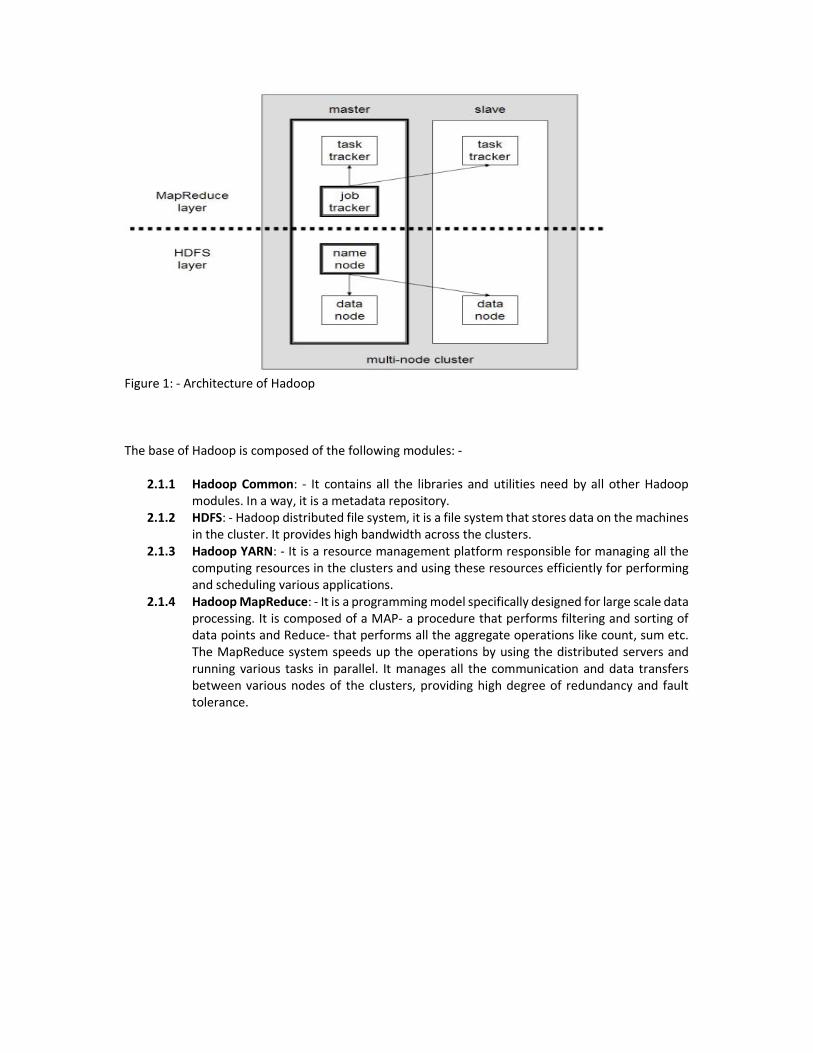
Figure 1: - Architecture of Hadoop The base of Hadoop is composed of the following modules: -
2.1.1 Hadoop Common: - It contains all the libraries and utilities need by all other Hadoop modules. In a way, it is a metadata repository.
2.1.2 HDFS: - Hadoop distributed file system, it is a file system that stores data on the machines in the cluster. It provides high bandwidth across the clusters.
2.1.3 Hadoop YARN: - It is a resource management platform responsible for managing all the computing resources in the clusters and using these resources efficiently for performing and scheduling various applications.
2.1.4 Hadoop MapReduce: - It is a programming model specifically designed for large scale data processing. It is composed of a MAP- a procedure that performs filtering and sorting of data points and Reduce- that performs all the aggregate operations like count, sum etc. The MapReduce system speeds up the operations by using the distributed servers and running various tasks in parallel. It manages all the communication and data transfers between various nodes of the clusters, providing high degree of redundancy and fault tolerance.

Figure 2: - MapReduce Operations. 2.2 Monitoring with Graphite- Tattle: - Graphite is an enterprise ready monitoring tool that works well on commodity hardware or Cloud infrastructure. It was released under open source Apache 2.0 License. Graphite is an easy way of making graphs of the various processes like websites, applications, load on network servers etc. It can be programmed to makes graphs of data points at a desired interval. For example: - If a retail business wants to monitor the number of products sold under category Home appliances, in every 10 seconds across their stores and compare then with the sales on the similar days last year and previous three weeks, it can be easily done using a Graphite. It can add lines on the graph for every parameter of comparison. Most convenient part is that we need to do it only once and graphs will keep refreshing themselves at desired time intervals. Business users can create a dashboard of any numbers of graphs for the desired data points and timelines. Graphite works with number of database systems, structured or unstructured.

Figure 3: - Example of a Graphite graph for 10-minute time interval. Tattle: - It is a Lightweight self-service dashboard web application. It can be used to create a dashboard along with the error reporting system. For example: - There is an Ecommerce website and they have product managers for various product categories. They are using Graphite to make graphs of various products sold. It may time consuming and not cost effective for someone to monitor graphs 24/7. Using Tattle with graphite we can implement a service which saves the effort. Implementation such as, if the number of visitors on the website falls by 15% than the normal average, a mail and a message should be sent to a recipient A, and if the number of visitors falls by 30%, a mail and message should be sent to recipient A, B and C so that a proper action can be taken. Creating alerts system for individual stake owners can be done using this implementation. One can also view the chronology of order of the alert events including whether alert has now reverted to a normal state. We did Graphite – Tattle implementation for a website and following is the block diagram for the same
Figure 4: - Event chronology log of Graphite-Tattle
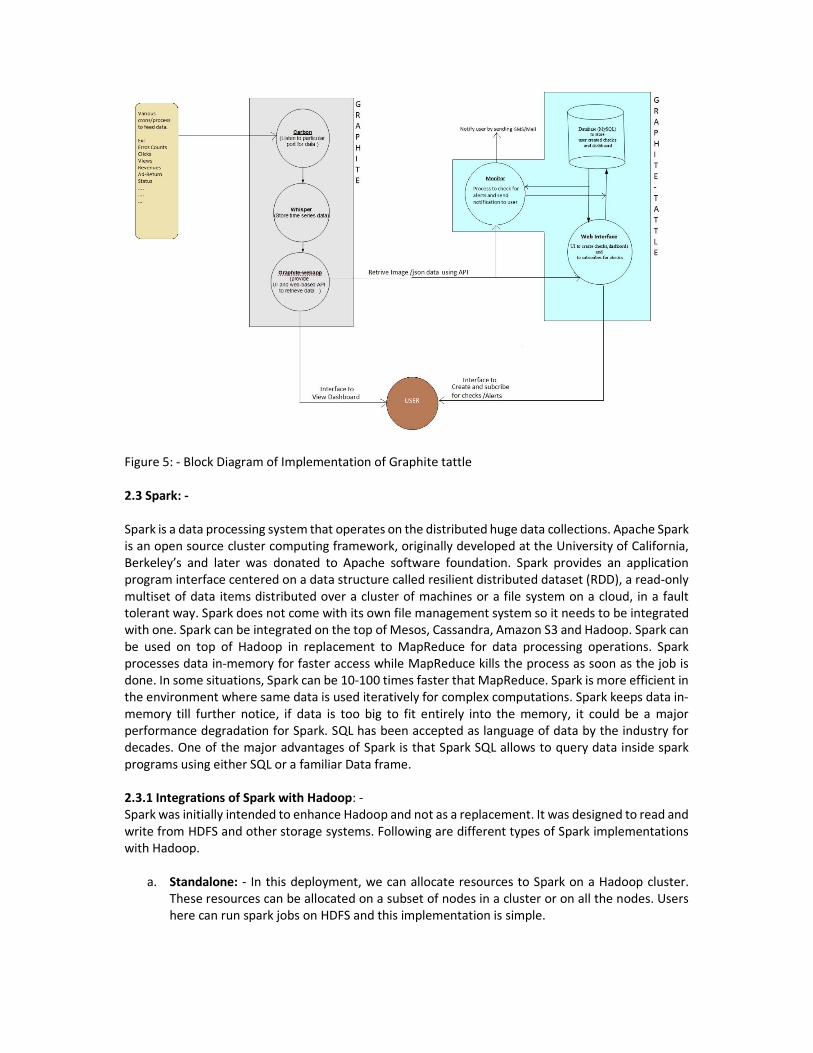
Figure 5: - Block Diagram of Implementation of Graphite tattle 2.3 Spark: - Spark is a data processing system that operates on the distributed huge data collections. Apache Spark is an open source cluster computing framework, originally developed at the University of California, Berkeley’s and later was donated to Apache software foundation. Spark provides an application program interface centered on a data structure called resilient distributed dataset (RDD), a read-only multiset of data items distributed over a cluster of machines or a file system on a cloud, in a fault tolerant way. Spark does not come with its own file management system so it needs to be integrated with one. Spark can be integrated on the top of Mesos, Cassandra, Amazon S3 and Hadoop. Spark can be used on top of Hadoop in replacement to MapReduce for data processing operations. Spark processes data in-memory for faster access while MapReduce kills the process as soon as the job is done. In some situations, Spark can be 10-100 times faster that MapReduce. Spark is more efficient in the environment where same data is used iteratively for complex computations. Spark keeps data in-memory till further notice, if data is too big to fit entirely into the memory, it could be a major performance degradation for Spark. SQL has been accepted as language of data by the industry for decades. One of the major advantages of Spark is that Spark SQL allows to query data inside spark programs using either SQL or a familiar Data frame. 2.3.1 Integrations of Spark with Hadoop: - Spark was initially intended to enhance Hadoop and not as a replacement. It was designed to read and write from HDFS and other storage systems. Following are different types of Spark implementations with Hadoop.
a. Standalone: - In this deployment, we can allocate resources to Spark on a Hadoop cluster. These resources can be allocated on a subset of nodes in a cluster or on all the nodes. Users here can run spark jobs on HDFS and this implementation is simple.
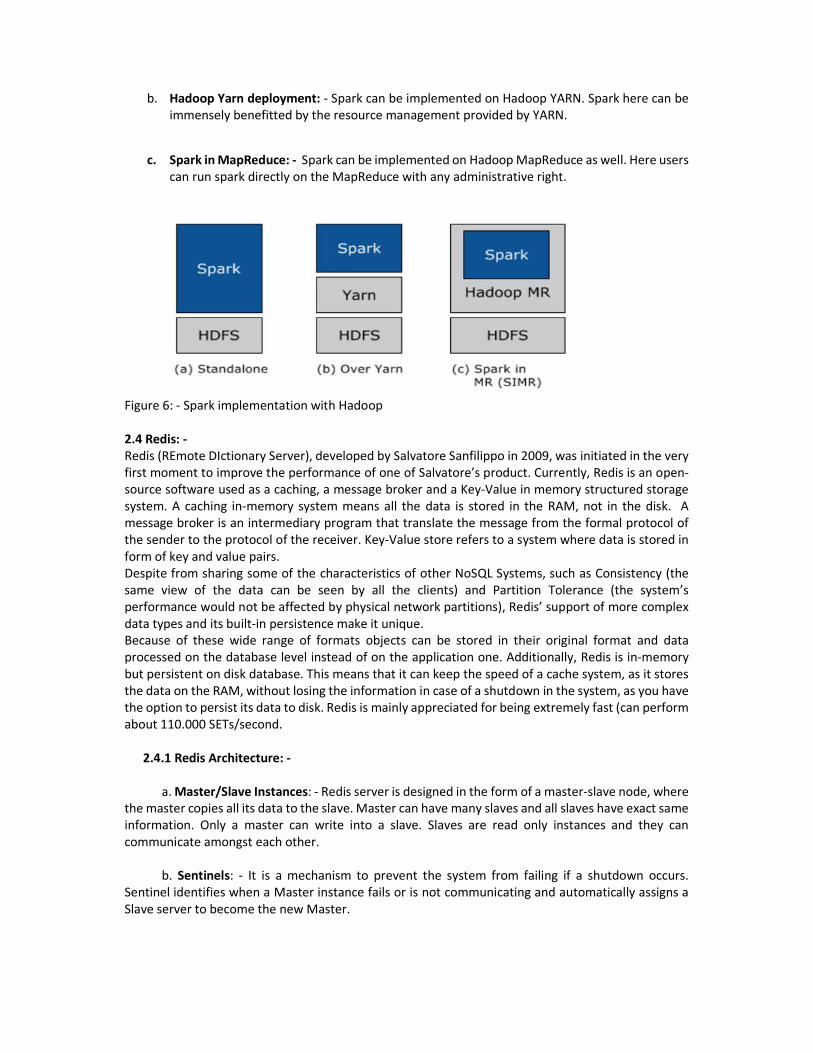
b. Hadoop Yarn deployment: - Spark can be implemented on Hadoop YARN. Spark here can be immensely benefitted by the resource management provided by YARN.
c. Spark in MapReduce: - Spark can be implemented on Hadoop MapReduce as well. Here users can run spark directly on the MapReduce with any administrative right.
Figure 6: - Spark implementation with Hadoop 2.4 Redis: - Redis (REmote DIctionary Server), developed by Salvatore Sanfilippo in 2009, was initiated in the very first moment to improve the performance of one of Salvatore’s product. Currently, Redis is an open-source software used as a caching, a message broker and a Key-Value in memory structured storage system. A caching in-memory system means all the data is stored in the RAM, not in the disk. A message broker is an intermediary program that translate the message from the formal protocol of the sender to the protocol of the receiver. Key-Value store refers to a system where data is stored in form of key and value pairs. Despite from sharing some of the characteristics of other NoSQL Systems, such as Consistency (the same view of the data can be seen by all the clients) and Partition Tolerance (the system’s performance would not be affected by physical network partitions), Redis’ support of more complex data types and its built-in persistence make it unique. Because of these wide range of formats objects can be stored in their original format and data processed on the database level instead of on the application one. Additionally, Redis is in-memory but persistent on disk database. This means that it can keep the speed of a cache system, as it stores the data on the RAM, without losing the information in case of a shutdown in the system, as you have the option to persist its data to disk. Redis is mainly appreciated for being extremely fast (can perform about 110.000 SETs/second. 2.4.1 Redis Architecture: - a. Master/Slave Instances: - Redis server is designed in the form of a master-slave node, where the master copies all its data to the slave. Master can have many slaves and all slaves have exact same information. Only a master can write into a slave. Slaves are read only instances and they can communicate amongst each other. b. Sentinels: - It is a mechanism to prevent the system from failing if a shutdown occurs. Sentinel identifies when a Master instance fails or is not communicating and automatically assigns a Slave server to become the new Master.
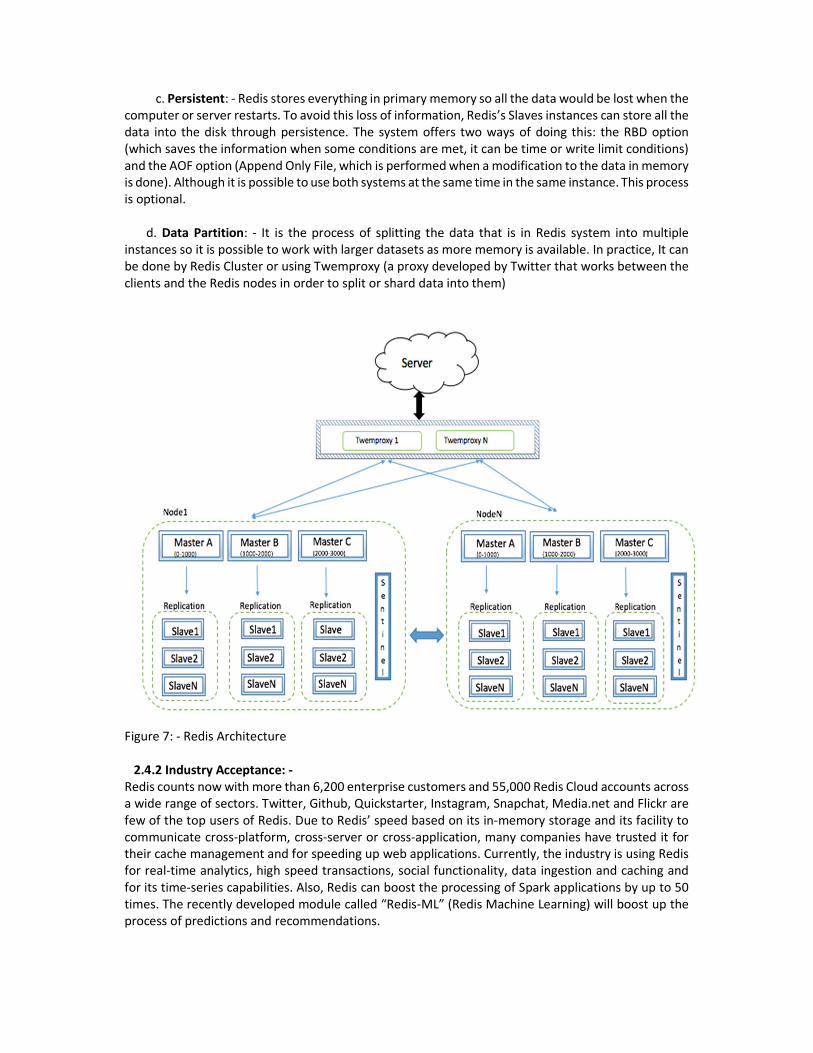
c. Persistent: - Redis stores everything in primary memory so all the data would be lost when the computer or server restarts. To avoid this loss of information, Redis’s Slaves instances can store all the data into the disk through persistence. The system offers two ways of doing this: the RBD option (which saves the information when some conditions are met, it can be time or write limit conditions) and the AOF option (Append Only File, which is performed when a modification to the data in memory is done). Although it is possible to use both systems at the same time in the same instance. This process is optional. d. Data Partition: - It is the process of splitting the data that is in Redis system into multiple instances so it is possible to work with larger datasets as more memory is available. In practice, It can be done by Redis Cluster or using Twemproxy (a proxy developed by Twitter that works between the clients and the Redis nodes in order to split or shard data into them)
Figure 7: - Redis Architecture 2.4.2 Industry Acceptance: - Redis counts now with more than 6,200 enterprise customers and 55,000 Redis Cloud accounts across a wide range of sectors. Twitter, Github, Quickstarter, Instagram, Snapchat, Media.net and Flickr are few of the top users of Redis. Due to Redis’ speed based on its in-memory storage and its facility to communicate cross-platform, cross-server or cross-application, many companies have trusted it for their cache management and for speeding up web applications. Currently, the industry is using Redis for real-time analytics, high speed transactions, social functionality, data ingestion and caching and for its time-series capabilities. Also, Redis can boost the processing of Spark applications by up to 50 times. The recently developed module called “Redis-ML” (Redis Machine Learning) will boost up the process of predictions and recommendations.
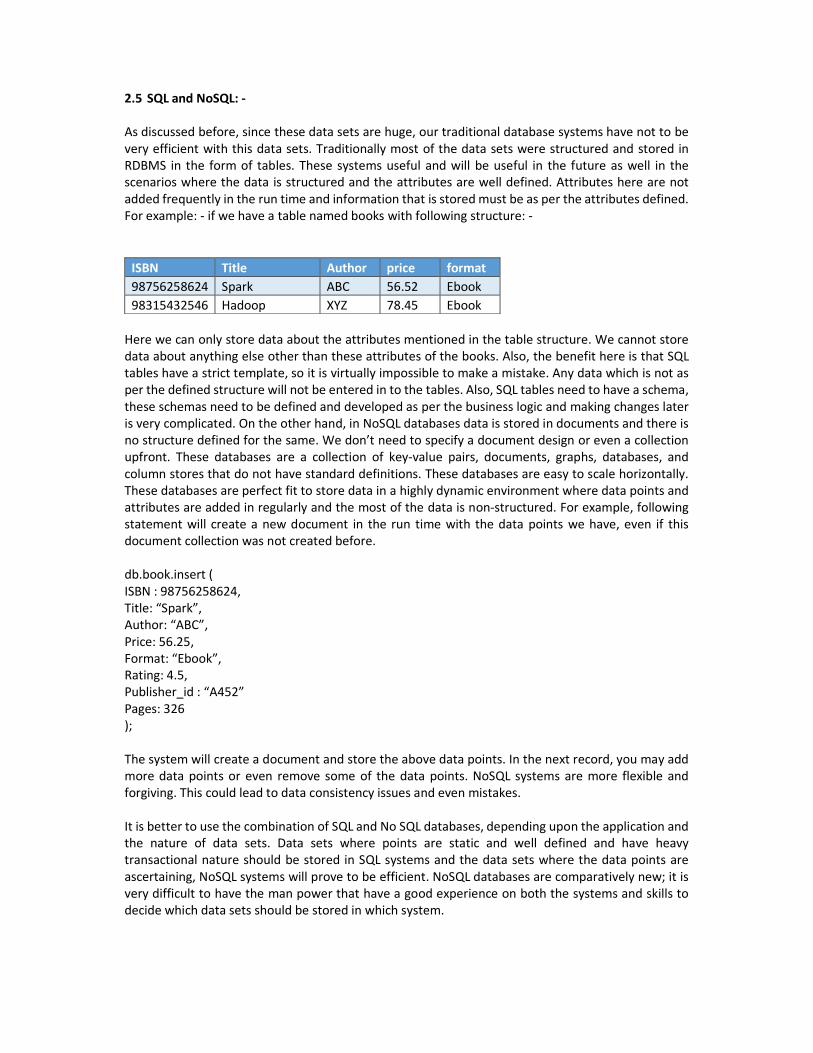
2.5 SQL and NoSQL: - As discussed before, since these data sets are huge, our traditional database systems have not to be very efficient with this data sets. Traditionally most of the data sets were structured and stored in RDBMS in the form of tables. These systems useful and will be useful in the future as well in the scenarios where the data is structured and the attributes are well defined. Attributes here are not added frequently in the run time and information that is stored must be as per the attributes defined. For example: - if we have a table named books with following structure: -
ISBN Title Author price format
98756258624 Spark ABC 56.52 Ebook
98315432546 Hadoop XYZ 78.45 Ebook
Here we can only store data about the attributes mentioned in the table structure. We cannot store data about anything else other than these attributes of the books. Also, the benefit here is that SQL tables have a strict template, so it is virtually impossible to make a mistake. Any data which is not as per the defined structure will not be entered in to the tables. Also, SQL tables need to have a schema, these schemas need to be defined and developed as per the business logic and making changes later is very complicated. On the other hand, in NoSQL databases data is stored in documents and there is no structure defined for the same. We don’t need to specify a document design or even a collection upfront. These databases are a collection of key-value pairs, documents, graphs, databases, and column stores that do not have standard definitions. These databases are easy to scale horizontally. These databases are perfect fit to store data in a highly dynamic environment where data points and attributes are added in regularly and the most of the data is non-structured. For example, following statement will create a new document in the run time with the data points we have, even if this document collection was not created before. db.book.insert ( ISBN : 98756258624, Title: “Spark”, Author: “ABC”, Price: 56.25, Format: “Ebook”, Rating: 4.5, Publisher_id : “A452” Pages: 326 ); The system will create a document and store the above data points. In the next record, you may add more data points or even remove some of the data points. NoSQL systems are more flexible and forgiving. This could lead to data consistency issues and even mistakes. It is better to use the combination of SQL and No SQL databases, depending upon the application and the nature of data sets. Data sets where points are static and well defined and have heavy transactional nature should be stored in SQL systems and the data sets where the data points are ascertaining, NoSQL systems will prove to be efficient. NoSQL databases are comparatively new; it is very difficult to have the man power that have a good experience on both the systems and skills to decide which data sets should be stored in which system.

3. Big Data Ecosystem: - Understanding Big Data Ecosystem can be very challenging. The vast proliferation of technologies in the domain means there is no single go-to solution to build the Big Data Architecture. In this article, we tried to discuss various Big data systems and technologies that will help organisations harness the true power of their huge data sets. Eventually a Big Data environment should allow you to store, process, analyse and visualize huge amount of data in an efficient manner that caters the business needs. This would require choosing systems that would help to achieve the target. Also, most of the systems in this domain are open source and there is particular vendor for end to end solutions. Companies using these systems must hire high skilled professionals and depend on community support if any problem is not solved internally.
Figure 8: - Big Data Ecosystem

4. Conclusions: - With growing data volumes and dynamic business environment, it is now essential to store and use information provided by data and make decisions based on that data. Big data is a challenge that had opened a huge scope of opportunities. In this domain, we have many answers and solutions, only if we know the right question. It is now necessary for every organization to have a well-defined data strategy. Data strategy should include processes like data acquisition, data management, knowledge discovery, monitoring, reporting, analytics, visualization and knowledge management. Traditionally, organizations had to spend millions on hardware and proprietary software systems. Since most of the systems and technologies in this domain are open source and hardware required is nothing more than commodity systems, Big data is truly an opportunity that can help us achieve business excellence even in turbulent times.
Acknowledgement
Our sincere thanks to Professor Sudipto Chakraborty and Sean David for their precious guidance in writing this document. They have gone through this article and pit lot of efforts to correct document when needed.
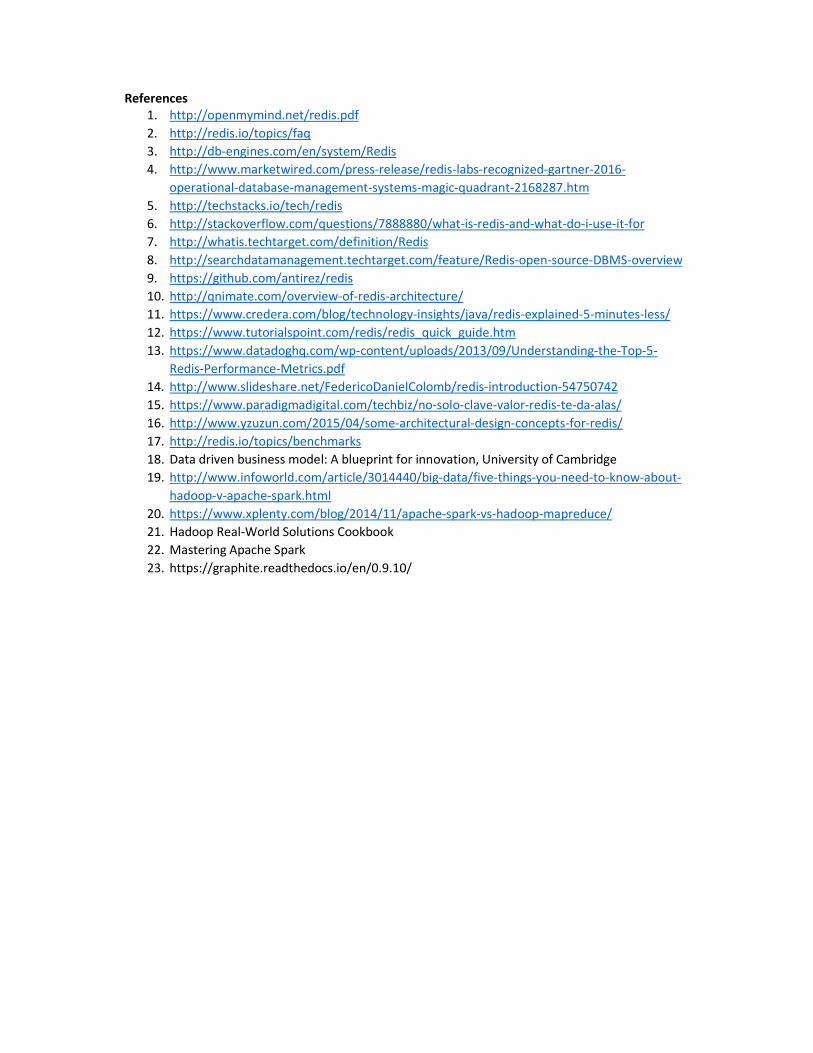
References 1. http://openmymind.net/redis.pdf
2. http://redis.io/topics/faq
3. http://db-engines.com/en/system/Redis
4. http://www.marketwired.com/press-release/redis-labs-recognized-gartner-2016-
operational-database-management-systems-magic-quadrant-2168287.htm
5. http://techstacks.io/tech/redis
6. http://stackoverflow.com/questions/7888880/what-is-redis-and-what-do-i-use-it-for
7. http://whatis.techtarget.com/definition/Redis
8. http://searchdatamanagement.techtarget.com/feature/Redis-open-source-DBMS-overview
9. https://github.com/antirez/redis
10. http://qnimate.com/overview-of-redis-architecture/
11. https://www.credera.com/blog/technology-insights/java/redis-explained-5-minutes-less/
12. https://www.tutorialspoint.com/redis/redis_quick_guide.htm
13. https://www.datadoghq.com/wp-content/uploads/2013/09/Understanding-the-Top-5-
Redis-Performance-Metrics.pdf
14. http://www.slideshare.net/FedericoDanielColomb/redis-introduction-54750742
15. https://www.paradigmadigital.com/techbiz/no-solo-clave-valor-redis-te-da-alas/
16. http://www.yzuzun.com/2015/04/some-architectural-design-concepts-for-redis/
17. http://redis.io/topics/benchmarks
18. Data driven business model: A blueprint for innovation, University of Cambridge
19. http://www.infoworld.com/article/3014440/big-data/five-things-you-need-to-know-about-
hadoop-v-apache-spark.html
20. https://www.xplenty.com/blog/2014/11/apache-spark-vs-hadoop-mapreduce/
21. Hadoop Real-World Solutions Cookbook
22. Mastering Apache Spark
23. https://graphite.readthedocs.io/en/0.9.10/