A deep resistivity Full Waver survey unravels the 3D ...
12
A deep resistivity Full Waver survey unravels the 3D structure of the Castelluccio basin in relation to the source of the 2016 Mw 6.5 Norcia earthquake (central Italy) Vincenzo Sapia1, Fabio Villani1, Federico Fischanger2, Matteo Lupi3, Paola Baccheschi1, Carlo Alberto Brunori1, Riccardo Civico1, Igino Coco1, Paolo Marco De Martini1, Fabio Giannattasio1, Luigi Improta1, Valerio Materni1, Federica Murgia4, Daniela Pantosti1, Luca Pizzimenti1, Stefano Pucci1, Tullio Ricci1, Valentina Romano4, Alessandra Sciarra1, Alessandra Smedile 1 Istituto Nazionale di Geofisica e Vulcanologia, Rome, Italy ([email protected]) 2 Geostudi Astier srl 3 Universitè de Geneve 4 Università degli Studi di Roma La Sapienza
Transcript of A deep resistivity Full Waver survey unravels the 3D ...

A deep resistivity Full Waver survey unravels the 3D structure of the
Castelluccio basin in relation to the source of the 2016 Mw 6.5
Norcia earthquake (central Italy)
Vincenzo Sapia1, Fabio Villani1, Federico Fischanger2, Matteo Lupi3, Paola Baccheschi1, Carlo Alberto Brunori1, Riccardo
Civico1, Igino Coco1, Paolo Marco De Martini1, Fabio Giannattasio1, Luigi Improta1, Valerio Materni1, Federica Murgia4, Daniela
Pantosti1, Luca Pizzimenti1, Stefano Pucci1, Tullio Ricci1, Valentina Romano4, Alessandra Sciarra1, Alessandra Smedile
1 Istituto Nazionale di Geofisica e Vulcanologia, Rome, Italy ([email protected])
2 Geostudi Astier srl
3 Universitè de Geneve
4 Università degli Studi di Roma La Sapienza
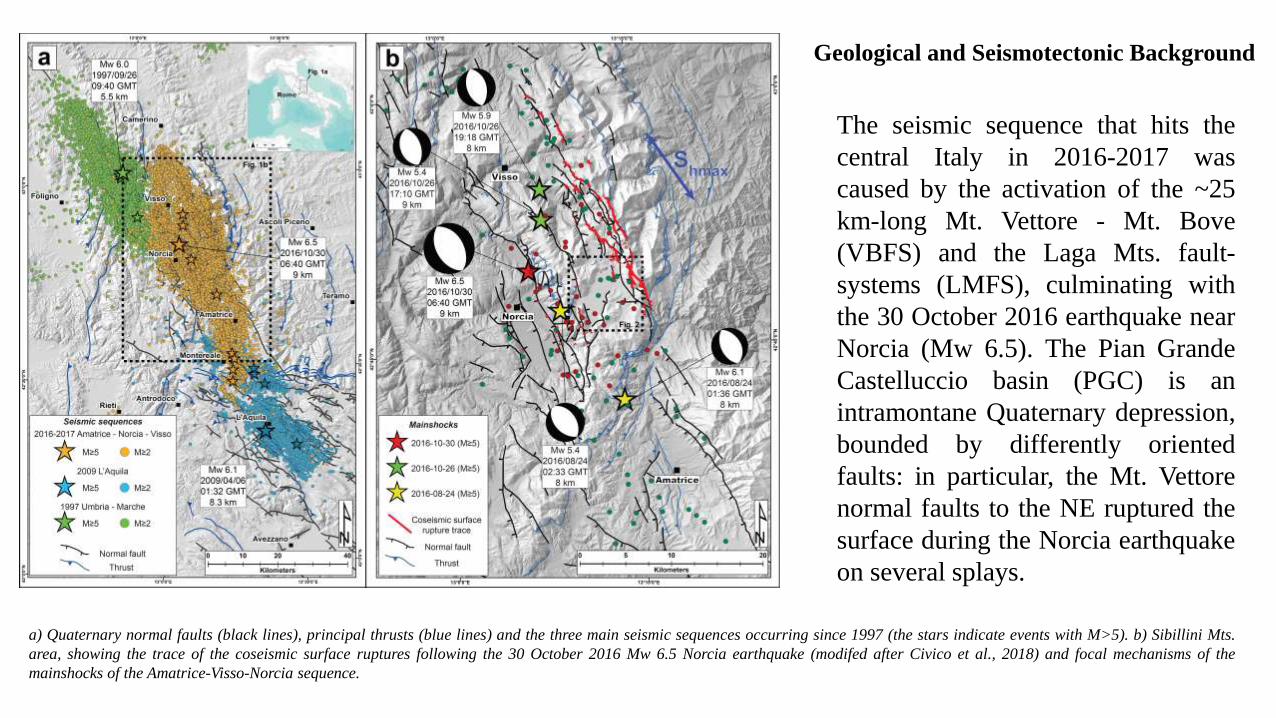
The seismic sequence that hits the
central Italy in 2016-2017 was
caused by the activation of the ~25
km-long Mt. Vettore - Mt. Bove
(VBFS) and the Laga Mts. fault-
systems (LMFS), culminating with
the 30 October 2016 earthquake near
Norcia (Mw 6.5). The Pian Grande
Castelluccio basin (PGC) is an
intramontane Quaternary depression,
bounded by differently oriented
faults: in particular, the Mt. Vettore
normal faults to the NE ruptured the
surface during the Norcia earthquake
on several splays.
a) Quaternary normal faults (black lines), principal thrusts (blue lines) and the three main seismic sequences occurring since 1997 (the stars indicate events with M>5). b) Sibillini Mts.
area, showing the trace of the coseismic surface ruptures following the 30 October 2016 Mw 6.5 Norcia earthquake (modifed after Civico et al., 2018) and focal mechanisms of the
mainshocks of the Amatrice-Visso-Norcia sequence.
Geological and Seismotectonic Background
Previous Geophysical Results
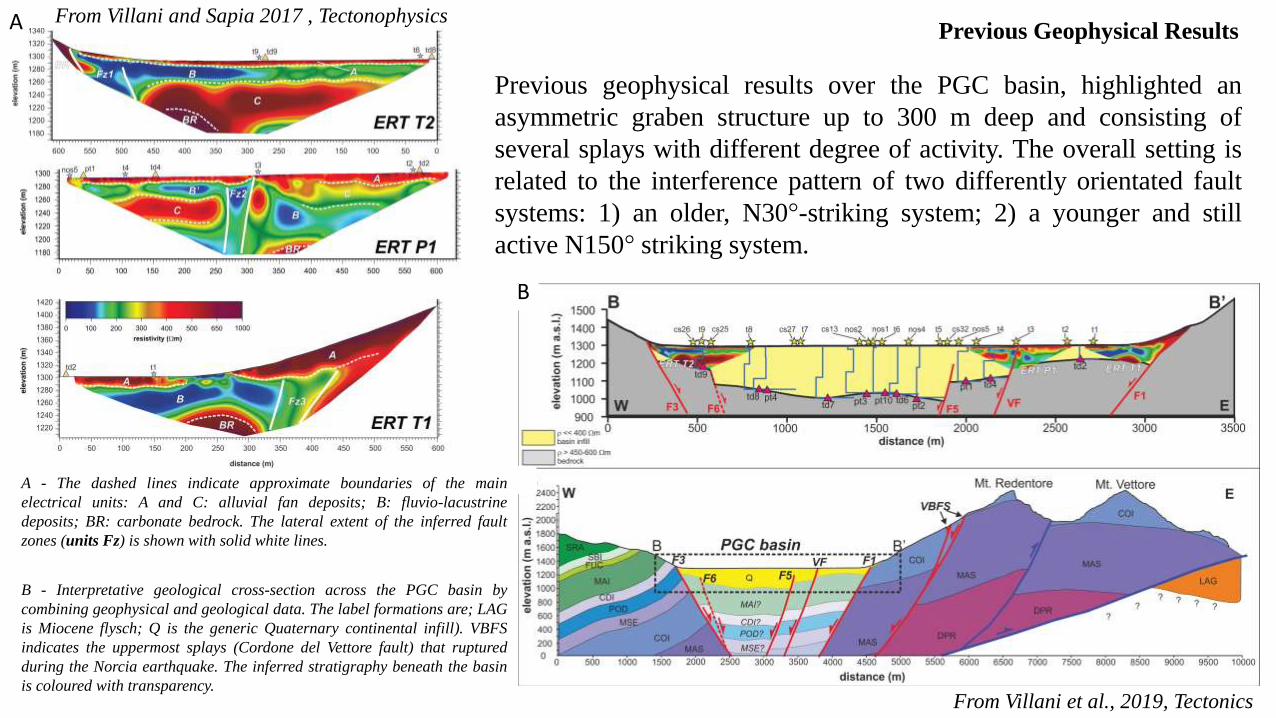
Previous geophysical results over the PGC basin, highlighted an
asymmetric graben structure up to 300 m deep and consisting of
several splays with different degree of activity. The overall setting is
related to the interference pattern of two differently orientated fault
systems: 1) an older, N30°-striking system; 2) a younger and still
active N150° striking system.
From Villani and Sapia 2017 , Tectonophysics
From Villani et al., 2019, Tectonics
A - The dashed lines indicate approximate boundaries of the main
electrical units: A and C: alluvial fan deposits; B: fluvio-lacustrine
deposits; BR: carbonate bedrock. The lateral extent of the inferred fault
zones (units Fz) is shown with solid white lines.
B - Interpretative geological cross-section across the PGC basin by
combining geophysical and geological data. The label formations are; LAG
is Miocene flysch; Q is the generic Quaternary continental infill). VBFS
indicates the uppermost splays (Cordone del Vettore fault) that ruptured
during the Norcia earthquake. The inferred stratigraphy beneath the basin
is coloured with transparency.
A
B
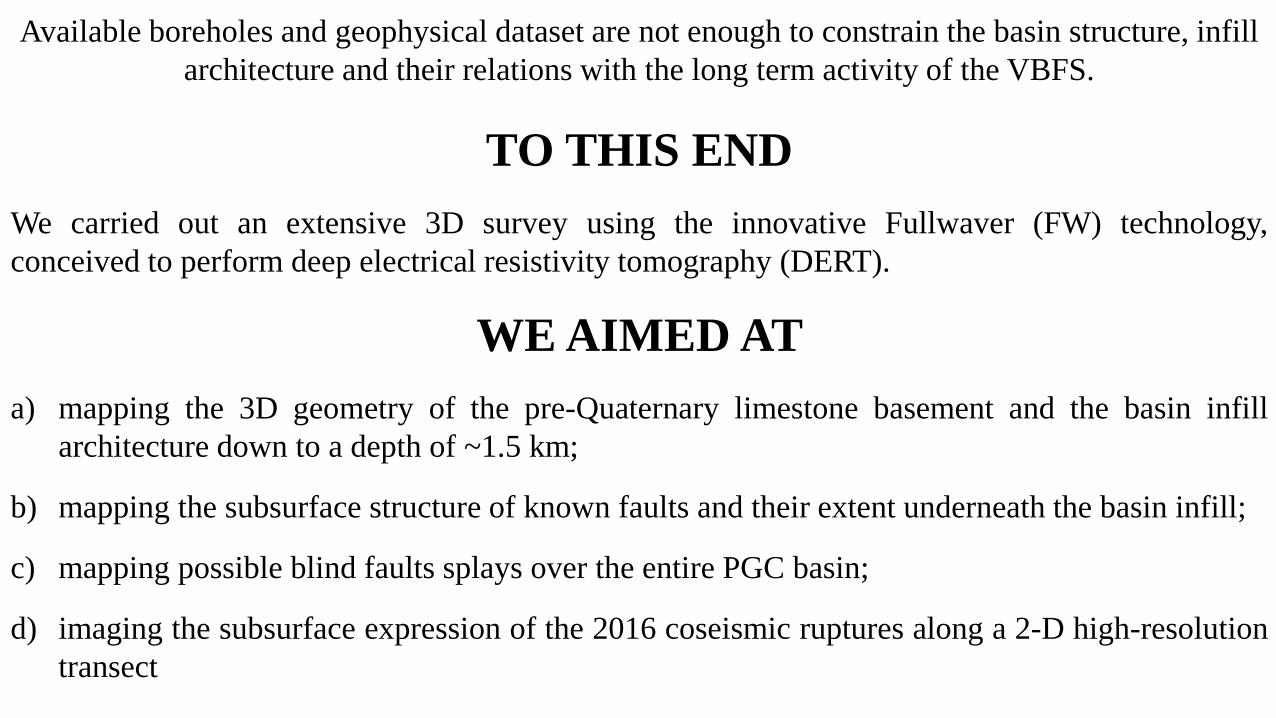
Available boreholes and geophysical dataset are not enough to constrain the basin structure, infill
architecture and their relations with the long term activity of the VBFS.
TO THIS END
We carried out an extensive 3D survey using the innovative Fullwaver (FW) technology,
conceived to perform deep electrical resistivity tomography (DERT).
WE AIMED AT
a) mapping the 3D geometry of the pre-Quaternary limestone basement and the basin infill
architecture down to a depth of ~1.5 km;
b) mapping the subsurface structure of known faults and their extent underneath the basin infill;
c) mapping possible blind faults splays over the entire PGC basin;
d) imaging the subsurface expression of the 2016 coseismic ruptures along a 2-D high-resolution
transect
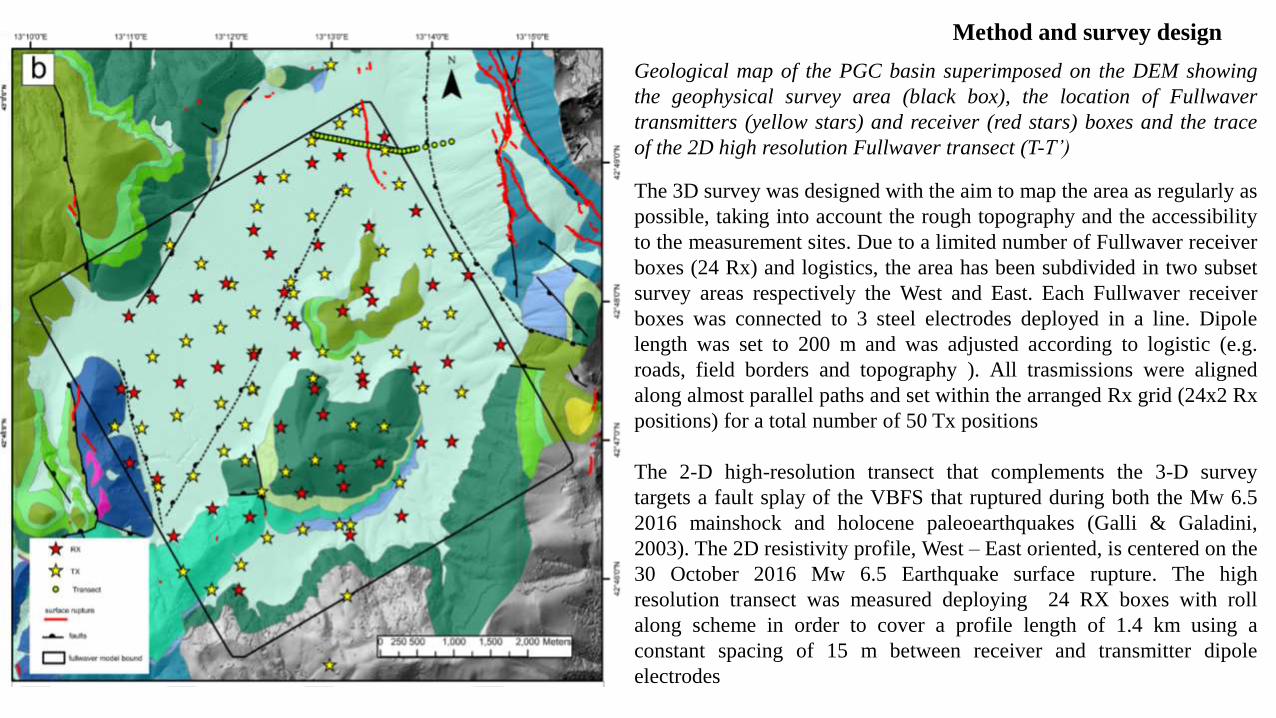
Geological map of the PGC basin superimposed on the DEM showing
the geophysical survey area (black box), the location of Fullwaver
transmitters (yellow stars) and receiver (red stars) boxes and the trace
of the 2D high resolution Fullwaver transect (T-T’)
Method and survey design
The 3D survey was designed with the aim to map the area as regularly as
possible, taking into account the rough topography and the accessibility
to the measurement sites. Due to a limited number of Fullwaver receiver
boxes (24 Rx) and logistics, the area has been subdivided in two subset
survey areas respectively the West and East. Each Fullwaver receiver
boxes was connected to 3 steel electrodes deployed in a line. Dipole
length was set to 200 m and was adjusted according to logistic (e.g.
roads, field borders and topography ). All trasmissions were aligned
along almost parallel paths and set within the arranged Rx grid (24x2 Rx
positions) for a total number of 50 Tx positions
The 2-D high-resolution transect that complements the 3-D survey
targets a fault splay of the VBFS that ruptured during both the Mw 6.5
2016 mainshock and holocene paleoearthquakes (Galli & Galadini,
2003). The 2D resistivity profile, West – East oriented, is centered on the
30 October 2016 Mw 6.5 Earthquake surface rupture. The high
resolution transect was measured deploying 24 RX boxes with roll
along scheme in order to cover a profile length of 1.4 km using a
constant spacing of 15 m between receiver and transmitter dipole
electrodes
Method and survey design
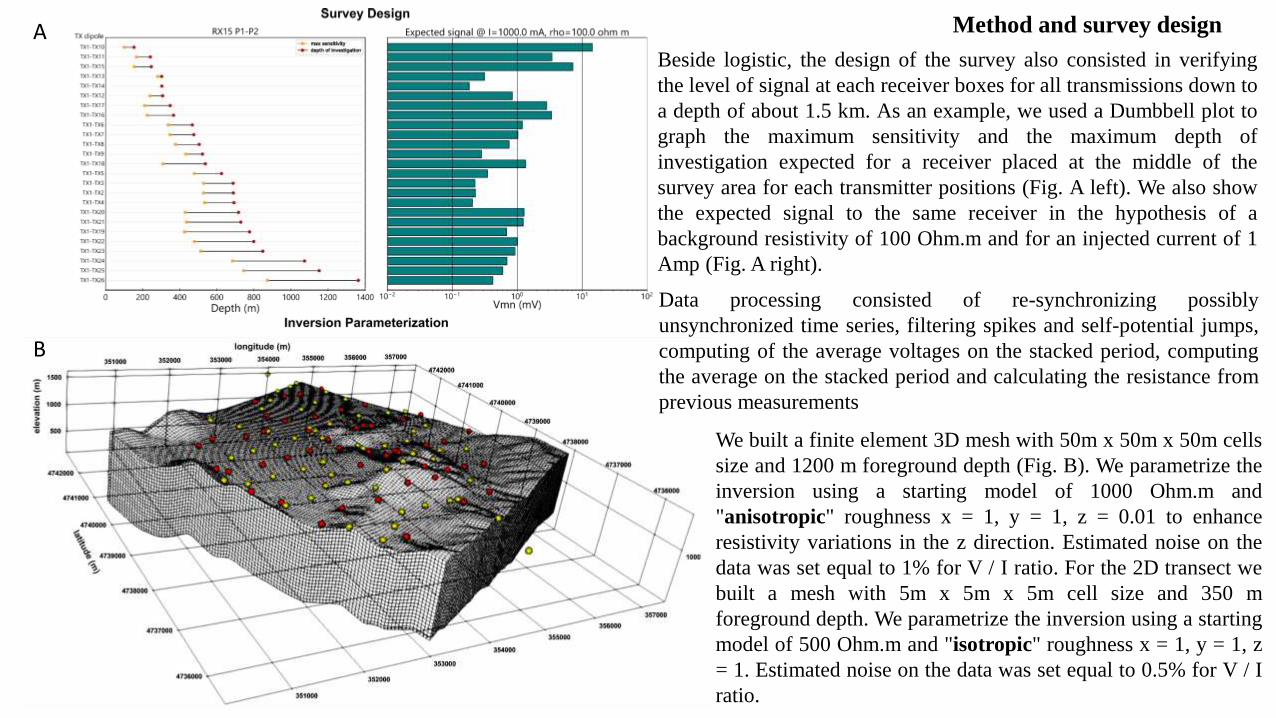
Beside logistic, the design of the survey also consisted in verifying
the level of signal at each receiver boxes for all transmissions down to
a depth of about 1.5 km. As an example, we used a Dumbbell plot to
graph the maximum sensitivity and the maximum depth of
investigation expected for a receiver placed at the middle of the
survey area for each transmitter positions (Fig. A left). We also show
the expected signal to the same receiver in the hypothesis of a
background resistivity of 100 Ohm.m and for an injected current of 1
Amp (Fig. A right).
A
B
We built a finite element 3D mesh with 50m x 50m x 50m cells
size and 1200 m foreground depth (Fig. B). We parametrize the
inversion using a starting model of 1000 Ohm.m and
"anisotropic" roughness x = 1, y = 1, z = 0.01 to enhance
resistivity variations in the z direction. Estimated noise on the
data was set equal to 1% for V / I ratio. For the 2D transect we
built a mesh with 5m x 5m x 5m cell size and 350 m
foreground depth. We parametrize the inversion using a starting
model of 500 Ohm.m and "isotropic" roughness x = 1, y = 1, z
= 1. Estimated noise on the data was set equal to 0.5% for V / I
ratio.
Data processing consisted of re-synchronizing possibly
unsynchronized time series, filtering spikes and self-potential jumps,
computing of the average voltages on the stacked period, computing
the average on the stacked period and calculating the resistance from
previous measurements
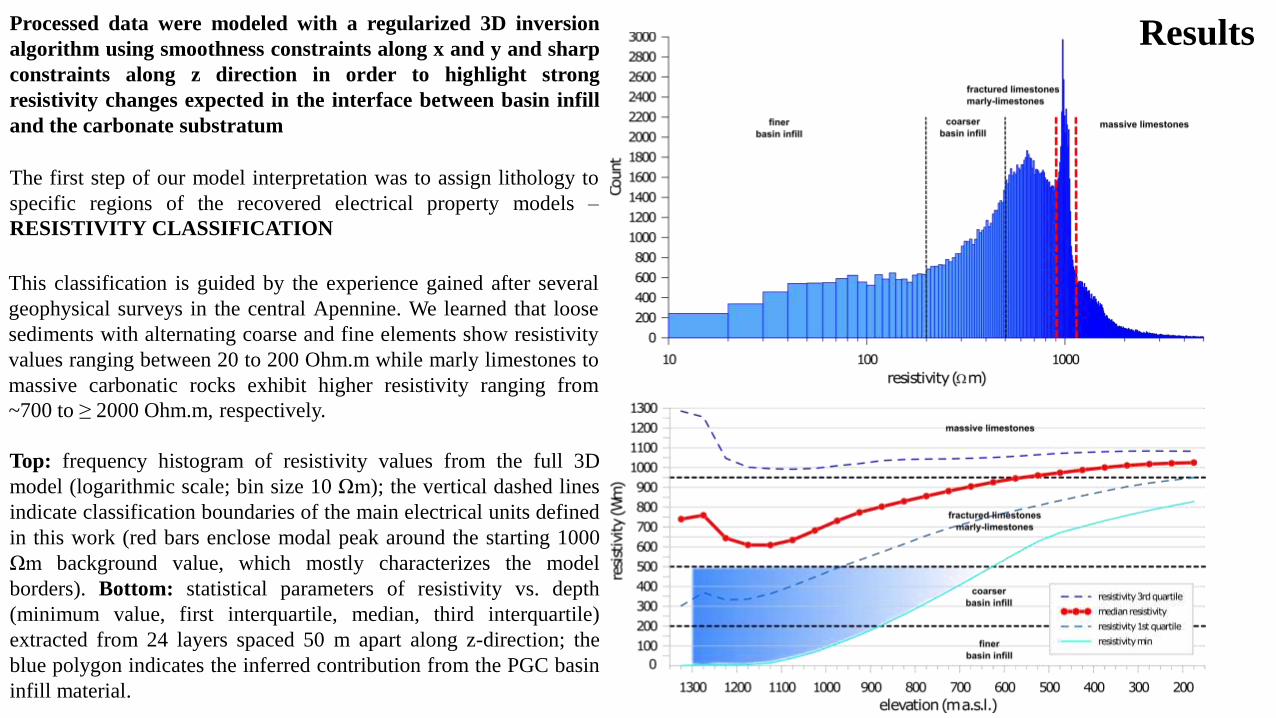
Results
The first step of our model interpretation was to assign lithology to
specific regions of the recovered electrical property models –
RESISTIVITY CLASSIFICATION
Top: frequency histogram of resistivity values from the full 3D
model (logarithmic scale; bin size 10 Ωm); the vertical dashed lines
indicate classification boundaries of the main electrical units defined
in this work (red bars enclose modal peak around the starting 1000
Ωm background value, which mostly characterizes the model
borders). Bottom: statistical parameters of resistivity vs. depth
(minimum value, first interquartile, median, third interquartile)
extracted from 24 layers spaced 50 m apart along z-direction; the
blue polygon indicates the inferred contribution from the PGC basin
infill material.
This classification is guided by the experience gained after several
geophysical surveys in the central Apennine. We learned that loose
sediments with alternating coarse and fine elements show resistivity
values ranging between 20 to 200 Ohm.m while marly limestones to
massive carbonatic rocks exhibit higher resistivity ranging from
~700 to ≥ 2000 Ohm.m, respectively.
Processed data were modeled with a regularized 3D inversion
algorithm using smoothness constraints along x and y and sharp
constraints along z direction in order to highlight strong
resistivity changes expected in the interface between basin infill
and the carbonate substratum
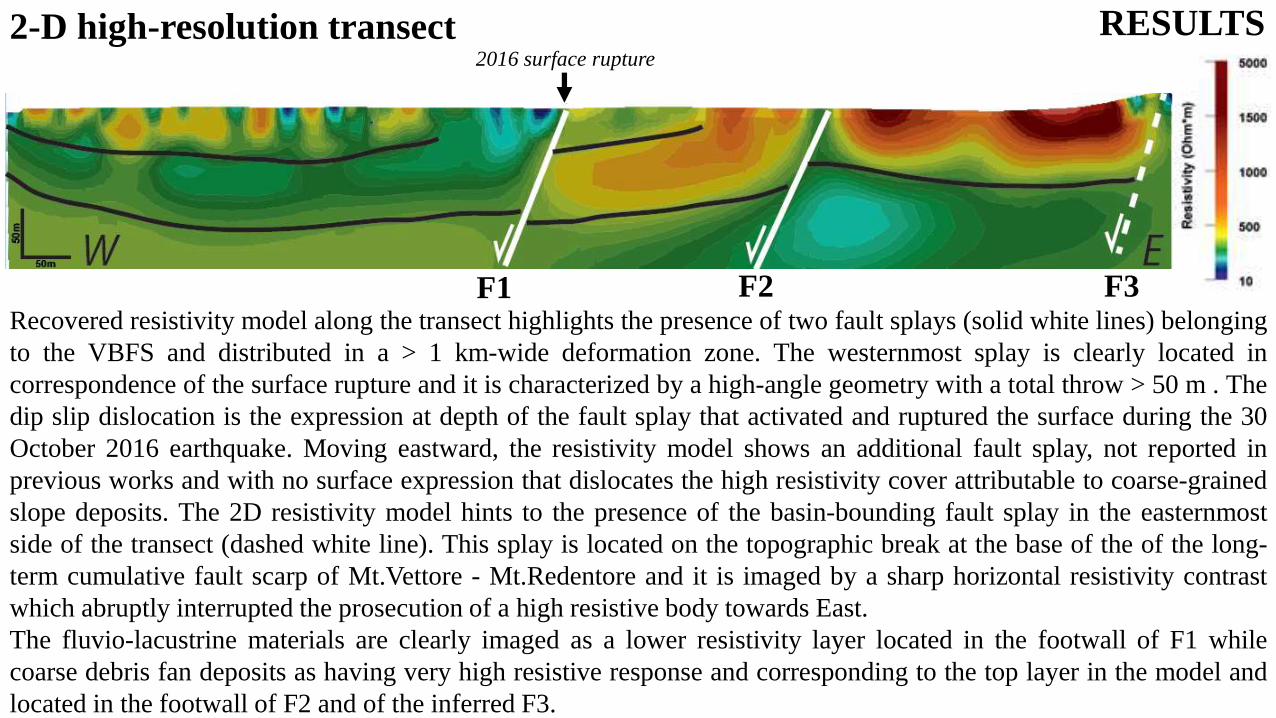
2016 surface rupture
RESULTS
Recovered resistivity model along the transect highlights the presence of two fault splays (solid white lines) belonging
to the VBFS and distributed in a > 1 km-wide deformation zone. The westernmost splay is clearly located in
correspondence of the surface rupture and it is characterized by a high-angle geometry with a total throw > 50 m . The
dip slip dislocation is the expression at depth of the fault splay that activated and ruptured the surface during the 30
October 2016 earthquake. Moving eastward, the resistivity model shows an additional fault splay, not reported in
previous works and with no surface expression that dislocates the high resistivity cover attributable to coarse-grained
slope deposits. The 2D resistivity model hints to the presence of the basin-bounding fault splay in the easternmost
side of the transect (dashed white line). This splay is located on the topographic break at the base of the of the long-
term cumulative fault scarp of Mt.Vettore - Mt.Redentore and it is imaged by a sharp horizontal resistivity contrast
which abruptly interrupted the prosecution of a high resistive body towards East.
The fluvio-lacustrine materials are clearly imaged as a lower resistivity layer located in the footwall of F1 while
coarse debris fan deposits as having very high resistive response and corresponding to the top layer in the model and
located in the footwall of F2 and of the inferred F3.
2-D high-resolution transect
F1 F2 F3
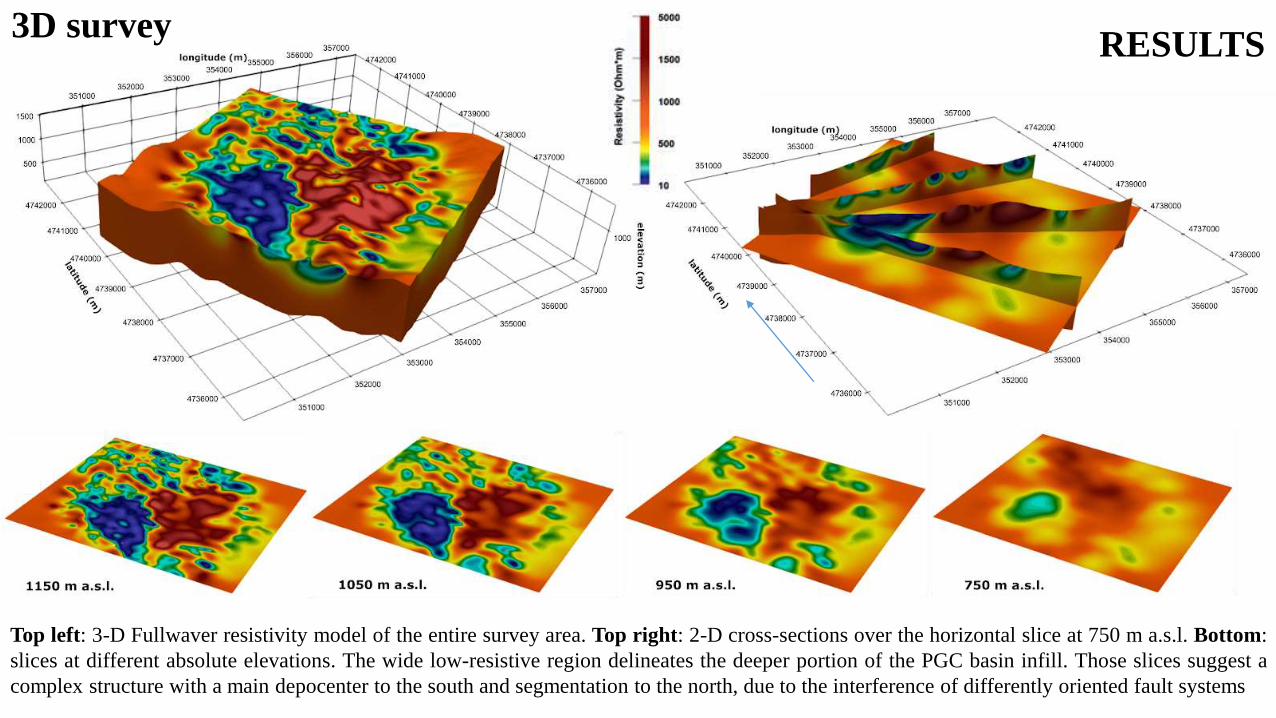
3D surveyRESULTS
Top left: 3-D Fullwaver resistivity model of the entire survey area. Top right: 2-D cross-sections over the horizontal slice at 750 m a.s.l. Bottom:
slices at different absolute elevations. The wide low-resistive region delineates the deeper portion of the PGC basin infill. Those slices suggest a
complex structure with a main depocenter to the south and segmentation to the north, due to the interference of differently oriented fault systems

Two simplified geological cross—sections in the northern (A-
A’) and the southern part of the basin (B-B’) – see left panel for
the location of the interpreted sections
A
A’
B B’

Sketch of possible deep fault networks
as inferred from the recovered 3D
resistivity model (elevation slice at 900
m a.s.l.).
Warning: very preliminary, this
scheme needs to be checked with other
information (i.e. high-resolution seismic
profiles already acquired in the area and
which data processing are still under
review)

CONCLUSIONS
1 – Large-scale structure of the PGC basin mainly consists of: a) a main depocenter to the
south, > 500 m deep; b) complex segmented and shallower basin to the north.
2 - Main resistivity anomalies trend parallel to the main splays of the VBFS (N150°-170°) in the
northern part of the PGC basin while, in the southern part, they appear to parallel the oldest
faults system (N20°-30°), suggesting the interplay of different fault through time.
3 - Low-resistivity round-shaped anomalies in the Mesozoic substratum to the east of the basin
hints for inherited Miocene compressional structure as shown in the inset below (sub-parallel
to the regional Sibillini thrust).
ReferencesGaladini F., Galli P. (2003), Ann. Geophys., 46(5), 815-836, https://doi.org/10.4401/ag-3457.
Villani F., Sapia V. (2017), Tectonophysics, 717(16), 628-644, https://doi.org/10.1016/j.tecto.2017.08.001
Villani et al., (2019), Tectonics, 38, (1), 26-48, https://doi.org/10.1029/2018TC005205
Civico, R., et al., (2018). Journal of Maps, 14(2), 151–160, https://doi.org/10.1080/17445647.2018.1441756
Acknowledgements
This work was funded by Project Top-Down FISR 2016 “L’Italia Centrale in 4D e ricostruzione dei processi geodinamici in atto” TASK 1.2 “Sviluppo di
prospezioni geosiche e tecniche di misura innovative ad alta risoluzione per la caratterizzazione del sottosuolo e della deformazione di bacini continentali nell'area
epicentrale della sequenza di Amatrice-Visso-Norcia” (Resp: Vincenzo Sapia, Fabio Villani; Chief L. Improta)
N