A deep all-sky census of the Hyades - arXiv
15
arXiv:1105.6093v1 [astro-ph.GA] 30 May 2011 Astronomy & Astrophysics manuscript no. 16948 c ESO 2018 September 17, 2018 A deep all-sky census of the Hyades S. R ¨ oser 1 , E. Schilbach 1 , A.E. Piskunov 1,2,3 , N.V. Kharchenko 1,3,4 , and R.-D. Scholz 3 1 Astronomisches Rechen-Institut, Zentrum f¨ ur Astronomie der Universit¨ at Heidelberg, M¨ onchhofstraße 12-14, D–69120 Heidelberg, Germany email: [email protected], [email protected], [email protected], [email protected], 2 Institute of Astronomy of the Russian Acad. Sci., 48 Pyatnitskaya Str., 109017 Moscow, Russia email: [email protected] 3 Astrophysikalisches Institut Potsdam, An der Sternwarte 16, D–14482 Potsdam, Germany email: [email protected],[email protected], [email protected] 4 Main Astronomical Observatory, 27 Academica Zabolotnogo Str., 03680 Kiev, Ukraine email: [email protected] Received March 24, 2011; accepted May 12, 2011 ABSTRACT Aims. On the basis of the PPMXL catalogue we perform an all-sky census of the Hyades down to masses of about 0.2 m ⊙ in a region up to 30 pc from the cluster centre. Methods. We use the proper motions from PPMXL in the convergent point method to determine probable kinematic members. From 2MASS photometry and CMC14 r ′ -band photometry, we derive empirical colour-absolute magnitude diagrams and, finally, determine photometric membership for all kinematic candidates. Results. This is the first deep (r ′ ≤ 17) all-sky survey of the Hyades allowing a full three-dimensional analysis of the cluster. The survey is complete down to at least M Ks = 7.3 or 0.25 m ⊙ . We find 724 stellar systems co-moving with the bulk Hyades space velocity, which represent a total mass of 435 m ⊙ . The tidal radius is about 9 pc, and 275 m ⊙ (364 systems) are gravitationally bound. This is the cluster proper. Its mass density profile is perfectly fitted by a Plummer model with a central density of 2.21 m ⊙ pc −3 and a core radius of r co = 3.10 pc, while the half-mass radius is r h = 4.1 pc. There are another 100 m ⊙ in a volume between one and two tidal radii (halo), and another 60 m ⊙ up to a distance of 30 pc from the centre. Strong mass segregation is inherent in the cluster. The present-day luminosity and mass functions are noticeably different in various parts of the cluster (core, corona, halo, and co-movers). They are strongly evolved compared to presently favoured initial mass functions. The analysis of the velocity dispersion of the cluster shows that about 20% of its members must be binaries. As a by-product, we find that presently available theoretical isochrones are not able to adequately describe the near-infrared colour-absolute magnitude relation for those cluster stars that are less massive than about 0.6 m ⊙ . Key words. open clusters and associations: individual: Hyades; Stars: luminosity function, mass function; Hertzsprung-Russell and C-M diagrams 1. Introduction Without doubt, the Hyades are one of the best-studied open clusters in our Galaxy. Its proximity to the Sun has made it an interesting target for centuries, so it is impossible here to give appropriate credit to all the astronomers who worked on the Hyades. With no claim to completeness, we mention here the studies by van Bueren (1952), van Altena (1969), Pels et al. (1975), Hanson (1975), Gunn et al. (1988), and Reid (1992). Recently, Hogan et al. (2008) have surveyed some 275 deg 2 of the Hyades based on a combination of 2MASS and UKIDSS observations. Loosely speaking, we distinguish between pencil beam stud- ies and those relying on an all-sky survey. All the above- mentioned studies are pencil beam studies since they only cover a limited field-of-view, even if it is as large as 275 deg 2 in the case of Hogan et al. (2008). On the sphere, this only corresponds to a distance of 7.3 pc from the Hyades centre. Pencil beam stud- ies are based on dedicated observations and may comprise a vari- ety of astrophysical parameters. They can only indirectly reveal the full three-dimensional structure of the cluster. Send offprint requests to: S. R ¨ oser An all-sky survey allows studying the cluster in its full three- dimensional extent, but one usually relies on the few avail- able data entries in the survey, e.g. proper motions or photom- etry in a few bands. Of these studies we mention the work by Schwan (1991) using the old PPM and FK5 catalogues and the papers based on the Hipparcos observations by Perryman et al. (1998) and de Bruijne et al. (2001). These all-sky studies were restricted to stars brighter than about V ≈ 11 to 12 (Hipparcos) without being complete to this magnitude. As far as membership of individual stars in the Hyades cluster is concerned, the results of the studies above were col- lected in the Prosser & Stauffer data base (presently available from J. Stauffer, priv. comm.) some fifteen years ago. Prosser & Stauffer’s data base was assumed to be complete down to 0.1 m ⊙ (Bouvier et al., 2008). Much effort has since been dedicated to the search for very low-mass (below 0.1 m ⊙ ) Hyades candi- dates. These attempts have been partly unsuccessful (Gizis et al., 1999), or resulted in the confirmation of membership of only one M8.5 dwarf (Reid & Hawley, 1999). Hogan et al. (2008) report the detection of 12 L-dwarfs in a 275 deg 2 field of view, and Bouvier et al. (2008) describe the detection of two brown dwarfs in an area of 16 deg 2 around the Hyades centre. 1
Transcript of A deep all-sky census of the Hyades - arXiv

arX
iv:1
105.
6093
v1 [
astr
o-ph
.GA
] 30
May
201
1Astronomy & Astrophysicsmanuscript no. 16948 c© ESO 2018September 17, 2018
A deep all-sky census of the HyadesS. Roser1, E. Schilbach1, A.E. Piskunov1,2,3, N.V. Kharchenko1,3,4, and R.-D. Scholz3
1 Astronomisches Rechen-Institut, Zentrum fur Astronomieder Universitat Heidelberg, Monchhofstraße 12-14, D–69120 Heidelberg,Germanyemail: [email protected], [email protected], [email protected], [email protected],
2 Institute of Astronomy of the Russian Acad. Sci., 48 Pyatnitskaya Str., 109017 Moscow, Russiaemail: [email protected]
3 Astrophysikalisches Institut Potsdam, An der Sternwarte 16, D–14482 Potsdam, Germanyemail: [email protected],[email protected], [email protected]
4 Main Astronomical Observatory, 27 Academica Zabolotnogo Str., 03680 Kiev, Ukraineemail: [email protected]
Received March 24, 2011; accepted May 12, 2011
ABSTRACT
Aims. On the basis of the PPMXL catalogue we perform an all-sky census of the Hyades down to masses of about 0.2 m⊙ in a regionup to 30 pc from the cluster centre.Methods. We use the proper motions from PPMXL in the convergent point method to determine probable kinematic members. From2MASS photometry and CMC14r′-band photometry, we derive empirical colour-absolute magnitude diagrams and, finally, determinephotometric membership for all kinematic candidates.Results. This is the first deep (r′ ≤ 17) all-sky survey of the Hyades allowing a full three-dimensional analysis of the cluster. Thesurvey is complete down to at leastMKs = 7.3 or 0.25 m⊙. We find 724 stellar systems co-moving with the bulk Hyades space velocity,which represent a total mass of 435 m⊙. The tidal radius is about 9 pc, and 275 m⊙ (364 systems) are gravitationally bound. This is thecluster proper. Its mass density profile is perfectly fitted by a Plummer model with a central density of 2.21 m⊙pc−3 and a core radiusof rco = 3.10 pc, while the half-mass radius is rh = 4.1 pc. There are another 100 m⊙ in a volume between one and two tidal radii(halo), and another 60 m⊙ up to a distance of 30 pc from the centre. Strong mass segregation is inherent in the cluster. The present-dayluminosity and mass functions are noticeably different in various parts of the cluster (core, corona, halo, and co-movers). They arestrongly evolved compared to presently favoured initial mass functions. The analysis of the velocity dispersion of thecluster showsthat about 20% of its members must be binaries. As a by-product, we find that presently available theoretical isochrones are not ableto adequately describe the near-infrared colour-absolutemagnitude relation for those cluster stars that are less massive than about 0.6m⊙.
Key words. open clusters and associations: individual: Hyades; Stars: luminosity function, mass function; Hertzsprung-Russell andC-M diagrams
1. Introduction
Without doubt, the Hyades are one of the best-studied openclusters in our Galaxy. Its proximity to the Sun has made itan interesting target for centuries, so it is impossible here togive appropriate credit to all the astronomers who worked onthe Hyades. With no claim to completeness, we mention herethe studies by van Bueren (1952), van Altena (1969), Pels et al.(1975), Hanson (1975), Gunn et al. (1988), and Reid (1992).Recently, Hogan et al. (2008) have surveyed some 275 deg2 ofthe Hyades based on a combination of 2MASS and UKIDSSobservations.
Loosely speaking, we distinguish between pencil beam stud-ies and those relying on an all-sky survey. All the above-mentioned studies are pencil beam studies since they only covera limited field-of-view, even if it is as large as 275 deg2 in thecase of Hogan et al. (2008). On the sphere, this only correspondsto a distance of 7.3 pc from the Hyades centre. Pencil beam stud-ies are based on dedicated observations and may comprise a vari-ety of astrophysical parameters. They can only indirectly revealthe full three-dimensional structure of the cluster.
Send offprint requests to: S. Roser
An all-sky survey allows studying the cluster in its full three-dimensional extent, but one usually relies on the few avail-able data entries in the survey, e.g. proper motions or photom-etry in a few bands. Of these studies we mention the work bySchwan (1991) using the old PPM and FK5 catalogues and thepapers based on the Hipparcos observations by Perryman et al.(1998) and de Bruijne et al. (2001). These all-sky studies wererestricted to stars brighter than aboutV ≈ 11 to 12 (Hipparcos)without being complete to this magnitude.
As far as membership of individual stars in the Hyadescluster is concerned, the results of the studies above were col-lected in the Prosser & Stauffer data base (presently availablefrom J. Stauffer, priv. comm.) some fifteen years ago. Prosser &Stauffer’s data base was assumed to be complete down to 0.1m⊙ (Bouvier et al., 2008). Much effort has since been dedicatedto the search for very low-mass (below 0.1 m⊙) Hyades candi-dates. These attempts have been partly unsuccessful (Giziset al.,1999), or resulted in the confirmation of membership of only oneM8.5 dwarf (Reid & Hawley, 1999). Hogan et al. (2008) reportthe detection of 12 L-dwarfs in a 275 deg2 field of view, andBouvier et al. (2008) describe the detection of two brown dwarfsin an area of 16 deg2 around the Hyades centre.
1
S. Roser et al.: A deep all-sky census of the Hyades
Using PPMXL (Roeser, Demleitner & Schilbach, 2010) wecan, for the first time, extend previous studies by going as deepin magnitude as the pencil beam studies and still performingan all-sky survey. We supply a complete sample of candidateswithin 30 pc from the centre, determine individual distances tothe stars, and so resolve the full three-dimensional spatial struc-ture of the Hyades, and its immediate neighbourhood, from themost massive stars down to almost 0.1 m⊙ by an application ofthe convergent method to the proper motions in PPMXL.
The paper has the following structure: in the next sectionwe briefly introduce the observational dataset from PPMXL weare using. In section 3 we describe the convergent point method.Then, in section 4 we define our criteria for membership deter-mination and discuss the amount of possible contamination ofthe sample. We compare the empirically derived colour-absolutemagnitude diagram of the Hyades with theoretical isochrones insection 4.4. In section 5 we reveal the spatial structure of theHyades and derive the shape parameters of the cluster. Section6 is devoted to the present-day luminosity and mass functions.Then we discuss the internal velocity dispersion in section7,and, finally we summarise our results in section 8.
2. Observations
As primary data of observations we use the PPMXL catalogue(Roeser, Demleitner & Schilbach, 2010). PPMXL containspositions and proper motions on the ICRS for some 900 millionstars (from the brightest stars down to aboutV ≈ 20) and coversthe complete sky. PPMXL also gives low-accuracy photometryfrom USNO-B1.0 (Monet et al., 2003), a subset of 410 millionstars contains 2MASS (Skrutskie et al., 2006) photometry. Thetypical individual mean errors of the proper motions rangefrom better than 2 mas/y for the brightest stars with Tycho-2(Høg et al., 2000) observations to more than 10 mas/y for thefaintest stars in the region south of -30 declination. For the 2.5million brightest stars Tycho-2B,V photometry is available.
For this work we cross-matched PPMXLwith UCAC3 (Zacharias et al., 2010) and CMC14(Copenhagen Univ. Obs. et al. , 2006). We combined thepositions and proper motions of PPMXL with the positionsfrom CMC14 and from UCAC3. The latter had to be recon-structed because the original positions of UCAC3 are notpublished. With these data we performed a weighted least-squares adjustment to derive new, improved, mean positionsand proper motions. In the following we refer to this subset ofPPMXL as the Carlsberg-UCAC (CU) subset. It turned out thatthe most important feature in the CU is the accurate photometryin at least one optical band from CMC14, ther′-magnitudes inthe SDSS system. CMC14 observed the sky in the declinationrange from -30 deg to about+52 deg, and it is 95% completedown tor′ = 16.8 and 80% to 17.0. Then completeness dropsrapidly (when compared to SDSS). Its limiting magnitudeis r′ = 17.8 (Copenhagen Univ. Obs. et al. , 2006). The CUcontains some 140 million stars, 90 million of which haver′-magnitudes from CMC14.
The astrometric information for the≈ 120 000 Hipparcosstars is taken from the new reduction of the Hipparcos data byvan Leeuwen (2007) instead of the data contained in PPMXL,the cross-matches with 2MASS are kept as are theB,V magni-tudes from Tycho-2 of the Hipparcos stars.
3. Convergent point method
For a nearby open cluster like the Hyades the convergent pointmethod is a suitable tool to determine membership when onlyproper motions and (for a representative subset) radial veloci-ties are available. The method is textbook knowledge (see, e.g.Smart, 1968), and an excellent recent description can be foundin van Leeuwen (2009). Hence, we will not repeat a descriptionhere.
In this paper, we did not apply the convergent point methodfrom scratch, but used the six-dimensional phase space parame-ters for the Hyades cluster centre from Table 7 in van Leeuwen(2009). We use the galactic rectangular coordinate systemX, Y, Zwith origin in the Sun, and axes pointing to the Galactic Centre(X), to the direction of galactic rotation (Y), and the NorthGalactic Pole (Z). In galactic coordinates, we adopt [xc, yc, zc]= [-43.1, 0.7, -17.3] pc for the position and [uc, vc, wc] = [-41.1,-19.2, -1.4] kms−1 for the mean motion of the cluster centre. Inother words, the stars most accurately measured, Hipparcosstarsfrom the new reduction by van Leeuwen (2007), determine theposition and the motion of the Hyades cluster. Then the directionof the convergent point is also given, see Eq. 7 in van Leeuwen(2009).
Given the phase space parameters from van Leeuwen (2009),we search for all stars in the sky (in this case the PPMXL cata-logue, resp. the CU subset) which have proper motions consis-tent with the given space velocityvc = [uc, vc,wc] of the clustercentre. For each line-of-sight (α, δ) we can then express the vec-tor of the space velocity by one component vr parallel to theline-of-sight, the radial velocity, and one perpendicularto it vt,the tangential velocity (in the tangential plane). It is easy to seethat, for a Hyades member, the component ofvc parallel to theline-of-sight only depends on (α, δ), and not on the distance ofa star from the Sun. Hence, the same is true for the componentof vc in the tangential plane. The tangential velocity can be splitinto one component v‖ in the direction to the convergent point,and a component v⊥ perpendicular to it. The expectation valueof the latter is zero.
The PPMXL catalogue gives for each star the positions (α, δ)and the proper motions (µα, µδ), i.e. four of the six componentsof the phase space coordinates, the radial velocity vr and the dis-tance d from the Sun being the remaining two. A necessary con-dition for a star to be a kinematic member of the Hyades clusteris:
|vc − v| ≤ ǫ, (1)
wherev = [u,v,w] is the space velocity of a candidate andǫ is asuitable bound. As long as the radial velocity vr is not measured,we adopt as vr the projection of the cluster motionvc to the line-of-sight.
At each position (α, δ) the proper motions (µα, µδ) can berotated into the direction of v‖ and v⊥. We call these motioncomponentsµ‖ andµ⊥. The remaining parameter, distance d orparallax, is given by
= f ×µ‖
v‖(2)
where f = 4.74 kms−1kpc−1 and is the so-called secular par-allax. As the method fixes vr as explained above and fromEq. 2, the necessary condition (Eq. 1) for kinematic membershipshrinks to|v⊥| ≤ ǫ. Since the expectation value of v⊥ is zero,< (v2
⊥) >12 is a measure for the one-dimensional velocity disper-
sion of the cluster.
2
S. Roser et al.: A deep all-sky census of the Hyades
The convergent point method predicts the radial velocity vrand the distance d from the Sun for a cluster candidate. A fi-nal confirmation as a member can be obtained by directly mea-suring vr and. Other than from trigonometric parallaxes, thedistance d from the Sun can be confirmed also by determiningphotometric parallaxes. The CU subset of PPMXL cataloguegives 2MASSJ,H,Ks-photometry plusr′-magnitudes. For the2.5 million brightest stars in PPMXLB andV magnitudes fromTycho-2 are available. These photometric data are used to con-firm or reject photometrically the parallaxes from the convergentpoint method. The radial velocities vr can only be confirmed bydirect measurements.
4. Membership determination
4.1. Kinematic membership
The Hyades have a tidal radius of about 10 pc (see, e.g.Perryman et al., 1998) and an average velocity dispersion inonedimension of 0.23 kms−1 (Gunn et al., 1988). In this paper we donot concentrate only on the gravitationally bound cluster itself,it is also interesting to investigate the situation in the immediatesurroundings. There we expect to reveal former Hyades mem-bers which already left the cluster because of dynamical evolu-tion.
Therefore, we allow a boundǫ = 4 kms−1 for the velocitycomponent v⊥. Additionally, we have to take into account thatv‖ goes to zero when (α, δ) approaches the convergent point.This led us to set an upper boundη for the tangent of the an-gle between the proper motion vector and the direction to theconvergent point
v⊥v‖=
µ⊥µ‖≤ η.
At the cluster centreη = 1/6 corresponds to|v⊥| = 4kms−1,so we set this condition to hold everywhere in the cluster.
We also specified a third bound by requiring that the distancerc of a candidate from the cluster centre should be less than 30pc which is sufficiently large compared to the tidal radius.
These kinematic selection criteria are fulfilled by 15757 starsout of the 140 million contained in the CU subset. They are sub-ject to the photometric selection described in the next section. Atthis stage we excluded all candidate white dwarfs from furtherconsideration. White dwarfs in the Hyades are at the limit ofbe-ing observed in 2MASS, and if so, the photometric accuracy islow. That prevents us from using photometric distances of whitedwarfs from the CU to check their predicted secular parallaxes.We will investigate the white dwarfs associated with the Hyadesin a separate study.
4.2. Photometric membership
In the following we will check if the kinematically selectedstars populate allowed loci in the colour-absolute-magnitude di-agrams. As the candidates occupy a large magnitude range, thereis no unique CMD where all the stars have sufficiently accuratephotometry. Stars brighter thanV = 10 have good quality inB andV mainly from Tycho-2 (Høg et al., 2000), or ASCC-2.5(Kharchenko , 2001). On the other hand, stars fainter than aboutKs = 5 have good quality photometry from 2MASS and CMC14.
Fortunately, the interstellar reddenning towards the Hyadesis very low. In a critical review on reddening determinations ofthe Hyades Taylor (2006) concludes thatE(B− V) ≤ 1.0 mmag,
hence reddenning has been neglected in all future considera-tions.
Fig. 1. The MKs vs. r′ − Ks diagram of the kinematic candidates(small dots). The vast majority of the stars have kinematicallypredicted parallaxes inconsistent with their photometricparal-laxes. The candidates shown as thick dots are retained for fur-ther analysis. Stars brighter thanMKs ≈ 3.5 are not contained inCMC14.
For the absolutely brightest stars we rely on the classicalMV vs.B − V diagram for cross-checking the kinematically pre-dicted parallax with the photometric parallax. In fact, almostall the bright Hyades members have been observed by Hipparcosand their membership is settled (see, e.g. Perryman et al., 1998;de Bruijne et al., 2001; van Leeuwen, 2009).
For stars with masses less than about 0.6 m⊙ and the age andmetallicity of the Hyades there are discrepancies between dif-ferent theoretical isochrones, especially in the NIR. We discussthis in more detail in Sect. 4.4. As a consequence of this, wehave no choice but to select the Hyades candidates from an em-pirically derived colour-magnitude diagram obtained fromthedistribution of the kinematically selected candidates. IntheMKs
vs. J − Ks diagram the selection of low-mass stars (< 0.6 m⊙) ishampered by the fact that the colourJ − Ks is nearly constant.In a first step, we therefore used theMKs vs. r′ − Ks (Fig.1) andtheMKs vs.J−Ks (Fig. 2) diagrams to discard the large majorityof the 15757 kinematic candidates whose photometric parallaxeswere inconsistent with the predicted secular ones.
In order to work out more clearly the empirical Hyadesmain sequence, we selected, in Figs.1 and 2, only stars with|v⊥| ≤ 1 kms−1, i.e. the≈9000 most probable kinematic can-didates. In Fig.1 we show theMKs vs. r′ − Ks diagram of allthose 9000 stars (small dots) that haver′ magnitudes, i.e. thatare contained in CMC14. The stars brighter thanMKs ≈ 3.5are missing. They are not contained in CMC14, but their pho-tometric membership is determined from Tycho-2B,V photom-etry. The Hyades main sequence stands out prominently, and thecandidates are provisionally marked as thicker dots. Starsbelowthe Hyades sequence appear as sub-luminous stars and must bemuch farther away than Hyades members. In other words, theirparallax predicted from the kinematic selection is inconsistentwith the photometric parallax, and hence these stars cannotbe-long to the Hyades. In theMKs vs. J − Ks diagram for the samestars (Fig.2) we find a considerable density of stars at coloursJ − Ks between 0.8 and 1. We marked the candidate Hyades
3
S. Roser et al.: A deep all-sky census of the Hyades
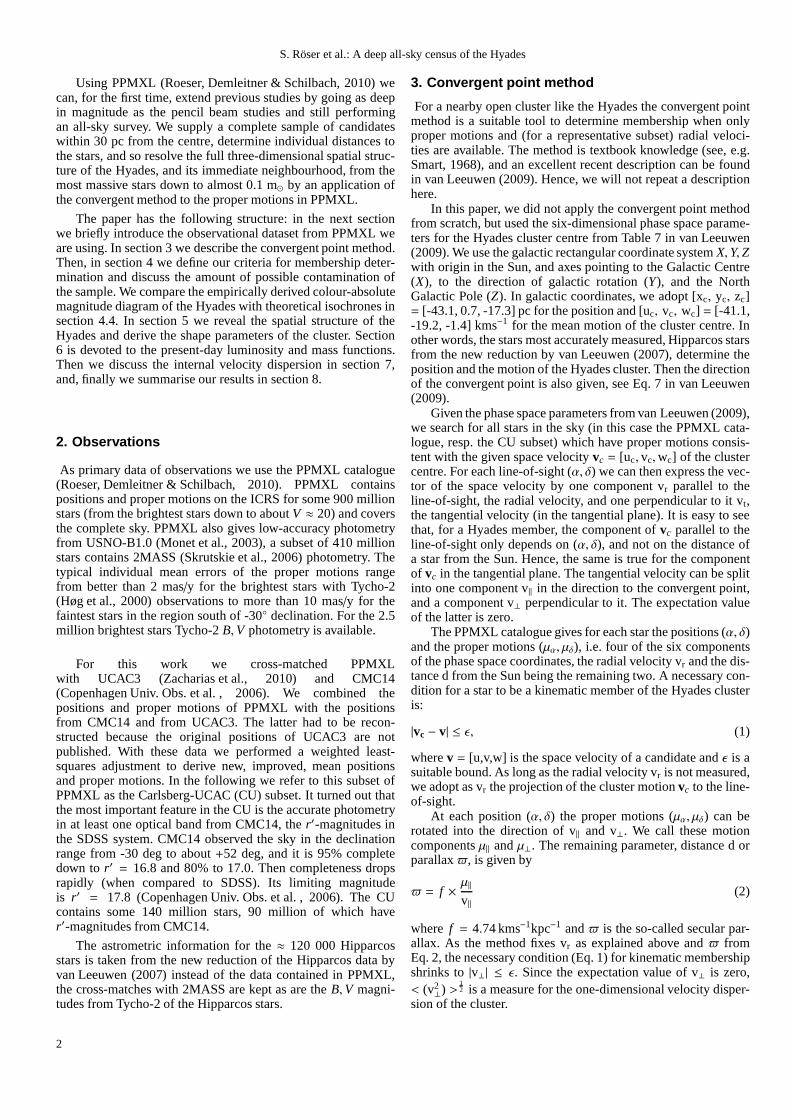
from Fig. 1 as thick dots also in Fig. 2. It is clearly visible thatNIR photometry alone is not sufficient to properly select faintstars withMKs ≥ 5: from Fig. 1 we find no Hyades candidateswith MKs > 9 although Fig.2 suggests plenty of them. Instead,all the candidates withMKs > 9 haver′ − Ks colours which areto blue, and this means that their predicted secular parallaxes aretoo large. We conclude that stars withMKs > 9 in the Hyades arebelow the limiting magnitude of CMC14.
Even if we consider the finite width of the Hyades sequencecaused by the presence of binaries, we still find a number of starsabove the sequence in both CMDs (Fig.1 and Fig. 2). In their ma-jority they are field giants or very seldomly foreground dwarfs.The former are discarded via the two-colour,J − H vs. H − Ks,diagram. In theMKs vs. J − Ks diagram we note a few whitedwarfs nearJ − Ks ≈ 0 and 11≤ MKs ≤ 14, but investigatingthem needs a different approach.
Fig. 2. TheMKs vs.J−Ks diagram of the candidates. Stars whichwere marked as thick dots in Fig. 1 are also marked as thick dotshere.
For the final selection we determined the lower bound of anempirical cluster sequence stepwise overr′ −Ks andJ −Ks, andselected all stars between this lower bound and the upper limitgiven by binaries. Out of the 15757 kinematically selected candi-dates, we could confirm the secular parallax via the photometricparallax for 775 stars.
4.3. Final membership selection
The sample of 775 kinematic and photometric candidates wascross-matched with the probable Hyades members from theProsser & Stauffer database. Out of their 536 candidates, 407were identified in our sample. Further, we found 6 stars whichbelong to the Hyades with certainty but have been missing inour list due to erroneous proper motions in PPMXL (checkedvia Vizier and Aladin). These stars were added to our sample togive a total of 781. The membership of the majority of the re-maining stars from the Prosser & Stauffer database has not beenconfirmed since they did not pass either the kinematic or photo-metric criteria. A few stars from Prosser & Stauffer are too faintto be observed in CMC14, so we could not check their member-ship in a proper way.
4.3.1. Contamination estimate
Although the kinematic and photometric criteria provide a pow-erful tool for selecting cluster candidates and enable us toisolate781 candidates out of 140 million on the whole sky, we cannot
exclude a certain contamination of our sample by field stars.Thecontamination can be estimated empirically by directly compar-ing the predicted parallaxes and radial velocities with thecor-responding measurements as far as these are available. Anotherapproach is to compute the probability of contamination from akinematic model of the Galaxy, or, alternatively, by consideringthe observed velocity dispersion of field stars in the solar vicin-ity. In the following we apply these methods to estimate probablecontamination of our Hyades sample.
For about 300 stars from the candidate list we could findHipparcos parallaxes and/or radial velocities in Vizier/Simbad.We call them “control stars” in the following. Whereas for themajority of the control stars the predicted and measured param-eters coincide well within the standard errors, 26 of them haveobserved parallaxes and/or radial velocities that differ signifi-cantly from the computed ones. We analysed their space co-ordinates predicted by the convergent point method and foundthat all of them are relatively far away from the cluster centre.Indeed, the membership was not confirmed for all control starswith |z−zc| > 20 pc (11 stars). The remaining 15 “wrong” controlstars are located at distances rc from the cluster centre larger than9 pc. From their distribution we estimate a 7.5% contaminationat 9 pc< rc < 18 pc, 30% at 18 pc< rc < 30 pc and 100% when-ever|z− zc| > 20 pc. Following this finding, we exclude all starsfrom the Hyades candidate sample which are located more than20 pc away from the cluster centre in z-direction. This leavesus with a sample of 724 candidates, and the formal applicationof the empirical rule found above predicts some 65 field starsamong these 724 Hyades candidates.
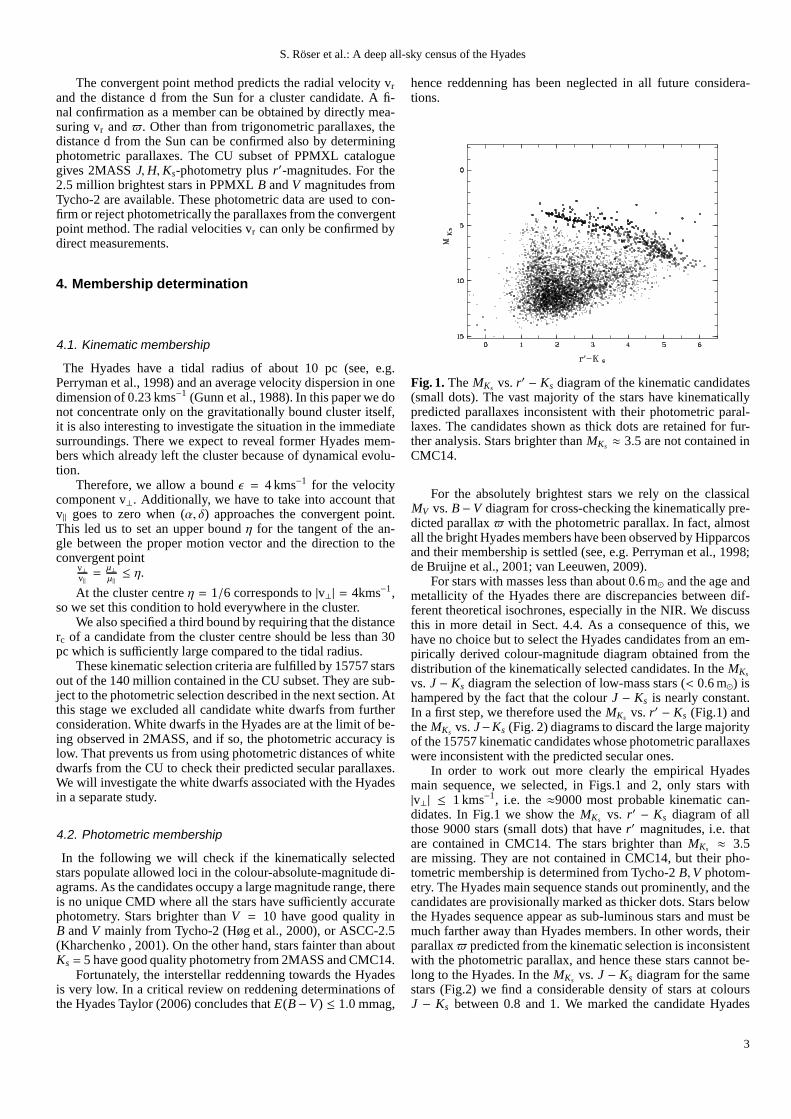
Fig. 3. The luminosity functions (LF) of the Hyades candidatesand of field stars in the solar vicinity.a: Solid lines and symbolsare the LFs of the Hyades at different distances from the clustercentre rc, black filled circles for rc < 9 pc, red open circles for9 pc< rc < 18 pc, blue crosses for 18 pc< rc < 30 pc. TheLF of nearby stars from the CNS4 (Jahreiß, H. , priv. comm.) isshown by the black dashed line whereas the black dotted line isthe fraction of field stars with space velocities comparableto thevelocity of the Hyades.b: The red open circles and blue crossesshow the adopted contamination of the Hyades sample of 7.5%at 9 pc< rc < 18 pc and 30% at 18 pc< rc < 30 pc, respectively.The black dotted line is the same as ina.
Since the control stars are relatively bright stars (see Fig. 4)that usually have astrometric and photometric data of better ac-
4
S. Roser et al.: A deep all-sky census of the Hyades
curacy, we must consider the possibility that the contamina-tion rate may be somewhat higher for the faintest stars of oursample. Therefore, we checked whether our empirical estimatefrom above coincides with the statistical predictions of galac-tic models within the complete magnitude range covered byour sample. We used the kinematic model of the Galaxy byKharchenko & Schilbach (1996) to estimate the number of fieldstars within a circle of a radius 5 deg from the cluster centreandwith proper motions compatible with Hyades membership in thisregion of the sky. The model predicts 5.06 such field stars in anarea of 78.54 deg2 in the direction of the Hyades. That suits per-fectly the number of 4.95 stars we obtain if we use the empiricalrule of the contamination estimates from above.
Further, we computed the probability for field stars in thelocal solar neighbourhood to have, by chance, the same spacevelocities as the Hyades members. Jahreiß (priv. comm.) hasre-cently determined the K-band luminosity function of the stars inthe solar neighbourhood from the CNS4, the new 4th Catalogof Nearby Stars (in preparation) from which we infer the vol-ume density of the local sample. The CNS4 luminosity functionis shown in Fig. 3a together with the luminosity functions ofthe 724 Hyades candidates at different distances from the clus-ter centre. The random contamination of our Hyades sampleis now determined by the percentage of stars having the samespace velocity [u, v,w] as the Hyades members with respect tothe local standard of rest (LSR). Corrected for the solar motionfrom Piskunov et al. (2006), the LSR velocity of the Hyades is[-31.8, -7.1,+6.1]. Assuming that the velocity distribution offield stars follows a three-dimensional normal distribution withstandard deviations given by the velocity dispersions, we com-pute the number of field stars with Hyades motion in the range0 ≤ MKs ≤ 8. We used the data from Dehnen & Binney (1998)who determined the velocity dispersions of field stars of differ-ent colours in the solar neighbourhood from Hipparcos measure-ments. Taking into account that only two velocity componentsare observed, we find that the percentage of random field starswith Hyades motion is less than 0.6× 10⁻² of the local density,and this is plotted as the dotted line at the bottom of Fig. 3a.
Since the spatial density of the Hyades candidates with rc <9 pc is, on average, by two orders of magnitude higher than thatexpected from the local density of field stars, we conclude thatcontamination is negligible for this volume. With increasing dis-tance from the cluster centre, the density of the Hyades starsis decreasing, and the probability of contamination becomeshigher. For comparison we show in Fig.3b the contribution offield stars (the same as in Fig. 3a) together with the contamina-tion expected in outer regions, like what we obtained empiricallya few paragraphs above. For 9 pc< rc < 18 pc, the contamina-tion by field stars is always less than the estimated 7.5%, exceptfor the faintest stars withMKs > 8 where our catalogue becomesincomplete. Also in the region 18 pc< rc < 30 pc, the contam-ination of 30% from our empirical finding coincides well withthe statistical estimates in this magnitude range.
To summarise: in the following, our study is based on a sam-ple of 724 Hyades candidates. The contamination by field starsis assumed to be dependent on the distance rc from the clustercentre: a negligible contamination at rc < 9 pc, 7.5% at 9 pc< rc < 18 pc, and 30% at 18 pc< rc < 30 pc. This is taken intoaccount when we discuss the density distribution in the Hyadescluster, its luminosity and mass functions.
4.3.2. The final sample
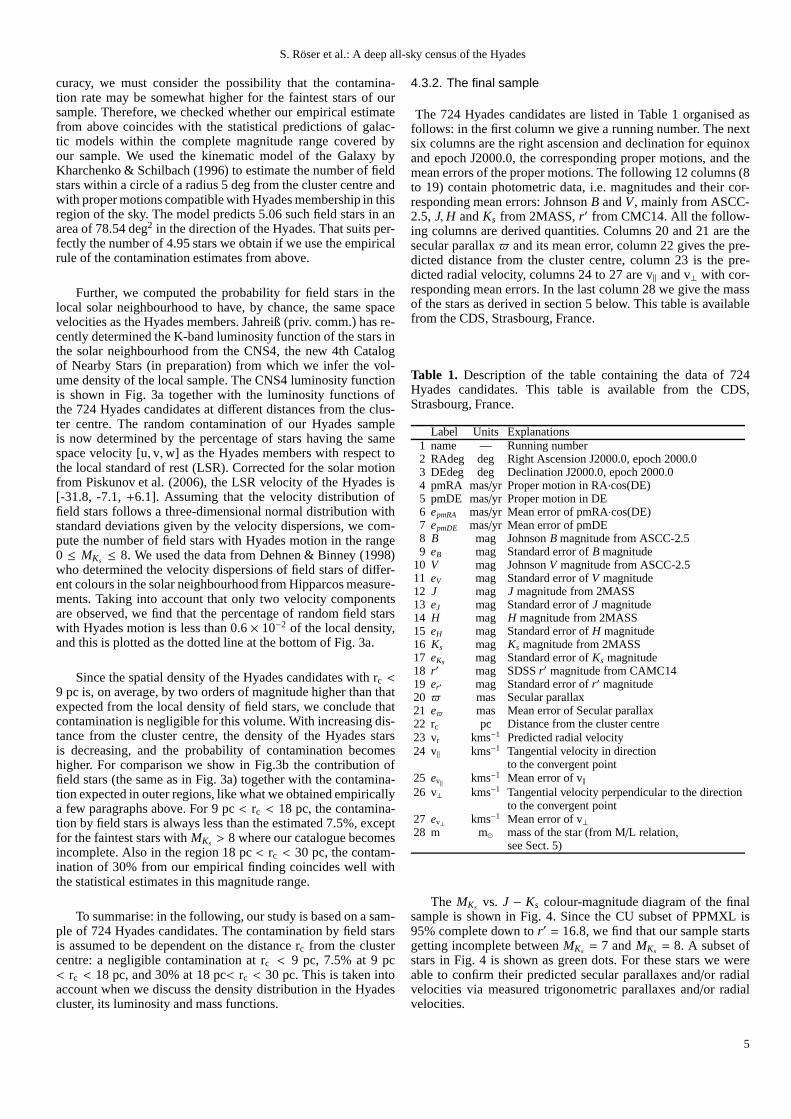
The 724 Hyades candidates are listed in Table 1 organised asfollows: in the first column we give a running number. The nextsix columns are the right ascension and declination for equinoxand epoch J2000.0, the corresponding proper motions, and themean errors of the proper motions. The following 12 columns (8to 19) contain photometric data, i.e. magnitudes and their cor-responding mean errors: JohnsonB andV, mainly from ASCC-2.5, J,H andKs from 2MASS,r′ from CMC14. All the follow-ing columns are derived quantities. Columns 20 and 21 are thesecular parallax and its mean error, column 22 gives the pre-dicted distance from the cluster centre, column 23 is the pre-dicted radial velocity, columns 24 to 27 are v‖ and v⊥ with cor-responding mean errors. In the last column 28 we give the massof the stars as derived in section 5 below. This table is availablefrom the CDS, Strasbourg, France.
Table 1. Description of the table containing the data of 724Hyades candidates. This table is available from the CDS,Strasbourg, France.
Label Units Explanations1 name — Running number2 RAdeg deg Right Ascension J2000.0, epoch 2000.03 DEdeg deg Declination J2000.0, epoch 2000.04 pmRA mas/yr Proper motion in RA·cos(DE)5 pmDE mas/yr Proper motion in DE6 epmRA mas/yr Mean error of pmRA·cos(DE)7 epmDE mas/yr Mean error of pmDE8 B mag JohnsonB magnitude from ASCC-2.59 eB mag Standard error ofB magnitude
10 V mag JohnsonV magnitude from ASCC-2.511 eV mag Standard error ofV magnitude12 J mag J magnitude from 2MASS13 eJ mag Standard error ofJ magnitude14 H mag H magnitude from 2MASS15 eH mag Standard error ofH magnitude16 Ks mag Ks magnitude from 2MASS17 eKs mag Standard error ofKs magnitude18 r′ mag SDSSr′ magnitude from CAMC1419 er′ mag Standard error ofr′ magnitude20 mas Secular parallax21 e mas Mean error of Secular parallax22 rc pc Distance from the cluster centre23 vr kms−1 Predicted radial velocity24 v‖ kms−1 Tangential velocity in direction
to the convergent point25 ev‖ kms−1 Mean error of v‖26 v⊥ kms−1 Tangential velocity perpendicular to the direction
to the convergent point27 ev⊥ kms−1 Mean error of v⊥28 m m⊙ mass of the star (from M/L relation,
see Sect. 5)
The MKs vs. J − Ks colour-magnitude diagram of the finalsample is shown in Fig. 4. Since the CU subset of PPMXL is95% complete down tor′ = 16.8, we find that our sample startsgetting incomplete betweenMKs = 7 andMKs = 8. A subset ofstars in Fig. 4 is shown as green dots. For these stars we wereable to confirm their predicted secular parallaxes and/or radialvelocities via measured trigonometric parallaxes and/or radialvelocities.
5
S. Roser et al.: A deep all-sky census of the Hyades
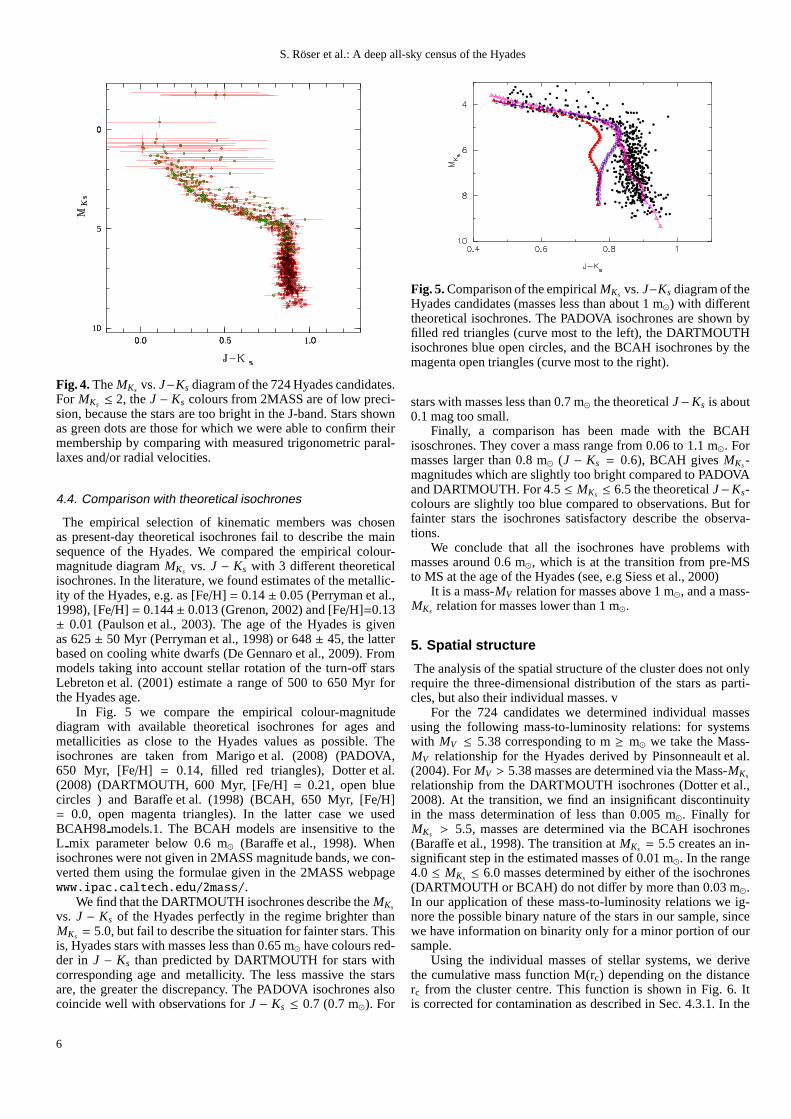
Fig. 4. TheMKs vs.J−Ks diagram of the 724 Hyades candidates.For MKs ≤ 2, theJ − Ks colours from 2MASS are of low preci-sion, because the stars are too bright in the J-band. Stars shownas green dots are those for which we were able to confirm theirmembership by comparing with measured trigonometric paral-laxes and/or radial velocities.
4.4. Comparison with theoretical isochrones
The empirical selection of kinematic members was chosenas present-day theoretical isochrones fail to describe themainsequence of the Hyades. We compared the empirical colour-magnitude diagramMKs vs. J − Ks with 3 different theoreticalisochrones. In the literature, we found estimates of the metallic-ity of the Hyades, e.g. as [Fe/H] = 0.14± 0.05 (Perryman et al.,1998), [Fe/H] = 0.144± 0.013 (Grenon, 2002) and [Fe/H]=0.13± 0.01 (Paulson et al., 2003). The age of the Hyades is givenas 625± 50 Myr (Perryman et al., 1998) or 648± 45, the latterbased on cooling white dwarfs (De Gennaro et al., 2009). Frommodels taking into account stellar rotation of the turn-off starsLebreton et al. (2001) estimate a range of 500 to 650 Myr forthe Hyades age.
In Fig. 5 we compare the empirical colour-magnitudediagram with available theoretical isochrones for ages andmetallicities as close to the Hyades values as possible. Theisochrones are taken from Marigo et al. (2008) (PADOVA,650 Myr, [Fe/H] = 0.14, filled red triangles), Dotter et al.(2008) (DARTMOUTH, 600 Myr, [Fe/H] = 0.21, open bluecircles ) and Baraffe et al. (1998) (BCAH, 650 Myr, [Fe/H]= 0.0, open magenta triangles). In the latter case we usedBCAH98 models.1. The BCAH models are insensitive to theL mix parameter below 0.6 m⊙ (Baraffe et al., 1998). Whenisochrones were not given in 2MASS magnitude bands, we con-verted them using the formulae given in the 2MASS webpagewww.ipac.caltech.edu/2mass/.
We find that the DARTMOUTH isochrones describe theMKs
vs. J − Ks of the Hyades perfectly in the regime brighter thanMKs = 5.0, but fail to describe the situation for fainter stars. Thisis, Hyades stars with masses less than 0.65 m⊙ have colours red-der in J − Ks than predicted by DARTMOUTH for stars withcorresponding age and metallicity. The less massive the starsare, the greater the discrepancy. The PADOVA isochrones alsocoincide well with observations forJ − Ks ≤ 0.7 (0.7 m⊙). For
Fig. 5. Comparison of the empiricalMKs vs.J−Ks diagram of theHyades candidates (masses less than about 1 m⊙) with differenttheoretical isochrones. The PADOVA isochrones are shown byfilled red triangles (curve most to the left), the DARTMOUTHisochrones blue open circles, and the BCAH isochrones by themagenta open triangles (curve most to the right).
stars with masses less than 0.7 m⊙ the theoreticalJ −Ks is about0.1 mag too small.
Finally, a comparison has been made with the BCAHisoschrones. They cover a mass range from 0.06 to 1.1 m⊙. Formasses larger than 0.8 m⊙ (J − Ks = 0.6), BCAH givesMKs -magnitudes which are slightly too bright compared to PADOVAand DARTMOUTH. For 4.5 ≤ MKs ≤ 6.5 the theoreticalJ−Ks-colours are slightly too blue compared to observations. Butforfainter stars the isochrones satisfactory describe the observa-tions.
We conclude that all the isochrones have problems withmasses around 0.6 m⊙, which is at the transition from pre-MSto MS at the age of the Hyades (see, e.g Siess et al., 2000)
It is a mass-MV relation for masses above 1 m⊙, and a mass-MKs relation for masses lower than 1 m⊙.
5. Spatial structure
The analysis of the spatial structure of the cluster does notonlyrequire the three-dimensional distribution of the stars asparti-cles, but also their individual masses. v
For the 724 candidates we determined individual massesusing the following mass-to-luminosity relations: for systemswith MV ≤ 5.38 corresponding to m≥ m⊙ we take the Mass-MV relationship for the Hyades derived by Pinsonneault et al.(2004). ForMV > 5.38 masses are determined via the Mass-MKs
relationship from the DARTMOUTH isochrones (Dotter et al.,2008). At the transition, we find an insignificant discontinuityin the mass determination of less than 0.005 m⊙. Finally forMKs > 5.5, masses are determined via the BCAH isochrones(Baraffe et al., 1998). The transition atMKs = 5.5 creates an in-significant step in the estimated masses of 0.01 m⊙. In the range4.0 ≤ MKs ≤ 6.0 masses determined by either of the isochrones(DARTMOUTH or BCAH) do not differ by more than 0.03 m⊙.In our application of these mass-to-luminosity relations we ig-nore the possible binary nature of the stars in our sample, sincewe have information on binarity only for a minor portion of oursample.
Using the individual masses of stellar systems, we derivethe cumulative mass function M(rc) depending on the distancerc from the cluster centre. This function is shown in Fig. 6. Itis corrected for contamination as described in Sec. 4.3.1. In the
6
S. Roser et al.: A deep all-sky census of the Hyades
galactic disk the sphere of influence of a gravitational bodyisgiven by
xL =
(
GMc
4A(A − B)
)13
=
GMc
4Ω20 − κ
2
13
(3)
where xL is the distance of the Lagrangian points from the cen-tre, Mc is the total mass inside a distance xL from the centre, G= 4.3×10⁻³pc/m⊙(km/s)2 is the gravitational constant, A and Bare Oort’s constants,Ω0 the angular velocity andκ the epicyclicfrequency at the position of the Sun. Here we use A (14.5kms−1kpc−1) and B (-13.0 kms−1kpc−1) from Piskunov et al.(2006). The distance xL is often referred to as the tidal radius rtof a cluster and we use this definition in the following also. Thetidal radius rt separates, in general, stars gravitationally bound toa cluster from those that are unbound. However, this definitionis not to be understood thateach star inside rt is bound, and allstars outside are unbound. Individual stars can, every now andthen, change from a bound to an unbound state and vice versa(see Just et al., 2009, for the fraction of potential escapers withJacobi energy above the critical value in the cluster). It isin-herent in the convergent point method, that we find, in the firstplace, stars that are co-moving with the adopted space motion ofthe centre of the Hyades cluster. So, we cannot separate, fromthe beginning, the gravitationally bound Hyades cluster and itssurroundings.
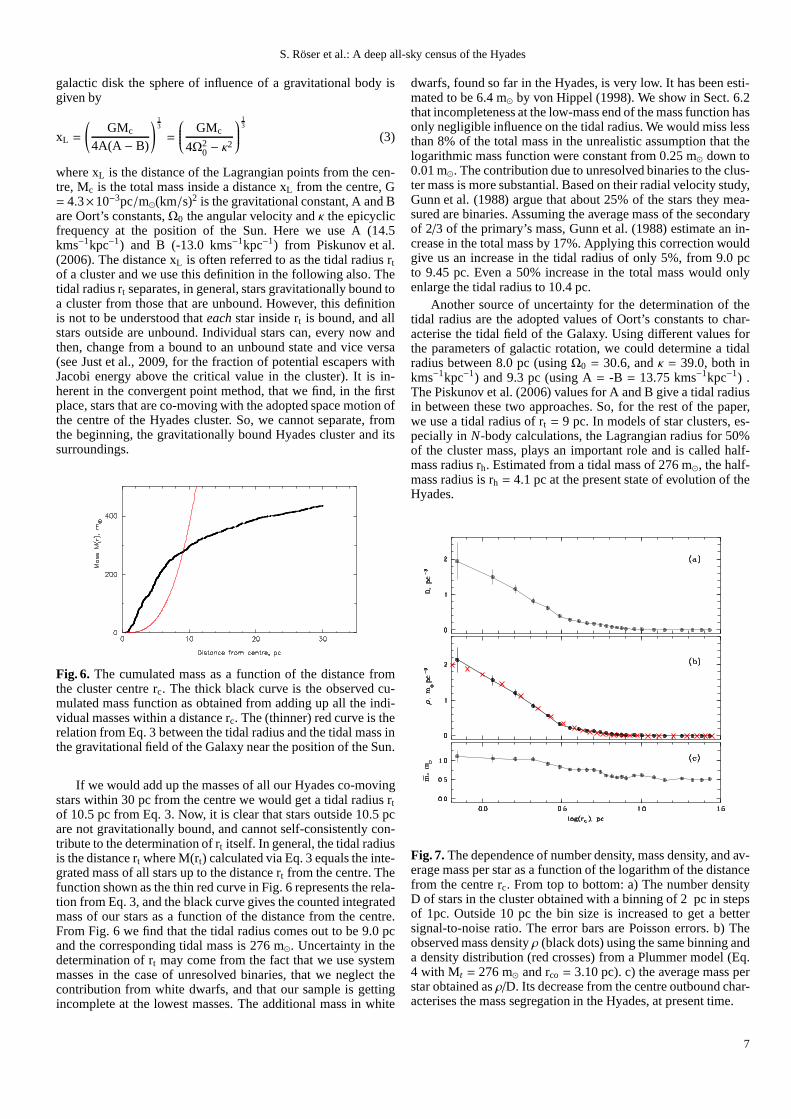
Fig. 6. The cumulated mass as a function of the distance fromthe cluster centre rc. The thick black curve is the observed cu-mulated mass function as obtained from adding up all the indi-vidual masses within a distance rc. The (thinner) red curve is therelation from Eq. 3 between the tidal radius and the tidal mass inthe gravitational field of the Galaxy near the position of theSun.
If we would add up the masses of all our Hyades co-movingstars within 30 pc from the centre we would get a tidal radius rtof 10.5 pc from Eq. 3. Now, it is clear that stars outside 10.5 pcare not gravitationally bound, and cannot self-consistently con-tribute to the determination of rt itself. In general, the tidal radiusis the distance rt where M(rt) calculated via Eq. 3 equals the inte-grated mass of all stars up to the distance rt from the centre. Thefunction shown as the thin red curve in Fig. 6 represents the rela-tion from Eq. 3, and the black curve gives the counted integratedmass of our stars as a function of the distance from the centre.From Fig. 6 we find that the tidal radius comes out to be 9.0 pcand the corresponding tidal mass is 276 m⊙. Uncertainty in thedetermination of rt may come from the fact that we use systemmasses in the case of unresolved binaries, that we neglect thecontribution from white dwarfs, and that our sample is gettingincomplete at the lowest masses. The additional mass in white
dwarfs, found so far in the Hyades, is very low. It has been esti-mated to be 6.4 m⊙ by von Hippel (1998). We show in Sect. 6.2that incompleteness at the low-mass end of the mass functionhasonly negligible influence on the tidal radius. We would miss lessthan 8% of the total mass in the unrealistic assumption that thelogarithmic mass function were constant from 0.25 m⊙ down to0.01 m⊙. The contribution due to unresolved binaries to the clus-ter mass is more substantial. Based on their radial velocitystudy,Gunn et al. (1988) argue that about 25% of the stars they mea-sured are binaries. Assuming the average mass of the secondaryof 2/3 of the primary’s mass, Gunn et al. (1988) estimate an in-crease in the total mass by 17%. Applying this correction wouldgive us an increase in the tidal radius of only 5%, from 9.0 pcto 9.45 pc. Even a 50% increase in the total mass would onlyenlarge the tidal radius to 10.4 pc.
Another source of uncertainty for the determination of thetidal radius are the adopted values of Oort’s constants to char-acterise the tidal field of the Galaxy. Using different values forthe parameters of galactic rotation, we could determine a tidalradius between 8.0 pc (usingΩ0 = 30.6, andκ = 39.0, both inkms−1kpc−1) and 9.3 pc (using A= -B = 13.75 kms−1kpc−1) .The Piskunov et al. (2006) values for A and B give a tidal radiusin between these two approaches. So, for the rest of the paper,we use a tidal radius of rt = 9 pc. In models of star clusters, es-pecially in N-body calculations, the Lagrangian radius for 50%of the cluster mass, plays an important role and is called half-mass radius rh. Estimated from a tidal mass of 276 m⊙, the half-mass radius is rh = 4.1 pc at the present state of evolution of theHyades.
Fig. 7. The dependence of number density, mass density, and av-erage mass per star as a function of the logarithm of the distancefrom the centre rc. From top to bottom: a) The number densityD of stars in the cluster obtained with a binning of 2 pc in stepsof 1pc. Outside 10 pc the bin size is increased to get a bettersignal-to-noise ratio. The error bars are Poisson errors. b) Theobserved mass densityρ (black dots) using the same binning anda density distribution (red crosses) from a Plummer model (Eq.4 with Mt = 276 m⊙ and rco = 3.10 pc). c) the average mass perstar obtained asρ/D. Its decrease from the centre outbound char-acterises the mass segregation in the Hyades, at present time.
7

S. Roser et al.: A deep all-sky census of the Hyades
In Fig. 7 we show the number density D, the mass densityρ
, and the average mass per star as a function of the distance fromthe centre rc. The bottom part of Fig. 7 reveals the mass segrega-tion in the Hyades; the average mass per star decreases from 1.4m⊙ in the centre to about 0.5 m⊙ at the tidal radius rt. We discussthis in more detail in Sect. 6.2 together with the description ofthe mass function. The mass density of the Hyades, shown in themiddle part of Fig. 7, is fitted to a Plummer model (Plummer,1915), where the mass density follows the equation
ρ(rc) =3Mt
4πrco3
1[1 + (rc/rco)2]5/2
, (4)
where rco is the so-called core radius of a cluster. Using the tidalmass of Mt = 276 m⊙ the best fit to the observed density distri-bution (black dots) in Fig. 7 is obtained with a core radius ofrco= 3.10 pc. The core radius is easily seen in the two upper panelsof Fig. 7 as the distance where the slope in the density and massdistributions significantly changes. The corresponding Plummermodel (crosses in Fig. 7) shows excellent agreement with theob-servations. The model has a central mass density of 2.21 m⊙pc−3
which coincides well with our innermost point of 2.14 m⊙pc−3.The ratio of the half-mass radius rh to rco in the Hyades is 1.32which also is in remarkable coincidence with the theoretical ra-tio of 1.3048 for a Plummer model (see Spitzer & Shull, 1975).
Gunn et al. (1988) already found that the cluster conformswell to a Plummer model. Taking into account the incomplete-ness of their sample, they argue for a total mass of 390 m⊙. Theyuse the projected density distribution to determine a core radiusrco= 3.15 pc (0.07 radians) and a central density of 2.97 m⊙pc−3,the latter being about 30% higher than ours. As the core radiircoin Gunn’s model and ours practically coincide, the difference incentral density comes solely via the tidal mass of the cluster. So,either Gunn et al. (1988) have overestimated the tidal mass of390 m⊙, or our stellar masses are underestimated essentially dueto binarity. Using Gunn’s estimate on binarity (25%) we couldaccount for an increase of 17% in total mass to get 323 m⊙. Amass of 390 m⊙ would require an increase of 37% in mass forall our stellar systems (more than 50% binaries), which, how-ever, could also be possible. Perryman et al. (1998) also fit theobserved density distribution to a Plummer model and find asmaller core radius of 2.9 pc and a central density of 1.8 m⊙pc−3.This is not surprising as the Hipparcos sample is incompleteal-ready at 0.6 to 0.7 m⊙.
In the following we call the region inside rco = 3.1 pc thecore, the region between rco and rt the corona. In a volume be-tween 1 and 2 rt, called halo, we find another 100 m⊙ in ob-jects co-moving with the Hyades, but probably not gravitation-ally bound. Outside the halo up to the distance of 30 pc from thecluster centre there is another 60 m⊙ in co-moving stars.
5.1. The shape of the cluster
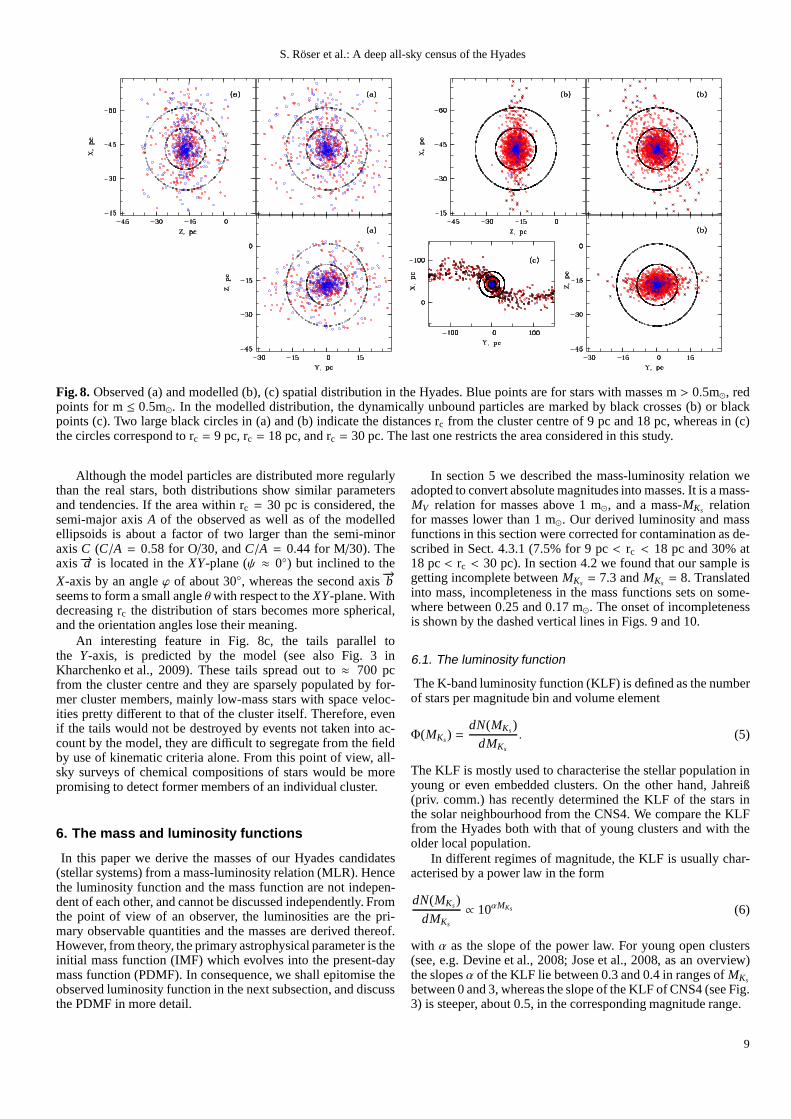
Since the convergent point method provides an individual dis-tance from the Sun for each Hyades star, we can study the three-dimensional distribution of cluster members in more detail. Thedistribution of the 724 Hyades candidates in galactic rectangularcoordinates is shown in Fig. 8a.
For comparison, we show in Fig. 8b a model distributionof stars predicted by theN-body simulation (Kharchenko et al.,2009) of an open cluster originally spheroidal, with an initialmass of 1000 m⊙ and the Salpeter IMF down to 0.1 m⊙. Themodel cluster is moving on a circular orbit in the external tidalfield of the Milky Way. It is 650 Myr old and located close to
Table 2. Shape parameters of the observed HyadesO, and themodel clusterM. See a detailed description in the text.
B/A C/A ψ, deg ϕ, deg θ, degO/30 0.81 0.58 3 33 12
[0.78; 0.84] [0.55; 0.60] [-1; 6] [22; 42] [4; 18]M/30 0.71 0.44 1 30 4
[0.70; 0.72] [0.43; 0.45] [-1; 2] [25; 36] [2; 7]O/18 0.86 0.64 2 27 19
[0.81; 0.89] [0.55; 0.70] [-3; 5] [12; 36] [12; 31]M/18 0.86 0.57 0 23 5
[0.86; 0.87] [0.55; 0.59] [-1; 2] [18; 28] [3; 7]O/9 0.89 0.77 0 8 23
[0.74; 0.93] [0.75; 0.83] [-8; 9] [-18; 15] [8; 42]M/9 0.94 0.78 0 22 7
[0.91; 0.97] [0.76; 0.79] [-6; 8] [3; 35] [0; 14]
the observed location of the Hyades (for more details of themodel parameters, see Kharchenko et al., 2009). It is appropri-ate to note that the model has not been specifically tailored to fitthe Hyades, but it is a general model for the evolution of a pro-totype open cluster in the disk at 8.5 kpc. The model does nottake into account that the Hyades could undergo some irregularevents (e.g., encounters with molecular clouds) during their life.As far as the observations are concerned, we note that our sam-ple can be contaminated beyond rc = 9 pc. However, the modeland observations show quite a good agreement in general. Themain feature, an elongated shape with the minor axis directedtowards the Galactic Poles, is clearly seen in both distributions.
In the following we analyse and compare the shapes of theobserved Hyades cluster and the model cluster. The principalaxes of the cluster ellipsoid are given as the eigenvectors andeigenvalues of the matrix formed by the 2nd order momentaMxx, · · ·Mzz of the space coordinates of the cluster stars
M =
Mxx Mxy MxzMxy Myy Myz
Mxz Myz Mzz
.
The coordinatesx, y, z are counted relative to the cluster centre inthe galactic coordinate system as defined in Sect. 3. LetA, B, Cbe the eigenvalues ofM with A being the highest,C the lowesteigenvalue. The corresponding eigenvectors are denoted by−→a ,−→b and−→c .
The results are given in Table 2. In the first column we in-dicate the data set used for the calculations (Observations orModel, within 30 pc, 18 pc, or 9 pc). Columns 2 and 3 givethe axis ratios. Columns 4, 5, and 6 describe the orientationofthe ellipsoids in theXYZ-system whereψ is the angle betweenthe X-axis and the projection of the semi-major axis−→a on theXZ-plane,ϕ is the angle between theX-axis and the projectionof −→a on theXY-plane, andθ is the angle between theY-axisand the projection of
−→b on theYZ-plane. The numbers in brack-
ets below each parameter give a measure of confidence. Theseare the lowest and highest values obtained for a given parame-ter from four subsets of data in the corresponding range of rc.The first two subsets were extracted from the sample arrangedwith increasing distance of stars from the cluster centre bysort-ing into two groups of even and odd entries. These two subsetscontain, therefore, half of stars of the original sample andaresupplementing each other. The other two subsets were extractedin the same way but from the sample arranged with increasingdistance of stars from the Sun.
8
S. Roser et al.: A deep all-sky census of the Hyades
Fig. 8. Observed (a) and modelled (b), (c) spatial distribution in the Hyades. Blue points are for stars with masses m> 0.5m⊙, redpoints for m≤ 0.5m⊙. In the modelled distribution, the dynamically unbound particles are marked by black crosses (b) or blackpoints (c). Two large black circles in (a) and (b) indicate the distances rc from the cluster centre of 9 pc and 18 pc, whereas in (c)the circles correspond to rc = 9 pc, rc = 18 pc, and rc = 30 pc. The last one restricts the area considered in this study.
Although the model particles are distributed more regularlythan the real stars, both distributions show similar parametersand tendencies. If the area within rc = 30 pc is considered, thesemi-major axisA of the observed as well as of the modelledellipsoids is about a factor of two larger than the semi-minoraxisC (C/A = 0.58 for O/30, andC/A = 0.44 for M/30). Theaxis−→a is located in theXY-plane (ψ ≈ 0) but inclined to theX-axis by an angleϕ of about 30, whereas the second axis
−→b
seems to form a small angleθ with respect to theXY-plane. Withdecreasing rc the distribution of stars becomes more spherical,and the orientation angles lose their meaning.
An interesting feature in Fig. 8c, the tails parallel tothe Y-axis, is predicted by the model (see also Fig. 3 inKharchenko et al., 2009). These tails spread out to≈ 700 pcfrom the cluster centre and they are sparsely populated by for-mer cluster members, mainly low-mass stars with space veloc-ities pretty different to that of the cluster itself. Therefore, evenif the tails would not be destroyed by events not taken into ac-count by the model, they are difficult to segregate from the fieldby use of kinematic criteria alone. From this point of view, all-sky surveys of chemical compositions of stars would be morepromising to detect former members of an individual cluster.
6. The mass and luminosity functions
In this paper we derive the masses of our Hyades candidates(stellar systems) from a mass-luminosity relation (MLR). Hencethe luminosity function and the mass function are not indepen-dent of each other, and cannot be discussed independently. Fromthe point of view of an observer, the luminosities are the pri-mary observable quantities and the masses are derived thereof.However, from theory, the primary astrophysical parameteris theinitial mass function (IMF) which evolves into the present-daymass function (PDMF). In consequence, we shall epitomise theobserved luminosity function in the next subsection, and discussthe PDMF in more detail.
In section 5 we described the mass-luminosity relation weadopted to convert absolute magnitudes into masses. It is a mass-MV relation for masses above 1 m⊙, and a mass-MKs relationfor masses lower than 1 m⊙. Our derived luminosity and massfunctions in this section were corrected for contaminationas de-scribed in Sect. 4.3.1 (7.5% for 9 pc< rc < 18 pc and 30% at18 pc< rc < 30 pc). In section 4.2 we found that our sample isgetting incomplete betweenMKs = 7.3 andMKs = 8. Translatedinto mass, incompleteness in the mass functions sets on some-where between 0.25 and 0.17 m⊙. The onset of incompletenessis shown by the dashed vertical lines in Figs. 9 and 10.
6.1. The luminosity function
The K-band luminosity function (KLF) is defined as the numberof stars per magnitude bin and volume element
Φ(MKs) =dN(MKs )
dMKs
. (5)
The KLF is mostly used to characterise the stellar population inyoung or even embedded clusters. On the other hand, Jahreiß(priv. comm.) has recently determined the KLF of the stars inthe solar neighbourhood from the CNS4. We compare the KLFfrom the Hyades both with that of young clusters and with theolder local population.
In different regimes of magnitude, the KLF is usually char-acterised by a power law in the form
dN(MKs )
dMKs
∝ 10αMKs (6)
with α as the slope of the power law. For young open clusters(see, e.g. Devine et al., 2008; Jose et al., 2008, as an overview)the slopesα of the KLF lie between 0.3 and 0.4 in ranges ofMKs
between 0 and 3, whereas the slope of the KLF of CNS4 (see Fig.3) is steeper, about 0.5, in the corresponding magnitude range.
9
S. Roser et al.: A deep all-sky census of the Hyades
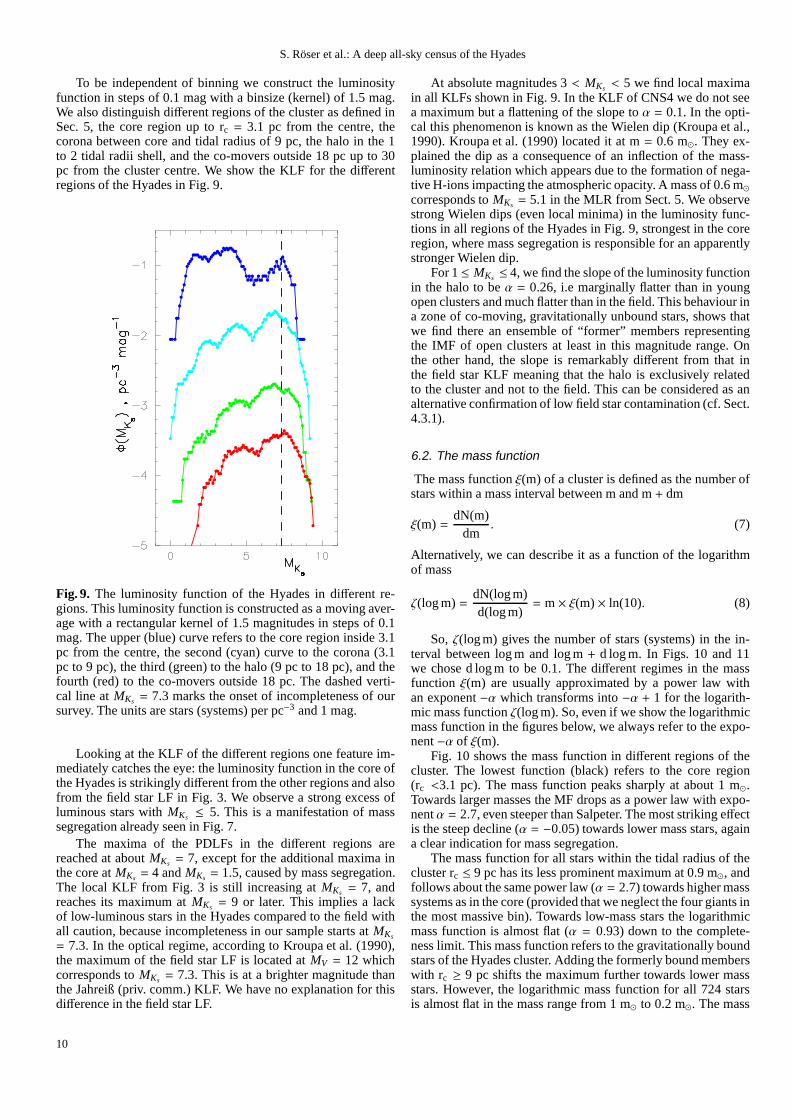
To be independent of binning we construct the luminosityfunction in steps of 0.1 mag with a binsize (kernel) of 1.5 mag.We also distinguish different regions of the cluster as defined inSec. 5, the core region up to rc = 3.1 pc from the centre, thecorona between core and tidal radius of 9 pc, the halo in the 1to 2 tidal radii shell, and the co-movers outside 18 pc up to 30pc from the cluster centre. We show the KLF for the differentregions of the Hyades in Fig. 9.
Fig. 9. The luminosity function of the Hyades in different re-gions. This luminosity function is constructed as a moving aver-age with a rectangular kernel of 1.5 magnitudes in steps of 0.1mag. The upper (blue) curve refers to the core region inside 3.1pc from the centre, the second (cyan) curve to the corona (3.1pc to 9 pc), the third (green) to the halo (9 pc to 18 pc), and thefourth (red) to the co-movers outside 18 pc. The dashed verti-cal line atMKs = 7.3 marks the onset of incompleteness of oursurvey. The units are stars (systems) per pc−3 and 1 mag.
Looking at the KLF of the different regions one feature im-mediately catches the eye: the luminosity function in the core ofthe Hyades is strikingly different from the other regions and alsofrom the field star LF in Fig. 3. We observe a strong excess ofluminous stars withMKs ≤ 5. This is a manifestation of masssegregation already seen in Fig. 7.
The maxima of the PDLFs in the different regions arereached at aboutMKs = 7, except for the additional maxima inthe core atMKs = 4 andMKs = 1.5, caused by mass segregation.The local KLF from Fig. 3 is still increasing atMKs = 7, andreaches its maximum atMKs = 9 or later. This implies a lackof low-luminous stars in the Hyades compared to the field withall caution, because incompleteness in our sample starts atMKs
= 7.3. In the optical regime, according to Kroupa et al. (1990),the maximum of the field star LF is located atMV = 12 whichcorresponds toMKs = 7.3. This is at a brighter magnitude thanthe Jahreiß (priv. comm.) KLF. We have no explanation for thisdifference in the field star LF.
At absolute magnitudes 3< MKs < 5 we find local maximain all KLFs shown in Fig. 9. In the KLF of CNS4 we do not seea maximum but a flattening of the slope toα = 0.1. In the opti-cal this phenomenon is known as the Wielen dip (Kroupa et al.,1990). Kroupa et al. (1990) located it at m= 0.6 m⊙. They ex-plained the dip as a consequence of an inflection of the mass-luminosity relation which appears due to the formation of nega-tive H-ions impacting the atmospheric opacity. A mass of 0.6m⊙corresponds toMKs = 5.1 in the MLR from Sect. 5. We observestrong Wielen dips (even local minima) in the luminosity func-tions in all regions of the Hyades in Fig. 9, strongest in the coreregion, where mass segregation is responsible for an apparentlystronger Wielen dip.
For 1≤ MKs ≤ 4, we find the slope of the luminosity functionin the halo to beα = 0.26, i.e marginally flatter than in youngopen clusters and much flatter than in the field. This behaviour ina zone of co-moving, gravitationally unbound stars, shows thatwe find there an ensemble of “former” members representingthe IMF of open clusters at least in this magnitude range. Onthe other hand, the slope is remarkably different from that inthe field star KLF meaning that the halo is exclusively relatedto the cluster and not to the field. This can be considered as analternative confirmation of low field star contamination (cf. Sect.4.3.1).
6.2. The mass function
The mass functionξ(m) of a cluster is defined as the number ofstars within a mass interval between m and m+ dm
ξ(m) =dN(m)
dm. (7)
Alternatively, we can describe it as a function of the logarithmof mass
ζ(log m)=dN(log m)d(log m)
= m× ξ(m)× ln(10). (8)
So, ζ(log m) gives the number of stars (systems) in the in-terval between log m and log m+ d log m. In Figs. 10 and 11we chose d log m to be 0.1. The different regimes in the massfunction ξ(m) are usually approximated by a power law withan exponent−α which transforms into−α + 1 for the logarith-mic mass functionζ(log m). So, even if we show the logarithmicmass function in the figures below, we always refer to the expo-nent−α of ξ(m).
Fig. 10 shows the mass function in different regions of thecluster. The lowest function (black) refers to the core region(rc <3.1 pc). The mass function peaks sharply at about 1 m⊙.Towards larger masses the MF drops as a power law with expo-nentα = 2.7, even steeper than Salpeter. The most striking effectis the steep decline (α = −0.05) towards lower mass stars, againa clear indication for mass segregation.
The mass function for all stars within the tidal radius of thecluster rc ≤ 9 pc has its less prominent maximum at 0.9 m⊙, andfollows about the same power law (α = 2.7) towards higher masssystems as in the core (provided that we neglect the four giants inthe most massive bin). Towards low-mass stars the logarithmicmass function is almost flat (α = 0.93) down to the complete-ness limit. This mass function refers to the gravitationally boundstars of the Hyades cluster. Adding the formerly bound memberswith rc ≥ 9 pc shifts the maximum further towards lower massstars. However, the logarithmic mass function for all 724 starsis almost flat in the mass range from 1 m⊙ to 0.2 m⊙. The mass
10

S. Roser et al.: A deep all-sky census of the Hyades
Fig. 10. The present-day mass function (PDMF) of the Hyades.The lowest histogram (filled black dots) shows the PDMF in thecore of the cluster (rc <3.1 pc), the magenta triangles mark thePDMF within the tidal radius (rc <9 pc), the blue squares standfor the PDMF in the region rc <18 pc, and finally the filled redsquares are the PDMF of all 724 stars within 30 pc from the cen-tre. The PDMFs are corrected for field star contamination. Thehistograms give the actual star counts per logarithmic massbinof 0.1. The dashed vertical line at about 0.25 m⊙ marks the on-set of incompleteness of our survey. For comparison, we showa Kroupa (2001) mass function (solid line) withα = 2.35 formasses larger than 0.5 m⊙, andα = 1.35 below 0.5 m⊙. As another extreme we show a mass function with slopeα = 3.05(dashed line) fitted to the high-mass portion of the observedPDMF.
function which we determined is incomplete for masses lowerthan about 0.25 m⊙. This has, however, not much influence onthe total mass of the cluster. If we assume that the logarithmicmass function were constant below 0.25 m⊙ down to 0.01 m⊙,this would add merely 8% to the total mass of the cluster.
In Fig.10 we compare the observed mass functions witha Kroupa (2001) IMF shown as the solid line. This IMF hasα = 2.35 for masses larger than 0.5 m⊙, andα = 1.35 below0.5 m⊙, down to the brown dwarf limit of 0.08 m⊙. Using theKroupa IMF as a tangent to the observed mass function, we canestimate a minimum initial mass of the cluster, provided that alloriginally formed stars of about solar-mass are still containedwithin a radius of 30 pc. With these assumptions we get aninitial cluster mass of 1100 m⊙ in 2300 stars (stellar systems).From this simple calculation we can conclude that about 40%of the original mass of the Hyades is still contained in the im-mediate neighbourhood of 30 pc around the centre. The remain-ing mass has left further into tails of the form predicted by,e.g.Kharchenko et al. (2009). More refined statements on the initialparameters of the Hyades are expected from dedicatedN-bodysimulations which are underway.
A better fit to the high-mass end of the observed mass func-tion requires a steeper slope ofα = 3.05 in a mass range from1 to 2.5 m⊙. This is shown as the dashed line in Fig. 10. We
should point out again that in the mass functions presented herebinaries are not resolved, and the masses are based on a specificmass-luminosity relation used to convert absolute magnitudes tomasses. This makes us cautious, not to interpret the slope ofthemass function at high masses in more depth.
Fig. 11. The mass function of the Hyades from this paper (blackhistogram with filled black dots). The blue curve (open squares)shows the Hyades PDMF from Bouvier et al. (2008), the redhistogram with triangles is the PDMF from the 120 Myr oldPleiades from Moraux et al. (2003), and finally the green curve(filled squares) is the PDMF of Praesepe from Boudreault et al.(2010). The thin solid line shows again a Kroupa (2001) massfunction.
In Fig. 11 we compare our PDMF of the Hyades with earlierresults. This mass function (black histogram with filled blackdots) is obtained within the 30 pc volume around the centre(top curve in Fig. 10). The PDMF from Bouvier et al. (2008)is shown as the blue histogram (open squares). On the high masspart it is derived from the Prosser & Stauffer (P&S) database.Bouvier et al. (2008) argue that the P&S database is essentiallycomplete down to 0.1 m⊙, but having a 27% contamination byfield dwarfs below 0.3 m⊙. The slope of their mass function be-tween 0.2 and 1 m⊙ is found to beα = 0.6. Compared with ourresults this indicates that incompleteness in the P&S databasebegins near 1 m⊙ and increases towards lower masses. We at-tribute this to the fact that the P&S database is not based on adeep all-sky survey. As fainter stars show less concentration tothe centre (mass segregation) they may be missed if the field-of-view is restricted. Bouvier et al. (2008) detected 3 new verylow-mass stellar members, and constructed a PDMF down to 0.08m⊙. Nevertheless, their PDMF practically shows a cut-off at 0.1m⊙. We neither can confirm nor reject this on the basis of ouranalysis using the CU catalogue because of incompleteness be-low about 0.25 m⊙. Work is going on to exploit the faint PPMXLstars not in the CU subset to reach an all-sky completeness oftheHyades stars at least down to 0.1 m⊙. Hogan et al. (2008) did nottry to derive a mass function from the 12 L-dwarfs in their sur-veyed 275 deg2 field. If we apply our Mass-MKs relationship, the
11

S. Roser et al.: A deep all-sky census of the Hyades
12 candidates range from 0.078 down to 0.06 m⊙. A larger fieldis needed to decide if the presently observed strong cut-off at 0.1m⊙ will be confirmed or not.
Fig. 11 also shows the PDMF of the much younger (≈ 120Myr) Pleiades cluster from Moraux et al. (2003). The maximumof the Pleiades PDMF in the logarithmic mass function is be-tween 0.3 and 0.4 m⊙ compared to about 0.7 to 0.8 m⊙ in ourmass function of the Hyades. If both clusters had a similar IMFthen mass loss works more effectively the less massive the starsare. The similarity of the mass functions in the region above1m⊙ suggests that this effect is less prominent for the more mas-sive stars in a cluster. A further similarity in the Hyades andPleiades mass functions is the decline below 0.1 m⊙.
The green curve (filled squares) is the mass function ofPraesepe recently derived by Boudreault et al. (2010). Given thatPraesepe is practically of the same age as the Hyades, this massfunction is quite unusual. With anα = 1.9 between 0.2 and0.7 m⊙, the contribution of low-mass stars to the total mass ofPraesepe is much more important than in the case of the Hyadesand even the Pleiades. Contrary to the latter, it would mean thatPraesepe could hold its low-mass stars in bound stage.
The thin solid line in Fig. 11 is again the universal IMFfrom Kroupa (2001). Prima facie one gets the impression thatan IMF like Kroupa’s evolves via a Pleiades PDMF (120 Myr)to a Hyades PDMF due to dynamical and stellar evolution.
7. The internal velocity dispersion
For a cluster in astatistically steady state (Chandrasekhar, 1942)the virial theorem 2T = −Ω holds (with T being the total kineticandΩ the total potential energy of the system). For compact, iso-lated, massive and long living systems like globular clusters theassumption ofstatistically steady state is, in general, justified.However, this is not trivial if we were to consider a relativelyold, low-mass open cluster dipped into the Galactic disk.
Strictly speaking, the virial theorem only holds for thecluster as an ensemble. For each well-defined subset of starsm1, .....,ms we can postulate that the velocity dispersion isgiven by
< v2 >= 0.5G∑ mimj
ri,j
/∑
mi (9)
wheremi is the mass of an individual star in the subset, andm jruns along all stars within the tidal radius of the cluster,ri, j isthe distance between stars i and j, G is the gravitational constant,and< v2 > is defined as
< v2 > ×∑
mi =∑
mivi2 (10)
The summation in Eq. 9 extends over all pairs of stars with i, j.If the subset consists of all stars within the tidal radius then Eq.9 gives 2T = −Ω.
We use here the actual three-dimensional distribution of theHyades stars and do not approximate the cluster by a Plummermodel, albeit the fit of the Hyades to a Plummer model is excel-lent (see Sect.5). The assumption of astatistically steady state,if at all, is only justified within the tidal radius of the cluster. Weapplied Eq. 9 to two distinct subsets of the Hyades, one contain-ing all stars within the core radius rco (rc ≤ 3.1 pc) and the otherwithin the tidal radius rt (rc ≤ 9.0 pc). The three-dimensionalvelocity dispersion comes out as 0.42 kms−1 and 0.32 kms−1, re-spectively. Putting an artificial particle in the centre we obtainthe central velocity dispersion< v2 >1/2 = 0.45 kms−1.
Gunn et al. (1988) used their fit of the Hyades cluster to aPlummer model (cf. Sect.5) to get 0.51 kms−1 for the central, and0.40 kms−1 for the average velocity dispersion (or 0.23 kms−1 for1-D). The higher values can be explained by their assumptionof a higher (tidal) mass for the Hyades. Perryman et al. (1998)derive a central velocity dispersion of 0.36 kms−1 from their fitto a Plummer model, which is too low because of their lowermass estimate for the cluster.
In principle, an empirical determination of the velocity dis-persion is possible by exploiting the observed velocity distribu-tion of cluster members. However, during their life, open clus-ters are permanently losing members part of which remain in thevicinity of their parent cluster and form sparse haloes and tailsof co-moving stars. This makes it difficult to separate “actual”members by use of velocity observations and properly determine< v2 >1/2. For open clusters, one expects velocity dispersionsranging from a few hundred meters per second to 1-2 kms−1 i.e.,at a level of accuracy of radial velocity measurements and/or tan-gential velocities of nearby stars. Empirically determined< v2 >are thus sensitive to the adopted mean errors of input data usedfor computing internal spatial velocities of cluster members (seee.g., Appendix in Piskunov et al., 2007).
In the past, several attempts were undertaken to derive thevelocity dispersion of the Hyades from proper motions andradial velocities. Schwan (1990) determined the velocity dis-persion from 44 FK5 stars. Using v⊥, he obtained an 1d-velocity dispersion of 0.71± 0.41 kms−1. Based on only the vα-component, the velocity dispersion comes out to be 0.3 kms−1
which corresponds to about 0.5 kms−1 for the three-dimensionaldispersion. Schwan (1990) explained this considerable differ-ence by larger uncertainties in vδ-component of the velocity data.Perryman et al. (1998) used the Hipparcos parallaxes and propermotions, but were unable to determine the velocity dispersion,because the accuracy of the measured trigonometric parallaxesresulted in a too large mean error of the tangential velocities.de Bruijne et al. (2001) used the same data set as Perryman et al.(1998) but took the formally better secular parallaxes instead ofthe trigonometric parallaxes. They achieved a 1d-velocitydis-persion of 0.3 kms−1 after consecutive rejection of stars withlarge offsets in the observed vs. computed tangential velocities.In the following we estimate the three-dimensional velocity dis-persion in the Hyades via the one-dimensional velocity disper-sion given by the velocity component perpendicular to the direc-tion to the convergent point v⊥. The distribution of v⊥ versus thedistance of stars from the cluster centre is shown in Fig. 12.Starsin red circles are outliers and are discussed a few paragraphs be-low.
Fig. 12. The distribution of the tangential velocity componentsv⊥ perpendicular to the direction to the convergent point as afunction of the distance from the cluster centre. The nine starsin red circles are outliers which are not considered in the deter-mination of the velocity dispersion in Table 3. The verticallinesmark the core (dashed) and tidal (solid) radii.
12

S. Roser et al.: A deep all-sky census of the Hyades
Let vi be the residual space velocity of thei-th member withrespect to the bulk motion of the cluster, andσ2
i its individ-ual mean error. We define the square of the velocity dispersion< v2 > as
< v2 >=1n
∑
v2i −
1n
∑
σ2i (11)
wheren is the number of stars in a given region. Provided thatthe space velocities of the cluster stars are randomly oriented,the first term on the right-hand side can be computed from thevelocity components v⊥ and we can re-write Eq. 11 as
V2d =< v2 >= 3× (< v2
⊥ > − < σ2⊥ >). (12)
The mean errorsσVd (Trumpler & Weaver, 1953) are computedas
σVd =3∑
v2i
Vd(2n)1/2. (13)
Here we are obliged to rely on the quotedσi and to assume theiruncertainties to be negligible.
Since the kinematic candidates of the Hyades have differentobserving history, their individual mean errorsσ⊥ vary signifi-cantly, from≈ 0.1 kms−1 for bright (and high mass) Hipparcosstars to≈ 1 kms−1 for the faintest (and lowest mass) stars in oursample. Therefore, they must be considered in different bins con-taining a sufficient number of stars of homogeneous accuracy. Asa compromise, we divided our sample into four groups, accord-ing to the masses of stars included: masses higher than 1.45 m⊙,between 1.45 m⊙ and 1.05 m⊙, between 1.05 m⊙ and 0.71 m⊙,and less than 0.71 m⊙. We had to exclude the last group fromconsideration: there is no chance to use them for the determina-tion of the velocity dispersion due to the low accuracy of theirkinematic data. Further we rejected 5 stars from the calculationof < σ2
⊥ > because their reported mean errors were significantlyhigher than the corresponding group average.
For each mass group, the mean values< v2⊥ > were com-
puted in two ranges of the distance from the cluster centre:rc ≤ 3.1 pc, and rc ≤ 9 pc. It is self-evident that stars with high| v⊥ | can cause an oversize increasing of the velocity disper-sion. Therefore, in each bin we applied a statistical test torevealoutliers at the 95% confidence level. In total, 9 stars were ex-cluded from the calculation of the velocity dispersions. They aremarked by red circles in Fig. 12. All these stars are double stars.Of these, six are found as∆µ-binaries in Wielen et al. (1999).The binary nature of the∆µ-stars is revealed from the signifi-cant difference between their short-scale (Hipparcos) and theirlong-scale (FK5, Tycho-2) proper motions. One more∆µ-binaryis found in Frankowski et al. (2007). Another star is marked asdouble in the Hipparcos Double and Multiple Systems Annex,and the last one is WDS 04285+1742 from the 2011 version ofthe Washington Double Star catalog (Mason et al., 2001).
For comparison, we also computed the velocity dispersionof stars at larger distances from the cluster centre by applyingthe same approach. Since there are only 8 stars at rc >9 pc withmasses larger than 1.45 m⊙, the calculations were carried outonly for two mass groups. The results are given in Table 3 to-gether with the theoretical velocity dispersion computed abovefrom the virial theorem.
The increase of the velocity dispersion outside 9 - 11 pcfrom the cluster centre can be already observed in Fig. 12, andTable 3 confirms this impression. Partly, this may be explainedby an increasing contamination by field stars. But more proba-bly, this finding indicates the limiting distance for the gravita-tionally bound part of the Hyades cluster. The distance 9 - 11pc
Table 3. Three-dimensional velocity dispersions derived fromthe potential energy (Eq. 9) as well as computed from the ob-served velocities of stars in 3 mass ranges: I (m≥ 1.45 m⊙), II(1.05 m⊙ ≤ m < 1.45 m⊙), III (0 .71 m⊙ ≤ m < 1.05 m⊙).
theoretical I II IIIrc < v >1/2 < v >1/2 < v >1/2 < v >1/2
pc kms−1 kms−1 kms−1 kms−1
0 0.45≤ 3.1 0.42 0.81± 0.13 0.76± 0.15 0.74± 0.21≤ 9.0 0.36 0.77± 0.10 0.88± 0.11 0.82± 0.13> 9.0 2.68± 0.38 2.38± 0.24
is in good agreement with the conclusion on the cluster size weobtained from the density and mass distribution of stars in Sec.5.
Within the first two bins (rc ≤ 9 pc), the velocity disper-sion achieves≈ 0.8 kms−1 which is higher by almost a factorof two than one would expect from Eq. 9. So, a factor of 4 inmass would be required to balance this discrepancy. Assumingadditional mass hidden in double stars, white dwarfs, faintstarsbelow the completeness limit of our survey, the current estimateof cluster mass of approximately 300 m⊙ can be hardly increasedactually by more than 50%, a factor of 4 is excluded.
On the other hand, we can assume that< v2⊥ > is overes-
timated and/or < σ2⊥ > is underestimated in Eq. 12. A formal
calculation shows that a decrease of the observed velocity dis-persion by a factor of two can be achieved for the most massivestars (group I) by increasing the rms errors of proper motionsby a factor of≈ 3. However, this seems to be far from real-ity, especially for this mass group containing mainly starswithHipparcos data.
Alternatively, an additional dispersion can be introducedbythe presence of double stars which can impact the proper motionmeasurements. The effect from neglecting the binary nature ofthe stars is twofold: the velocity dispersion contains a part thatcomes from orbital motion, and the total gravitational energy isincreased to the higher mass in binaries. Indeed, we found thatthe high velocity dispersion is caused by only 20% of the starswith somewhat higher v⊥ velocities. From a statistical point-of-view, however, they cannot be considered as outliers and simplybe excluded from the calculation of the velocity dispersion. But,we note that this number of 20% coincides well with the resultsby Gunn et al. (1988), who estimated the percentage of doublestars to be 25% from their measurements of radial velocitiesofstars in the Hyades region and extrapolated this number to thecomplete cluster. As a further possibility to explain the high em-pirical velocity dispersion we can assume that a certain numberof stars is just escaping the cluster. Simulations have beenstartedto quantitatively investigate the importance of this effect.
In the discussion above we used the observed distribution ofstars (with their masses) to derive the allowed velocity disper-sion for the cluster to be in equilibrium. That is, the mass ofthecluster was obtained by counting the members with their individ-ual masses. At first sight, see Table 3 the observed velocity dis-persion seemed to considerably exceed the allowed one. But,aswe argued above, there are good reasons that both the observeddistribution of masses and the observed velocity dispersion areconsistent with each other.
Let us, at the end of this chapter, add a remark on theestimation of masses from an observed velocity distribution.
13

S. Roser et al.: A deep all-sky census of the Hyades
Chandrasekhar (1942) introduces the ”average” radius R of thecluster such that the equation
M < v2 >=G2
M2
R(14)
holds. Here M is the total (gravitationally bound) mass of thecluster. This is fulfilled for
1R=
1M2
∑ mim j
ri, j(15)
where the summation is now carried out over allmi,m j with i ,j. The so-called ”average” radius of the cluster is determined viathe weighted mean over the inverse distances between individualstars. For the Hyades with their tidal mass of 276m⊙ we find R= 4.53 pc, which in our case happens to be 1.5 timesrco. Themeasured velocity dispersion can be used to determine the mass(virial mass) of an open cluster via
M =2G< v2 > R. (16)
The two terms on the right-hand side of Eq.16,< v2 > and Rdepend on the sample for which the velocity dispersion is mea-sured. This should be taken into account when deriving the massof a cluster from its velocity dispersion.
8. Summary
We used a subset of PPMXL, derived from a combination ofPPMXL proper motions with UCAC3 and CMC14 observations,and augmented by CMC14 photometry to perform the mostcomplete three dimensional census of the Hyades to date. Thiscensus yielded 724 stellar systems as candidates moving with thesame space motion as the cluster. These candidates have beenfound from an application of the convergent point method, andwe verified the resulting secular parallaxes by photometricparal-laxes. Although we tested the full catalogue for stars co-movingwith the Hyades centre, we restricted our analysis to stars withderived distances smaller than 30 pc from the cluster centre. Wedid not search for new white dwarfs, as they may be at the de-tection limit of the 2MASS, and need a separate approach. Ourcensus is complete down toMKs ≈ 7.3, corresponding to massesof 0.25 m⊙. Incompleteness for more massive stars is no longer aquestion of limited field-size; the only reason for incompletenessmay be possibly erroneous proper motions and/or photometry.
The secular parallaxes allow us to construct an empiricalColour-Magnitude Diagram (hereMKs vs. J − Ks) from thebrightest stars down toMKs ≈ 9. Comparing this with 3 differ-ent theoretical isochrones relevant to the metallicity andage ofthe Hyades we find that only the isochrones from Baraffe et al.(1998) more or less describe the loci of the Hyades stars fainterthan aboutMKs = 5 in the CMD, whereas the isochrones fromMarigo et al. (2008) and Dotter et al. (2008) predictJ − Kscolours which are too blue.
Using the mass-luminosity relation described in Sect. 5 wederive M(r), the cumulative mass as a function of the distancefrom the cluster centre. M(r) is increasing up to our arbitrarilyset limiting radius of 30 pc. If we consider the tidal field of theGalaxy via Eq. 3, we derive a tidal radius of about 9 pc, con-sistent with earlier determinations. The M/L relation gives ussystem masses for unresolved binaries. Using these individualmasses we find that 276 m⊙ (364 stars) are bound within thetidal radius of the cluster, another 100 m⊙ (190 stars) are foundin the halo up to 2 tidal radii, and another 60 m⊙ (170 stars) are
found as co-movers outside 2 tidal radii. Here the masses arecor-rected for contamination, whereas the number of stars is given ascounted.
The spatial distribution of the Hyades has a clear ellipsoidalshape considering both bound as well as unbound stars. Thelargest axis is almost parallel to the galactic plane, and formsan angle of about 30 deg with the galactocentric radius vector(in the direction of the galactic rotation). The ellipticity and theorientation of the principal axis may already reflect the onset oftidal tails as predicted by the models.
Within its tidal radius (rt = 9pc) the spatial distribution fol-lows excellently a Plummer model with core radius rco = 3.1pcand a central density of 2.21 m⊙pc−3. The half-mass radius of thecluster is rh = 4.1pc, and the ratio rh/rco is 1.32, also in excellentagreement with the model value. The “average” cluster radius Rdetermined from the distances between the stars is found to be4.53 pc.
Mass segregation is clearly seen in the Hyades. The averagemass per star drops from 1.1 m⊙ at the centre to 0.5 m⊙ at thetidal radius. This mass segregation is also seen in theKs-bandluminosity function KLF. In the core the KLF shows a peak atMKs ≈ 4 which is more prominent than the other atMKs = 7,whereas this is vice versa in the corona. We see clear indicationsfor the presence of the so-called Wielen dip at aboutMKs = 5.Mass segregation exaggerates the Wielen dip in the core, whileit is present in all other regimes (corona, halo and co-movers) asa flattening of the slope of the luminosity function.
Compared with the KLF of the field stars in the solar neigh-bourhood (Fig. 3) the Hyades KLF is generally flatter than thefield KLF in all regions of the cluster in the range 1< MKs <
6. The increase in the field KLF forMKs > 7 is not seen in theHyades KLF with the caution that our sample is becoming in-complete there.
The mass function of all co-moving stars (bound or un-bound) is complete down to 0.25 m⊙. About 94% of the totalmass is in stars more massive than 0.25 m⊙. Hypothetically, evena constant logarithmic mass function at lower masses between0.25 m⊙ and 0.01 m⊙ (for which we so far see no indication)would add only 8% to the total mass we determined. From liter-ature there is no indication for a considerable amount of mass inwhite dwarfs. Hence, hidden mass could only be in unresolvedbinaries, and, indeed, we got hints to this from the observedhighvelocity dispersion. Adopting the estimate of 25% binariesfromGunn et al. (1988), the total mass would increase by 17%.
Mass segregation is also seen impressively in the mass func-tion (Fig. 10). Whereas in the core, the PDMF sharply peaks atabout 1 m⊙ and steeply drops to both sides, the number of lowermass stars increases up to the tidal radius to give a practicallyflat logarithmic mass function. If the IMF had been a Kroupa(2001) IMF we see strong dynamical evolution on the low-massside. This would hold even more for a Salpeter IMF. A compar-ison with the mass function of a much younger cluster like thePleiades supports this conclusion. Adopting a Kroupa IMF wederive a minimum mass of 1100 m⊙ for the cluster at formation.
The distribution of the velocity dispersion is clearly differentinside and outside the tidal radius of the cluster. The observedvelocity dispersion within the tidal radius is not sustained by thetotal gravitational energy of the cluster. A relatively high frac-tion of binaries is needed to overcome this discrepancy, becausebinaries not only increase the total mass, but their orbitalmo-tions also may strongly corrupt the proper motions used for thedetermination of the velocity dispersion. Our investigation onpossible contamination by local field stars has shown that the
14

S. Roser et al.: A deep all-sky census of the Hyades
population outside the tidal radius is strongly related to the clus-ter itself and consists of stars that left the cluster in the past.
Putting all together, we observe our neighbouring open clus-ter as an evolving object, which is permanently losing boundmembers that we can pin-point up to a certain distance once theyleft the cluster. The results that we obtained here for the spatial,the velocity and the mass distribution of the Hyades give start-ing conditions for ongoingN-body simulations to reveal the pastand the future of this cluster
Acknowledgements. Part of this work was supported by DFG grant RO 528/10-1. We are grateful to Hartmut Jahreiß who furnished us with the KLF of thenearby stars prior to publication. We also thank Hans Zinnecker and AndreasJust for helpful discussions. We further thank the anonymous referee for hishelpful comments. This paper is based on observations from the ESA Hipparcossatellite. This publication makes use of data products fromthe Two Micron AllSky Survey, which is a joint project of the University of Massachusetts andthe Infrared Processing and Analysis Center/California Institute of Technology,funded by the National Aeronautics and Space Administration and the NationalScience Foundation. This research has made use of the SIMBADdatabase, op-erated at CDS, Strasbourg, France.
ReferencesBaraffe, I., Chabrier, G., Allard, F., & Hauschildt, P. H. 1998, A&A, 337, 403Boudreault, S., Bailer-Jones, C. A. L., Goldman, B., Henning, T., & Caballero,
J. A. 2010, A&A, 510, A27Bouvier, J., et al. 2008, A&A, 481, 661Chandrasekhar, S. 1942, Principles of stellar dynamics, The University of
Chicago PressCopenhagen Univ. Obs., Inst. of Astronomy, Cambridge, UK, &Real Instituto
Y Observatorio de La Armada, F. E. S. 2006, VizieR Online DataCatalog,1304, 0
de Bruijne, J. H. J., Hoogerwerf, R., & de Zeeuw, P. T. 2001, A&A, 367, 111De Gennaro, S., von Hippel, T., Jefferys, W. H., Stein, N., van Dyk, D., & Jeffery,
E. 2009, ApJ, 696, 12Dehnen, W., & Binney, J. J. 1998, MNRAS, 298, 387Devine, K. E., Churchwell, E. B., Indebetouw, R., Watson, C., & Crawford, S. M.
2008, AJ, 135, 2095Dotter, A., Chaboyer, B., Jevremovic, D., Kostov, V., Baron, E., & Ferguson,
J. W. 2008, ApJS, 178, 89Frankowski, A., Jancart, S., & Jorissen, A. 2007, A&A, 464, 377Gizis, J. E., Reid, I. N., & Monet, D. G. 1999, AJ, 118, 997Grenon, M. 2002, Highlights of Astronomy, 12, 680Gunn, J. E., Griffin, R. F., Griffin, R. E. M., & Zimmerman, B. A. 1988, AJ, 96,
198Hanson, R. B. 1975, AJ, 80, 379Høg, E., et al. 2000, A&A, 355, L27Hogan, E., Jameson, R. F., Casewell, S. L., Osbourne, S. L., &Hambly, N. C.
2008, MNRAS, 388, 495Jose, J., et al. 2008, MNRAS, 384, 1675Just, A., Berczik, P., Petrov, M. I., & Ernst, A. 2009, MNRAS,392, 969Kharchenko, N., & Schilbach, E. 1996, Baltic Astronomy, 5, 337Kharchenko, N. V. 2001, Kinematika i Fizika Nebesnykh Tel, 17, 409Kharchenko, N. V., Berczik, P., Petrov, M. I., Piskunov, A. E., Roser, S.,
Schilbach, E., & Scholz, R.-D. 2009, A&A, 495, 807Kroupa, P., Tout, C. A., & Gilmore, G. 1990, MNRAS, 244, 76Kroupa, P. 2001, MNRAS, 322, 231Lebreton, Y., Fernandes, J., & Lejeune, T. 2001, A&A, 374, 540Marigo, P., Girardi, L., Bressan, A., Groenewegen, M. A. T.,Silva, L., &
Granato, G. L. 2008, A&A, 482, 883Mason, B. D., Wycoff, G. L., Hartkopf, W. I., Douglass, G. G., & Worley, C. E.
2001, AJ, 122, 3466Monet, D. G., et al. 2003, AJ, 125, 984Moraux, E., Bouvier, J., Stauffer, J. R., & Cuillandre, J.-C. 2003, A&A, 400, 891Paulson, D. B., Sneden, C., & Cochran, W. D. 2003, AJ, 125, 3185Pels, G., Oort, J. H., & Pels-Kluyver, H. A. 1975, A&A, 43, 423Perryman, M. A. C., et al. 1998, A&A, 331, 81Pinsonneault, M. H., Terndrup, D. M., Hanson, R. B., & Stauffer, J. R. 2004,
ApJ, 600, 946Piskunov, A. E., Kharchenko, N. V., Roser, S., Schilbach, E., & Scholz, R.-D.
2006, A&A, 445, 545Piskunov, A. E., Schilbach, E., Kharchenko, N. V., Roser, S., & Scholz, R.-D.
2007, A&A, 468, 151Plummer, H. C. 1915, MNRAS, 76, 107
Reid, N. 1992, MNRAS, 257, 257Reid, I. N., & Hawley, S. L. 1999, AJ, 117, 343Roeser, S., Demleitner, M., & Schilbach, E. 2010, AJ, 139, 2440Schwan, H. 1991, A&A, 243, 386Schwan, H. 1990, A&A, 228, 69Siess, L., Dufour, E., & Forestini, M. 2000, A&A, 358, 593Skrutskie, M. F., et al. 2006, AJ, 131, 1163Smart, W. M. 1968, London: Longmans, 1968.Spitzer, L., Jr., & Shull, J. M. 1975, ApJ, 200, 339Taylor, B. J. 2006, AJ, 132, 2453Trumpler, R. J., & Weaver, H. F. 1953, Dover Books on Astronomy and Space
Topics, New York: Dover Publications, —c1953,van Altena, W. F. 1969, AJ, 74, 2van Bueren, H. G. 1952, Bull. Astron. Inst. Netherlands, 11,385van Leeuwen, F. 2007, Astrophysics and Space Science Library, 350,van Leeuwen, F. 2009, A&A, 497, 209von Hippel, T. 1998, AJ, 115, 1536Wielen, R., Dettbarn, C., Jahreiß, H., Lenhardt, H., & Schwan, H. 1999, A&A,
346, 675Zacharias, N., et al. 2010, AJ, 139, 2184
15