A cumulative gender impact assessment of ten …...A cumulative gender impact assessment of ten...
8
1 A cumulative gender impact assessment of ten years of austerity policies A briefing from the UK Women’s Budget Group on the cumulative distributional effects of cuts in public spending and tax changes on household income by gendered types over the period 2010-20 This briefing examines the real-term distributional impact of tax changes and public spending and social security cuts as part of the deficit reduction strategy implemented by the Conservative-Liberal Democrat Coalition government between 2010 and 2015 and continued by the Conservative government elected in May 2015. The Conservative government has vowed to reach a structural surplus in the public finances by 2020 with an austerity programme made up of 89% public spending cuts and 11% net tax rises. As the Women’s Budget Group and other observers have noted repeatedly, despite the requirements of the 2010 Equalities Act to carry out gender impact analysis of significant reforms, no comprehensive equality impact analysis was performed of any Budget or Spending Review since 2010. Instead incomplete and ad hoc gender effects were suggested for some individual measures. 1 Previous analysis by Landman Economics and the Women’s Budget Group has identified significant, and disproportionate, negative impacts of the government’s plans on women and low-income households (in which women predominate) despite claims that the burden would be shared equally. 2 1 See WBG Budget responses, in particular the July 2015 response as the presentation of distributional impacts as usually done (incidence by quintiles) was entirely removed (http://bit.ly/1WUU6Mg ); See also EHRC report by Reed and Portes (2014) at http://bit.ly/1TnP0dC 2 Reed and Portes (2014) ibid., and WBG briefing on Plan F (2013) at http://bit.ly/1QrnllT Key findings Austerity policies that are planned for the 2015-20 Parliament have an even more regressive distributional impact than those implemented in the 2010-15 Parliament, with the living standards of the 10% lowest income households being cut by an average of 21% annually in 2020, more than five times as much as the cut to living standards for households in the top decile Women are hit harder than men and households headed by women such as lone parents and single female pensioners are hit hardest, both being about 20% worse-off on average in 2020 The full implementation by 2020 of Universal Credit is the main factor behind the deepening of the regressive cuts over this Parliament, as cuts to its already less generous rates and thresholds were not reversed in the 2015 Autumn Statement, unlike those to tax credits Besides cuts to household incomes, the effect of central government cuts on school and social care budgets is the main factor behind the drop in living standards, mainly for the bottom half of the income distribution
Transcript of A cumulative gender impact assessment of ten …...A cumulative gender impact assessment of ten...

1
A cumulative gender impact assessment of ten years of austerity policies A briefing from the UK Women’s Budget Group on the cumulative distributional effects of cuts in public
spending and tax changes on household income by gendered types over the period 2010-20
This briefing examines the real-term distributional
impact of tax changes and public spending and
social security cuts as part of the deficit reduction
strategy implemented by the Conservative-Liberal
Democrat Coalition government between 2010
and 2015 and continued by the Conservative
government elected in May 2015.
The Conservative government has vowed to reach
a structural surplus in the public finances by 2020
with an austerity programme made up of 89%
public spending cuts and 11% net tax rises.
As the Women’s Budget Group and other
observers have noted repeatedly, despite the
requirements of the 2010 Equalities Act to carry
out gender impact analysis of significant reforms,
no comprehensive equality impact analysis was
performed of any Budget or Spending Review
since 2010. Instead incomplete and ad hoc gender
effects were suggested for some individual
measures.1
Previous analysis by Landman Economics and the
Women’s Budget Group has identified significant,
and disproportionate, negative impacts of the
government’s plans on women and low-income
households (in which women predominate)
despite claims that the burden would be shared
equally.2
1 See WBG Budget responses, in particular the July 2015
response as the presentation of distributional impacts as
usually done (incidence by quintiles) was entirely removed
(http://bit.ly/1WUU6Mg); See also EHRC report by Reed
and Portes (2014) at http://bit.ly/1TnP0dC
2 Reed and Portes (2014) ibid., and WBG briefing on Plan F
(2013) at http://bit.ly/1QrnllT
Key findings
Austerity policies that are planned for the 2015-20 Parliament have an even more regressive
distributional impact than those implemented in the 2010-15 Parliament, with the living standards
of the 10% lowest income households being cut by an average of 21% annually in 2020, more than
five times as much as the cut to living standards for households in the top decile
Women are hit harder than men and households headed by women such as lone parents and single
female pensioners are hit hardest, both being about 20% worse-off on average in 2020
The full implementation by 2020 of Universal Credit is the main factor behind the deepening of the
regressive cuts over this Parliament, as cuts to its already less generous rates and thresholds were
not reversed in the 2015 Autumn Statement, unlike those to tax credits
Besides cuts to household incomes, the effect of central government cuts on school and social care
budgets is the main factor behind the drop in living standards, mainly for the bottom half of the
income distribution

2
This is mainly due to the fact that women rely
more heavily on public services and social security
transfers, as gender norms operate to maintain
women on low incomes and in a primary carer
role.
Analysis by the House of Commons Library has
already shown the lasting gender bias of tax
benefit changes. Of the £82bn in cumulative tax
changes and cuts in social security spending
announced since 2010 that will have been
implemented by 2020, 81% will have come from
women.3 (However it didn’t include cuts to public
services, neither Universal Credit).
Despite all this evidence, a recent motion to call
on the government to conduct an urgent
cumulative impact assessment on women and
other protected groups in December 2015 was
voted down.4
Producing a thorough gender impact analysis
This briefing seeks to address this gap by
providing a cumulative gender impact assessment
of a wide range of tax changes and cuts to social
security spending as well as to public services. It
includes all direct income taxation, indirect
taxation, council tax, social security transfers,
including Universal Credit, and public services
provided in kind (healthcare, education, social
care etc.). 5
3 See 2015 AFS response by WBG (http://bit.ly/1QbC6Ir)
4 Debate in the House of Commons on 9 Dec. 2015 (see
Hansard records at http://bit.ly/1NOuN8m)
5 For a detailed gender impact analysis of the 2010-15
coalition government austerity policies, see Reed, H. (2016)
‘The gender impact of austerity in the UK under the
Conservative-Liberal Democrat Coalition Government,
2010-15’. In Bargawi, H, Cozzi, G and Himmelweit, S. (eds)
Lives after Austerity: gendered impacts and sustainable
alternatives for Europe, London: Routledge
It looks at different household types, identified by
gender relevant characteristics (such as female
lone parents and female single pensioners) as well
as by decile groups.
Two microsimulation tools developed by Landman
Economics are used:
o A tax-benefit model
o A public service spending model
The first one simulates changes in households’
disposable income after a series of policy changes
affecting taxation and social security transfers
have been considered.
The second tool looks at the projected impact of
changes in public spending on services such as
health, education, transport and social care as a
result of changes in central government funding.
It does so by assessing the value of these services
as used by individual households.
The calculations involve estimating a baseline
scenario to May 2020 in which the system in place
in May 2010, just before the general election, is
maintained.
In the baseline scenario, benefits, tax credits and
tax thresholds are assumed to rise using the pre-
2010 rules for the 2010-15 Parliament, and using
the pre-2015 rules for the 2015-20 Parliament.6
Funding for in-kind public services such as health
and education is assumed to rise in line with the
general level of prices in the economy7. This is the
counterfactual against which policy changes are
measured.8
6 We assume that tax credits and tax thresholds are uprated
using the RPI for 2010-15 while benefits are uprated by a
combination of RPI and the ROSSI index. For 2015-20 we
assume CPI uprating as the default. Full take-up is assumed.
7 Technically the index used to uprate public spending
totals is known as the GDP deflator.
8 ‘Raw’ incomes are from 2013-14 and uprated to April
2015 with earnings index rises, after which they are
uprated with CPI up to 2020.
3
The ‘post-changes’ scenario that is simulated
calculates projected household incomes, that
similarly include the value of public services, by
May 2020 after all the tax/benefit and public
spending changes between June 2010 and 2020
have been included. The difference between the
‘post-changes’ income and the baseline income
for a given household is a measure of the
cumulative impact of all the changes on that
household. All figures are expressed in April 2015
prices so the cash amounts are real-terms sterling.
The main dataset used is the Family Resources
Survey, with some data on public services use
coming from other data sets and matched to
households in the main survey.
Distributional impact of tax and social security
measures 2015-20
In the July 2015 Budget, the government
announced further cuts to social security spending
worth £12bn per year by 2020 (mainly through
reducing Universal Credit (UC), cutting housing
benefit and freezing most working-age benefits).
The so-called “U-turn” on tax credits announced
in the 2015 Autumn Statement is in fact only
temporary, as tax credits are set to be fully
replaced by 20209 by a much less generous
Universal Credit system to which the drastic cuts
announced in the July Budget will still fully apply.
Figure 1 shows that the cuts announced since July
2015 will, on average, reduce annual disposable
household income by £1500 by 2020. For the
second lowest decile, the cuts may amount to a
reduction in disposable income of up to £2500.10
9 We assume no transitional protection and full roll-out by
then. This might be pushed back (http://bit.ly/1QXo1oB).
10 Households are ranked by their (equivalised) disposable
income in ten equal decile groups. Decile 1 includes the
10% poorest households and Decile 10 the 10% richest
households.
The richest decile group sees a net rise in
disposable income, due to reduced taxation, while
in the lower part of the income distribution UC
constitutes the lion’s share of the cut.
The overall picture is one of regressive cuts as the
poorest 30% of households lose on average about
12% of their disposable income compared to 0%
on average for the richest 30%.
Figure 1: Real-term impact by 2020 on household
disposable income by decile (2015-20)11
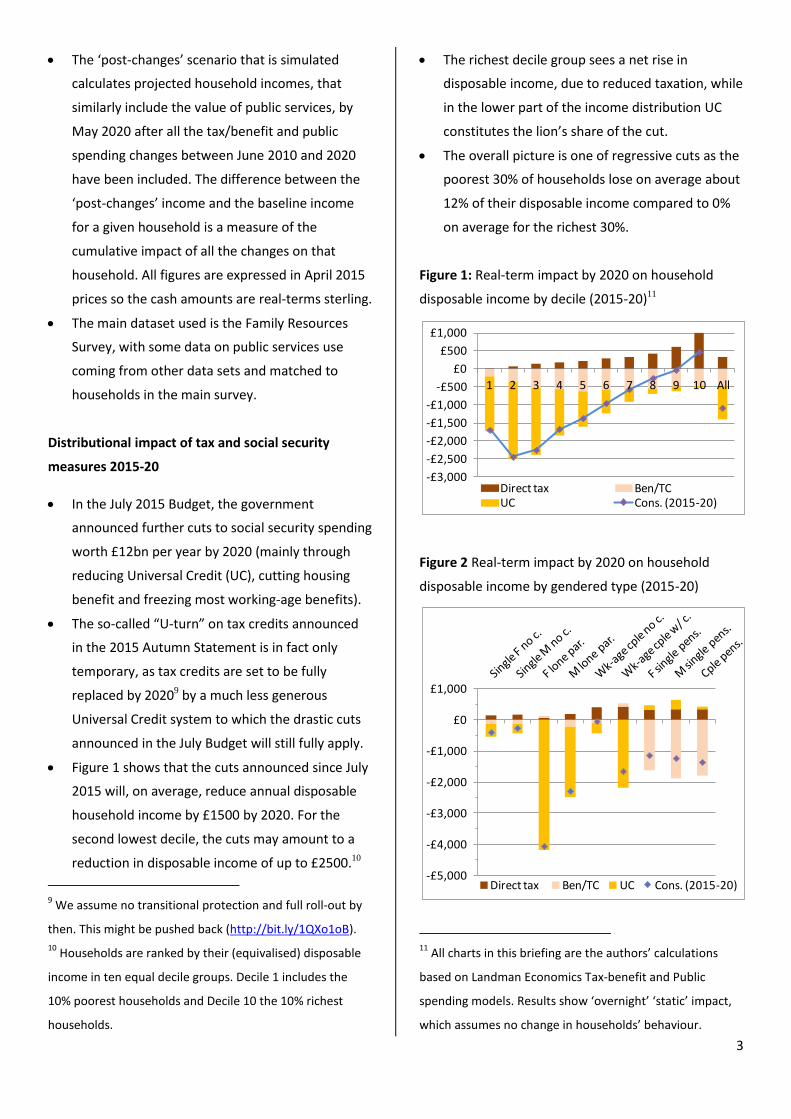
Figure 2 Real-term impact by 2020 on household
disposable income by gendered type (2015-20)
11
All charts in this briefing are the authors’ calculations
based on Landman Economics Tax-benefit and Public
spending models. Results show ‘overnight’ ‘static’ impact,
which assumes no change in households’ behaviour.
-£3,000
-£2,500
-£2,000
-£1,500
-£1,000
-£500
£0
£500
£1,000
1 2 3 4 5 6 7 8 9 10 All
Direct tax Ben/TCUC Cons. (2015-20)
-£5,000
-£4,000
-£3,000
-£2,000
-£1,000
£0
£1,000
Direct tax Ben/TC UC Cons. (2015-20)

4
Figure 2 shows the same impact by 2020 but for
household types broken down by their gender
composition.12
As cuts to UC are prominent, it is not surprising
that households with children are most affected.
Female lone parents (92% of lone parents)13 are
most affected overall, with an estimated £4000
annual average loss in 2020, a huge 17% cut as a
proportion of their disposable income.
Despite rises in their state pension, pensioners
would still experience a net real cut on average
due to reduction in other social security benefits.
The three types of single adult-headed
households lose more when headed by a woman
than by a man.
Individual impacts by gender
A fuller gender impact analysis would also
examine the effect of cuts on individual incomes.
With a few assumptions about allocation rules
(such as, for non-individual taxes and benefits,
splitting them equally or awarding them to an
individual according to the nature of the tax or
benefit), it is possible to draw a picture of the tax-
benefit changes by decile and by gender.
In their report to the EHRC, Reed and Portes
(2014)14 calculated the cumulative impact of tax-
benefit changes for the period 2010-15 by gender
and deciles and showed that at every decile,
women stood to lose more than men in both cash
terms (50% more) and as a percentage of income
(twice as much).
12
This method was developed by Women’s Budget Group
members Diane Elson, Sue Himmelweit and Howard Reed
in their analysis of the gender impact of the Coalition
government austerity policies (see http://bit.ly/1QrnllT)
13 Caution is needed for results for male lone parents as
very few such households were observed in the dataset.
14 See http://bit.ly/1TnP0dC
We have not done this analysis for the 2015-20
changes yet but it is likely that the picture will
show similar results given that similar types of
benefits are being cut and further tax cuts that
benefit men more than women are being
proposed (such as further rises in the personal tax
allowance).
Cumulative impact of tax/benefits 2010-20
Given that the cuts announced by the 2010-15
Coalition have ongoing effects during the 2015-20
period – and indeed some, such as UC, are being
implemented only then – a cumulative analysis is
required in order to assess the full effect of the
austerity period.
Figure 3: Cumulative impact of 2010-20 tax/benefit
changes by period (% of disposable income by decile)
Figure 3 clearly shows the regressive pattern of
the tax/benefit changes over the whole period of
2010-20. Changes were already regressive in the
first period (shown as ‘Coalition 2010-15’), and
intensified by plans by the previous coalition
government for the period 2015-20 (‘Coalition
2015-20’). Despite this, the current government
has ensured a substantial deepening of those
regressive effects (‘Conservative 2015-20’).
At the very bottom of the distribution, households
are set to lose up to 25% of their disposable
-25%
-20%
-15%
-10%
-5%
0%
5%
1 2 3 4 5 6 7 8 9 10 All
Coal. (2010-15) Coal. (2015-20)
Cons. (2015-20) Cumul. (2010-20)

5
income on average in 2020 as a result of the
changes over the whole period, and the next
decile would lose 20%, compared to a 5% average
cut for the top 30% of the distribution.
The intensification of the regressive pattern of
cuts is mainly due to the introduction of Universal
Credit as explained above.
This effect is not compensated for by the higher
minimum wage, set to reach £9.20 per hour by
2020. As the Women’s Budget Group has pointed
out in its response to the 2015 Autumn
Statement, those benefiting from the rise in the
minimum wage are not necessarily in the same
households as those being hit by cuts in tax
credits and UC.15
Figure 4: Cumulative impact of 2010-20 tax/benefit
changes (% disp. income by gendered household type)
Figure 4 shows again that the cumulative impact
of tax/benefit changes is more negative on female
single-adult households than on male single-adult
households. Female lone parents are set to lose
26% of their disposable income on average by
2020 (£6,300 annually, the bulk of which due to
UC cuts). Single childless women would lose 17%
of their income (£3,300, mainly through replacing
15
See http://bit.ly/1QbC6Ir
tax credits with less generous UC) while single
female pensioners would be 15% worse-off
(£2,400), mainly through various benefit cuts.
Impact of cuts in public spending on services
In the 2015 Spending Review, further cuts in
public spending were announced, with the aim of
achieving a £12bn reduction in annual spending
by 2020.16
Not all departments faced real-term cuts, with
health and school education budgets protected
(or raised). However, such budget increases did
not keep up with population changes (which the
Landman Economics spending tool accounts for).
The spending tool includes the value of services
(i.e. cost of public spending on them) that can be
allocated to households and measured reliably in
the data (about 71% of public spending on
services).17
Central government announced drastic cuts to its
grant to local government. The hypothecated tax
that the government has allowed local authorities
to raise (increasing Council Tax by up to 2% per
year) in order to fund additional social care is
included in the model.
However this is a maximum assumption and the
results below show that even at its highest, it
does not compensate for central government
funding cuts. Moreover there is no guarantee in
practice that local councils will be able to raise
equivalent amounts, especially councils in poorer
areas, where the need for publicly-subsidised
social care is also higher.
16
Ibid. for details. Note that the distributional and gender
impact analysis provided here uses a revised methodology
from that used in the December report (corrections for
increase in population sizes), so figures differ.
17 For a detailed explanation of the method, see Reed and
Portes (2014) at http://bit.ly/1TnP0dC
-30%
-25%
-20%
-15%
-10%
-5%
0%
5%
Coal. (2010-15) Coal. (2015-20)
Cons. (2015-20) Cumul. (2010-20)

6
Figure 5: Real-term impact of public spending cuts
2015-20, by deciles of household income
Social care and school spending are the main
contributors to overall cuts, followed by
healthcare. The average reduction per household
in the value of public services is about £1100, and
between £1250 and £1450 for the bottom 60% of
the distribution.
Figure 6: Real-term impact of public spending cuts
2015-20, by gendered household type
Again, households with school-aged children
stand to lose most from cuts to school budgets,
while pensioners lose out more from social care
cuts, especially female single pensioners.
Overall cumulative impact 2010-2020: ten years of
gender-biased austerity
Figure 7a: Cumulative impact of tax/benefit and
spending cuts by income decile (2010-20)
Figure 7b: Cumulative impact of tax/benefit and
spending cuts as % of living standards by decile (2010-
20)
We can now put the tax/benefit and public
spending cuts together, and measure them
against household living standards (i.e. the
disposable income of a household plus the value
of the public services which it uses).
Figures 7a and 7b confirm a picture of strongly
regressive overall cuts, especially when measured
as a proportion of living standards in Figure 7b.
The 2015-20 period of cumulative tax-benefit and
spending cuts significantly accentuates an already
-£1,600
-£1,400
-£1,200
-£1,000
-£800
-£600
-£400
-£200
£0
£200
1 2 3 4 5 6 7 8 9 10 Allpolice
transport
housing
social care
HE/FE
school
early years
health
total
-£2,000
-£1,750
-£1,500
-£1,250
-£1,000
-£750
-£500
-£250
£0
£250
health early years school
HE/FE social care housing
transport police total
-£8,000
-£6,000
-£4,000
-£2,000
£0
1 2 3 4 5 6 7 8 9 10 All
Tax/ben Coal. Spending Coal. Tax/ben Cons.
Spending Cons. Total 2010-20
-24%
-20%
-16%
-12%
-8%
-4%
0%
1 2 3 4 5 6 7 8 9 10 All
Tax/ben Coal. Spending Coal. Tax/ben Cons.
Spending Cons. Total 2010-20

7
existing regressive pattern inherited from the
2010-15 announcements.
By 2020, the 10% poorest households lose an
equivalent of £7,100 per annum, or 23% of their
living standards, compared to £4400 for the
highest decile group, just 5% of their living
standards.
Figure 8a: Cumulative impact of tax/benefit and
spending cuts by gendered household type (2010-20)
Figure 8b: Cumulative impact of tax/benefit and
spending cuts in % of living standards by gendered
household type (2010-20)
Figures 8a and 8b also show that women in single
adult households face disproportionate cuts
overall, with female lone parents, female single
pensioners and single childless women having
their living standards reduced by 21%, 20% and
17% respectively.
Conclusion
The simulations undertaken for this briefing show
that announcements made thus far by the
Conservative government will disproportionately
negatively impact the living standards of the
lowest-income households and women. This is on
top of the severe and unequal impact of the 2010-
15 coalition government’s policies.
Further, this briefing has shown that tools for
cumulative gender impact analysis exist; they can
easily be made available to various stakeholders,
including government departments, to fulfil their
equality duties and improve policy making.
Conducting cumulative gender and distributional
impact analysis of this sort is a necessary part of
understanding the full impact of government
policy.
We urge the government to use this analysis to
change its social and fiscal policy priorities and in
particular to reverse the drastic cuts to Universal
Credit. Otherwise lower-income households and
women will continue to bear the brunt of
austerity policies, with long-term damage to their
life chances.
The Women’s Budget Group has repeatedly called
for a Feminist Plan F that would deliver benefits to
all, not just women.18 Plan F calls for a different
fiscal and economic strategy whereby significant
public investment in social infrastructure fuels the
development of public services in social care,
childcare, health and education in order to foster
a self-funding caring and sustainable economy
with greater gender equality.
18
See previous briefings by WBG at http://bit.ly/1eJbMea
-£10,000
-£8,000
-£6,000
-£4,000
-£2,000
£0
Tax/ben Coal. Spending Coal. Tax/ben Cons.
Spending Cons. Total 2010-20
-24%
-20%
-16%
-12%
-8%
-4%
0%
Tax/ben Coal. Spending Coal. Tax/ben Cons.
Spending Cons. Total 2010-20

8
Written by
Jerome De Henau (Women’s Budget Group and Senior Lecturer in Economics at the Open University)
[email protected] (07860556254)
Howard Reed (Women’s Budget Group and Director of Landman Economics)
Women’s Budget Group, March 2016.
The UK Women’s Budget Group is an independent, voluntary organization made up of individuals from academia,
NGOs and trade unions. See www.wbg.org.uk
Contact: Eva Neitzert (WBG Head of development and coordination): [email protected]