
A CROSS SECTIONAL COMPARISON AND ANALYSIS OF …
41
A CROSS SECTIONAL COMPARISON AND ANALYSIS OF PRODUCTIVITY FOR 21 NATIONAL POSTAL ADMINISTRATIONS ROBERT H. COHEN EDWARD H. CHU WILLIAM W. FERGUSON SPYROS S. XENAKIS PUSLISHED IN MANAGING CHANGE IN THE POSTAL AND DEL~ERY INDUSTRIES, ED. MICHAEL A. CREW AND PAUL R. KLEINDORFER,KLWVER ACADEMIC PUBLISHERS, JANUARY 1997. MESSRS. COHEN, FERG”SON, AND XENMIS ARE PROFESSI0tL.L STAFF YEYBERS OF THE U.S. POSTAL RITE COMMISSION. MR. CHU W&S A PROFESS,OWL SThFF YEYSER OF THE POSTAL RATE COMMISSION FROM 19834995. HE IS CURRENTLY A PROFESSIDWL STAFF YEUSER OF THE ENVIRONMENTAL PROTECTION ASENCY. THE VIEWS EXPRESSEDIN THIS PAPER ARE THOSE OF THE AUTHORS AND Do NOT NECESSARILY REPRESENT THE W,N,ONS OF THE POSTAL RATE COYY,SS,ON OR THE EWIRONMENTAL PROTECTION AGENCY. A PRELIYIWRY VERSION OF THIS PAPER WAS PRESENTED AT ME CONFERENCE cm C~MHERCI~L~U~I~N OF POSTAL AND DELIVERY SERVICES, STOCKHOLY, SWEDEN, MAY 1984.
Transcript of A CROSS SECTIONAL COMPARISON AND ANALYSIS OF …
A CROSS SECTIONAL COMPARISON AND ANALYSIS OF PRODUCTIVITY FOR
21 NATIONAL POSTAL ADMINISTRATIONS
ROBERT H. COHEN
EDWARD H. CHU WILLIAM W. FERGUSON
SPYROS S. XENAKIS
PUSLISHED IN MANAGING CHANGE IN THE POSTAL AND DEL~ERY INDUSTRIES,
ED. MICHAEL A. CREW AND PAUL R. KLEINDORFER, KLWVER ACADEMIC PUBLISHERS, JANUARY 1997.
MESSRS. COHEN, FERG”SON, AND XENMIS ARE PROFESSI0tL.L STAFF YEYBERS OF THE U.S. POSTAL RITE COMMISSION. MR. CHU W&S A PROFESS,OWL SThFF YEYSER OF THE POSTAL RATE COMMISSION FROM 19834995. HE IS CURRENTLY A PROFESSIDWL STAFF YEUSER OF THE ENVIRONMENTAL PROTECTION ASENCY. THE VIEWS EXPRESSED IN THIS PAPER ARE THOSE OF THE AUTHORS AND Do NOT NECESSARILY REPRESENT THE W,N,ONS OF THE POSTAL RATE COYY,SS,ON OR THE EWIRONMENTAL PROTECTION AGENCY. A
PRELIYIWRY VERSION OF THIS PAPER WAS PRESENTED AT ME CONFERENCE cm C~MHERCI~L~U~I~N OF POSTAL AND DELIVERY SERVICES, STOCKHOLY, SWEDEN, MAY 1984.

Introduction
Economic comparisons of national postal systems are rare owing to a lack of
good quality cross sectional data. Consequently, postal economics has relied
primarily on studies Of single national postal administrations. Because postal
administrations are monopolies, they frequently defy comparison with other firms in
the country they serve. Efforts to develop cross sectional data should pay high
dividends by allowing us to view postal administrations with some perspective and
by improving our understanding of the economics of national posts. In particular,
cross sectional data should make it possible to analyze the effect of scale on the
post.
This paper compares some basic economic statistics from postal
administrations of 21 industrial nations. An econometric model is developed to
analyze labor productivity differences among the 21 administrations, and it explains
about 60 percent of the differences. Universal postal union (UPU) data from 1988
is used and considerable effort has been devoted trying to ensure that consistent
things were being measured by the different postal administrations in their UPU
data submissions. The data are presented in formats which facilitate comparisons,
and the paper describes how the data were made suitable for cross sectional
comparison and analysis.
Volume and Cost Data
The data presented can be divided into basic and calculated. The former
consists of mail volumes (by categories), total labor cost, number of employees,
and total expenses. Other data are calculated using the basic data. For this paper
we have calculated: (1) volume per capita by category; (2) expenses per capita;
(3) expenses as a percent of GDP; (4) average annual labor cost; (5) weighted mail
volume; (6) unit labor cost (ULC); (7) unit operating expenses (UOE); (8) average
annual hours worked; (9) labor productivity; (10) hourly compensation; and
(11) wage premium.

2
The preponderance of the data used in this paper come from the UPU’s
Postal Statistics Year Book for 1988. UPU data for 1988 were available from 21 of
the 23 countries listed as industrial by the IMF.’ * Work on this paper began in
1993 and data for the year 1988 was used because it was relatively complete and
could be supplemented, when appropriate, using data contained in the Green
Paper for twelve European countries.3 It was necessary to obtain supplementary
data where UPU data elements were absent or ambiguous. UPU data were
supplemented by data from the annual reports of Austria and Japan. Additional
statistics and occasionally estimates, where data were not available, were provided
by the following postal administrations: Australia, Belgium, Canada, Denmark,
Finland, France, Germany, Ireland, Netherlands, Norway, Sweden, Switzerland and
United Kingdom.4 Supplemental data for the US. came from several sources
which are cited below.
The Organization for Economic Cooperation and Development (OECD) and
International Monetary Fund (IMF) are the sources of the 1988 national macro
economic and demographic data used in the paper.
Prices of goods and services vary greatly among countries, and commercial
market exchange rates do not reliably indicate relative differences in prices.
Purchasing power parities (PPPs) are the number of currency units required to buy
goods and services equivalent to what can be purchased with one U.S. dollar (or
one unit of some other base-country currency). They are used here for
comparisons of costs. 5 PPPs have been computed by the OECD.6 Discussion of
the data is in terms of PPPs. However, data are also presented using market
exchange rates. Appendix A presents national currency unit exchange rates in
’ International Financial Statistics, International Monetary Fund, November, 1993. ’ Data were not available for Iceland or New Zealand. ’ Green Paperdata did not differ greatly from the UPU data. ’ Wissenschaflliches lnstitut fllr Kommunikationsdienste (WlK) assisted us with German and Austrian data. ’ The 1988 market exchange rates have been calculated by IMF and are published in lntemational Financial Sta&&.. They are monthly WmmerCial IateS averaged Over the year. ’ National Accounts, Main Aggregates, Volume I (1980-1991), OECD, Paris, 1993.

3
terms of gold francs, ECUs, U.S. dollars, and PPPs for 1988. Appendix B presents
additional data of interest.
Total Volumes
Table 1 displays volumes for the 21 postal administrations included in this
study.’ The scale of volumes differs by three orders of magnitude. The lowest
volume administration, Luxembourg, has only 153.10 million pieces, while the
largest, the United States, has 160.4 billion pieces. Consequently, the composition
of the volumes are of far more interest than the magnitudes. An average of 59
percent of the total volume is LC &e&es et Cartes), 40 percent is A0 (Aufres
Objets), and one percent is parcels.
There is a surprisingly large variation in the proportions of LC and A0 mail
within the 21 countries. Figure 1 displays the LC volume share (i.e., percent of total
volume) for each administration. It ranges from a high of 95 percent for the United
Kingdom to less than 21 percent for Austria. Because parcel shares are so low, A0
shares are the virtual complement of LC shares. The ranges of LC and A0 volume
shares are so large that it might be said that these postal administrations are in
different businesses. It is surprising that countries as similar as Sweden and
Norway have such large differences. We believe that countries with very high
percentages of A0 mail handle disproportionately large quantities of periodicals
(especially newspapers). It would be useful if the UPU collected separate statistics
on the categories of periodicals and advertising which are now collected under the
rubric of printed papers. These are very different postal products.
For the U.S., printed papers consist of 63 billion pieces of advertising mail
and 10 billion pieces of periodicals.’ Spending on advertising mail (also called
“direct mail” in the U.S.) comprised 18 percent of total advertising expenditures in
’ Only inward international volumes are included so that statistic5 developed below on productivity and unit costs would not be distorted. * Revenue, Pieces and Weight (RPW) Report for FY 88, U.S. Postal Service.

4
FIGURE 1
LC Volume Shares
United Kin J
dom
Aus%: Soain
Luxe$b;~
Portugal Ireland
Denmark Finland
Sweden France
Italy Canada
United States Netherlands
’ 20% 40% 60% 60% 100%

5
the U.S. in 1988 and 20 percent in 1993.’ lo Thus, assuming there are no inherent
barriers, postal services of industrial countries are potentially major advertising
mediums. Because A0 volume shares differ so greatly, it is probable that the
proportions of advertising mail varies widely among the 21 postal administrations.”
As shown in Table 1, the Japanese LC composition is anomalous in that
cards constitute half the LC total. We understand that in Japan, post cards are
widely used as New Year’s greeting cards which are extraordinarily popular and
constitute 16 percent of total annual volume. Post cards are also used extensively
for billing in Japan. Austria is the only other country where cards are as much as
30 percent of LC mail. Finally, Switzerland had the greatest percentage of parcels,
over 4 percent. In no other country do parcels amount to more than 1.6 percent of
total volume. The UPU data do not indicate the postal administration’s share of the
total parcel market in each country.” Presumably competition varies widely from
country to country.
Per Capita Volumes
Table 2 displays per capita mail volume. Figures 2, 3 and 4 display the data
graphically. Switzerland has the highest total mail pieces per capita and A0 pieces
per capita. It has 45 percent more per capita A0 mail than Norway, which has the
second largest number of pieces. The U.S. has the highest per capita LC mail. It
has 14 percent more than Luxembourg, the next largest. Switzerland has by far the
largest number of per capita parcels.
The range of per capita total pieces is large. If we exclude the two least
developed countries, Greece and Portugal, the range is a factor of five. The range
’ Robert Coen. McCann Erickson, New York. “This has grown from less than 14 percent in 1960 when the U.S. Postal Service began an aggressive program of cost based worksharing discounts for advertising mail. They include discounts for presomng, carrier walk sequencing, dropshipping and barcoding. ’ Obvrously some LC mail is advertising mail. For example, in the U.S.. 6 percent of First Class
{LC mail) is pure advertising. See 1991 Household Diary, U.S. Postal Service. ’ In the U.S., it is estimated that the Postal Service has less than 10 percent of the total one pound and
over small parcel market (excluding books, records and catalogs).
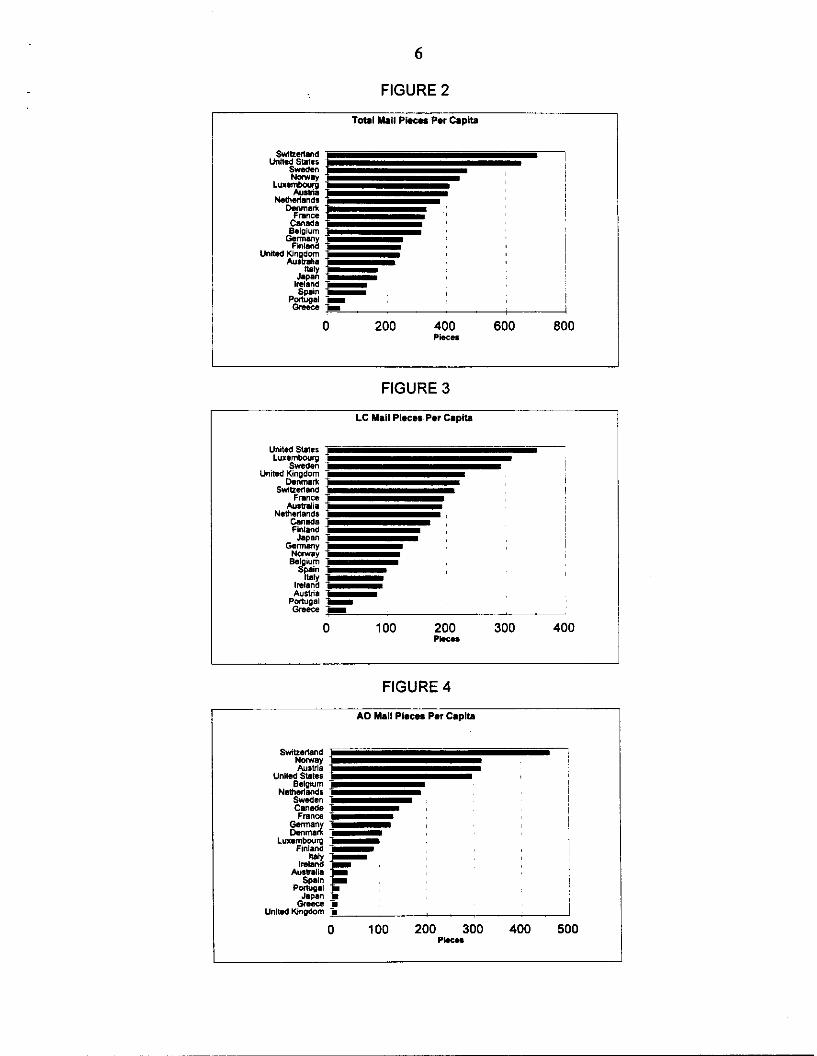
FIGURE 2
0 200 400 600 800 Piece. I
FIGURE 3
LC Mall P*s.‘ P.. capita
0 100 200 300 400 P*cn
FIGURE 4
A0 hi, Pies” P.r c.pna
0 100 200 300 400 500 PIOUS
/

for A0 mail pieces per capita is even larger. For LC mail, the range is a factor of
four. Even such similar countries as the U.S. and Canada have wide differences.
As expected, total volume per capita is highly correlated with GDP per capita (.77).
Total volume per capita is more highly correlated with A0 volume per capita (.88)
than with LC volume per capita (.70). See Table 12. This reflects the greater
dispersion of A0 volume.
From the per capita data, we can infer that the composition of LC mail varies
greatly among the industrial countries, In the U.S., bills to and payments by
households constitute 30 percent of the LC maiLl LC volumes appear to be
heavily influenced by the prevalence of checks used in the payment system in each
country.‘4 The U.S. has by far the largest number of checks.15 An econometric
analysis of First-Class Mail volumes in the U.S. found the following variables
important: real price, real GDP per capita, size of the presort discount relative to
business unit labor costs, a proxy for the number of financial accounts per
household, and the volume of advertising mail.”
The 21 postal administrations deliver very different amounts of periodicals
and advertising per capita. Obviously the role each post office plays in the delivery
of periodicals depends on many diverse factors including the quality of service and
alternative means of distribution.” Differences in advertising mail volume per
capita depend on a variety of factors including the price charged by the postal
administration, availability of mailing lists (which may be affected by privacy laws),
amount of direct competition, whether the postal administration delivers
unaddressed advertising, and the size of the catalog industry. The amount of
advertising mail per capita carried by the United States Postal Service is importantly
” 1991 Household Diary, U.S. Postal Service. ” “On the Structure of Inter-Firm Postal Demand,” TON Azumi, Commercl&ation of Postal and Delivers Servrces. Nationaland.. Ed. Michael A. Crew and Paul R. Kleindorfer, Kluwer Academic Publishers. l5 Ibid., p. 264 ” “An Econometric Study of the Demand for First-Class Letters and Cards,” Lester Taylor (Professor of Economics, University of Arizona), U.S. Postal Rate Commission, October, 1969. ” Few daily newspapers and less than half the weeklies are primarily distributed through the U.S. Postal Service. Most periodicals carried by the U.S. Postal Service are magazines.

affected by the so-called mail box law which forbids anyone other than the Postal
Service to use a household mail box.”
We believe that all postal administrations seek to promote volume growth
because a large part of delivery costs are fixed. The higher the volume, the lower
the delivery cost per piece. The data on the 21 administrations raise the question
why LC, AO, parcel and total mail volumes per capita vary so greatly?
Total Expenses
Table 3 displays total expenses disaggregated into labor costs and all other
costs for each postal administration using market exchange rates and PPPs. It can
be seen that the mean labor cost share for all the postal administrations is 77.3
percent. Excluding Luxembourg, whose postal cost data include
telecommunications services, only three administrations vary by more than 10.2
percentage points from the average. The Dutch Postal Service appears to be the
least labor intensive (at 56 percent), while the Danish is the most (at 93 percent).
Countries at different ends of the income spectrum have similar labor cost shares.
An explanation of the differences in labor cost shares between the different postal
administrations would be useful.
Average annual labor costs per employee are presented below. It is not
surprising that total expenses for each postal administration is fairly well correlated
with annual labor cost (55).
It would be informative if the UPU would collect a breakdown of labor and
nonlabor costs.‘g ” It would be especially helpful to have a measure of total capital
” A firm can be fined by the Postal Service if they place any matter in a household mail box. Direct mail competitors to the Postal Service. thus, must hang plastic bags containing their advertisements on household doorknobs or leave the material on the porch or ground. ” In the U.S., nonlabor costs include transportation (6.6 percent of total), supplies and services (4.1 Ercent), building occupancy (2.3 percent), depreciation (1.4 percent), and other (1.6 percent).
Labor costs in the U.S. consist of compensation (64.4 percent) and benefits (19.3 percent). The Postal Service has no unfunded liability for pension costs and, beginning in 1991, is on a pay as you go basis for cost of riving increases for retirees’ pensions and health insurance costs. The U.S. Postal Service receives no subsidies from the Federal Government.

9
employed by each administration. From the data now collected, it is not known if
the size of nonlabor cost share is an indicator of capital employed. Much of the
U.S. Postal Service’s capital for recent plant and equipment purchases has been
borrowed and shows up in nonlabor cost as depreciation. Even so, the
depreciation as a percent of total expenses is not large in spite of the fact that the
U.S. Postal Service has invested heavily in plant and equipment.
Expenses Per Capita
Table 4 displays total expenses per capita and total expenses as a percent
of GDP for each of the postal administrations. Postal services are clearly important
economic institutions in all the industrial countries. However, the countries spend a
wide ranging portion of GDP on postal services. Luxembourg has the largest
expense per capita, but this may be because of telecommunications data being
included in the total expense data. Next is Switzerland, Norway and the United
States. Greece, Spain and Portugal have the smallest expense per capita. Postal
expenses range from a quarter of one percent to one and a half percent of GDP -
a factor of 6. Sixteen (16) administrations spend less than one percent of GDP on
postal services, while five spend more. As expected, GDP per capita is highly
correlated with total volume per capita (77).
Number of Employees
Table 5 displays the number of full-time and part-time employees. Some
administrations state explicitly on the UPU data forms that they are using full-time
equivalents when stating the number of part-time employees. Most, however,
simply list the number of part-time employees. The authors contacted many of the
administrations to get full-time equivalents. Data for Greece, Italy, Japan,”
Luxembourg, Portugal and Spain were not checked. Italy, apparently, employs no
part-time employees. Greece and Portugal employ few. To the extent that part-
” The Japanese postal administration was contacted, but could not supply the infonation.

10
time employees listed in the data are not full-time equivalents, average annual labor
cost calculations (below) will be in error. That is because the denominator will be
too large (reflecting total number of part-time employees rather than full-time
equivalents). Thus, average annual labor costs may be understated for the
administrations with large percentages of part-time employees not listed in terms of
full-time equivalents. Moreover, the employment statistics cover all categories of
employees, some of whom may be paid substantially less than the average wage.
For example, the U.S. figures contain 8 percent casual and part-time employees,
whose costs are only 44 percent of the U.S. average. The number of employees is
more highly correlated with LC volume per capita (.46) than it is with total volume
per capita (.36).
Average Annual Labor Costs
Table 6 displays average annual labor costs at market exchange rates and
in Purchasing Power Parities. Japan has the highest annual labor costs and the
U.S. has the second highest. Spain, Finland and Greece have the lowest. The
figure for Spain might be affected by not having its part-time employees expressed
as full-time equivalents. The figure for Luxembourg may be affected by including
data for telecommunications services.
Figure 5 displays average annual labor costs graphically. The range is very
large. At the extreme, the costs differ by a factor of two and a half. The correlation
with GDP per capita is high (.69). Additional research which would explain the
large differences in labor costs would be of great interest.22
z The average U.S. postal worker wage was equal to 80 percent of the U.S. median family income in 1988. The fringe benefits of postal workers are much better than the average blue collar worker. Postal wages and benefits are set through collective bargaining and there is compulsory afbtiration when the sides cannot come to an agreement.

11
FIGURE 5
Average Annual Labor Cost
(Purchasing Power Parities)
Japan United States Luxembourg Switzerland
Canada Austria
Germany Australia
France Italy
Netherlands United Kingdom
Sweden Norway
B2Gi
&S%l Greece Finland
Spain
SO $9,000 $18,000 $27,000 $36,000 $46,000

12
Unit Labor Cost
Before developing unit labor costs (i.e., labor cost per piece of mail), it is
necessary to develop weighted output to normalize the mix of LC, A0 and parcels
among the postal administrations.
Weiohted Volu~. To make unit labor cost comparisons between
countries meaningful, the mail volume figures for each country are adjusted to
reflect the composition of that country’s mailstream. Some countries have a greater
proportion of high work content mail (such as parcels), while other countries have a
greater proportion of low work content mail (such as cards). Using unweighted
volume as the output measure might erroneously show a particular country as
having high or low unit cost in relation to other countries simply because its
mailstream had proportionately more low or high cost pieces.
We adjust for this potential bias by weighting the various mail categories by
the relative amount of labor resources required to handle each mail category. We
have used United States Postal Service unit (per piece) attributable (causally
related) labor costs to weight output.23 U.S. postal system costs were used
because they were available. Further, it is believed the U.S. has the most detailed
cost information by mail category available for all countries examined. U.S.
attributable labor costs represent about two-thirds of total labor costs, and include
all the labor costs that can be causally traced to mail categories. The weighting
factors are in cents as follows: letters - 15.22, cards - 10.12, printed papers -
8.68, small packets - 8.68, parcels - 137.84.24
Table 7 displays weighted mail volume for the 21 postal administrations.
Comparing them to Table 1, it can be seen that the index of weighted mailpieces
rose for 14 countries relative to the U.S. volume. The U.S. weighted volume is only
82 percent of its unweighted volume indicating that it had a relatively less costly
mailstream. France and Norway also have relatively less costly mailstreams.
” USPS Cost and Revenue Analysis (CRA) Report, N 1989. ” These weights are influenced by the amount of presortation for each category.

13
Weighted volumes rose relative to unweighted volumes for Austria, Switzerland and
the United Kingdom. Swiss weighted volumes rose relative to unweighted because
of its large volume of parcels. Weighting the mail volumes changes the volume
rankings by at most two places.
Table 8 displays unit labor costs in tens of PPPs. Spain has the lowest
cost per weighted piece, while Italy has the highest. The average unit labor cost is
29 cents. Figure 6 shows the wide dispersion of unit labor costs. Only five
administrations have unit labor costs more than twice that of the U.S. (23 cents).
Unit labor costs are negatively correlated with labor productivity (-.79) and positively
correlated with the basic postage rate (.69).
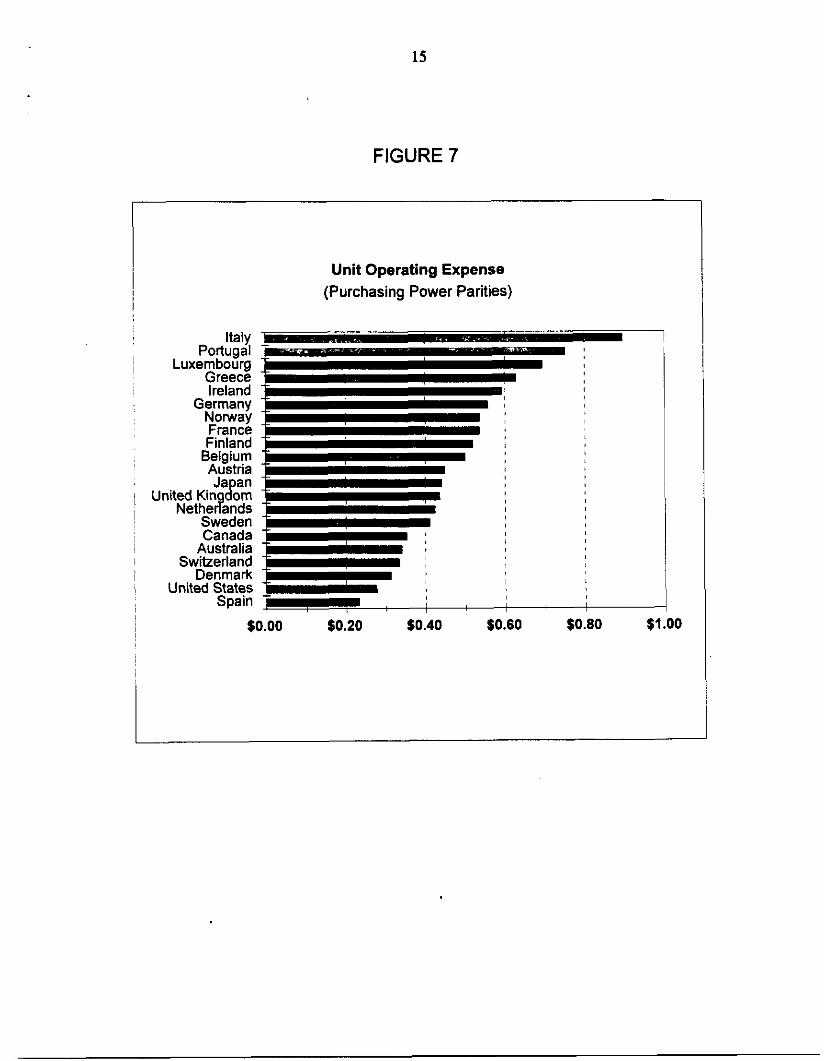
Unit Operating Expenses
Table 9 displays the operating expense per weighted pieces in terms of
PPPs. Spain again has the lowest UOE followed by the U.S. It can be seen that
the rankings in Table 8 differ somewhat from the rankings in Table 9. Figure 7
displays the UOE data graphically. Seven administrations exceed the UOE of the
U.S. by a factor of two or more.
Unit operating expenses to be compared properly would have to be adjusted
for differences in service levels and factor prices. Nonetheless, they provide a
rough measure of economic efficiency. Unit operating expenses are negatively
correlated with labor productivity (-.69) and positively correlated with the basic rate
(.63) and the average revenue per piece (.55). The latter two correlation
coefficients could be affected by the degree to which the postal administrations
receive subsidizes or achieve profits or suffer losses.25
*’ It should be noted that both inhabitants per post office and post office density have little impact on UOE. The two correlation coefficients are: .25 for inhabitants per post office and UOE. and .04 for post office density and UOE.

14
FIGURE 6
Unit Labor Cost
(Purchasing Power Parities)
Italy I Portugal
EEZ Germany
Finland Belgium
LuxenF7F;;urE
%Zi,Y United Kin
f dom
Den%%
E%z Australia
Switzerland Netherlands . . ^.
unnea srales Spain
$0.00 $0.20 $0.40 $0.60 $0.80
15
FIGURE 7
Unit Operating Expense
(Purchasing Power Parities)
Ireland Germany
EE: Finland
Bp;g
Canada Australia
Switzerland Denmark
United St;t;
$0.00 $0.20 $0.40 $0.60 $0.90 $1.00
16
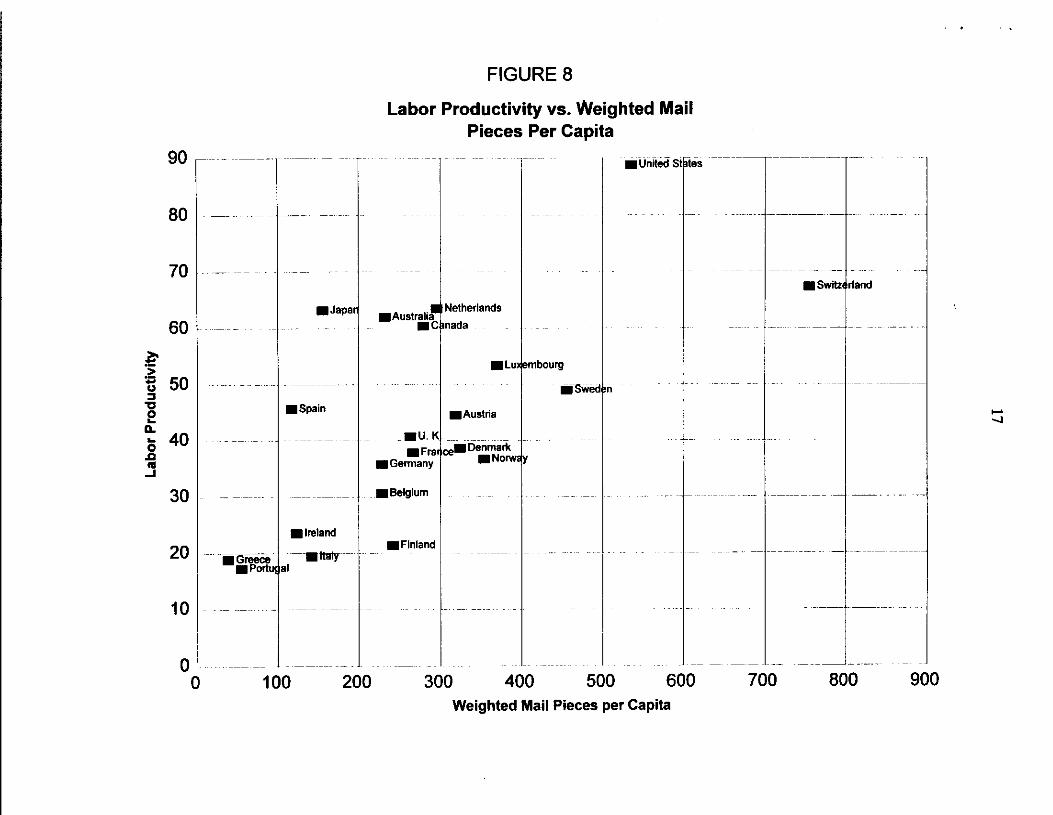
Labor Productivity
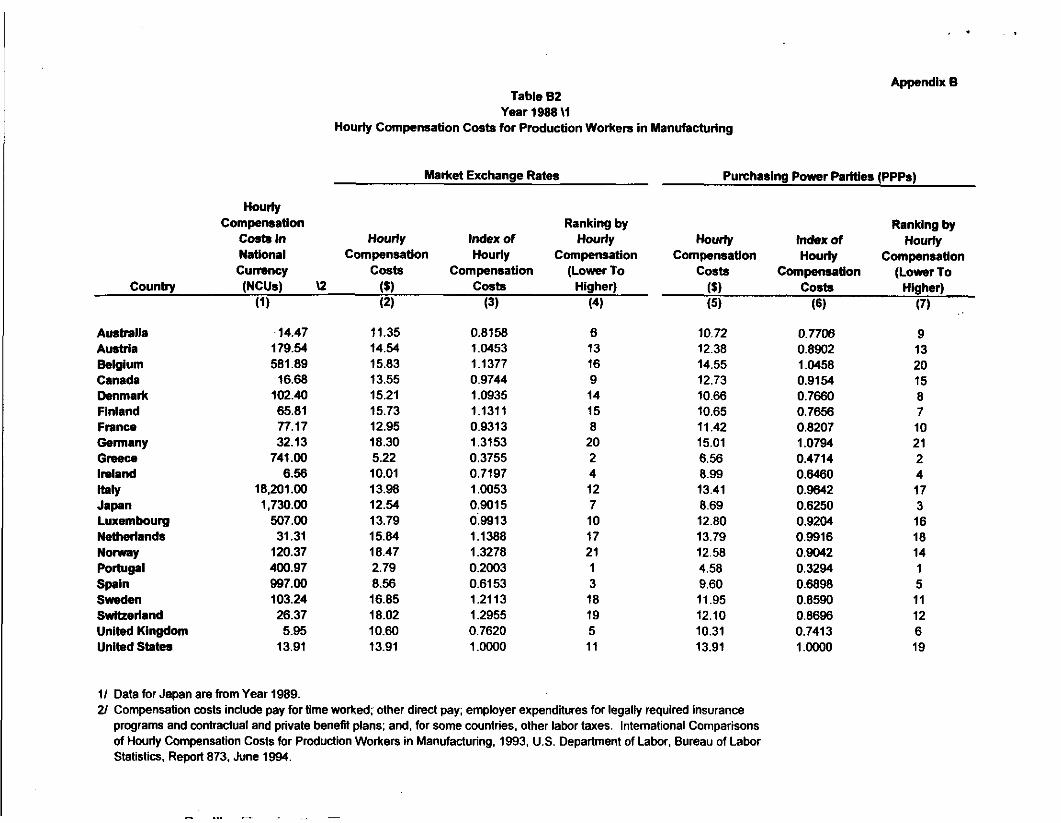
Table 10 displays labor productivity for the 21 postal administrations in terms
of weighted pieces per hour worked. For all countries except the United States, the
annual number of hours worked by postal employees is estimated by averaging the
annual working time for all employees in a country with the annual hours worked in
manufacturing in that country. See Appendix B, Table Bl. For the United States,
we use actual hours worked by postal employees. The U.S. has the highest labor
productivity followed by Switzerland and Japan. The range is large, varying by a
factor of more than four. To an extent, labor productivity varies with weighted
pieces per capita. This can be seen in Figure 8 where labor productivity is plotted
against weighted mailpieces per capita. The latter variable was selected because it
was felt that it captured the fixed cost inherent in the delivery network. The
correlation of labor productivity with total volume per capita is high (.68).
Analysis of Productivity Differences
The performance of the different postal systems vary widely. Table 10
presents labor productivity for each of the 21 postal systems. Labor productivity,
measured as the total mail pieces per employee hour, ranges from about 18 pieces
per employee hour in Portugal to about 89 pieces per employee hour in the United
States.26 In this section, we attempt to explain the labor productivity difference
using an econometric model.
Examination of the international data points to two variables, labor cost and
volume, as the most important variables in explaining postal performance. Labor
cost is important because it accounts for a significant share of the total cost. The
labor cost share of the total cost average around 77 percent, and ranges from
about 57 percent in Luxembourg to almost 93 percent in Denmark. See Table 3.
26 Labor productivity used for the econometric analysis has been adjusted for the differences in the number of deliveries per week.
90
80
70
60
.* $ 50 0 e : 40 2 3
30
20
10
0
FIGURE 8
Labor Productivity vs. Weighted Mail Pieces Per Capita
and
Weighted Mail Pieces per Capita
600 700 800 900

18
Labor cost would likely affect performance in two ways. First, higher labor cost (in
comparison to the private sector labor cost) may reflect the higher quality of
workers hired by the postal systems that, in turn, may result in higher efficiency. In
addition, higher wages may result in higher efficiency by encouraging postal system
to substitute capital for labor.” The scale of the postal systems, as measured by
volume per capita, may also have a significant impact on labor productivity because
a large portion of delivery costs, and in turn total costs, are fixed.” Therefore,
larger systems (i.e., higher volume systems) are likely to experience higher
efficiencies.
Econometric Model
We developed a simple linear regression model to test the relationship
between labor cost, system size, and performance. Our model tests the hypothesis
that postal systems with higher labor cost and higher volume would realize greater
efficiencies that, in turn, offset some negative effects of a higher labor cost to postal
customers. We use labor productivity as an indicator of postal efficiency and relate
it to the size of the system and labor cost. For the modeling effort, we use the total
weighted volume per employee hour as a measure of labor productivity; the
weighted volume per capita as a measure of system size;*’ and the difference
between the postal wage and the average private sector wage as a measure of
labor cost.30 See Table 11.
*’ Although no information about the degree of mechanization is available for all the postal systems in our data set, some indirect evidence shows that there are some shifts away from labor toward mechanization as relative labor cost rises. For example, postal systems with a higher wage premium tend to have lower proportion of labor cost. *s Moreover, a volume threshold may be an economic prerequisite for certain mechanization and automation investments. This may especially affect postal administrations with small volurnas such as Greace and Portugal. 29Volume par capita serves as a proxy for volume per possible stops. Volume per possible stops is considered the true cost driver for delivery cost but it was not included in the UPU data set. 3o The postal wage premium is the proportion of the average hourly postal wage to the average hourly manufacturing wage for each country.
19
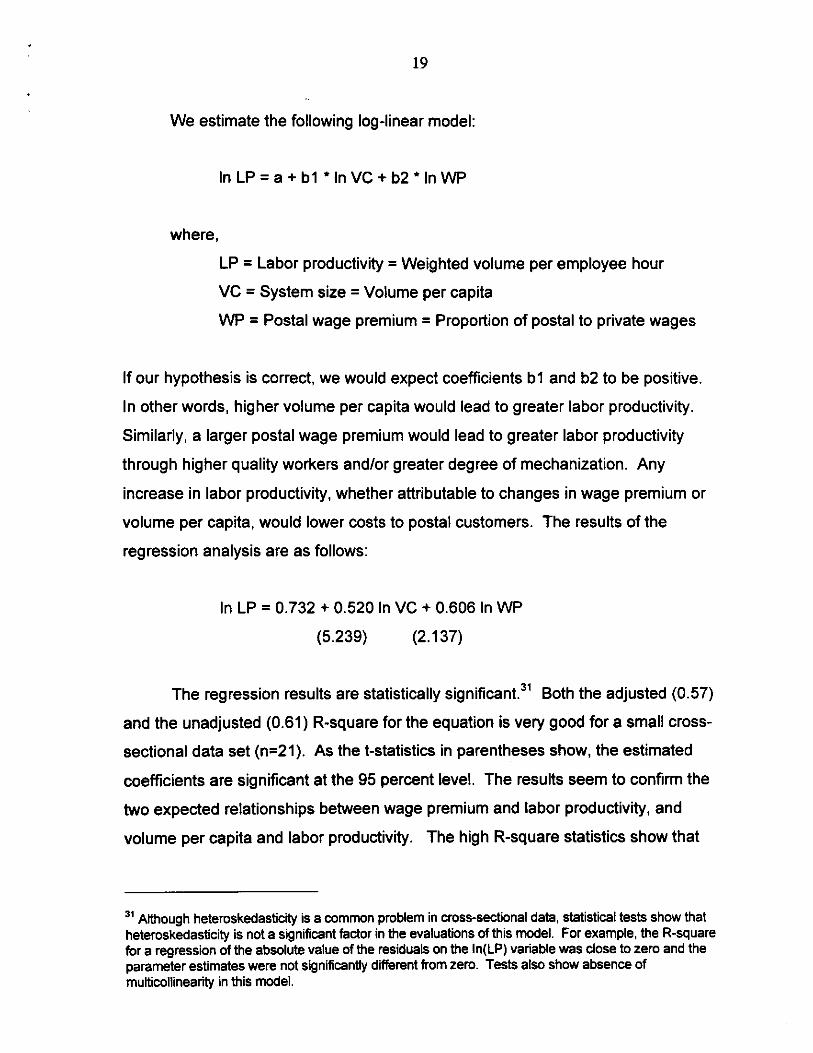
We estimate the following log-linear model:
In LP = a + bl l In VC + b2 l In WP
where,
LP = Labor productivity = Weighted volume per employee hour
VC = System size = Volume per capita
WP = Postal wage premium = Proportion of postal to private wages
If our hypothesis is correct, we would expect coefficients bl and b2 to be positive.
In other words, higher volume per capita would lead to greater labor productivity.
Similarly, a larger postal wage premium would lead to greater labor productivity
through higher quality workers and/or greater degree of mechanization. Any
increase in labor productivity, whether attributable to changes in wage premium or
volume per capita, would lower costs to postal customers. The results of the
regression analysis are as follows:
In LP = 0.732 + 0.520 In VC + 0.606 In WP
(5.239) (2.137)
The regression results are statistically significant.3’ Both the adjusted (0.57)
and the unadjusted (0.61) R-square for the equation is very good for a small cross-
sectional data set (n=21). As the t-statistics in parentheses show, the estimated
coefficients are significant at the 95 percent level. The results seem to confirm the
two expected relationships between wage premium and labor productivity, and
volume per capita and labor productivity. The high R-square statistics show that
” ANhough heteroskadasticity is a common problem in cross-sectional data, statistical tests show that heteroskedasticily is not a significant factor in the evaluations of this model. For example, the R-square for a regression of the absolute value of the residuals on the In(LP) variable was close to zero and the parameter estimates were not significantly different from zero. Tests also show absence of multicollinearity in this model.

20
this model specification explains over 60 percent of the difference in postal system
performance. In other words, system size and wage premium are the primary
indicators of labor productivity. Other unknown factors account for less than 40
percent of the difference in labor productivity.
The log-linear model specification allows easy interpretation of the estimated
coefficients. Each estimated coefficient represents the percentage change in labor
productivity with a 1 percent change in either the volume per capita or the wage
premium. For example, a 1 percent increase in the hourly wage premium would
cause a 0.606 percent increase in labor productivity. A 1 percent increase in
volume per capita would result in a 0.52 percent increase in labor productivity.
Results
Table 13 shows a comparison of actual and predicted labor productivity for
each country. The last column in Table 13 also shows how much higher or lower
the actual labor productivity is when compared with the predicted labor productivity.
Nine countries (Spain, Netherlands, United States, Japan, Australia, Canada,
Greece, Germany, and United Kingdom) are more efficient than expected given
their size and the wage premium that they pay.
Comparison of the percentage difference between actual and predicted labor
productivity show that Spain, whose actual labor productivity is about 90 percent
greater than expected from our model appears to be the most efficient postal
system in our sample. Next is the Netherlands with actual labor productivity about
50 percent greater than expected.
Concluding Remarks
This paper has three main objectives. The first is to develop basic economic
statistics for the 21 postal administraitons that are consistent. Such statistics allow
a comparison of the essential features of postal administrations (e.g., share of

21
GDP, labor cost, mail mix; unit operating expense, etc.). The second objective is to
encourage greater uniformity in data collection to enable additional comparisons
and to facilitate cross sectional analysis. The third objective is to conduct a cross
sectional analysis relating the affects of scale and wages on labor productivity.
This is a first step toward a more comprehensive cross sectional analysis of postal
administrations. It is hoped that these data will encourage others to perform
additional analysis, and encourage the UPU and the several postal administrations
to collect comparable statistics.

.
Table 1 Year 1988 \I
Mail Volume of Postal Administrations
Data from Universal Postal Union (UPU)
Lewes at cartes (LC)
L&ten Postcards
Aulrss Objets (AO)
Printed Small Papars Packets
Postal Parcels
Ranking by T&l Index of Total~Mail Mail Total PisCW
Pieces Mail (Higher To Country (Millions) (Millions) (Miliions) (Millions) (Millions) (MillIons) Pieces Lower)
(1) (2) (3) (4) (5) (5) (7) (8)
Au&alla 3.172.80 14.40 65.10 Austrle 495.80 132.80 2.387.00 Belgium 1,116.60 54.60 1.914.70 Canada 4.479.00 -_ w 3.626.40 Denmark 1.111.20 28.60 510.90 Finland 755.20 14.40 432.60 France 10,997.oo _- u 6.974.30 Gannany 6,991 .I0 742.20 7,371.30 GWCS 306.70 \5 1.30 \5 100.80 6 Ireland 325.30 u 139.40 Italy 5.153.00 \5 219.20 \5 4.087.50 \5 Japan 9.383.30 9.352.60 1.473.10 LuXalllbOUrg 106.80 \5 6.90 ti 35.50 \5 Nsthsrlanda 2.638.10 163.70 2.63250 Norway 511.60 _- \3 1.333.40 Portugal 381.50 26.60 142.80 Spaln 3.835.70 ___ I3 1.190.20 Sweden 2.462.00 ___ u 1,433.OO Switzerland 1.288.60 137.60 3.069.60 United Kingdom 12.801.70 411.10 11.50 United States 82.60660 4.143.80 73.131.00
Total 150.921.50
II Data for Japan are from Year 1989. 2/ No data available 31 Included in Letters 41 Included in Printed Papers
15.449.80 112.062.70
51 Adjusted based on CEC - Green Paper, Year 1989.
461 .w 2.80
34.30 66.30 28.60
0.24 308.80 268.20
1.20 \5 -_ !.I 116.70 \5
3.00 1.40 \5
141.40 - w
2.00 ___ w ___ w
1.90 479.70 -_ w
1.918.44
39.70 52.80
74.30 25.00 20.60
1.00 245.10
2.00 4.00
51.20 299.90
0.40 4.70
25.10 5.90 8.80
67.00 210.30 188.90 543.80
3.75390 0.0234 3.07120 0.0191 3.120.20 0.0194 8.246.00 0.0514 1.704.30 0.0106 1.223.04 0.0076
18,281.10 0.1140 15.61790 0.0974
412.06 0.0026 46.3.70 o.oQ29
9,627.60 O.WDO 20.511 .W 0.1279
153.10 0.0010 5580.40 0.0348 1.870.00 0.0117
558.80 0.0035 5.034.70 0.0314 3,962.OO 0.0247 4,708.Ou 0.0293
13,892.90 0.0866 160,425.20 l.OMlO
1.87050 282.22294
12 14 13 7. 16 17 3 4
20 19 6 2
21 8 15 18 9 11 IO 5 1
_. .., _.-., _. ^_, _^^^, _^^^, ^^^^. __ ̂ _

I
Table 2 Year 1988 \I
Mail Volume Per Capita
Data from Universal Postal Union (UPU)
Country
Letters and
PoStesKlS Per Capita
(1)
Printed Papem
and Small Packets
Per Capita
(2)
Postel Parcels
Per capita
(3)
RankIng by Total Mall Pieces Mail Index of Per capita
Pieces Mail Pieces (Higher To Per Capita Per Capita Lower)
(4) (5) (6)
Awtmlla 193 32 2 227 0.3485 15 AUSbh 83 315 7 404 0.6208 6 Belgium 118 197 0 315 0.4638 11 Canada 173 142 3 318 0.4681 10 Denmark 222 105 5 332 0.5101 a
Finland 156 88 4 247 0.3797 13 Fnnce 196 130 0 326 0.5002 9
Germany 126 124 4 254 0.3902 12 Gnace 31 10 0 41 0.0632 21
Ireland 92 39 1 132 0.2034 18
IW 94 73 1 168 0.2573 16 Japen 152 12 2 167 0.2556 17
Luxembourg 310 99 1 410 0.6302 5
Netherlands 190 480 0 370 0.5605 7
NAY 122 317 6 444 0.6621 4
Porblgrl 42 15 1 57 0.0679 20
Spain 93 31 0 130 0.1992 19
Sweden 292 170 0 470 0.7211 3
Swifxerlsnd 214 460 32 706 1.0834 1
United Kingdom 232 9 3 243 0.3736 14
United States 352 297 2 651 1.0000 2
Total 217
I/ Data for Japan are from Year 1989
148 2 367
. - _____ - _.___._. . . ..__ - ._- --- .._... -.. .-.-..

.
Table 3 Year 19aa \I
Total Expenses of Postal Administrstions
Dats from Universal Postal Union (UPU)
Market Exchange Rates
County
Tots1 Lsbor CO&
(Million $)
(1)
other Total cost EXpS”SW
(Million $) (Million S)
(2) (3)
Austrelis AUSbl~ Belgium Canada Denmark Finland FlWlCe GWl”S”Y GIWCO Inland ItelY JepoIl Luxembourg Netherlands Norway Portugrl spein Sweden
United Kingdom United States
981.26 403.14 1,3a4.40 926.88 380.80 1.307.68 70.68 1.019.24 257.61 1.276.85 867.97 219.38 1 ,oa7.35 79.02 1,002.51 231.32 1.233.83 921.50 212.63 1.134.14 al.25 1,917s 807.83 2.725.77 1,801.84 758.93 2.560.77 70.36
692.70 53.10 745.60 485.25 37.20 522.45 92.86 758.44 161.74 920.18 513.34 109.47 622.81 82.42
6.764.43 2.363.47 9.127.91 5960.81 2.082.69 8.043.49 74.11 7.34232 2.224.33 9.566.65 6.025.51 1 ,a25.41 7.850.91 76.75
154.26 38.41 192.64 193.66 48.21 241 .a7 80.07 230.93 56.91 207.65 207.29 51.09 258.38 80.23
6,036.88 1.587.75 7.624.43 5.790.23 1.522.93 7.313.16 79.18 0,173.26 4.022.08 12.19536 5.666.26 2.788.37 a.45463 67.02
59.24 \2 44.37 v 103.61 55.01 v 41.20 !2 96.20 57.18 1.201.19 930.01 2.131.19 1.045.93 809.80 1.855.74 56.36
821.45 357.64 1.179.09 559.40 243.55 802.94 69.67 179.11 65.40 244.51 294.66 107.60 402.25 73.25 797.90 139.08 936.98 894.59 155.93 1.050.52 85.16
1,580.17 651.21 2.231.38 1.120.60 461.82 1.582.42 70.82 1,796.35 717.70 2.514.05 1.205.78 481.75 1.687.53 71.45 4,6X98 2.128.77 6.765.76 4,511.26 2.071.06 6.582.32 68.54
3Q478.64 6.057.05 36.535.69 30.478.64 6.057.05 3X.535.69 83.42
Tots1 76.625.03 23.298.93 99.923.97 69.526.40
Purchasing Power Parities (PPPs)
Tote1 Lsbor costs
Other cost
Tote1 Expenses
Lsbor cost
Share (Million $)
(4)
(Million S)
(5)
(Malion $)
(6) (Percent)
(7)
20.466.85 89993.25 77.26
I/ Date for Japan are from Year 1989. 21 It includes costs of lelecommunicslions services

Table 4 Year 1968 \I
Total Postal Expenses Per Capita and As a Percent of GDP Data from Universal Postal Union (UPU)
counby
Purchasing Power Parities (PPPs) Ranking by Ranking by
Total Total Expenses Total EXpelWe Expenses assPeme”t
Total Expenses Per Capita es e Percent of GDP Expenses Population Per Capita (Lower To of GDP (Lower To (Million $) (Thousands) (8 Higher) (Percent) Higher)
(1) (2) (3) (4) (5) (6)
Austmlla 13o7.88 16.538 79 6 0.52 4 AUSth i,oa7.35 7,595 143 15 1.01 17 Belgium 1.134.14 9.902 115 9 0.81 11 Canada 2S6O.77 25.938 99 7 0.56 5 Denmark 522.45 5,130 102 a 0.69 7 Flnlsnd 622.81 4,946 126 12 0.67 13 France 8043.49 56.118 143 16 0.95 16 Gemeny 7.850.91 61.449 128 14 0.80 9 Gleece 241.87 lO.oo5 24 1 0.36 2 Inland 258.38 3.538 73 5 0.86 12
W 7313.16 57,441 127 13 0.91 14 Jspen 8.454.63 123.120 69 4 0.42 3 Luxembourg 96.20 373 258 21 1.52 21 Netherlands 1.655.74 14.760 126 11 0.92 f5
N-Y 602.94 4,209 191 19 1.32 19 Portugal 402.25 9,761 41 3 0.59 6 Spaln 1.050.52 38.869 27 2 0.27 1 Sweden 1.582.42 a.436 188 18 1.23 18 Switzerland 1.687.53 6,672 253 20 1.37 20 Unlted Kingdom 8.582.32 57.065 115 10 0.81 10 United States 36.535.69 246.307 148 17 0.75 a
Total 89.993.25
I/ Data for Japan are from Year 1999.
768.112 117 0.72
,.i,, ,,,,, ,,

. I
Table 5 Year 1988 \I
Employees of Postal Administrations
Data from Universal Postal Union (UPU)
Country
Full-Time Part-Time Employees Employees
(Thousands) (Thousands)
(1) (2)
Total Number of Employees
(Thousands)
(3)
Australia 34.80 1.96 u Austria 32.00 -- w Belgium 40.70 4.80 u Canada 63.00 -- u Denmark 27.60 - u Finland 20.90 10.00 France 233.30 6.00 \3 Germany 232.60 - w GtBWX 11.50 0.10 Ireland 10.00 0.30 My 237.10 0.00 Japan 141.60 - \5 Luxembourg 1.20 0.30 Netherlands 45.00 -- w Norway 21.87 4.52 W Portugal 16.10 0.20 Spain 47.60 \2 a.50 \2 Sweden 38.00 14.60 U Switzerland 40.70 - \3 United Kingdom 185.00 22.M) \3 United States 647.20 158.60 \3
Total 2.127.77 231 .a8
I/ Data for Japan are from Year 1989. 2/ The figure includes the employees of telecommunications
services. 3/ Part-Time employees have been converted to full-time equivalent. 4/ Included in full-time employees 5/ No data available
36.76 32.00 45.50 63.00 27.60 30.90
239.30 232.60
11.60 10.30
237.10 141.60
1.50 45.00 26.39 16.30 56.10 52.60 40.70
207.00 805.80
2,359.65
.._ -

Table 6 Year 1966 \I
Average Annual Labor Cost of Postal Admintstratfons
Date from Universal Postal Union (UPU)
Total Labor COStS
Market Exchange Rates Purchasing Power Perklee (PPPa)
Ranking by Index of Ranking by Total Average Index of Annual Total Total AVemge Average Annual
Number of Annual Annual Labor Cost Labor Number of Annual Annual Labor cost Employees Labor Cost Labor (Lower To costs Employees Labor Cost Labor (Lower To
Counby (Million S)
(1)
(Thousands)
(2) (S) (3)
cost
(4)
Higher)
(5)
(Million $)
(6) (Thousands)
(7) (6) (8)
Cost Higher)
(9) (10)
Australia 981.26 36.76 26,694 Austria 1 .Of 9.24 32.00 31,851 Belgium 1.002.51 45.50 22,033 Canada I.91794 63.M) 30,444 Denmark 692.70 27.60 25.098 Flnland 758.44 30.90 24,545 Fnnce 6.764.43 239.30 28.268 Germany 7.342.32 232.M) 31.568 GIWW 154.26 11.60 13.298 Ireland 230.93 10.30 22.421 Italy 6.036.68 237.10 25,460 Japan 8.173.28 141.60 57,721 Luxembourg 59.24 \2 1.50 39,496 Netherlands 1.201.19 45.00 26,693 Nonwy a21.45 26.39 31,127 Portugal 179.11 16.30 10,988 Spein 797.90 56.10 14,223 Sweden 1,580.17 52.60 30,041 Switzellmd 1.79635 40.70 44.136 United Kingdom 4.636% 207.00 22.401 United States 30.478.64 805.80 37.824
Total 76.625.03 2.359.65
I/ Data for Japan are from Year f 989. 2i It includes costs of telecommunications sewices
32,473
0.7057 11 0.8421 17 0.5825 4 0.8049 14 0.6635 a 0.6489 7 0.7473 12 0.8346 16 0.3516 2 0.5928 6 0.6731 9 1.5260 21 1 a442 19 0.7057 10 0.8230 15 0.2905 1 0.3760 3 0.7942 13 1.1669 20 0.5922 5 1 .oooo la
926.88 867.97 921.50
l.aof.84 485.25 513.34
5.960.81 6,025.51
193.66 207.29
5.790.23 5666.26
55.01 u 1.045.93
559.40 294.66 894.59
1.120.60 I ,205.78 4,511.26
30.47864
69.526.40
36.76 25.214 0.6666 14 32.00 27,124 0.7171 16 45.50 20.253 0.5354 7 63.00 28.801 0.7561 17 27.60 17.561 0.4648 4 30.90 16,613 0.4392 2
239.30 24.909 0.6586 13 232.60 25,905 0.6849 15
11.60 16.695 0.4414 3 10.30 20,125 0.5321 6
237.10 24.421 0.6456 12 141.60 40,016 1.0579 21
1.50 38,672 0.9695 19 45.00 23,243 0.6145 11 26.39 21.197 0.5604 a 16.30 16,077 0.4779 5 56.10 15,946 0.4216 1 52.60 21.304 0.5632 9 40.70 29,626 0.7833 la
207.M) 21,794 0.5762 10 805.60 37.824 1 .oooo 20
2,359.65 29,465
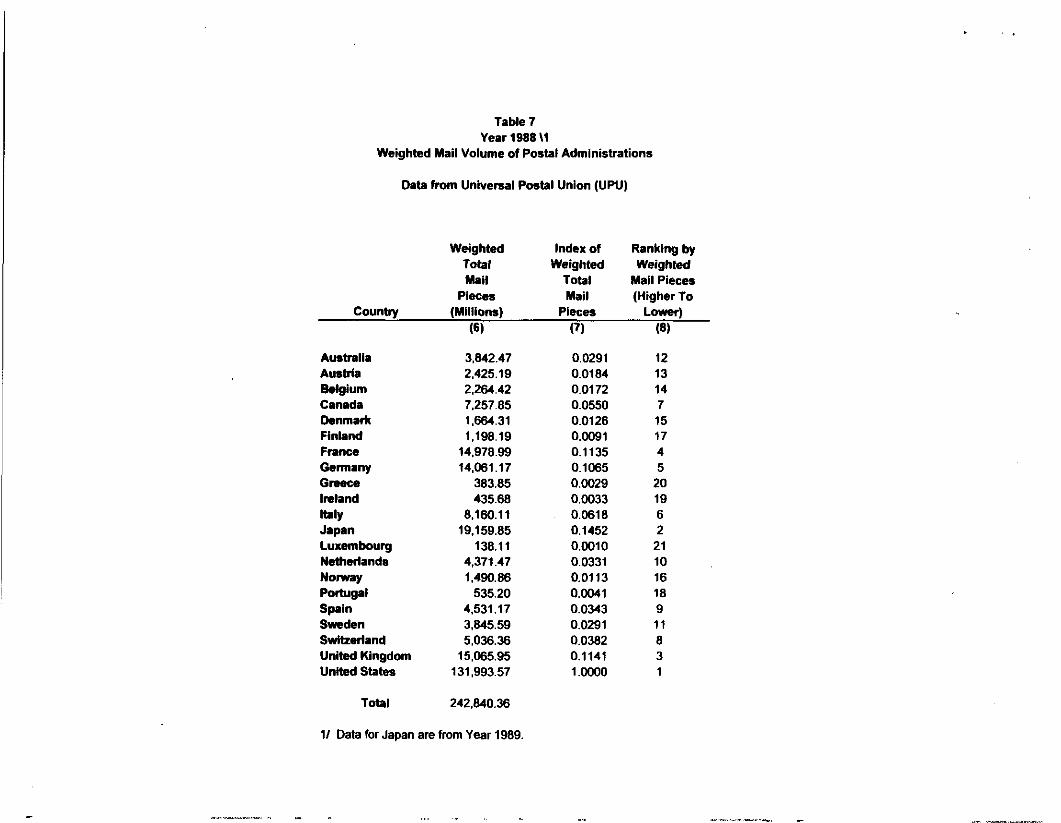
Table 7 Year 1968 \I
Weighted Mail Volume of Postal Administrations
Dats from Universal Posts1 Union (UPU)
Counby
Weighted Index of Ranking by Total Weighted Weighted Mail Total Mall Pieces
Pieces Msil (Higher To (Millions) Pieces Lower)
(6) VI (6)
Ausbalia AUStSlS f&tgium Canada Denmark Finland Fnnce
Greece- lmland Italy Japan Luxembourg Netherlands Norway Portugal Spain Sweden
United Kingdom United states
3842.47 0.0291 12 2.425.19 0.0184 13 2.264.42 0.0172 14 7.257.85 0.0550 7 1664.31 0.0126 15 1.198.19 0.0091 17
14.978.99 0.1135 4 14.c61.17 0.1065 5
383.85 0.0029 20 435.6a 0.0033 19
a.lw.lf 0.0616 6 19.159.85 0.1452 2
138.11 0.0010 21 4.371.47 0.0331 10 1.490.86 0.0113 16
535.20 0.0041 la 4.531.17 0.0343 9 3845.59 0.0291 11 5.03636 0.0382 a
15.065.95 0.1141 3 f 31,993.57 f.oooo 1
242840.36
II Date for Japan are from Year 1989

.
Table 8 Year 1966 \I
Unit Labor Cost of Postal Administrations Data from Universal Postal Union (UPU)
Country
Total Labor costs
(Million S)
(1)
Market Exchange Rates Purchasing Power Parities (PPPs)
Weighted Ranking by Weighted Ranking by Total Unit Index of Unit Total Total Unit Index of Unit Mail Labor unit Labor Cost Labor Mail Labor Unit Labor cost
Pieces cost Labor (Lower To CO& PisWs cost Labor (Lower To (MIllIons) ( 9) cost Higher) (Million S) (Millions) ( S) cost Higher)
(2) (3) (4) (5) (6) (7) (8) (9) (10)
Au&alla 981.26 3.842.47 0.26 1.1059
Austria 1,019.24 2,425.19 0.42 1.8201 Belgium l,OO2.51 2.264.42 0.44 1.9173
Canada 1.917.94 7.257.85 0.26 1.1444 Denmark 692.70 1564.31 .0.42 1.8025 Finland 758.44 l.l9a.l9 0.63 2.7413 France 6,764.43 14.978.99 0.45 1.9557 Gsnnany 7342.32 14.661.17 0.52 2.2614 GmCe 154.26 383.85 0.40 I.7404 Inland 230.93 435.68 0.53 2.2955
lt=lY 6.036.68 6.160.11 0.74 3.2038 Japan 8.173.28 19.159.85 0.43 1.8474 Luxembourg 59.24 !2 138.11 0.43 1.8577 Netherlands 1.201.19 4,371.47 0.27 1.1900 Norway 621.45 1,490.86 0.55 2.3862 Pofhlgal 179.11 535.20 0.33 1.4493 Spain 797.90 4.531.17 0.18 0.7626 Sweden 1.5ao.17 3845.59 0.41 1.7795 Switzerland 1.796.35 5.036.36 0.36 1.5447 Unlted Kingdom 4.636% 15.065.95 0.31 1.3329 United States 30.47864 131.993.57 0.23 l.OOoo
3 926.88 3842.47 0.24 12 867.97 2.425.19 0.38 15 921.50 2.264.42 0.41 4 i,aof.a4 7.257.85 0.25 11 465.25 f,664.31 0.29 20 513.34 i.198.19 0.43 16 5,960.al 14.97899 0.40 17 6.025.51 14.061.17 0.43 9 193.66 383.85 0.50 la 207.29 435.66 0.48 21 5.790.23 a.lw.il 0.71 13 5.666.26 19.159.85 0.30 14 55.01 \2 138.11 0.40 5 1.045.93 4.371.47 0.24 19 559.40 1.490.86 0.36 7 294.66 535.20 0.55 1 894.59 4.531.17 0.20
10 1.120.60 3.845.59 0.29 a 1.205.78 5.03636 0.24 6 4.511.26 15.065.95 0.30 2 30.47864 131,993.57 0.23
I.0446 1.5499 1.7624 1.0751 1.2627 I.8554 1.7234 I.e.558 2.1849 2.0605 3.0730 1.2807 1.7248 1.0362 1.6249 2.3843 0.8550 1.2620 1.0368 1.2968 f.oooo
5 11 15 6 a 16 13 17 19 fa 21 9 14 3 12 20 1 7 4 IO 2
Total 76,625.03 242.84036
II Data for Japan are from Year 1999 21 Itindudes costs oftelecommunications services
__-, _, __ -, --,
0.32
___, ___,
69.526.40 242.84036 0.29

Table 9 Year 1666 \l
Unlt Operating Expense of Postal Admlnlstntlons Data from Universal Postal Union (UPU)
Market Exchange Rates Punhaslng Power Parltles (PPPs)
counby
Total EXpWWS (Mlllion t)
(1)
Welghted Ranking by Welghted Ranking by Total unn Index of Unit opentlng Total Unit Index Of unit openlung Mall opsrstlng unn EXpllse Total Mall Opentlng Unlt EXpsb-lW
Pieces Expense Opemtlng (Lower To Expenses Pieces Expense Opentlng (Lower To (Mllllons) ( S) EXpeilSe Higher) (Million $1 (MillIons) ($1 Expense Higher)
(2) (3) (4) (5) (6) (7) (6) (9) (10)
Australia AU&h Selglum Canada Denmsrk Finland Fnnu, Gennsny Greece Ireland
IW Japan Luxembourg f4etherlands
Spalh SWde” Swltxerland United Kingdom United States
1.384.40 3.642.47 0.36 1.3016 3 1.307.68 1.276.85 2.425.19 0.53 1.9021 11 1.087.35 1,233.63 2.264.42 0.54 I.9665 12 1.13414 20725.77 7.257.65 0.36 1.3566 4 2.560.77
745.80 1.66431 0.45 1.6169 5 522.45 920.18 1.19619 0.77 2.7745 19 622.81
9,127.91 14.978.99 0.61 2.2015 14 8.043.49 9586.65 14.061.17 0.68 2.4580 17 7.850.91
192.66 383.85 0.50 I.8133 10 241.87 287.85 435.63 0.66 2.3369 16 258.36
7.624.43 6.160.11 0.93 3.3756 21 7.313.16 12.195.36 19.159.85 0.64 2.2995 15 8.454.63
103.61 !2 136.11 0.75 2.7103 18 96.20 v 2.131.19 4.371.47 0.49 1.7613 a 1.855.74 1.179.09 1.490.66 0.79 2.8572 20 802.94
244.51 535.20 0.46 1.6505 7 402.25 93696 4.531.17 0.21 0.7471 1 1.050.52
2.231.3-3 3345.59 0.58 2.0963 13 1582.42 2.514.05 5.036.36 0.50 1 .xX34 9 1.687.53 6.765.76 15.065.95 0.45 1.6224 6 6.582.32
36.535.69 131.993.57 0.28 1 .xQo 2 36.535.69
Total 99.923.97 242.640.36 0.41 89.993.25
3.642.47 2.425.19 2.264.42 7.257.85 1.664.31 1.198.19
14.978.99 14.061.17
383.85 435.68
8.160.11 19.159.85
138.11 4.371.47 1.490.86
535.20 4.531.17 3.845.59 5.036.36
15.065.95 131.993.57
242.840.36
0.34 0.45 0.50 0.35 0.31 0.52 0.54 0.56 0.63 0.59 0.90 0.44 0.70 0.42 0.54 0.75 0.23 0.41 0.34 0.44 0.28
0.37
1.2295 1.6198 I.8094 1.2747 1.1341 1.8779 1.9400 2.0171 2.2765 2.1425 3.2378 1.5942 2.5165 1.5336 1.9457 2.7153 0.8376 I.4666 1.2105 I.5784 l.oMx)
5 11 12 6 3 13 14 16 ia 17 21 10 19 a 15 20 1 7 4 9 2
II DalaforJapanarefromYear 1989. 2, It includes costs oftelecommunications services
. -,

,
Table 10 Year 1966 \l
Labor Pmductivity of Postal Administrations
Data from Universal Postal Union (UPU)
Weighted Total Labor Ranking by Total Total AWlXge Number of Productivity Index of G&s Labor Mail Number of Annual Hours (Pieces Per Gross Productivity
Pieces Emulovees Hours Worked Hour Labor (Higher To Country
. (Millions) (Thousands)
(1) (2) Worked \3 (Thousands)
(3) (4)
Worked)
(5)
Productivity
(6) Lower)
(7)
Austnlia 3.842.47 Austria 2.425.19 Belgium 2.264.42 Canada 7.257.85 Denmark 1.664.31 Flnlrnd 1.196.19 France 14.97699 Germany 14,o61.17 Greece 383.85 ln?land 435.68
n=lY a.l6o.lf Japan l9,159.85 Luxembourg 138.11 Netherlands 4,371.47
Norway 1.490.86 Portugal 535.20 SPain 4.531.17 Sweden 3.845.59 Swltxerland 5.03636 United Kingdom 15.065.95 United States 131.993.57
Total 242,840.36
36.76 1.687.20 62,021.47 61.95 32.00 1.702.26 54.472.32 44.52 45.50 1.624.90 73,932.95 30.63 63.00 1 .a70.70 fi7.854.fo 61.58 27.60 I ,593.ao 43.988.88 37.83 30.90 l.al6.oo 56,114.40 21.35
239.30 1,687.60 403.842.68 37.09 232.60 1.656.30 385.255.38 36.50
11.60 1.795.70 20.83o.f 2 la.43 10.30 I ,ao3.30 18.573.99 23.46
237.10 f .776.9O 421.302.99 19.37 141.60 2.142.50 303.378.00 63.16
1.50 1.726.70 2.590.05 53.32 45.M) 1 E46.60 69,597.OO 62.81 26.39 I ,5o9.80 39.843.62 37.42 16.30 1.665.95 30.41499 17.60 56.10 v I .770.85 99344.69 45.61 52.60 1.49490 76.631.74 48.91 40.70 I ,a38.70 74.83509 67.30
207.M) I ,7aa.75 370,271.25 40.69 805.80 f.845.lo I ,486,7af .5a 88.78
2.359.65 36544.51 4.213.877.28 57.63
II Data for Japan are fmm Year 1969. 2l The figure includes the employees of telecommunications services~ 3/'Appendix 6. Table 61.
0.6979 5 0.5015 10 0.3450 16 0.6937 6 0.4262 12 0.2405 16 0.4176 14 0.4111 f5 0.2076 20 0.2642 17 0.2182 19 0.7114 3 0.6OOa 7 0.7075 4 0.4215 13 0.19a2 21 0.5138 9 0.5509 a 0.7581 2 0.4583 11 1 .oooo 1

Table 11 Year 1968 \l
WagePremium of Postal Administrations
Country
Purchasing Power Parities (PPPs) Estimated Hourly Hourly
Annual Compensation Compensation Ranking by Averege Working costs CC&S w=ge Annual Time of Postal in Wage Index of Premium
Labor cost In Postal Administrations Manufacturing Premium W=ga (Lower To
(9 U Administrations \3 IS) (S) w 0) Premium Higher)
Ausballa Ausbia
Finland France Germany Greece Ireland
IW Japan
Netherland; Norway Portugal Spain Sweden SWfb!d~“d United Kingdom United States
25,214 1.687.20 14.94 10.72 4.23 0.6413 17 27.124 1.702.26 15.93 12.38 3.55 0.5390 15 20,253 1.624.90 12.46 14.55 (2.W (1.3161) 1 28.601 1.870.70 15.29 12.73 2.56 0.3879 12 17.581 1.593.80 11.03 10.66 0.38 0.0570 5 16,613 l.al6.oo 9.15 10.65 (1.W (1.2276) 2 24.909 1.687.60 14.76 11.42 3.34 0.5075 14 25,905 1.656.30 15.64 15.01 0.63 0.o950 6 16,695 1.795.70 9.30 6.56 2.74 0.4157 13 20.125 1.603.30 11.16 a.99 2.17 0.3299 10 24,421 1.77690 13.74 13.41 0.33 0.0502 4 40.016 2.142.50 la.68 8.69 9.9a 1.5150 21 36,672 1.726.70 21.24 12.80 a.44 1.2800 20 23,243 1.546.60 15.03 13.79 1.24 0.1875 7 21,197 1,509.ao 14.04 12.58 1.46 0.2218 a 18.077 1,865.95 9.69 4.58 5.11 0.7747 fa 15,946 1,770.85 9.00 9.60 (0.59) (1.0897) 3 21.304 1,494.90 14.25 11.95 2.30 0.3494 11 29,626 1.838.70 16.11 12.10 4.02 0.6095 16 21.794 1.788.75 12.16 10.31 1.87 0.2840 9 37.824 1.845.10 20.50 13.91 6.59 1.0000 19
I/ Data for Japan are from Year 1989 21 Table 6. 31 Appendix 8. Table Bl. 4/ Appendix 8. Table 82.
,.,, ,,,,,,, ,,,, ,,,” ,,, ,,, ,,. ,,. ., ,, ,, ,,,. ,,“, ,,,,, ., ., ,” ,,,, i, ,,,, ,,,,,,, ,,,“,, ,,,,


Table 13 Actual and Predicted Labor Productivity
Australia 59.67 42.20 Austria 43.03 47.54 Belgium 33.00 33.69 Canada 59.44 42.53 Denmark 37.63 42.07 Finland 20.50 32.17 France 30.26 45.16 Germany 36.50 35.91 Greece 10.43 17.10 Ireland 25.70 30.63 Italy 19.37 27.74 Japan 63.16 4557 Luxembourg 51.62 56.45 Netherlands 62.01 42.19 Norway 37.42 46.97 Portugal 17.75 26.30 Spain 44.70 23.46 Sweden 47.45 5475 Switzerland 70.70 7903 United Kingdom 44.60 44.25 United States 00.70 60.95
Actual Predicted Difference
17.47 -4.51 -0.01 16.92 -5.04 -11.59 6.91 0.59 1.33
-4.06 -0.37 17.59 4.03 20.62 -9.56 -0.63 21.25 -7.29 -9.13 0.55 19.03

,
AppmdlX A Y*ar 1966 11
Exchange Rates rnd P”mh.*lng Power Parme* (PPPS,
NOnnY -f!wl SPb SWdWtl SWlfZ9tind Unlbd Klnpdom IJnRd slam
Almtralh” dollar Amldan schlllln6 ealgb” franc C.,,.df.n d&l., G.&h km”. Flnnfsh mfbft. Fmnch franc mubch8 mmlfl Gmk dmh”” Irbh pwnd fmfan Iln
J~P-Y- LuxmllKl”np franc Nathwwh S”lldw No,w,,l.n lrro”. PoliuSlm9 nctldo Spnbh pnefa Swdbh hmna swlu franc
- US dollar(S)
0.54w 1.5037 u 1.2752 0.3577 1.1639 5.7171 14.6166 u 12.3460 0.3911 1.1639
16.410-I 43.4270 36.7660 0.3779 1.1611 0.5243 1.4570 u 1.2307 0.3599 1.1639 3.0220 7.9517 6.7320 0.3600 I.1612 1.6369 4.9520 u 4.1626 0.3713 1.1639 2.5765 7.0361 5.9569 0.3665 1.1612 0.7627 2.0744 1.7562 0.3773 I.1612
58.4Joo 167.5500 141.6600 0.3368 1.1611 0.2900 0.7757 0.6553 0.3739 1.1636
574.wo6 1.5373000 1.301.6ooo 0.3734 1.1611 60.m 163.3306 U 137.9600 0.3674 1.1639 15.9Wil 43.4270 36.7680 0.3661 1.1611 0.6790 2.3343 1.9766 0.3766 1.1810 2.6700 7.7155 u 6.5170 0.3720 1.1639
63.2700 169.19-N 143.9500 0.3740 1.1753 51.9926 137.9125 u 116.4900 0.3770 1.1639
2.7380 7.2439 6.1272 0.3777 1.2752 0.65w 1.7324 u 1.4633 0.3752 1.1639 0.2400 0.6641 0.5614 0.3614 1.1631 0.4396 1.1639 1 .owo 0.3713 1.1639
0.4235 1.3500 5.67 0.4630 14.5wo 17.43 0.4463 4o.owo 8.79 .’ 0.4260 1.3100 64. 0.4469 9.6100 42.75 0.4396 6.1800 47.75 0.4329 6.7600 13.46 0.4457 2.1400 21.65 0.3976 113.OOa (20.34, 0.4426 0.7309 11.41 0.4410 1.357.OcoJ 4.26 0.4349 l9909W 44.24 0.4324 39.6cQO 7.70 0.4447 2.2700 ,464 0.4404 9.5700 46.65 0.4395 67.5000 (39.22) 0.4463 103.9000 (10.61) 0.4465 6.64W 41.01 0.4442 2.16W 46.96 0.4276 0.5770 2.79 0.4396 1.OOW 0.90
I, Dab fa Japan me frcm Yam 1869. 21 Postal Slafiaffca (1966). Infematlcanl Bumau. Unhwsal Postal Union (UPU). Beme. Swiierfanf. 3 Average annual exdlange rates. Inf*mafional Finamial Slalistics (November. 1993). Sfafisfics Deparfnmnf. International Monetary Fund (IMF).
WashIngton DC. USA. 4/ They are c&ubted as the pmducl of fwo sxcbange rafes:( NW I I) and (S I ECU). 5, Calculated rateli. 61 Purchasing Power PaMlea (PPPs) are the rat.% of cunency wnverjbn that equalize the purchasing paver of different currencies. National Accounts.
Main Aggregates. Volume I (1960 1991). Organizafiin for Economic Co-operation and Development (OECD). Paris, France (1993). 7, (COL. 6 / COL.4)WO Abbr.vbfb”s NW = Nalbnal Currem Unll
GFR = Gold Franc EC” = E”mpm C”mncy unn S = us Dollar

.
Appendix B Tabk El
Year 1996 \I Average Annual Hours Worked
COllllty
Estimated Avange Estimated Actual AllIlUal Annual AlllWlll Holfn Wottdng
Working Annual Holidays In Days Worked Time In TImeof Ill POStal
Employees !Z Publlc U Annual \z Total Manufacturing \3 Admlnistmtlons
(1) (2) (31 (4, (5, (6,
Ranklng by Ind5x of AlllNlll AWnQ5 HOUn Annual Worked HOW.9 (HIgherTo
Worked Lower,
(7, (8)
Australia AU5MO eelglum Canada Oenmwk Flnhnd FlUtIC Gmmlly GWCO Irsland
blv Japan Luxembourg Netherlands NOmPy Pormgal SPlbl Sweden Swltzedand Unlted Kingdom Unlted States
1.625.60 35.00
1.572%
10.00 25.00
7.60 25.M)
1o.M) 25.00 9.W 30.20 9.00 25.w 8.Do 20.00
15.00 22.70
IO.00 26.00 6.M) 22.50
llsm 23.60 14.00 23.50
6.W 25.00
32.50
1,719.10 1.672.40 1.79570 1.80330 1.69250
35.00 39.20 34.Dcl 26.00 37.70
1.667.20 U 1.702.26 U 1,624.20 1.670.70 1.614.70 1.616.M u 1.656.10 1.540.20
1.661.30 2.142.50
1.72670 1.477.20
36.00 26.50
1.862.Qo 1.777.70
34.60 37.50
1.703.40 33.M)
1.616.00 1.50960 1.869.00 U 1.764.00 u 1.494.90 lfJ38.70 u 1.674.10 1.951.10
1.667.20 0.9144 1.70226 0.9226 1.624.90 tS 0.6607 1.870.70 1.0139 1.593.60 M 0.8636 1.816.00 0.9642 1.667.60 IE 0.9146 1.656.30 \5 0.6977 1.795.70 0.9732 1.60330 0.9773 1.776.90 \6 0.9830 2.142.50 1.1612 1.726.70 0.9356 1546.60 M 0.6362 1.509.60 0.6163 1.665.95 \6 1.0113 1.770.85 ts 0.9598 1.494.90 0.6102 1.636.70 0.9965 1.706.75 I6 0.9695 1.645.10 \6 l.CiOl
15 13 17 2 16 6 14 16 fJ 7 10 1 12 19 20 3 11 21 5 9 4
II Data for Japan are from Year 1989 2/ Statistics in Focus, Population and Social Condiiions, Manuscript Completed on Y15H995. Eurostat. L-2920 Luxembourg 3/ Average Annual and Average Weekly Hours Worked in Manufacturing 12 Countries. 1560-1994. U.S. Department of Labor.
Bureau of Labor Statistics, September 1995. 4/ Estimated horn draft data provided by the Bureau of Labor Statistics, Office of Productivity and Technology. March 1996. 5/ Average of Rgures in Columns (1) and (5). 6/ U.S. Postal Service Average Anual Hours Worked. U.S. Postal Service Total Factor Productivity,
Annual Data Tables, 1994 Edttion. L. R. Christensen Associates.
.
Appendix B Table 82
Year 1968 \I Hourly Compensation Costs for Production Workers in Manufacturing
Market Exchange Rates Purchasing Power Partties (PPPs)
counby
Hourly Compermtlon Ranking by Ranking by
Clmb In IhWly index of -dY HWt-ly hdex of HOUlfy NItkWld Compensation Hourly Compensation Campensatlon Hourly Compensstlon currency CO&S Compensation (Lower To Costa Compensstlon (Lower To
(NCtJs) t2 (f) CC&S Higher) (3) costs Higher) (1) (2) (3) (4) (5) (6) (7)
AUSbsh AUSblC3 Belgium Canada Denmark Finland Fmnce Germany Gmece Inland
blY JsDan
Norway Portugal Spain Swedell Swttzeriand United Kingdom United States
-14.47 11.35 0.8158 6 10.72 0.7706 9 179.54 14.54 1 .M53 13 12.38 0.8902 13 581.89 15.83 1.1377 16 14.55 1 .I#58 20
16.68 13.55 0.9744 9 12.73 0.9154 15 102.40 15.21 1.0935 14 10.86 0.7660 8 65.81 15.73 1.1311 15 10.85 0.7656 7 77.17 12.95 0.9313 8 11.42 0.8207 10 32.13 18.30 1.3153 20 15.01 1.0794 21
741.00 5.22 0.3755 2 8.58 0.4714 2 6.56 10.01 0.7197 4 8.99 0.8480 4
18.201.00 13.98 1.0053 12 13.41 0.9642 17 1,730.OO 12.54 0.9015 7 8.69 0.8250 3
507.00 13.79 019913 IO 12.80 0.9204 18 31.31 15.84 1.1388 17 13.79 0.9916 18
120.37 10.47 1.3278 21 12.58 0.9042 14 400.97 2.79 0.2003 1 4.58 0.3294 1 997.09 6.56 0.6153 3 9.60 0.6898 5 103.24 16.85 1.2113 18 11.95 0.8590 11
26.37 18.02 1.2955 19 12.10 0.8698 12 5.95 10.60 0.7620 5 10.31 0.7413 6
13.91 13.91 1 .OOOo 11 13.91 1 .xuo 19
l/ Data for Japan are from Year 1989. 2/ Compensation costs indude pay for time worked; other direct pay; employer expenditures for legally required insurance
programs and contractual and private benefit plans; and, for swne countries, other labor taxes. International Comparisons of Hourty Compensation Costs for Production Workers in Manufacturing, 1993, U.S. Department of Labor. Bureau of Labor Statistics, Report 873, June 1994.
- . . _- pi _ -

I .
Appendix B Table 83
Year 1988 \I Inhabitants Per Post Office
and Post Dffice Density Data from Universal Postal Union (UPU)
counby
Number of Post
Dflices
(21
Rsnking by Inhabitants Post Dflice Ranking by
Index of Per Density post office Inhabitants lnhabitanb Post Office (PC& offlcas Index of LhSity
Per Per (Lower To Per 100 Square Post Offlcs (Higher To Post Office Post ORice Higher) Kilometres) Density Lower)
(3) (4) (5) (3) (41 (5)
Austnll’d Austria Belgium Canada Denmark
France
Greece Ireland
blv Jspsn Luxembourg Netherlands Norway Portugal Suain
Swikerland United Kingdom United States
4,489 3,884 0.8000 2,676 2.838 0.4623 1,838 5,387 0.8775
14.982 1,731 0.2820 1,270 4.039 0.8579 2,926 1,890 0.2753
16.949 3,311 0.5393 17,410 3.530 0.5749
1.296 7,720 I.2574 2,103 1.882 0.2740
14,373 3.996 0.6509 23.871 5,158 0.8401
108 3,519 0.5731 2,824 V. 5,625 0.9182 2,728 1,543 0.2513 1,107 8.818 I .4381
12,985 2,989 0.4868 2,110 3,698 0.8512 3,763 1,773 0.2888
21,030 2.714 0.4420 40.117 6,140 1.Oi?O0
4,027 Total 190,753
I/ Data for Japan are from Year 1989. 2/ CEC - Green Paper. Year 1989.
12 7 I7 4 I5 3 9 II 20 2 I3 I8 IO 18 I
21 8 I4 5 6 I9
0.08 3.19 8.02 0.15 2.95 0.87 3.10 7.00 0.98 2.99 4.77 8.32 4.08 7.03 0.84 1.20 2.57 0.47 9.11 8.59 0.43
0.62
0.1364 7.4562
14.0727 0.3509 6.8891 2.0283 7.2388
16.3631 2.2949 6.9910
11.1476 14.7654 9.5397
16.4224
2.8088 6.0100 1.0956
21.2922 20.0889
21 9 6
20 I2 I8 IO 4 I5 I1 7 5 8 3 17 14 13 18 I 2 I9
-__ -_ _ I- ^ . . . . _. .

,” ,
Table 84 Year 1988
Appendix B
Basic Letter Rate of Postal Adminisbations Data from Commission of the Eumpian Communities (CEC)
Green Paper
Market Purchasing Exchanae P0Wer
Counby
Basic Latter Rate
(ECUs)
(1)
Basic L&W Rate
( NCUs)
VI
Rate*- Basic Later Rate
( S) (3)
Parities (PPPs) Basic Lener Rate
( $1 (4)
Auatmlia 0.25 0.37 0.29 0.27 AUSU~ 0.34 5.00 0.40 0.34 Belgium 0.33 14.33 0.39 0.38 Canada 0.25 0.37 0.30 0.28 Denmark 0.47 3.74 0.56 0.39 Finland 0.36 1.80 0.43 0.29 France 0.31 2.20 0.37 0.33 Germany 0.50 1.04 0.59 0.48 Greece 0.17 28.48 0.20 0.25 Ireland 0.36 0.28 0.43 0.38 IbJly 0.50 788.65 0.59 0.57 Japan 0.37 60.00 0.43 0.30 LUX~bOWg 0.28 12.16 0.33 0.31 Netherlands 0.32 0.75 0.38 0.33 Norway 0.35 2.70 0.41 0.28 Portugal 0.18 30.45 0.21 0.35 Spain 0.15 20.69 0.18 0.20 Sweden 0.30 2.20 0.36 0.25 Switzerland 0.29 0.50 0.34 0.23 United Kingdom 0.28 0.19 0.33 0.32 United States 0.21 0.25 0.25 0.25

. . .\,
Table BS Year 1988 \I
Revenue Per Piece of Postal Administrations Data from Universal Postal Union (UPU)
Total Revenue
Markat Exchange Rates Purchasing Poww Parltles (PPPs)
Welghted Ranking by Weighted Ranking by TotsI Revenue Total Revenue Mail Revenue Index of Per Piece Total Mail Revenue Index of Per Piece
Plecas Per Piece Revenue (Lower To Revenue Pieces Per Piece Revenue (L-r To Country ~(Million S) (MIllions) ( $1 Per Piece Higher) (Million $) (Millions) ($1 PerPIece Higher)
(1) (2) (3) (4) (5) (6) (7) (8) (9) (10)
Ausfralla 1.420.35 3.842.47 0.37 1.3723 5 1.34164 3.842.47 0.35 1.2983 5
Austria 3.469.70 2.425.19 1.43 5.3118 21 2.954.75 2.425.19 1.22 4.5233 21
Belgium 1.30734 2.264.42 0.58 2.1434 11 1.201.70 2,264.42 0.53 1.9702 13
Canada 2.859.96 7.257.85 0.39 1.4583 6 2.678.33 7.257.85 0.37 1.3700 6 Danmatlr 993.37 1864.31 0.60 2.2159 12 695.88 1.664.31 0.42 1.5523 7 Flnland 598.66 1.198.19 0.50 1.8548 9 405.15 1.198.19 0.34 1.2553 4
France 13.002.43 14.97899 0.87 3.2227 19 11.457.72 14.97899 0.76 2.8398 19
Germany 9.528.91 14.061.17 0.68 2.5159 16 7.81994 14.061.17 0.56 2.0847 14
G- 170.76 383.85 0.44 1.6516 7 214.37 383.85 0.56 2.0734 15
Inland 290.41 435.68 0.67 2.4747 15 260.68 435.68 0.60 2.2214 17
W 5.799.97 8.160.11 0.71 2.6388 17 5563.19 8.160.11 0.68 2.5311 18
Japan 12.315.57 19.159.85 0.64 2.3864 14 8537.97 19.159.85 0.45 1.6544 10
Luxembourg 170.55 138.11 1.23 4.5847 20 158.36 138.11 1.15 4.2568 20
Netherlands 2.187.14 4371.47 0.50 1.8575 10 1.904.45 4.371.47 0.44 1.6174 8
Norway 1.151.13 1,490.86 0.77 2.8666 18 783.90 1.490.86 0.53 1.9521 12
Portugal 185.61 535.20 0.35 1.2876 3 305.36 535.20 0.57 2.1182 16
Spain 697.75 4.531.17 0.15 0.5717 1 782.29 4.531.17 0.17 0.6410 1
Sweden 2.390.93 3.845.59 0.62 2.3082 13 1.695.57 3fM5.59 0.44 1.6369 9
Swlhetfand 1.828.73 5.03636 0.36 1.3481 4 l-227.52 5.03636 0.24 0.9049 2
United Kingdom 6.973.64 15.535.95 0.46 1.7185 8 6.784.76 15.065.95 0.45 1.6719 11
United Statas 35.552.99 131X13.57 0.27 1 .woo 2 35,552.99 131.993.57 0.27 l.oocil 3
Total 102.886.98 242.84036 0.42 92.326.49 242.84036 0.38
II DataforJapanarefromYear1989


