A COST COMPARISON OF SERVING RURAL AND … · A COST COMPARISON OF SERVING RURAL AND URBAN AREAS IN...
21
A COST COMPARISON OF SERVING RURAL AND URBAN AREAS IN THE UNITED STATES Robert H. Cohen William W:Farguson Spyros S. Xenakis Office of Technical Analysis and Planning Postal Rate Commission April 20, 1993 The views expressed h this paper are those of the authors and do not necessarily represent the opinions of the Postal Rate Commission.
Transcript of A COST COMPARISON OF SERVING RURAL AND … · A COST COMPARISON OF SERVING RURAL AND URBAN AREAS IN...

A COST COMPARISON OF SERVING RURAL AND URBAN AREAS IN THE UNITED STATES
Robert H. Cohen William W:Farguson
Spyros S. Xenakis
Office of Technical Analysis and Planning Postal Rate Commission
April 20, 1993
The views expressed h this paper are those of the authors and do not necessarily represent the opinions of the Postal Rate Commission.

A COST COMPARISON OF SERVING RURAL AND URBAN AREAS IN THE UNITED STATES
Robert H. Cohen William W. Ferguson
Spyros S. Xenakis
Postal Rate Commission Office of Technical Analysis and Planning
April 20, 1993
1. Introduction
In this paper,' we compare the cost of serving rural and urban areas in the United States by examining the delivery and window (counter) functions. Intuitively, one expects these functions to show the greatest rural/urban differences. Delivery is thought to be more expensive in rural areas because of lower population density. Window services are also thought to be more expensive in rural areas because areas of low population density have disproportionately large numbers of post 0ffices.l
We make use of United States Census Bureau data (for 1990) which show slightly more than 75 percent of the 250 million people living in the United States reside in urban areas (i.e., in the 6,813 incorporated places with more than 2,500 inhabitants). Thus, slightly under 25 percent of the population live in rural areas. The Postal Service provided city delivery to 6,625 post offices in 1991 indicating a close correspondence between the number of urban areas and the number of post offices providing city delivery.
The views expressed in this paper are those of the authors and do not necessarily represent the opinions of the Postal Rate Commission.
' This paper is based on a paper by the same authors, HRural Delivery and Universal Service Obligation: A Quantitative Investigation." In Reculation and the Nature of Postal and peliverv Services, edited by M.A. Crew and P.R. Kleindorfer, 161-176. Boston: Kluwer Academic Publishers, 1993.
' This paper focuses on a comparison of postal costs between rural and urban areas. It does not purport to show the bearing, if any, this cost analysis might have on questions regarding the complex issue of the postal monopoly, which encompasses many issues beyond the scope of this paper.

In the United States, the Postal Service mail is normally delivered by city carriers in urban areas and by rural carriers and contract carriers' in rural areas.' City carriers served 78.5 million delivery points in 1991. Rural (and contract) carriers served 23.4 million. Since 95 million delivery points are households, rural carriers serve slightly less than 25 percent of the delivery points. Thus, there is a good correspondence between the census split of rural and urban population and the number of delivery points served by city and rural carriers.
All rural carriers use vehicles to deliver to mail boxes placed on the edge of the roadside. Not all rural roads are served by rural carriers.' Nevertheless, mail recipients must place a box along the rural route. An estimated 10 to 15 percent of rural recipients do not live on a road traveled by a rural carrier and must travel to a nearby road to retrieve their mail. Boxes will tend to be clustered where a rural route intersects a road not on the route.
This gives rise to the issue of the relative level of service accorded to rural and urban residents. City carriers operate under a very long-standing policy not to provide door delivery to new dwellings. Delivery is made to roadside boxes or cluster boxes. The latter are a group of boxes which serve a small neighborhood. Approximately 22 percent of city deliveries are to curb boxes or cluster boxes.
Thus, many urban residents receive the same sort of delivery service as rural residents. The major difference is that rural residents on a road not traveled by rural carriers must travel to a road on the rural route to get to his or her mail. This is not so inconvenient as it might appear. Rural routes cover all the major rural roads. Residents traveling to or from a road not served by a rural carrier would in the normal course of going to and from their residence pass their rural mail box. It must be admitted, however, that the level of service afforded this relatively small percentage of rural residents is less than that afforded urban residents. On the other hand, rural (but not city) carriers perform ordinary window service type transactions for rural residents. Patrons can buy postage and postal money orders from rural carriers, have their parcels rated, and
3 Contract carriers work under contract to the Postal Service and are not postal employees.
4 In usual circumstances, a small number of city delivery carriers provide service in areas categorized as rural and some rural carriers provide service in urban areas.
J Roads with less than one box per mile will not normally be served by a rural route.
2

purchase other special service. Patrons need not physically meet the rural carrier, but may place a request, money, letters and parcels in the rural box and set the flag up. The rural carrier will stop even if there is no delivery for the box to provide service. Rural carriers spend 3 percent of their time on retail transactions. Not having to travel to a post office for ordinary window service is a significant service advantage of rural delivery.
Seventy-six (76) percent of city routes use vehicles. Twenty-two (22) percent of city carriers deliver to roadside mail boxes without dismounting. These are called curbline routes. Fifty-four (54) percent park their vehicle at various places along the route and service the dwellings nearby on foot. These are called park and loop routes. The remaining routes are foot routes.
2. Comparison of the Cost of City and Rural Delivery
2.1. Comparison of Carrier Time Required to Serve City and Rural Areas
Table 1 shows that the average time per day per possible delivery is 1.04 minutes for city delivery6 and 1.07 minutes for rural delivery. (This small difference would be further reduced if retail activities of rural carriers were not counted.) The virtual equality of the average carrier time to serve urban and rural customers is a major finding of this paper. Part of the explanation for this finding can be inferred from table 1 - businesses require considerably more time per possible city delivery than do residences.
The average possible delivery on business routes requires five times as much carrier time as the average possible delivery on residential routes. There are several reasons for this large difference in carrier time:
- Businesses receive almost three times as many pieces per possible delivery as do residences. The statistics shown in table 1 (row 2) reflect both in- office and out-of-office delivery time.' In-office time is closely related to volume.
6 This analysis includes only city delivery letter routes. It excludes parcel post and support routes which primarily serve business districts in larger cities.
' City and rural carriers typically spend between three and four hours in the office preparing for delivery.
3

Table 1
Selected Statistics for City Delivery and Rural Delivery Routes
(1989)
City Residential
Park & FOOt Curb LOOD
1. Possible Deliveries 11.5 15.1 46.9 (millions)
2. Minutes per Day per Possible Delivery (in-office and out-of-office)
1.00 0.83 1.01
3. Seconds Piece per 13.24 9.54 12.93 (in-office and out-of-office)
4. Pieces per Day per Possible Delivery 4.53 5.21 4.70
Total
City Business*
u Foot Curb LOOD
73.4 0.6 12.6 15.7 49.7 78.1 20.5
0.97 5.55 1.21 0.85 1.06 1.04
12.22 21.44 14.78 9.69 12.98 12.50
4.78 15.52 4.89 5.28 4.92 5.01
1.07
14.94
4.30
Residential, Business and Mixed
Park &
All Rural
' Reflects the fact that business routes receive service only 5 days per week.
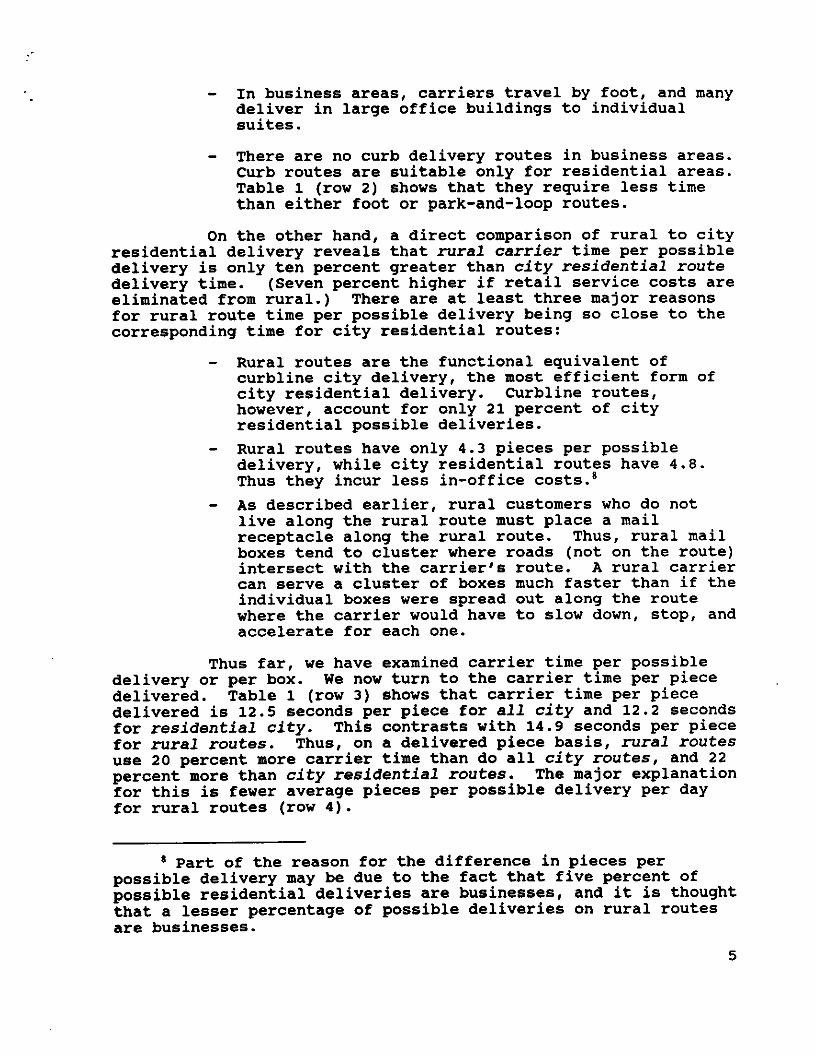
- In business areas, carriers travel by foot, and many deliver in large office buildings to individual suites.
- There are no curb delivery routes in business areas. Curb routes are suitable only for residential areas. Table 1 (row 2) shows that they require less time than either foot or park-and-loop routes.
On the other hand, a direct comparison of rural to city residential delivery reveals that rural carrier time per possible delivery is only ten percent greater than city residential route delivery time. (Seven percent higher if retail service costs are eliminated from rural.) There are at least three major reasons for rural route time per possible delivery being so close to the corresponding time for city residential routes:
- Rural routes are the functional equivalent of curbline city delivery, the most efficient form of city residential delivery. Curbline routes, however, account for only 21 percent of city residential possible deliveries.
- Rural routes have only 4.3 pieces per possible delivery, while city residential routes have 4.8. Thus they incur less in-office costs.'
- As described earlier, rural customers who do not live along the rural route must place a mail receptacle along the rural route. Thus, rural mail boxes tend to cluster where roads (not on the route) intersect with the carrier's route. A rural carrier can serve a cluster of boxes much faster than if the individual boxes were spread out along the route where the carrier would have to slow down, stop, and accelerate for each one.
Thus far, we have examined carrier time per possible delivery or per box. We now turn to the carrier time per piece delivered. Table 1 (row 3) shows that carrier time per piece delivered is 12.5 seconds per piece for all city and 12.2 seconds for residential city. This contrasts with 14.9 seconds per piece for rural routes. Thus, on a delivered piece basis, rural routes use 20 percent more carrier time than do all city routes, and 22 percent more than city residential routes. The major explanation for this is fewer average pieces per possible delivery per day for rural routes (row 4).
* Part of the reason for the difference in pieces per possible delivery may be due to the fact that five percent of possible residential deliveries are businesses, and it is thought that a lesser percentage of possible deliveries on rural routes are businesses.
5

2.2. Labor Cost
Rural carriers work five days per week and each has a casual employee who works the sixth day and when the carrier is on vacation or sick leave. City carriers also work five days, but are generally replaced by a regular city carrier on the sixth day. City delivery makes use of casual employees, but to a lesser extent than rural delivery. Casual employees are paid much less than regular rural or city carriers and receive few fringe benefits. Overtime is generally not used on rural routes since the carrier is basically paid to do the route and not by the hour. On the other hand, overtime is a frequent component of city carrier compensation because they are paid for a 40-hour work week. For these reasons, the actual average hourly labor cost of rural delivery is lower than that of city delivery. In 1989, rural delivery cost the Postal Service an average of $20.60 per hour or 34.3 cents per minute. City carrier labor cost $24.49 per work hour or 40.8 cents per minute.
Since other countries might not have any difference in labor costs for rural and city delivery, we also make use of a theoretical labor cost for both city and rural delivery which is the same for both. This figure is based on the average hourly labor cost for the Postal Service for all collective bargaining labor; $24.09 per work hour or 40.2 cents per minute.
2.3. Delivory Vehicle Cost
Rural carriers furnish their own vehicles and provide all maintenance, repairs, and fuel, for which they are paid an allowance.9 In 1989, rural carriers received an average of 34 cents per mile as a motor vehicle allowance. The average length of a rural route is 55 miles. The average annual cost per rural route is shown in table 2.
Those city delivery carriers who make use of a vehicle are furnished with one by the Postal Service which also provides all maintenance, repairs, and fuel. City carriers drive an estimated 15 miles per day. Analyzing Postal Service accounts for depreciation, fuel, and maintenance for city delivery carriers, we have estimated the average city delivery vehicle cost per route. This is also shown in table 2.
g In 1989, the rural carrier vehicle allowance was 31 cents per mile or a minimum of $12.40 per day, whichever was greater.
6

.
Table 2
Average Vehicle Cost per City Delivery and Rural Route
(1989)
3x2& GiAY
Annual $3,189 Daily $10.56 Per Possible Delivery per Year $6.40 Per Possible Delivery per Day 2.1c Per Piece 0.4c
$5,677 $18.80 $12.99
4.3c l.OC
Rural vehicle cost per box or possible delivery is twice the average city carrier vehicle cost per possible delivery. Rural vehicle cost per delivered piece is two and a half times city carrier cost per delivered piece. It should be borne in mind that, though the %ity" column divides total city vehicle cost by the total number of city routes (including foot routes), only 84 percent of possible city deliveries are made by city carriers using vehicles.
2.4. Comparison of Direct Labor Plus Vehicle Cost to Serve City and Rural Areas
It can be seen in table 3 that it actually costs the United States Postal Service less to serve a rural box than a possible delivery in an urban area. This is due to the lower labor costs for rural delivery. On a per piece basis, however, urban delivery is less costly. If theoretical labor costs are used, city delivery is cheaper than rural delivery.
7
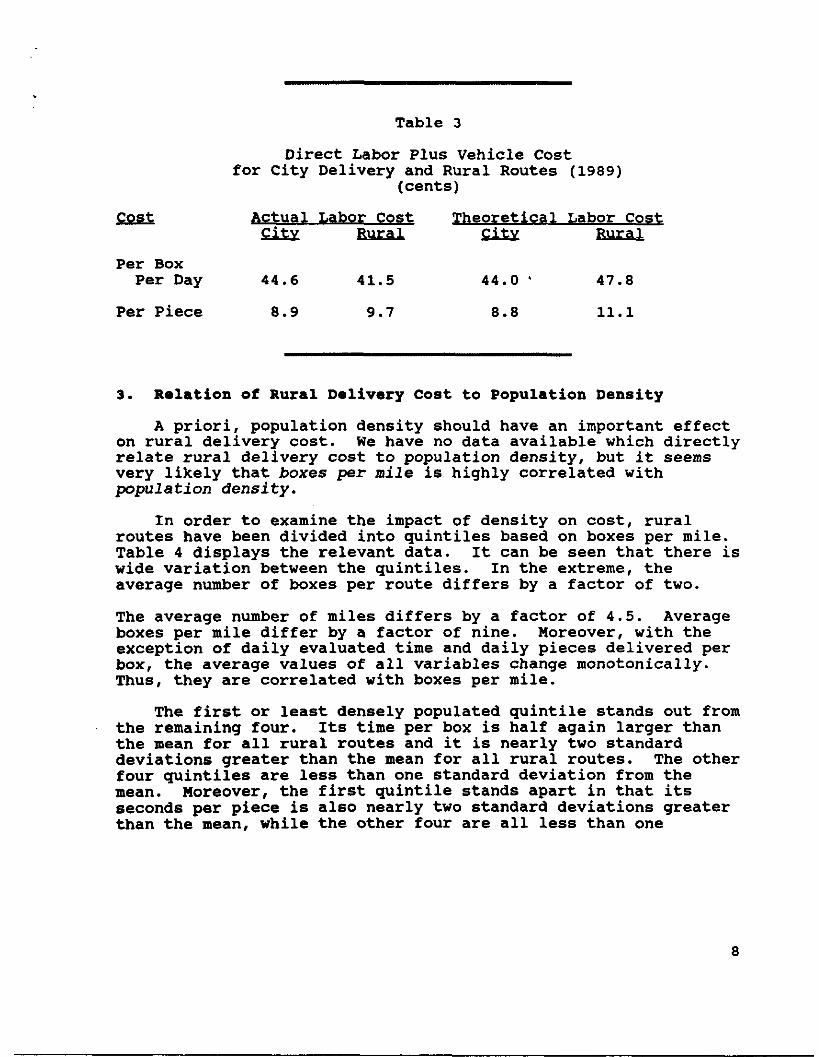
Table 3
Direct Labor Plus Vehicle Cost for City Delivery and Rural Routes (1989)
(cents)
Per Box Per Day
Per Piece
44.6 41.5 44.0 * 47.8
a.9 9.7 8.0 11.1
3. Relation of Rural Delivery Cost to Population Density
A priori, population density should have an important effect on rural delivery cost. We have no data available which directly relate rural delivery cost to population density, but it seems very likely that boxes per mile is highly correlated with population density.
In order to examine the impact of density on cost, rural routes have been divided into quintiles based on boxes per mile. Table 4 displays the relevant data. It can be seen that there is wide variation between the quintiles. In the extreme, the average number of boxes per route differs by a factor of two.
The average number of miles differs by a factor of 4.5. Average boxes per mile differ by a factor of nine. Moreover, with the exception of daily evaluated time and daily pieces delivered per box, the average values of all variables change monotonically. Thus, they are correlated with boxes per mile.
The first or least densely populated quintile stands out from the remaining four. Its time per box is half again larger than the mean for all rural routes and it is nearly two standard deviations greater than the mean for all rural routes. The other four quintiles are less than one standard deviation from the mean. Moreover, the first quintile stands apart in that its seconds per piece is also nearly two standard deviations greater than the mean, while the other four are all less than one

Table 4
Distribution of Rural Routes by Density (Boxes per Mile) Selective Averages
(1989)
Quintile
1
2
3
4
5
Daily Evaluated
Time fHoursl
7.16
8.03
8.22
8.05
8.09
Daily Daily Daily Evaluated Evaluated
Pieces Time Time Number Number Boxes Delivered per Box per Piece
of Boxes of Miles per Mile oer Box JMinutesL jSecondsL
275.31 95.73 2.88 4.04 1.56 23.15
421.73 71.53 5.90 3.79 1.14 18.10
465.85 50.64 9.20 4.19 1.06 15.16
495.37 34.89 14.20 4.67 0.98 12.53
555.69 21.16 26.27 4.59 0.87 11.41
Total 7.91 442.79 54.79 8.08 4.30 1.07 14.94
to
_ - .,

standard deviation from the mean." Thus, the two measures of cost for the first quintile are substantially greater than for the other four quintiles. This will be seen clearly in Section 4, where the profitability of rural delivery is calculated for each quintile.
The number of pieces delivered per box is much larger for the fourth and fifth quintile than it is for the other three. This is probably due to the disproportionate number of businesses located in the more densely populated areas.
Finally, the variability (or elasticity) of time with respect to volume for the five quintiles differs greatly:
All be 2nd z!d 4th 5th Routes
. 29 . 37 .44 . 53 . 57 .44
Thus, for example, if the volume in the first quintile were to double, total cost would increase by 29 percent. The variation between quintiles can be explained by greater fixed costs in the less densely populated quintiles than in the more populated quintiles. The time required to drive the route is fixed, and driving time represents a greater proportion of total cost in the less densely populated quintiles.
Figure 1 displays the minutes per box per day as a function of density. It can be seen that time per box drops off sharply at the low end of the density spectrum and then it flattens.
In order to isolate the effect of density on time per box, the elasticity of time per box with respect to density has been calculated using the route evaluation factors (which are used to determine rural carrier pay). Holding constant the pieces per rural box and route miles, a one percent increase in density reduces out-of-office time per box by 0.44 percent and total time per box by 0.27 percent."
lo The daily evaluated time per box for all routes (1.07 minutes) has a standard deviation of 0.30 minutes. The daily evaluated time per piece for all routes (14.94 seconds) has a standard deviation of 4.64 seconds.
'I The relation between time per box and boxes per mile (density) is exponential, or linear in logarithms. The Pearson correlation coefficient between the logarithmic values of the two variables is -78.60 percent. The econometrically estimated constant elasticity coefficient of a simple log-linear model with time per box as the dependent variable and boxes per mile as the explanatory variable is -27.45 percent with a t value of -266.22.
10

Figure 1
Relationship Between Density and Rural Carrier Time per Box
1.80
Minutes 1.80 t \ per Box ~ (Daily) 1.40 - 1
0.60
0 5 10 15
4. "Profitability" of Serving
This section addresses the
20 25
Boxes per Mile
30 35 40 45
Rural Area@
question: Does the United States Postal Service find it remunerative to serve rural areas? A revenue/cost model of rural delivery has been constructed to determine the profitability'"," of rural delivery by guintile. Its simple structure is presented below:
I2 "Profit" here means contribution to fixed overhead costs over and above paying the fixed overhead of rural delivery.
*' The model presented here is valid only for an unsubsidized postal system such as the Postal Service.
I4 The simplifying assumption is made that there is no cost difference between city and rural mail with respect to mail processing, transportation, and retail service.
11
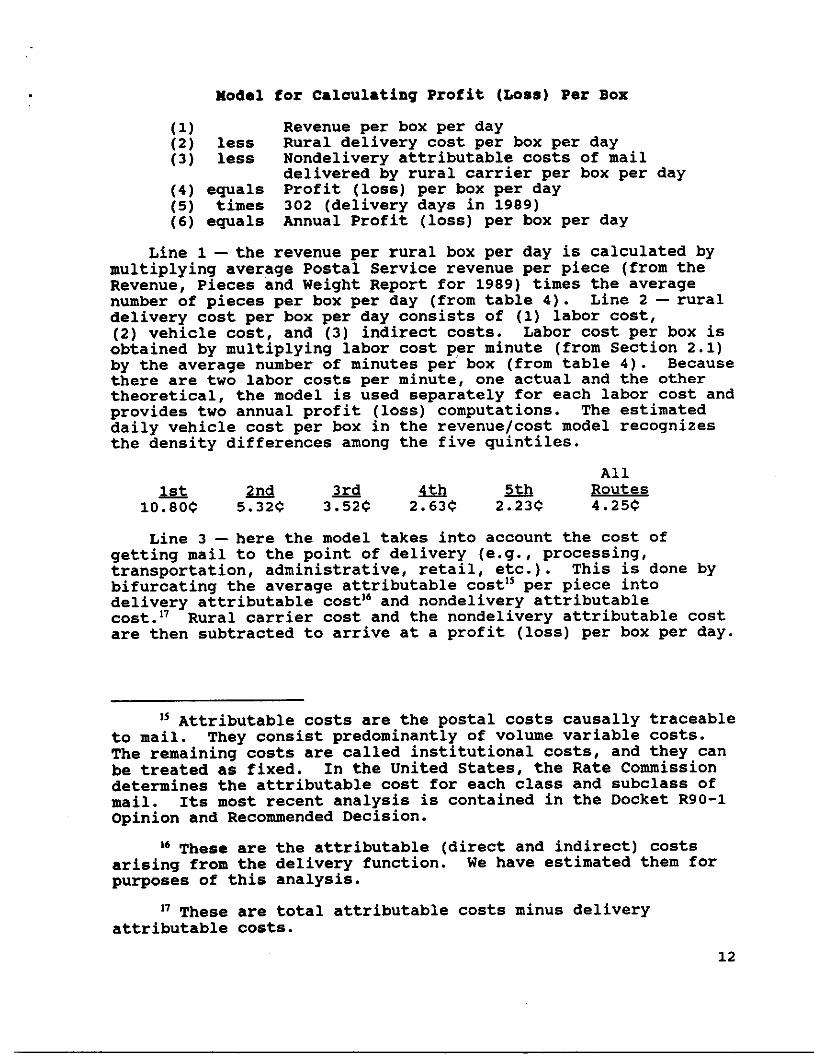
Model for Calculating Profit (Loss) Per Box
(1) Revenue per box per day (2) less Rural delivery cost per box per day (3) less Nondelivery attributable costs of mail
delivered by rural carrier per box per day (4) equals Profit (loss) per box per day (5) times 302 (delivery days in 1989) (6) equals Annual Profit (loss) per box per day
Line l-the revenue per rural box per day is calculated by multiplying average Postal Service revenue per piece (from the Revenue, Pieces and Weight Report for 1989) times the average number of pieces per box per day (from table 4). Line 2 - rural delivery cost per box per day consists of (1) labor cost, (2) vehicle cost, and (3) indirect costs. Labor cost per box is ,obtained by multiplying labor cost per minute (from Section 2.1) by the average number of minutes per box (from table 4). Because there are two labor costs per minute, one actual and the other theoretical, the model is used separately for each labor cost and provides two annual profit (loss) computations. The estimated daily vehicle cost per box in the revenue/cost model recognizes the density differences among the five quintiles.
All Ist 2nd 3rd ah
10.8OC 5.32C 3.52C 2.63$
Line 3 - here the model takes into account the cost of getting mail to the point of delivery (e.g., processing, transportation, administrative, retail, etc.). This is done by bifurcating the average attributable cost'~ per piece into delivery attributable cost" and nondelivery attributable cost.n Rural carrier cost and the nondelivery attributable cost are then subtracted to arrive at a profit (loss) per box per day.
" Attributable costs are the postal costs causally traceable to mail. They consist predominantly of volume variable costs. The remaining costs are called institutional costs, and they can be treated as fixed. In the United States, the Rate Commission determines the attributable cost for each class and subclass of mail. Its most recent analysis is contained in the Docket R90-1 Opinion and Recommended Decision.
I6 These are the attributable (direct and indirect) costs arising from the delivery function. We have estimated them for purposes of this analysis.
I7 These are total attributable costs minus delivery attributable costs.
12

Observers familiar with Postal Rate Commission costing procedures will recognize that rural delivery cost per box includes the attributable and institutional costs associated with that function. The Commission found in the most recent omnibus rate case (Docket R90-l), that 39 percent of rural delivery costs are attributable (i.e., vary with volume) and 61 percent are institutional (i.e., nonvariable)." Because such a large percentage of the costs are fixed, the profitability calculation is sensitive to both the average revenue per piece and the average pieces per box. If the postal system operated at a lower scale, revenue per piece would need to be higher to maintain the same revenue cost balance. It is not clear, without further analysis, what would happen to profitability if the system operated at a lower scale.19
The average revenue per piece for the entire Postal Service is used to estimate the average revenue per box. We have no independent estimate of the average revenue for mail delivered by rural carriers. If mail delivered by rural carriers has a different composition compared to the system as a whole, profitability conclusions would vary. In that case, the nondelivery attributable costs would vary in the same direction as revenue, but not by enough to offset the revenue change.
Table 5 provides both the input and output for the profitability calculations for all rural routes in 1989. It can be seen that by serving all rural routes and using actual labor costs, the Postal Service realized an average profit of 10.8 cents per box per day, or a total annual profit for all rural routes of $669 million. To put this figure in perspective, the total accrued expenditures for the Postal Service in 1989 were $39 billion.20
Table 5 shows that, using theoretical labor cost, the profit drops to $283 million. The profit from serving all rural routes is obviously highly sensitive to the labor cost of rural carriers. However, using either labor cost figure, rural delivery was profitable for the Postal Service. If, in 1989, the Postal Service's overall surplus had been much larger, the profit from rural delivery would no doubt have been greater. Conversely, if the year had been one in which the Service had a sizeable deficit, rural delivery would have been less profitable. Fortunately for purposes of this analysis, the Service essentially broke even in
" In Docket R90-1, the variability or elasticity of evaluated rural route costs with respect to volume was estimated at 44 percent by the Postal Service.
I9 It does seem clear that the ratio of mail delivered to rural boxes to mail delivered to city addresses is an important factor in determining profitability.
x The Postal Service surplus for 1989 was under $100 million.
13

Table 5
Profit (or Loss) from All Rural Routes
(1989)
P erg (cents)
Revenue 23.77 Attributable 16.09 Institutional 7.68
Delivery attributable 4.82 Nondelivery attributable 11.27
pu a r
Average pieces/box/day Average minutes/box/day Vehicle cost/box/day (cents) Average number boxes/route Total number of routes
4.30 1.07 4.25
442.79 46,197
CostlRinute Data
Annual labor cost $38,093 $43,250 Annual work hours 1,849 1,795 Hourly cost $20.60 $24.09 Cost/minute (cents) 34.3 40.2
Profitabilitv Calculation (cents)
Revenue/box/day Cost/box/day:
Labor Vehicle Overhead
Total
102.310 102.310
36.802 43.041 4.245 4.245
1.930 1.930 42.977 49.216
Nondelivery attributable cost/box/day 40.506 48.506 Total cost/box/day 91.483 97.772 Profit/box/day 10.827 4.588 Total annual profit (millions) $668.857 $283.423
Actual Theoretical Labor Costs Labor Costs
14

1989 and so the profit from rural delivery need not be interpreted based on the Postal Service's overall financial results.
Table 6 displays the profitability of all five guintiles of rural routes (based on population density) using both actual labor cost and theoretical labor cost. It can be seen that the profit per box differs substantially from the first (or least densely populated) quintile of rural routes to the fifth (or most densely populated) guintile. Using actual labor cost only, the first guintile was unprofitable, while, using theoretical labor cost, the first two quintiles were unprofitable.
Because the most densely populated quintiles of routes serve more boxes, their total profit is disproportionate to their per- box profit. Using either labor cost, the third, fourth, and fifth guintiles were profitable.
Given the assumptions discussed above, rural delivery is remunerative and it is unlikely that it would be abandoned if the universal service requirement were eliminated. Some observers, however, might expect the Postal Service to either drop or reduce the level of service to the boxes in the first or second quintiles of rural routes. The first guintile comprises only 2.5 percent of all addresses served by rural and city carriers combined. The second serves 3.9 percent.
Quintile Pieces Per Box
Minutes Per Box Actual Labor Cost
Per llQQLL (mil)
All 4.30 1.07 lO.SC $669 1 4.04 1.56 (15.8) (121)
2 3.79 1.14 0.9 10 3 4.19 1.06 10.6 137 4 4.67 0.98 20.4 281 5 4.59 0.87 23.3 361
Table 6
Profit (Loss) from Rural Delivery by Quintile for Actual Labor Cost
and Theoretical Labor Cost (1989)
Theoretical Labor Cost per Box
ysf
4.6C $283 (24.9) (191)
(5.8) (68) 4.4 57
14.5 200 18.2 282
15

5. Borne Differences Between the United States and Europe Which Would Affect e Similar Comparison
Population density is much lower in the United States than in Europe. For example, the United States has 69 persons per square mile and Germany has 577 persons per square mile - a difference more than a factor of eight. Not only are rural areas much more sparsely populated in the United States, so are the urban areas with their large expanses of suburbs. Urban areas are also less densely populated in the United States than in Europe owing to the larger proportion of the population living in single family dwellings both within the cities and in the suburbs.
We have seen the effect of population density on the cost of rural delivery. As density increases, cost of delivery decreases. It is doubtful that much of rural Germany resembles the areas served by the first quintile of rural routes in the United States (i.e., have fewer than 3 deliveries per mile). In the United States, 12.4 percent of rural households (2.5 percent of all households) live in such sparsely settled areas. They are served by about 9,200 rural carriers. Thus, because of higher population density, it can be concluded that .ceteris DaribUS, rural delivery is cheaper in Germany than in the United States.
Twenty (20) percent of urban deliveries in the United States are made by carriers in vehicles delivering to curbside boxes. It was shown that curbside delivery is the least costly or most efficient form of city delivery in the United States. In fact, if curbside delivery in urban areas were converted to park and loop or foot delivery, rural delivery would be cheaper than urban delivery. In the United States urban areas, the behavior of delivery cost with respect to population density is opposite that of rural areas. In urban areas, delivery is less costly in less densely populated areas, and more costly in more densely populated areas. It may also be true in Germany. Consequently, we believe that considering population density alone, the cost difference between rural and urban delivery in Germany should be less than in the United States.
Finally, we have two other observations about differences which may impact the applicability of United States findings on Europe. We understand that in most European countries, delivery is to the door in both urban and rural areas. This is unlike the situation in the United States, where all rural delivery and much urban delivery is to a roadside box. In addition, we have noted that rural carriers in the United States spend 3 percent of their time providing retail service to patrons along their route.
16

6. Window Service
In 1989, the United States Postal Service provided window service in 40,031 locations. Slightly less than 16,000 were in urban areas" and slightly more than 24,000 were in rural areas. 22 Table 7 presents several statistics comparing urban and rural window services.=
Because most businesses are in urban locations, they use a greater percentage of urban window service than rural window service. This fact distorts the cost per person per annum. Nevertheless, it costs about one and a half times as much to service a rural resident as an urban resident. Since total window service cost represents five percent of total United States postal expenditures, this imbalance is not insignificant. If the Postal Service spent only as much for window service per rural resident as it does per urban resident, it would save $261 million per annum or about 7 tenths of 1 percent of total expenditures.U
" These include 6,600 post offices, 4,958 classified stations and branches, and 4,297 contract stations and branches. Stations of a post office are satellite facilities providing window service inside the city limits. Branches of a post office are satellite facilities providing window service outside the city limits.
r These include 22,483 post offices and 1,693 community post offices. The latter are located in rural communities and are operated by a contractor who provides window services usually as an adjunct to his or her primary business.
2, It should be recalled that carriers serving the 46,197 rural routes spend about three percent of their time providing retail services. Thus, the table slightly underrepresents the total resources devoted to rural retail services.
ac Looked at another way, if the Postal Service spent only as much for window service per rural box as it does per urban possible delivery, it would save $367 million or about nine- tenths of one percent of total expenditures.
17

Table 7
Selected Statistics for City and Rural Window Services
(1989)
Number of Post Offices 6,600 Number of Locations with
Window Services 15,855 Average Number of
Persons per Location 11,738 Average Number of Possible
Deliveries per Location 4,926 Personnel Costs per Annum (billions) $1.561 Cost per Person per Annum $ 8.39 Annual Cost per Possible Delivery $19.98 Annual Cost per Box Daily Cost per Possible Delivery Daily Cost per BOX
6.6C
24,176
24,176
2,537
846 $ .776 $12.64
$37.92
12.6C
As recently as 1900, the United States had 76,000 post offices reflecting the fact that the country had an agrarian economy and rural free delivery had yet to be established. Over the century, the rural population migrated to the cities and this combined with rural free delivery diminished the need for rural post offices. Their number would have shrunk even more had not Congress passed legislation making it somewhat onerous for the Postal Service to close small rural offices. In fact, the USPS is specifically forbidden from closing offices for economic reasons alone. The Postal Service has adopted a policy of closing (or converting to contract status) small post offices only in communities whose postmaster retires or dies. About 400 have been closed in the years 1988 through 1991.
The General Accounting Office (GAO), which conducts studies for the Congress, concluded that the Postal Service could save large sums by shutting or converting 7,000 small post offices to
18

community post offices.= A survey conducted of patrons affected by conversion are overwhelmingly satisfied with the service they receive by their new community post offices. Data filed with the Rate Commission involving post offices being converted to community post offices indicate an average savings of about 63 percent in personnel costs. Thus, if the Postal Service were allowed by the Congress to simply convert 7,000 small rural post offices staffed by a postmaster to community post offices staffed by a contractor, the Postal Service could save $139 million per annum. This would reduce the (earlier cited) incremental $261 million spent to provide rural window service to $122 million or to about three-tenths of one percent of total postal costs. Even greater economies could be obtained if retail services were turned over to rural carriers on a widespread basis. Political forces, however, prevent the Postal Service from further rationalizing rural window costs.
From a business perspective, the analysis should include the cost per transaction, or the cost per dollar of sales. We do not have these figures available, but we believe that if they were available they would show rural window service to be more costly. This is because the waiting time between transactions is thought to be much higher for rural offices.
7. Concluding Remarks Concerning The Universal Service Requirement
7.1. Delivery
While the boxes served by the quintile of routes serving the least densely populated areas are unprofitable, we believe that it is unlikely that the Postal Service would discontinue service to them (or try to decrease their level of service) if the universal service requirement were eliminated.
- The total loss on those boxes is small relative to total costs of the Postal Service.
- Because these routes are scattered all over the country, boxes on these routes are not easily identifiable without consulting an extensive list. Consequently, it would be costly for firms to separate mail addressed to these boxes from their remaining mail.
- The transaction costs involved in putting pieces addressed to boxes in the first quintile of rural routes in the hands of another delivery firm, which would serve these addresses, would also be high.
z Revlacina Post Offices w But Unrw
Alternate Services: A Debated ved , General Accounting Office, 1982.
19

. - If these addresses were dropped from the delivery network, it would likely reduce the volume of mail sent by these addresses to the remaining portions of the delivery network. Thus, profitable volume would be lost.
Perhaps the above four points are simply underlying reasons for the truism that for common carriers serving the general population, larger service networks (be they mail, package, overnight, or telephone) are more valuable to customers and providers than smaller service networks. It is no accident that, within the United States, United Parcel Service provides ubiquitous service for parcels.= Federal Express and other overnight carriers do the same for overnight delivery. the major long distance telephone carriers also provide
Moreover,
ubiquitous service. Quite possibly, all of these common carriers find that sparsely settled portions of the country are unprofitable to serve. That these organizations provide universal service suggests that rural areas would receive postal service even absent a universal service requirement.
7.2. Retail Service
If the universal service requirement were eliminated, the absence of political pressure would allow the closing of many small post offices outright, and the conversion of many more to contract offices. In all probability, a significant amount of urban window service would also be converted to contract status because that is a cheaper way to do business. The average distance rural postal patrons would need to travel to a post office would increase to a point. But the Postal Service could not let it increase so much as to effectively exclude portions of the population. The ability of rural residents to send mail is a major reason for their being recipients of mail. Rural residents are recipients of mail from many large mailers and so the Postal Service would be motivated to provide adequate rural retail servioes. Again, we note that larger service networks are more valuable to customers and providers than smaller networks.
z6 UPS does not provide parcel service at the ordinary rate to the Alaska bush where there are no roads and service must be provided by air.
20