a cost-benefit analysis of small scale red haricot beans production in ...
33
A COST-BENEFIT ANALYSIS OF SMALL SCALE RED HARICOT BEANS PRODUCTION IN ETHIOPIA: INTERCROPPING AS A RISK DIVERSIFICATION MECHANISM Mikhail Miklyaev Eastern Mediterranean University, Mersin 10, Turkey Cambridge Resources International Inc. Glenn P. Jenkins, Queen’s University, Kingston, Canada Eastern Mediterranean University, Mersin 10, Turkey Katarzyna Pankowska University of British Columbia, Vancouver, Canada Development Discussion Paper: 2013-14 Abstract The main objective of the study is to estimate an annual income increase of land constrained Ethiopian households, now growing maize, from either shift to the mono-cropping of red haricot beans or to the intercropping the beans with maize. The study revealed that mono-cropping of red haricot beans is more profitable for the households compared to either maize production or intercropping. The households, however, are reluctant to shift to the mono-cropping practice of red haricot beans production. This can be explained by the level of risk faced by the households in case of crop failure. The Ethiopian households with the limited land holding are generally reluctant to mono-cropping of any commodity. The economic net benefits of the red haricot beans production arising to the different stakeholders, including the government of Ethiopia, were also estimated. A sensitivity analysis was used to determine the main risk factors of the activity. Acknowledgements This study was financed by USAID’s ―Learning, Evaluation, and Analysis Project (LEAP). The report was prepared by Cambridge Resources International Inc., under the subcontract to Optimal Solutions Group. Contract Number: AID-OAA-C-11-00169. Special thanks for comments and suggestions received from Mark Carrato, Cullen Hudges, Christabel Dadzie, and Richard Barichello during the completion of this study. The assistance received from many people during its field visits to Tigray and Amhara, Ethiopia in July 2012, including the representatives of USAID, CARE and SNV is highly appreciated. Key words: cost-benefit analysis, investment appraisal, stakeholder analysis, pulses, red haricot beans, value chain, intercropping, mono-cropping, pro-poor interventions, chronic food insecurity, poverty reduction, Ethiopia. JEL: D13, D31, D61, D62
-
Upload
hoangkhanh -
Category
Documents
-
view
227 -
download
3
Transcript of a cost-benefit analysis of small scale red haricot beans production in ...

A COST-BENEFIT ANALYSIS OF SMALL SCALE RED HARICOT
BEANS PRODUCTION IN ETHIOPIA: INTERCROPPING AS A RISK
DIVERSIFICATION MECHANISM
Mikhail Miklyaev
Eastern Mediterranean University, Mersin 10, Turkey
Cambridge Resources International Inc.
Glenn P. Jenkins,
Queen’s University, Kingston, Canada
Eastern Mediterranean University, Mersin 10, Turkey
Katarzyna Pankowska
University of British Columbia, Vancouver, Canada
Development Discussion Paper: 2013-14
Abstract
The main objective of the study is to estimate an annual income increase of land constrained Ethiopian
households, now growing maize, from either shift to the mono-cropping of red haricot beans or to the
intercropping the beans with maize. The study revealed that mono-cropping of red haricot beans is more
profitable for the households compared to either maize production or intercropping. The households,
however, are reluctant to shift to the mono-cropping practice of red haricot beans production. This can be
explained by the level of risk faced by the households in case of crop failure. The Ethiopian households
with the limited land holding are generally reluctant to mono-cropping of any commodity. The economic
net benefits of the red haricot beans production arising to the different stakeholders, including the
government of Ethiopia, were also estimated. A sensitivity analysis was used to determine the main risk
factors of the activity.
Acknowledgements
This study was financed by USAID’s ―Learning, Evaluation, and Analysis Project (LEAP). The report
was prepared by Cambridge Resources International Inc., under the subcontract to Optimal Solutions
Group. Contract Number: AID-OAA-C-11-00169. Special thanks for comments and suggestions received
from Mark Carrato, Cullen Hudges, Christabel Dadzie, and Richard Barichello during the completion of
this study. The assistance received from many people during its field visits to Tigray and Amhara,
Ethiopia in July 2012, including the representatives of USAID, CARE and SNV is highly appreciated.
Key words: cost-benefit analysis, investment appraisal, stakeholder analysis, pulses, red haricot beans, value chain,
intercropping, mono-cropping, pro-poor interventions, chronic food insecurity, poverty reduction, Ethiopia.
JEL: D13, D31, D61, D62

2
ACRONYMS
ADSCR Annual Debt Service Coverage Ratio
AGP Agriculture Growth Program
CARE Nongovernmental Organization, Implementing
Organization
CF Conversion Factor
CRS Catholic Relief Services
CSA Central Statistical Agency of Ethiopia
ENPV Economic Net Present Value
EOCK Economic Opportunity Cost of Capital
ETB Ethiopian Birr (Currency)
FAO United Nations Food and Agriculture Organization
FEP Foreign Exchange Premium
GRAD Graduation with Resilience to Achieve Sustainable
Development
FNVP Financial Net Present Value
FtF Feed the Future (Program)
IFPRI International Food Policy Research Institute
Ha Hectare
Kg Kilogram
MFI Microfinance Institution
NCF Net Cash Flows
NGO Nongovernmental Organization
NPV Net Present Value
ORDA Organization for Rehabilitation and Development in
Amhara
REST Relief Society of Tigray
RUSACCO Rural Saving and Credit Cooperatives
SNV Netherlands Development Agency
SNNPR Southern Nations, Nationalities, and Peoples Region
US$ United States Dollar
USAID United States Agency for International Development

3
EXECUTIVE SUMMARY
Project Description: The Graduation with Resilience to Achieve Sustainable Development (GRAD)
project proposed by the United States Agency for International Development (USAID) started in 2012
and implemented in 16 woredas around Ethiopia. The project has 5 years lifetime. The selected woredas
are located in Amhara, Oromia, Southern Nations, Nationalities, and Peoples Region (SNPPR), and
Tigray. The GRAD project aims to graduate 50,000 chronically food insecure households out of 65,000
that are targeted. Each of the selected households will need to achieve an increase in its yearly income of
US$365.00 to successfully graduate from the program. Four commodity value chains have been chosen
for this project’s interventions: honey, pulses, meat, and vegetables.
The implementers of the project include CARE, the Relief Society of Tigray (REST), the Organization
for Rehabilitation and Development in Amhara (ORDA), Catholic Relief Services (CRS), the Netherlands
Development Agency (SNV), and Tufts University. These well-known organizations are engaged in food-
security and value chain–development projects in Ethiopia and other developing countries throughout the
world.
To facilitate the proper implementation of the project and flow of necessary financial resources for the
targeted households, USAID Ethiopia established a US$2-million loan – guarantee fund that will be
available to the microfinance institutions (MFI) and rural saving and credit cooperatives (RUSACCO)
that will be in charge of providing loans to the participating chronically food-insecure households. Such
financial assurance will diminish the risk associated with micro lending and will help facilitate the flow of
funds.
Strategic Context and Rationale: The USAID Ethiopia GRAD project is part of the wider strategy of
Feed the Future (FtF), which supports investments in viable and potentially easy to engage in and profit
from agricultural value chains. The GRAD project also hopes to promote gender equality and the
inclusion of women to the selected interventions.
The intervention in red haricot beans value chain, designed to provide loan to the GRAD households
sufficient for the purchase of improved seeds and fertilizers. The suggested intervention will be
introduced first in Loka Abaya woreda in the SNNPR region.
Financial and Economic Analysis Results: The intervention in the red haricot beans value chain is
constructed around the provision of loans that are adequate for the purchase of improved seeds and
fertilizer. The loans will be offered at a preferential (subsidized) interest rate of 15 percent. The loan
structure will allow households to make repayments after the harvest period. In case of unforeseen
circumstances households might be given some flexibility to faze loan repayments over a longer period of
time. The main group of GRAD households have small landholdings of approximately one quarter of a
hectare. The amount of investment required to purchase inputs for red haricot beans cultivation is
estimated to be ETB688.75 (US$39.36). The corresponding loan amount is equal to ETB786.40
(US$44.94).1
Ethiopian farmers cultivate haricot beans by intercropping it with maize, wheat, barley and other cereals.
The priority is usually given to the cereals, meaning that most of the land is allocated for the maize.
Households sometimes face difficulties selling haricot beans due to the limited demand in the local
markets for the product. In Ethiopia haricot beans are perceived as a food for poor.
1 Loan amount includes a service charge, an insurance, a pass book fee and an up-front saving of 10 percent.

4
The analysis is carried out over eleven years’ period. Intervention in red haricot beans yields a positive
financial net present for both intercropping and mono cropping cultivation system. The FNPV in case of
the mono cropping scenario is equal to $US 397.84 using 12 percent real financial discount rate. The
intercropping with maize scenario yields FNPV of US$12.03 also at 12 percent real discount rate.
The mono cropping scenario, although it has much higher financial returns, is very unlikely to be adopted
by the households with land holding limited to 0.25 hectare, because of the very high risks in the case of
crop failure. The financial returns on the intercropping scenario, however, are related to the corresponding
yields of both commodities. The FNPV value of 13.98 US$ is calculated under the assumption that yield
decrease of red haricot due to intercropping will be equal to 67 percent of what can be attain when the
beans are mono cropped. Such big yield decrease presents when farmers focus their effort on maize
cultivation, giving second priority to the red haricot beans. The corresponding maize yield decrease is 24
percent under the system. Having adequate level of knowledge may actually allow farmers to reduce
yields decrease to only 5 or 10 percent. For instance if farmers will manage to attain yield reduction of
maize equal to only 5 percent with intercropping, FNPV will increase to US$173.00.
The economic net present value is also positive in the both cases. It is equal to US$ 435.38 in the mono
cropping scenario and to US$29.51 in case of intercropping red haricot beans with maize. The difference
between financial and economic outcomes of the project due to the fact that the financial values don’t
include all externalities presented in the project.
Beneficiary Analysis Results: Based on this analysis, it is expected that the GRAD project will increase
the yearly income of targeted households. The net increase in income over the eleven years period is
estimated to be US$397.84 in case of mono cropping and US$12.03 in case of the intercropping with
maize. The net annual increase in the income of the households is estimated to be US$9.59 for the
intercropping scenario and US$70.14 for the mono cropping scenario. The other beneficiary of the project
is government:
Government will benefit directly from the taxes collected on the inputs and outputs of the
intervention. The indirect benefits to the government will arise because red haricot beans are
exported from Ethiopia, which allows country to earn foreign exchange premium. The present
value of the amount that government benefits from the intervention over the eleven years period
is estimated to be US$14.43 for intercropping and US$34.04 for mono cropping.
Conclusions and Recommendations: The projected FNPVs and ENPVs show that both proposed
interventions in the red haricot beans value chain (mono cropping and intercropping with maize) will
yield positive results and will benefit targeted households and the economy as a whole. Even though the
mono cropping intervention shows higher potential financial and economic NPVs, intercropping red
haricot beans with maize is also likely to be successful and might be preferred by the participating
households, because it would decrease the risks associated with crop failure. Neither of the proposed
interventions (mono cropping or intercropping) will be able to achieve the target increase in income of
US$365.00 /per year/per household. Therefore, it is recommended that the intervention in the red haricot
beans value chain be ―packaged‖ together with an intervention from another commodity value chain
proposed by the GRAD project.

5
THE RED HARICOT BEANS GRAD VALUES CHAIN: COST-BENEFIT
ANALYSIS
METHODOLOGY
Project Background
The United States Agency for International Development (USAID)/Ethiopia started implementation of
the Graduation With Resilience to Achieve Sustainable Development (GRAD) project in Ethiopia in 2012.
The project is a part of USAID’s Feed the Future (FtF) agenda and aims to support improvements in the
value chains of several commodities (honey, pulses, meat, and vegetables) to increase the food security2
of the targeted Ethiopian households. The GRAD project will include a special emphasis on strengthening
the livelihoods of chronically food-insecure households in Highlands Areas, improving household and
community resilience, and strengthening an enabling environment to promote scale-up and sustainability.
The project has a 5-year lifespan. During this period the GRAD project will target 65,000 food-insecure
Ethiopian households that can be categorized as either chronically food insecure (58,500 households) or
―Ultra Poor‖3 (6,500 households). Of the participating 65,000 households, the GRAD project intends to
graduate 50,000 households from chronic food insecurity by increasing their yearly income by
US$365/year/household. The GRAD project also plans to include another group of 10,000 Ethiopian
households that are either food-sufficient households (6,000) or food-secure households (4,000). These
households will act as role models for the chronically food-insecure and ―Ultra Poor‖ groups that are the
project’s main target.
Sixteen woredas located in four regions of Ethiopia—SNNPR, Tigray, Amhara, and Oromia4—will be
included in the GRAD project. The project’s woredas were selected on the basis of this proximity to the
AGP (Agriculture Growth Program) and the presence of active local markets that bring opportunities for
engagement in commodity trading. This geographical selection criterion is supposed to guarantee that the
households have the potential to market the commodities that they produce, if the intervention goes as
planned. The GRAD project also intends to facilitate market linkages in order to connect these households
with commodity traders at the local level. This in turn will facilitate the sale of commodities and foster
income inflows to the households. The GRAD project is also expected to correct shortcomings
experienced in the PSNP Plus project in order to allow each targeted household to increase its yearly
income by US$ 365 (or 1 USD per day).
2 ―Food security‖ is defined as access to sufficient food by all members of the household for an active and healthy
lifestyle in a normal or moderately bad year (per GRAD Technical Proposal). 3 Ultra Poor households include female-headed households and landless youth.
4 A full list of the GRAD-selected woredas can be found in table A in the appendix. Please note that according to the
table, in Tigray an intervention is planned for fava beans. CARE has decided to postpone this intervention due to the
problems the organization encountered during its baseline survey. During the conversation that the LEAP team had
with the vice chief of party on August 18, 2012, it was confirmed that the fava beans intervention at this point has
been terminated, so the LEAP team has not performed a CBA of this commodity.

6
The implementer of this project, CARE will cooperate with technical partners in order to assure the
project’s proper implementation. These cooperating partners are REST (Relief Society of Tigray), ORDA
(Organization for Rehabilitation and Development in Amhara), CRS (Catholic Relief Services) and SNV
(Netherlands Development Agency) and Tufts University. All these organizations are well known NGOs
that are engaged in various projects in Ethiopia related to food security improvement and commodity
value chains development.
USAID will establish a loan guaranteed fund of US$2 million to ensure that the microfinance institutions
(MFIs) and rural saving and credit cooperatives (RUSACCOs) will have sufficient access to lending
capital to develop a flexible lending scheme for the GRAD households. This fund will also help to reduce
the risks of these institutions associated with loan defaults of the targeted households.
The GRAD project plans to emphasize non-gender-biased participation and inclusion of women in the
proposed interventions for the commodities value chains. Ethiopian women are typically disadvantaged in
terms of access to agricultural inputs, so the GRAD project plans to correct these issues whenever
possible.
The four commodity value chains selected for the GRAD project have been chosen because of their
simplicity in terms of the knowledge required for their implementation and the rather low initial start-up
costs necessary to engage in their production. These commodities also offer the potential for future, post –
GRAD production increases and marketing. Demand for these commodities is growing in both, domestic
and export markets; creating, the possibility for increases in commodities sales and income generation for
the households participating in the GRAD project.
Commodity Background
Pulses Production in Ethiopia
The agricultural production in Ethiopia is highly dependent on rain. The production of pulses is not an
exception due to the low availability of irrigation.5 The quantity of pulses produced is to a large extent
based on the small-scale farmers who grow relatively small quantities of commodities and sell them to
local traders.
In Ethiopia, twelve varieties of pulses are cultivated, which are divided into ―highland pulses‖ (chickpea,
fava bean, field pea, grass pea, lentil, lupine, and fenugreek) and ―low land pulses‖ (haricot bean, soya
bean, cowpea, pigeon pea, and mung pea). The biggest share of Ethiopia’s pulses production is taken by
fava (36 percent) and haricot beans (17 percent) (IFPRI 2010).
The total planted area of pulses in Ethiopia in 2011–12 (in the long rainy season, Meher6) was
1,616,809.37 hectares (Ha), or 13.38 percent of the total cropped area in Ethiopia, with total production
yields of 2,316,201.24 metric tons (MT). Of this total, 331,709.15 Ha were planted with haricot beans.
5 Even if irrigation is available in the areas where pulses are cultivated, farmers usually do not use it for production
purposes. 6 Ethiopia has two rainy seasons: Belg, short rainy season (March–April/May) and Meher, long rainy season (June–
August). Farmers in general concentrate their planting and cropping during the rainy seasons, because rains are more
reliable during that time.

7
The total production of haricot beans was 387,802.311 MT, with an average yield of 1.17 MT/Ha (CSA
2012).
Amhara, Oromia, and SNNPR are the three regions that produce the majority of haricot beans.
Red haricot beans are usually grown on a rotation basis or intercropped with cereals, such as maize,
wheat, or sorghum (especially in the short rainy season, Belg). Chronically food-insecure households that
possess 0.25 Ha (or less) of land especially favor the intercropping intervention. It mitigates the risk
associated with a crop failure and usually enables a household to harvest at least a part of the crop even
when a drought or flooding occurs. Such intercropping of cereals and beans does improve the soil’s
fertility and decreases the amount of fertilizer necessary for crop production.7
Current Market Situation in the Ethiopian Red Haricot Beans Sector
The overwhelming majority of red haricot beans produced in Ethiopia is marketed and consumed
domestically. Ethiopians value red haricot beans because of their high nutritional value (―meat for poor‖)
and cultural suitability.8 Domestic producers’ prices for red haricot beans vary within the year according
to the harvesting patterns, with lower prices around the harvesting season and much higher prices in the
off-harvest season. SNNPR producer prices for red haricot beans in 2010–11 are presented in table 1,
below:
Table 1. SNNPR producer prices for red haricot beans in 2010–11 (in ETB/kg)
SNNPR Harvest season Off-harvest
season
Red haricot beans 4.50 7.20
*Source: SNV Value Chain Analysis Draft Report, 2012.
Current Problems Observed in the Red Haricot Beans Sector in Ethiopia
Red haricot beans share nearly identical production problems, as white haricot beans do. Among many of
the problems associated with the unstable weather patterns—including droughts and floods that interact
with each other and directly influence the status quo in the Ethiopian red and white haricot beans sector—
a couple non-climate-related barriers withhold this sector from achieving its potential. The most important
issues include the following:
1. Rather low productivity/Ha of land
The average productivity rate for haricot beans is 1.17 MT/Ha (CSA 2012). At the same time, the
observed productivity of experimental plots goes up to 2.9–3.5 MT/Ha (IFPRI 2010).9 This
relatively low productivity rate in red haricot beans is closely related to
low use of chemical fertilizers (phosphates)10
;
7 Pulses are able to grow in the symbiosis with nitrogen-fixing bacteria (Rhizobium) and produce nitrogen, which
has qualities similar to the chemical fertilizer. 8 Ethiopians value beans, because they are a good source of protein. People use them to prepare vegetarian dishes
necessary during the numerous fasting periods associated with two most common religions in Ethiopia: Islam and
Orthodox Christians. 9 These maximum yields are for monocropping (without intercropping with cereals).
8
small plots for cultivation associated with population growth and land fragmentation;
limited access to improved seed varieties; and
poor land-management techniques (poor land preparation and suboptimal crop rotation)
and nutrient-depleted poor soils prone to waterlogging.
2. Low availability of improved seeds11
The varieties of red haricot beans that are most suitable for Ethiopia’s climate and soil and have
been most tested for productivity include Red Melka, Red Wolaita, Nasser, Ibbado, and Hawassa
Dume. These seeds do particularly well in the soil and climate of the SNNPR region in the Rift
Valley. They produce higher yields, and are more resistant to disease and drought. Nevertheless,
the seeds for these varieties are in short supply. Because the majority of farmers are not able to
obtain these seeds, they plant conventional ones that are lower yielding and less disease-resistant.
3. Problems with quality of improved seeds12
Even if improved seeds are available in some areas of Ethiopia, their quality tends to be inferior
due to frequent mixing of types of seeds (improved with unimproved ones, different varieties of
improved seeds mixed together, healthy seeds mixed with disease-infected seeds, and so forth)
and lack of proper labeling to indicate which variety farmers are purchasing.
4. Low access to fertilizers and pesticides
Small-scale farmers have limited access to fertilizers and pesticides due to their low availability at
the local level, lack of the knowledge regarding the type and quantity of fertilizer (pesticide)
needed for the production of red haricot beans, and the scarcity of financial resources.
5. Lack of training regarding proper cultivation of red haricot beans
Small-scale farmers use traditional methods of land preparation and are unaware of improved
methods that have the potential to positively influence their red haricot beans yields (e.g., optimal
quantity of plowing and weeding, proper seed-bed preparation, planting density, and so forth).
6. Problems with obtaining microloans for the purchase of seeds13
The microcredit institutions are reluctant to provide microcredits for seeds, because they see
farming as a risky business. Small-scale farmers have almost no access to such financial
resources; consequently, their access to inputs necessary to improve their crop yields is limited.
10
There is a widespread belief among farmers and even some of the local consultants that beans do not require any
fertilizers, so their application is unnecessary. This mistaken belief might result from the lack of training and
misconceptions about the types of fertilizers available. It is possible that farmers are not aware of the existence of
other fertilizer types (phosphates) besides DAP and UREA, which are widely used as fertilizers for cereals. 11
It must be emphasized that such improved seeds require a ―package approach.‖ Improved seeds alone are usually
not better than conventional ones if the land is not managed properly and if the levels of fertilizer are not applied at
the right time and in the right quantity. 12
It has been confirmed that there is an illegal trade in red haricot beans via Moyale that also negatively affects the
quantity and quality of beans produced by farmers in SNNPR (they buy mixed seeds of lower quality, which lowers
the incentives for farmers to increase the quality of their red haricot beans). 13
The sole availability of loans for the purchase of improved seeds will not benefit small-scale farmers if loan
repayments are not properly scheduled (according to harvesting seasons) to ensure their ability to repay the loans
and to decrease their risk of defaulting.
9
7. The inclusion of red haricot beans in the mandatory commodity exchange
The Ethiopian government included red haricot beans in the mandatory commodity exchange in
2010–11, which resulted in the break of direct business relationships between producers, traders,
and exporters.
8. Lack of current, reliable statistics for the beans sector
Statistical surveys are pursued infrequently, every 3 to 5 years. This data are usually collected by
the United Nations Food and Agriculture Organization (FAO). Some statistics could potentially
be important for commercial purposes, but usually they are not collected.
9. Inefficient marketing system, lack of market information regarding export-market
preferences for different varieties of beans, and poor storage systems
Farmers are often unaware of the preferences for certain varieties of beans in the export markets.
Without such information, they end up with excess quantities of less-desired crops that cannot be
exported. In addition, small-scale farmers usually do not have storage facilities that allow them to
safely store beans when needed, so they experience significant post – harvest losses.14
10. Cyclical changes in price patterns in the world market and changing export opportunities15
Like all other commodities traded internationally, pulses are influenced by commodity cycles,
and Ethiopian red haricot beans is no exception. Their prices are influenced by the commodity’s
demand and supply in the given year in the world market. Domestically, prices fall if there is a
bumper crop in the world, and the FOB and domestic price rise if there is a shortage elsewhere in
the world.
Project Description and Activities
In recognition of the potential that red haricot beans present in terms of increasing food security among
chronically food-insecure Ethiopian households, the GRAD project has included the red haricot beans
value chain in its agenda. The planned interventions in this value chain will take place in the Loka Abaya
woreda, in the SNNPR region.
GRAD Intervention in the Red Haricot Beans Value Chain
Under existent cultivation practices farmers usually intercrop haricot beans with maize, wheat, barley and
other cereals. This allows them to minimize the risks associated with a single crop failure. The priority is
given to the cultivation of cereals, and to maximize the yields of the cereals even if this decreases the
yield of haricot beans. The modeling exercise was done for the two existing practices of red haricot beans
cultivation:
14
Farmers report that the way they store beans is very traditional: They put them in ash in locally made clay
containers and cover the tops with manure to deter pests. 15
For instance, the price of red beans from 2009–10 showed a very high increasing trend that reached a range of
1,000–1,200 Birr/qt, but in 2012 prices decreased, ranging from 600–720 Birr/qt, following the blocking of illegal
trade via Moyale to Kenya (SNV 2012).

10
1. Intercropping of maize and red haricot beans
2. Mono cropping of red haricot beans
The GRAD intervention for the red haricot beans value chain is to provide access to financing needed to
purchase inputs for haricot beans cultivation, such as improved seeds and fertilizers. The financing will be
provided in the form of loan at an interest rate below the market rate.
Details of the investment expenditures necessary for the planned interventions (mono cropping and
intercropping with maize) in the red haricot beans value chain are presented in tables 2 and 3, below.
Table 2. Total investment expenditures for mono cropping in the red haricot beans value chain (in ETB)16
MONO CROPPING (ETB/0.25ha)
Input Intervention in red haricot beans
Improved
seeds
300.00
Fertilizer 388.75
Total 688.75
Table 3. Total investment expenditures for intercropping with maize in the red haricot beans value chain
(in ETB)
INTERCROPPING WITH MAIZE (ETB/0.25ha)
Input Intervention in red haricot beans
Improved
seeds
180.00
Fertilizer 388.75
Total 568.75
Assumptions for the Selected GRAD Interventions in the Red Haricot Beans Value Chain
1. Each GRAD-targeted household engaged in the red haricot beans value chain will receive a loan
necessary for the purchase of improved seeds and fertilizer. The size of the loan will vary
according to the type of intervention (mono cropping or intercropping with maize). The total
amount of loan includes a service charge of 1 percent of the total investment, an insurance fee of
1 percent, a pass book fee of ETB15.00 and an up-front saving of 10 percent. The up – front
saving will be returned to the household upon repayment of the loan, with no interest accrued.
The total amount of loan for mono cropping intervention is ETB786.40 and ETB652.00 for the
intercropping with maize intervention.
2. The loan necessary for purchasing the required inputs will be provided at the nominal interest rate
of 15 percent, which is far below the current market interest rate. The market interest rate is
estimated to be 48 – 50 percent in Ethiopia. This loan will have a repayment period of 6 months,
with a grace period of 5 months,17
and each household will make one loan payment/year (post-
harvest).
16
The investment expenditures presented in tables 2 and 3 do not include expenditures associated with obtaining the
loan (down payment, loan insurance, etc.). These additional loan-related expenditures are discussed in the
assumptions for the selected GRAD interventions section of this report. 17
This type of loan structure will allow farmers to borrow money before planting and then repay the loan after
harvesting.
11
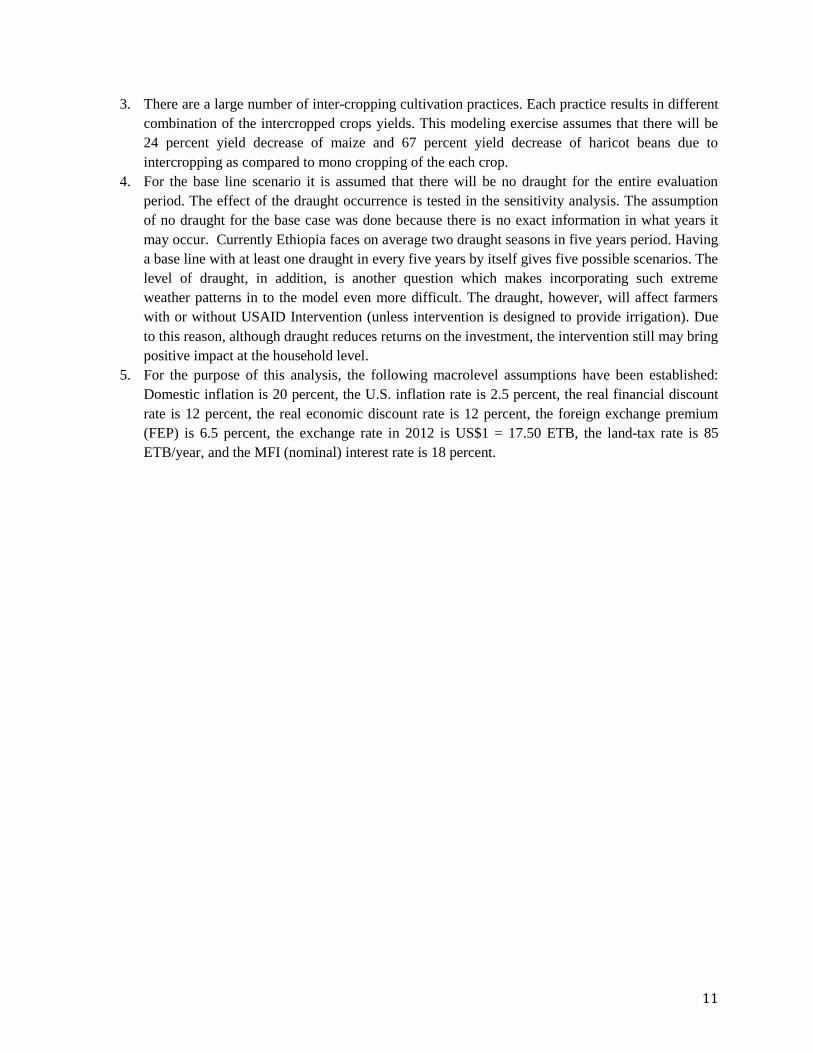
3. There are a large number of inter-cropping cultivation practices. Each practice results in different
combination of the intercropped crops yields. This modeling exercise assumes that there will be
24 percent yield decrease of maize and 67 percent yield decrease of haricot beans due to
intercropping as compared to mono cropping of the each crop.
4. For the base line scenario it is assumed that there will be no draught for the entire evaluation
period. The effect of the draught occurrence is tested in the sensitivity analysis. The assumption
of no draught for the base case was done because there is no exact information in what years it
may occur. Currently Ethiopia faces on average two draught seasons in five years period. Having
a base line with at least one draught in every five years by itself gives five possible scenarios. The
level of draught, in addition, is another question which makes incorporating such extreme
weather patterns in to the model even more difficult. The draught, however, will affect farmers
with or without USAID Intervention (unless intervention is designed to provide irrigation). Due
to this reason, although draught reduces returns on the investment, the intervention still may bring
positive impact at the household level.
5. For the purpose of this analysis, the following macrolevel assumptions have been established:
Domestic inflation is 20 percent, the U.S. inflation rate is 2.5 percent, the real financial discount
rate is 12 percent, the real economic discount rate is 12 percent, the foreign exchange premium
(FEP) is 6.5 percent, the exchange rate in 2012 is US$1 = 17.50 ETB, the land-tax rate is 85
ETB/year, and the MFI (nominal) interest rate is 18 percent.

12
Table 5. Parameters for analysis of mono cropping in the red haricot beans value chain18
Parameters Without intervention With intervention
(mono cropping)
Household size 5 people 5 people
Area under red haricot beans 0.25 Ha 0.25 Ha
Rental value of land 800.00 ETB/Ha/year 800.00 ETB/Ha/year
Land tax 85.00 ETB/year 85.00 ETB/year
Red haricot beans yield 700.00kg/Ha 1,600.00 kg/Ha
Red haricot beans price 5.00 ETB/kg 7.00 ETB/kg
Red haricot beans production
disposition
Loss 5% 5%
Consumption 20% 20%
Marketed 75% 75%
Input costs
Red haricot beans seeds 7.00 ETB/kg 12.00 ETB/kg
DAP 15.55 ETB/kg 15.55 ETB/kg
Input requirements per 0.25 Ha
Red haricot beans seeds 12.50 kg 25.00 kg
Fertilizer (DAP) 0 25.00 kg
Opportunity cost of family labor
(ETB/day)
Plowing 15.00 ETB 15.00 ETB
Planting 30.00 ETB 30.00 ETB
Fertilizer application 30.00 ETB 30.00 ETB
Weeding 15.00 ETB 15.00 ETB
Harvesting 15.00 ETB 15.00 ETB
Threshing 15.00 ETB 15.00 ETB
Packaging 15.00 ETB 15.00 ETB
Activities time allocation
(Person/Days/0.25 Ha)
Plowing 4 4
Planting 1 1
Fertilizer application 0 1
Weeding 8 8
Harvesting 5 10
Threshing 3 5
Packaging 1 2
Transporting 0.1 ETB/kg 0.1 ETB/kg
18 Parameters for red haricot beans used in the analysis were based on information from CSA (household size), field
interviews in July 2012 (land tax, area under haricot beans, rental value of land), and the SNZ and CARE 2012
report Red Beans Value Chain Analysis, Draft Report. Parameters presented in tables 5 and 6 are based on two
varieties of red beans: Hawassa Dume and Nasser.
13
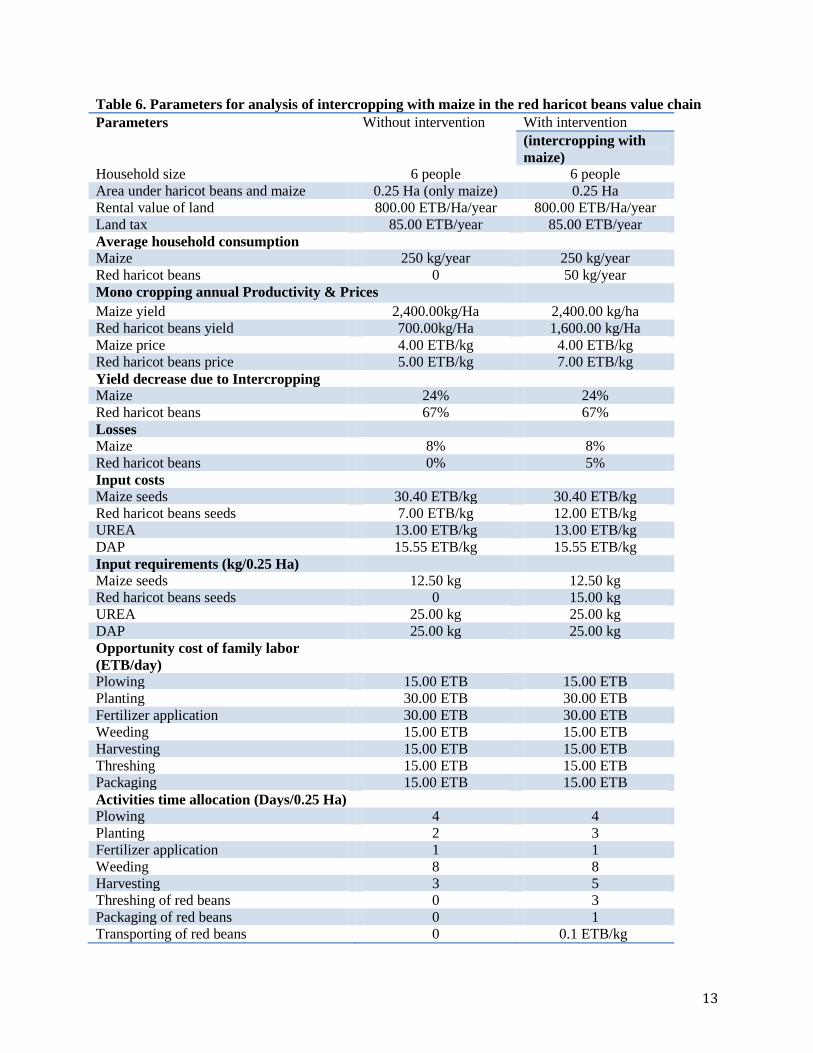
Table 6. Parameters for analysis of intercropping with maize in the red haricot beans value chain
Parameters Without intervention With intervention
(intercropping with
maize)
Household size 6 people 6 people
Area under haricot beans and maize 0.25 Ha (only maize) 0.25 Ha
Rental value of land 800.00 ETB/Ha/year 800.00 ETB/Ha/year
Land tax 85.00 ETB/year 85.00 ETB/year
Average household consumption
Maize 250 kg/year 250 kg/year
Red haricot beans 0 50 kg/year
Mono cropping annual Productivity & Prices
Maize yield 2,400.00kg/Ha 2,400.00 kg/ha
Red haricot beans yield 700.00kg/Ha 1,600.00 kg/Ha
Maize price 4.00 ETB/kg 4.00 ETB/kg
Red haricot beans price 5.00 ETB/kg 7.00 ETB/kg
Yield decrease due to Intercropping
Maize 24% 24%
Red haricot beans 67% 67%
Losses
Maize 8% 8%
Red haricot beans 0% 5%
Input costs
Maize seeds 30.40 ETB/kg 30.40 ETB/kg
Red haricot beans seeds 7.00 ETB/kg 12.00 ETB/kg
UREA 13.00 ETB/kg 13.00 ETB/kg
DAP 15.55 ETB/kg 15.55 ETB/kg
Input requirements (kg/0.25 Ha)
Maize seeds 12.50 kg 12.50 kg
Red haricot beans seeds 0 15.00 kg
UREA 25.00 kg 25.00 kg
DAP 25.00 kg 25.00 kg
Opportunity cost of family labor
(ETB/day)
Plowing 15.00 ETB 15.00 ETB
Planting 30.00 ETB 30.00 ETB
Fertilizer application 30.00 ETB 30.00 ETB
Weeding 15.00 ETB 15.00 ETB
Harvesting 15.00 ETB 15.00 ETB
Threshing 15.00 ETB 15.00 ETB
Packaging 15.00 ETB 15.00 ETB
Activities time allocation (Days/0.25 Ha)
Plowing 4 4
Planting 2 3
Fertilizer application 1 1
Weeding 8 8
Harvesting 3 5
Threshing of red beans 0 3
Packaging of red beans 0 1
Transporting of red beans 0 0.1 ETB/kg
14
PROJECT MODELING
The financial and economic feasibility of the GRAD red haricot beans intervention has been estimated
using a practical framework as outlined by Jenkins, Kuo, and Harberger in ―Cost Benefit Analysis for
Investment Decision‖. Following this methodology, all revenues or potential revenues have been treated
as cash inflows and all expenditures or potential expenditures as cash outflows. The analysis is carried out
for a period of eleven years.
To estimate the financial sustainability of the intervention in the red haricot beans value chain, the annual
debt service coverage ratio (ADSCR) of the project over the life of the loans used to finance it has been
calculated together with the financial net present value (FNPV) of the project.
The economy resource flow statements have been constructed by adjusting each of the line items in the
cash-flow statements of the total investment point of view by proper economic conversion factors (CFs).
These conversion factors have been derived by dividing the separately calculated economic value of a
unit of an item by its financial price.
INTERVENTION
The purpose of the project model is to estimate the net benefit of USAID intervention and to estimate the
net impact of this intervention on the income of the family. There is a need to first understand the
revenues and expenditures of the existent cultivation practices adopted by the households. Next, one
needs to compare these values with revenues and expenditures under the GRAD suggested practice. This
comparison will allow to evaluate whether the incremental benefit of GRAD intervention is worth the
cost. This is carried out by building ―with‖ and ―without‖ scenario with respect to revenues and
expenditures profiles and then constructing an incremental cash flows statement for the entire evaluation
period of eleven years.
(a) “Without” Intervention Scenario (Case of intercropping of red haricot beans and
maize)
The existent cultivation practice of Ethiopian farmers is to intercrop and rotate different crops. The main
landholding is usually allocated for the maize, wheat, barley and other cereals production. The base line
(or ―without‖ scenario) analysis built making assumption that households cultivate only maize. The
households land holding is limited to one timad19
. The details of the expenditures and incomes for the
―without‖ intervention scenario are as follows:
Revenue: The revenue for the households is the value of maize whether it is sold or consumed at home.
The maize yield is 600 kg/timad. There is a post – harvest loss of 8 percent, which reduces the total
quantity harvested to 552 kg/timad. At the current price of 4 ETB/kg this translates into 2,208.00 ETB of
potential revenues. About 250 kg of maize, however, is consumed at home allowing a farmer to sell 302
kg of maize per harvest.
Expenditures: The full list of expenditures is presented in table 6 above. The expenditures are divided into
two groups: inputs cost and activity costs. Inputs cost are maize seeds, UREA and DAP. This group of
19 Timad is equal to 0.25 hectare.

15
expenditures represents real cash outflows of the household. Activity costs are the opportunity cost of
labour and land. This group of expenditures is not a cash outflow of the household but is the value of their
opportunity cost. There is also a land tax of 85 ETB/ha/year.20
(b) “With” Intervention Scenario (Case of intercropping of red haricot beans and
maize)
The intervention in red haricot beans will change the pattern of land utilization. The households will start
intercropping maize with red haricot beans. The priority, however, still will be directed toward maize
cultivation. The decrease in yield of maize per hectare is assumed to be 24 percent because of
intercropping. There is a corresponding decrease in the yield/ha of haricot beans by 67 percent from the
mono cropping. The details of the expenditures and incomes for the intercropping intervention scenario
are as follows:
Revenue: The revenue for the family is the value of maize and red haricot beans whether it is sold or
consumed at home. The base case maize yield is 600kg per quarter of hectare. There is a 24 percent
decrease in the yield of maize due to intercropping practice. This translates to the yield equal to 456
kg/timad. There is 8 percent post – harvest loss, which also reduces yield to 419.52 kg of maize per 0.25
hectare. The value of the maize harvested, when sold at current market price of 4 ETB is equal to
1,678.00 ETB. A quarter of metric ton of maize is consumed at house allowing the family to sell 169.52
kg of maize.
The yield of red haricot beans using improved seeds is equal to 400kg/timad under the mono cropping
cultivation practice. Due to intercropping the yield falls by 67 percent leaving the farmer with 132 kg of
red haricot beans per harvest in addition to the maize. The post – harvest loss of beans is estimated to be 5
percent. This translates into 125.4 kg/harvest. Good quality red haricot beans are able to fetch price of 7
ETB/kg at the local market. At such price level total value of haricot beans produced is amounted to ETB
877.80. The family consumption of red haricot beans is assumed to be 50kg from each harvest, allowing
farmers to sell the rest 75.4 kg.
Expenditures:
The full list of expenditures is presented in table 6 above. The expenditures are divided into two groups:
input costs and activity costs. Input costs are maize seeds, red haricot beans seeds, UREA and DAP. The
quantity of fertilizers used, however, doesn’t change because of the intervention. The reason is that
farmer’s attention is toward maize cultivation, hence the fertilizing practice does not change. This group
of expenditures represent real cash outflows of the household. Activity costs are the opportunity cost of
labour and land. There is also no increase in the rental value of land because of haricot beans cultivation.
(c) “Without” Intervention Scenario (Case of red haricot beans mono cropping)
Some Ethiopia households, specifically those with a land holding of more than one timad, may allocate a
quarter of hectare for the red haricot beans mono cropping cultivation. Under the existent mono cropping
practice, because of the limited availability of improved seeds, the haricot beans yield is only 700 kg/ha.
This translates into 175 kg/timad. The details of the expenditures and revenues for the ―without‖
intervention scenario are presented below:
20 The land tax in Ethiopia is calculated based on number of factors, such as soil fertility and etc. The rate used in the analysis is the most frequent one mentioned by the households during interviews.
16
Revenue: The revenue for the family is the value of the red haricot beans output. The base case market
price of the beans is 5.00 ETB/kg. Such price exists on the domestic market during the harvesting period.
Majority of the households sell beans during the harvesting period, perhaps because of the losses
associated with long storage of the beans. The post – harvest loss of the haricot beans is equal to 5
percent. The total quantity harvested those amounted to 166.25 kg/timad. The in – house consumption of
red haricot beans is reported to be 20 percent of the quantity harvested. The total value of the production,
including in – house consumption, is 831.25 ETB.
Expenditures: The complete list of expenditures is presented in table 5 above. The expenditures are
divided into two groups: inputs cost and activity costs. Inputs costs are red haricot beans seeds and DAP.
Activity costs are opportunity costs of labour and land. There is also a land tax of 85 ETB/ha/year.21
(d) “With” Intervention Scenario (Case of red haricot beans mono cropping)
The proposed by USAID intervention will give farmers access to improved seeds and capital required for
the purchase of the seeds. This will allow farmers to more than double the yield of the haricot beans. The
resulted yield is reported to be 1.6 MT/ha, which translates into 400 kg/timad. The loss rate assumed not
to remain at the level of 5 percent, allowing farmers to harvest 380 kg/timad.
Revenue: The better quality of seeds will allow farmers not only to increase haricot beans yield, but also
to fetch a better price in the market. The price will increase up to 7.00 ETB/kg, because of the better
quality of the beans. The total value of production is estimated to be 2,660 ETB/kg. The family
consumption is assumed to be 50 kg per year.
Expenditures: The complete list of expenditures is presented in table 5 above. The expenditures are
divided into two groups: inputs cost and activity costs. Input costs are improved red haricot beans seeds
and DAP. Activity costs are opportunity cost of labour and land. Transportation costs also may remain
within the family. Households usually use donkeys to transport beans from the field to the market.
PREPARATORY TABLES
In the CBA model, tables 2 to 10 are preparatory information about haricot beans cultivation and
projected expenditures and value of production both for ―with‖ and ―without‖ intervention.
Table 2 contains total investment cost required for the red haricot beans cultivation. The total investment
cost is estimated to be 688.75 ETB. Table 2 is the basis for the Table 3, of the model, where total amount
of the loan is derived. The total amount of loan, in addition to the investment cost, includes a charge of 1
percent, an insurance of 1 percent, a pass book fee of 15 ETB and up – front saving of 10 percent of the
total investment required. Up – front saving is returned to the household upon repayment of the loan with
no interest accrued on the saving. Resulted amount of the loan is equal to 786.40 ETB.
Table 4 presents domestic inflation per production period (6 months) that is estimated to be 9.54 percent
and resulted domestic price index. Domestic price index is used to adjust current prices to reflect impact
of inflation over the evaluation period. The expected exchange rate of the Ethiopian Birr to the US dollar
is derived by multiplying current exchange rate and relative price index. Relative price index, in turn, is
the factor of inflation in Ethiopia and US.
Table 5 depicts the projected loan schedule. The haricot beans cultivation begins during the month of
May. Harvesting season is usually at the beginning of the month of November. The monthly interest rate 21 The land tax in Ethiopia is calculated based on number of factors, such as soil fertility and etc. The rate used in the analysis is the most frequent one mentioned by the households during interviews.

17
is estimated to be 1.17 percent22
. The households assumed to take loan just before the beginning of the
production cycle in May, and repay principal and interest accrued after they harvest and sell haricot beans
in the month of November. The households will have 5 month of grace period.
Table 6 presents production round based nominal input and operating costs for both, ―with‖ and ―without‖
scenarios. The nominal values are derived by adjusting current values over the corresponding price index.
It is assumed that the households will bear all the production related costs at the beginning of the period
(6 month). The production, however, will be sold at the beginning of the next period.
Table 7 presents annual production in kilograms for both ―with‖ and ―without‖ case. The table is the base
for the Table 8 were the total value of production in nominal terms is derived.
FINANCIAL ANALYSIS
The modeling exercise was constructed for the 11 years evaluation period. Tables 11 and 12 of the model
present the cash flow statement from the total investment or project point of view in nominal and real
values for both, ―with‖ and ―without‖ scenarios.
The mono cropping case without scenario yields in real terms a financial net present value (FNPV) of
ETB 1,070 or US$ 61 with real discount rate of 12 percent. The case, when red haricot beans are
intercropped with maize, yields a financial net present value of ETB 3,844 or US220. To estimate the
addition to the family welfare, because of the intervention, one has to examine the difference between
―with‖ and ―without‖ scenarios. Those tables 11 and 12 of the CBA model are required for consequent
construction of the incremental cash flow statements from the total investment or project point of view
presented in Table 13 of the CBA model. The incremental analysis of the mono cropping scenario yields a
positive Financial Net Present Value (FNPV) of ETB 7,023 or US$401 using real discount rate of 12
percent. This represents significant improvement over previous ―without‖ situation. The intercropping
case results on incremental FNPV being equal to ETB264 or US$ 15. Tables 7 and 8, below, present the
incremental cash flows for mono cropping and intercropping scenarios, respectively:
22 Annual interest rate is equal to 15 percent

Table 7. Incremental cash flow statement – Total investment or project point of view for mono cropping scenario (Real ETB)
Line Items Year<<<< 2012 2013 2014 2015 2016 2017 2018 2019 2020 2021 2022 PV
Receipts
In-house Consumption
365.75 365.75 365.75 365.75 365.75 365.75 365.75 365.75 365.75 365.75 365.75 2,432.32
Marketed Beans
1,463.00 1,463.00 1,463.00 1,463.00 1,463.00 1,463.00 1,463.00 1,463.00 1,463.00 1,463.00 1,463.00 9,729.28
Total Inflows
1,828.75 1,828.75 1,828.75 1,828.75 1,828.75 1,828.75 1,828.75 1,828.75 1,828.75 1,828.75 1,828.75 12,161.60
Expenditures
Inputs Cost:
Seeds
212.50 212.50 212.50 212.50 212.50 212.50 212.50 212.50 212.50 212.50 212.50 1,413.17
DAP
388.75 388.75 388.75 388.75 388.75 388.75 388.75 388.75 388.75 388.75 388.75 2,585.27
Land
0.00 0.00 0.00 0.00 0.00 0.00 0.00 0.00 0.00 0.00 0.00 0.00
Activity Costs:
Plowing
0.00 0.00 0.00 0.00 0.00 0.00 0.00 0.00 0.00 0.00 0.00 0.00
Planting
0.00 0.00 0.00 0.00 0.00 0.00 0.00 0.00 0.00 0.00 0.00 0.00
Fertilizer application
30.00 30.00 30.00 30.00 30.00 30.00 30.00 30.00 30.00 30.00 30.00 199.51
Weeding
0.00 0.00 0.00 0.00 0.00 0.00 0.00 0.00 0.00 0.00 0.00 0.00
Harvesting
75.00 75.00 75.00 75.00 75.00 75.00 75.00 75.00 75.00 75.00 75.00 498.77
Threshing
30.00 30.00 30.00 30.00 30.00 30.00 30.00 30.00 30.00 30.00 30.00 199.51
Packaging
15.00 15.00 15.00 15.00 15.00 15.00 15.00 15.00 15.00 15.00 15.00 99.75
Transportation
21.38 21.38 21.38 21.38 21.38 21.38 21.38 21.38 21.38 21.38 21.38 142.15
Land Tax
0.00 0.00 0.00 0.00 0.00 0.00 0.00 0.00 0.00 0.00 0.00 0.00
Total Outflows
772.63 772.63 772.63 772.63 772.63 772.63 772.63 772.63 772.63 772.63 772.63 5,138.13
Net Cash Flows 1056.13 1056.13 1056.13 1056.13 1056.13 1056.13 1056.13 1056.13 1056.13 1056.13 1056.13 7,023.47
Net Cash Flows, REAL USD 60.35 60.35 60.35 60.35 60.35 60.35 60.35 60.35 60.35 60.35 60.35 401.34
NPV @12% discount rate ETB 7,023
NPV @12% discount rate $US 401
19
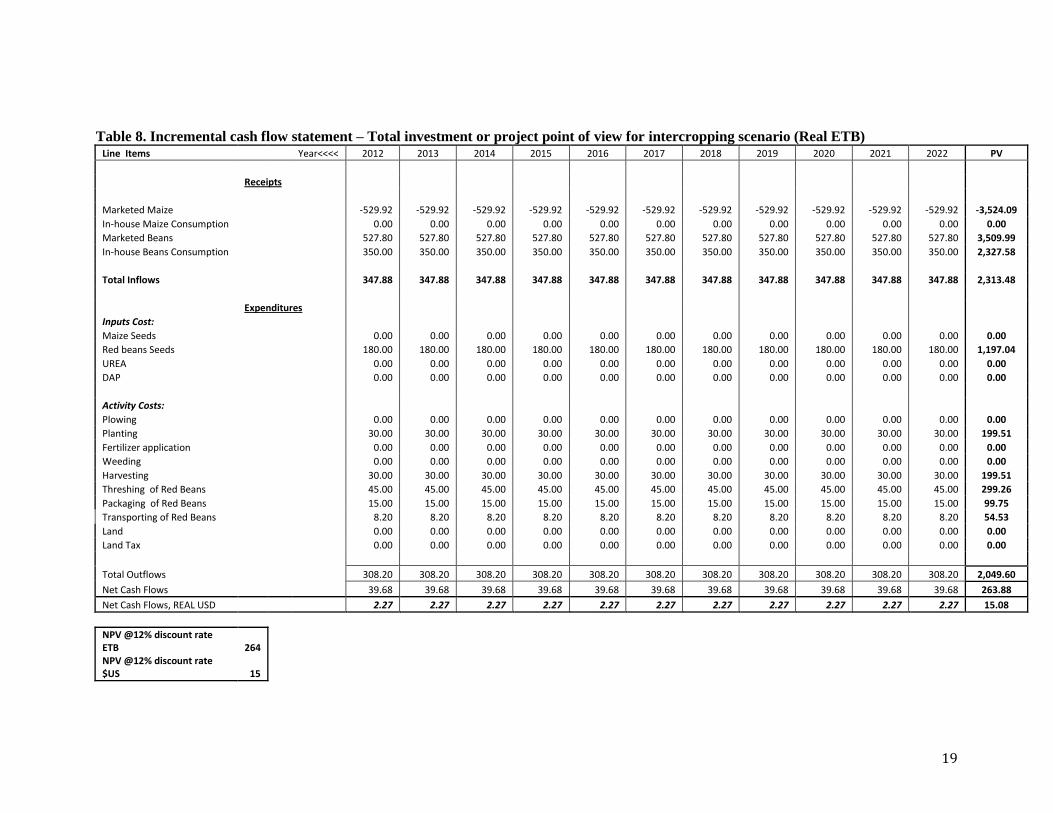
Table 8. Incremental cash flow statement – Total investment or project point of view for intercropping scenario (Real ETB) Line Items Year<<<< 2012 2013 2014 2015 2016 2017 2018 2019 2020 2021 2022 PV
Receipts
Marketed Maize
-529.92 -529.92 -529.92 -529.92 -529.92 -529.92 -529.92 -529.92 -529.92 -529.92 -529.92 -3,524.09
In-house Maize Consumption
0.00 0.00 0.00 0.00 0.00 0.00 0.00 0.00 0.00 0.00 0.00 0.00
Marketed Beans
527.80 527.80 527.80 527.80 527.80 527.80 527.80 527.80 527.80 527.80 527.80 3,509.99
In-house Beans Consumption
350.00 350.00 350.00 350.00 350.00 350.00 350.00 350.00 350.00 350.00 350.00 2,327.58
Total Inflows
347.88 347.88 347.88 347.88 347.88 347.88 347.88 347.88 347.88 347.88 347.88 2,313.48
Expenditures
Inputs Cost:
Maize Seeds
0.00 0.00 0.00 0.00 0.00 0.00 0.00 0.00 0.00 0.00 0.00 0.00
Red beans Seeds
180.00 180.00 180.00 180.00 180.00 180.00 180.00 180.00 180.00 180.00 180.00 1,197.04
UREA
0.00 0.00 0.00 0.00 0.00 0.00 0.00 0.00 0.00 0.00 0.00 0.00
DAP
0.00 0.00 0.00 0.00 0.00 0.00 0.00 0.00 0.00 0.00 0.00 0.00
Activity Costs:
Plowing
0.00 0.00 0.00 0.00 0.00 0.00 0.00 0.00 0.00 0.00 0.00 0.00
Planting
30.00 30.00 30.00 30.00 30.00 30.00 30.00 30.00 30.00 30.00 30.00 199.51
Fertilizer application
0.00 0.00 0.00 0.00 0.00 0.00 0.00 0.00 0.00 0.00 0.00 0.00
Weeding
0.00 0.00 0.00 0.00 0.00 0.00 0.00 0.00 0.00 0.00 0.00 0.00
Harvesting
30.00 30.00 30.00 30.00 30.00 30.00 30.00 30.00 30.00 30.00 30.00 199.51
Threshing of Red Beans
45.00 45.00 45.00 45.00 45.00 45.00 45.00 45.00 45.00 45.00 45.00 299.26
Packaging of Red Beans
15.00 15.00 15.00 15.00 15.00 15.00 15.00 15.00 15.00 15.00 15.00 99.75
Transporting of Red Beans
8.20 8.20 8.20 8.20 8.20 8.20 8.20 8.20 8.20 8.20 8.20 54.53
Land
0.00 0.00 0.00 0.00 0.00 0.00 0.00 0.00 0.00 0.00 0.00 0.00
Land Tax
0.00 0.00 0.00 0.00 0.00 0.00 0.00 0.00 0.00 0.00 0.00 0.00
Total Outflows
308.20 308.20 308.20 308.20 308.20 308.20 308.20 308.20 308.20 308.20 308.20 2,049.60
Net Cash Flows 39.68 39.68 39.68 39.68 39.68 39.68 39.68 39.68 39.68 39.68 39.68 263.88
Net Cash Flows, REAL USD 2.27 2.27 2.27 2.27 2.27 2.27 2.27 2.27 2.27 2.27 2.27 15.08
NPV @12% discount rate ETB 264
NPV @12% discount rate $US 15

Table 14, in the CBA, depicts the cash flow statement from the total investment point of view excluding
home consumption. Home consumption, although it definitely has value for the households, does not
represent a monetary outflow and those should be excluded from the analysis to properly assess ability of
the households to serve their debt obligations. The same rationale holds for opportunity cost of family
labor. In this case labor expense should be added back to the net cash flow over the period since money
actually stay within the family and can be used to cover debt obligations. The Table 14 is again
constructed on incremental basis. This allows to determine the ability of the households to repay loan
without requiring a contribution of financial resources from other activities.
The Annual Debt Service Coverage Ratio (ADSCR) for the mono cropping scenario is estimated to be
1.22. The ADSCR above one usually indicates ability of the households to cover their debt obligations. In
the intercropping case the ADSCR is only 0.30, which is below the value of one. In case of intercropping,
however, farmers will now have additional 50 kg of haricot beans consumed at by the family.23
This 50
kg was excluded from the cash flow used to calculate ADSCR. The value of the 50 kg of red haricot
beans is equal to 350 ETB. When this value is added back the ADSCR increases to 0.84.
Table 15 of the CBA model presents cash flow statement in real terms from the equity point of view. The
only difference between total investment and equity point of view is financing. The cash flow statement
from the total investment project of view is constructed to assess the overall attractiveness of the project.
The cash flow statement from the equity point of view, in turn, determine the returns to the households
taking into consideration the source of project financing. The resulted FNPV from the equity point of
view is US$397.84 in case of mono cropping and 12.03 in the case of intercropping.
ECONOMIC ANALYSIS
Differences arise between the financial and economic outcomes due to the fact that the financial values do
not include in all the externalities that are present in the economy (e.g., government). To show the true
economic impact on the Ethiopian economy of the proposed intervention, the economic values are
derived by adjusting the financial values by appropriate economic conversion factors. If no distortion is
present in a market then the financial value of an item is used to measure the economic value of an item.
The values of the ENPVs for each scenario are presented in table 9, below:
Table 9. ENPV for each intervention
ENPV (in US$) Mono
cropping
Intercropping with
maize
Red haricot beans 435.38 29.51
The proposed intervention will increase Ethiopian red haricot beans production. Ethiopia currently
exports red haricot beans. Increased exports will benefit Ethiopian economy by bringing foreign exchange
to the country. The foreign exchange premium for Ethiopia was estimated to be equal to 6.5% (Kuo,
2011). The foreign exchange premium of 6.5 percent means that every incremental dollar earned on
exports has economic value of 1.065 dollar. If there are no other distortions this connotes that every
incremental kg of haricot beans produced should be attributed with the positive externality of 6.5 percent.
Table 10 and 11 presents the resource flow statement from the economy point of view:
23 In the ―without‖ case scenario the households didn’t produce red haricot beans. If they were to purchase such quantity they had to pay 350ETB.

Table 10. Incremental Resource flow statement Economy point of view for mono cropping scenario (Real ETB) Line Items CF Year<<<< 2012 2013 2014 2015 2016 2017 2018 2019 2020 2021 2022 PV
Receipts
In-house Consumption
1.07 390.90 390.90 390.90 390.90 390.90 390.90 390.90 390.90 390.90 390.90 390.90 2,599.58
Marketed Beans
1.07 1,563.60 1,563.60 1,563.60 1,563.60 1,563.60 1,563.60 1,563.60 1,563.60 1,563.60 1,563.60 1,563.60 10,398.32
Total Inflows
1,954.51 1,954.51 1,954.51 1,954.51 1,954.51 1,954.51 1,954.51 1,954.51 1,954.51 1,954.51 1,954.51 12,997.90
Expenditures
Inputs Cost:
Seeds
1.07 227.11 227.11 227.11 227.11 227.11 227.11 227.11 227.11 227.11 227.11 227.11 1,510.35 DAP
1.06 410.32 410.32 410.32 410.32 410.32 410.32 410.32 410.32 410.32 410.32 410.32 2,728.70
Land
1.00 0.00 0.00 0.00 0.00 0.00 0.00 0.00 0.00 0.00 0.00 0.00 0.00
Activity Costs:
Plowing
1.00 0.00 0.00 0.00 0.00 0.00 0.00 0.00 0.00 0.00 0.00 0.00 0.00
Planting
1.00 0.00 0.00 0.00 0.00 0.00 0.00 0.00 0.00 0.00 0.00 0.00 0.00 Fertilizer application
1.00 30.00 30.00 30.00 30.00 30.00 30.00 30.00 30.00 30.00 30.00 30.00 199.51
Weeding
1.00 0.00 0.00 0.00 0.00 0.00 0.00 0.00 0.00 0.00 0.00 0.00 0.00 Harvesting
1.00 75.00 75.00 75.00 75.00 75.00 75.00 75.00 75.00 75.00 75.00 75.00 498.77
Threshing
1.00 30.00 30.00 30.00 30.00 30.00 30.00 30.00 30.00 30.00 30.00 30.00 199.51 Packaging
1.00 15.00 15.00 15.00 15.00 15.00 15.00 15.00 15.00 15.00 15.00 15.00 99.75
Transportation
1.00 21.38 21.38 21.38 21.38 21.38 21.38 21.38 21.38 21.38 21.38 21.38 142.15 Land Tax
0.00 0.00 0.00 0.00 0.00 0.00 0.00 0.00 0.00 0.00 0.00 0.00 0.00
Total Outflows
808.81 808.81 808.81 808.81 808.81 808.81 808.81 808.81 808.81 808.81 808.81 5,378.73
Net Cash Flows 1145.70 1145.70 1145.70 1145.70 1145.70 1145.70 1145.70 1145.70 1145.70 1145.70 1145.70 7,619.16
Net Cash Flows, REAL USD 65.47 65.47 65.47 65.47 65.47 65.47 65.47 65.47 65.47 65.47 65.47 435.38
NPV @12% discount rate ETB 7,619
NPV @12% discount rate $US 435.38

Table 11. Incremental Resource flow statement Economy point of view for intercropping scenario (Real ETB) Line Items CF Year<<<< 2012 2013 2014 2015 2016 2017 2018 2019 2020 2021 2022 PV
Receipts
Marketed Maize
1.02 -
539.93 -
539.93 -
539.93 -539.93 -539.93 -539.93 -539.93 -539.93 -539.93 -539.93 -539.93 -3,590.68
In-house Maize Consumption
1.02 0.00 0.00 0.00 0.00 0.00 0.00 0.00 0.00 0.00 0.00 0.00 0.00
Marketed Beans
1.07 564.09 564.09 564.09 564.09 564.09 564.09 564.09 564.09 564.09 564.09 564.09 3,751.35
In-house Beans Consumption
1.07 374.07 374.07 374.07 374.07 374.07 374.07 374.07 374.07 374.07 374.07 374.07 2,487.64
Total Inflows
398.23 398.23 398.23 398.23 398.23 398.23 398.23 398.23 398.23 398.23 398.23 2,648.32
Expenditures
Inputs Cost:
Maize Seeds
1.02 0.00 0.00 0.00 0.00 0.00 0.00 0.00 0.00 0.00 0.00 0.00 0.00
Red beans Seeds
1.07 192.38 192.38 192.38 192.38 192.38 192.38 192.38 192.38 192.38 192.38 192.38 1,279.36
UREA
1.06 0.00 0.00 0.00 0.00 0.00 0.00 0.00 0.00 0.00 0.00 0.00 0.00
DAP
1.06 0.00 0.00 0.00 0.00 0.00 0.00 0.00 0.00 0.00 0.00 0.00 0.00
Activity Costs:
Plowing
1.00 0.00 0.00 0.00 0.00 0.00 0.00 0.00 0.00 0.00 0.00 0.00 0.00
Planting
1.00 30.00 30.00 30.00 30.00 30.00 30.00 30.00 30.00 30.00 30.00 30.00 199.51
Fertilizer application
1.00 0.00 0.00 0.00 0.00 0.00 0.00 0.00 0.00 0.00 0.00 0.00 0.00
Weeding
1.00 0.00 0.00 0.00 0.00 0.00 0.00 0.00 0.00 0.00 0.00 0.00 0.00
Harvesting
1.00 30.00 30.00 30.00 30.00 30.00 30.00 30.00 30.00 30.00 30.00 30.00 199.51
Threshing of Red Beans
1.00 45.00 45.00 45.00 45.00 45.00 45.00 45.00 45.00 45.00 45.00 45.00 299.26
Packaging of Red Beans
1.00 15.00 15.00 15.00 15.00 15.00 15.00 15.00 15.00 15.00 15.00 15.00 99.75
Transporting of Red Beans
1.00 8.20 8.20 8.20 8.20 8.20 8.20 8.20 8.20 8.20 8.20 8.20 54.53
Land
1.00 0.00 0.00 0.00 0.00 0.00 0.00 0.00 0.00 0.00 0.00 0.00 0.00
Land Tax
0.00 0.00 0.00 0.00 0.00 0.00 0.00 0.00 0.00 0.00 0.00 0.00 0.00
Total Outflows
320.58 320.58 320.58 320.58 320.58 320.58 320.58 320.58 320.58 320.58 320.58 2,131.91
Net Cash Flows 77.65 77.65 77.65 77.65 77.65 77.65 77.65 77.65 77.65 77.65 77.65 516.40
Net Cash Flows, REAL USD 4.44 4.44 4.44 4.44 4.44 4.44 4.44 4.44 4.44 4.44 4.44 29.51
NPV @12% discount rate ETB 516
NPV @12% discount rate $US 29.51

STAKEHOLDER AND BENEFICIARY ANALYSIS
A surplus is also created in the economy by employing capital, land, and labour and paying financial
prices for these inputs that are greater than the value of their opportunity costs. The GRAD interventions
yield two groups of beneficiaries: the households engaged in red haricot beans cultivation and the
Government of Ethiopia.
The FNPV represents the benefits accruing to the households. In this case it has a positive value of US$
400.19 for mono cropping scenario and US$ 13.98 in the case of intercropping. The greater economic
values are due to additional benefits arising from additional tax revenue accruing to the government. The
financing contribution of USAID is a transfer of resources from USAID to the farmer. This financial
subsidy created through the submarket interest rates does not affect the ENPV of the project. It is
accounted for as a direct subsidy provided to households by the lower than market interest rates, and is
included as a benefit in the calculation of the FNPV of the households.
The Ethiopian government benefits from the additional inflow of taxes that accrues directly through the
taxation of inputs purchased by the farmers and also indirectly because of the presence of a foreign
exchange premium (FEP) accruing on the foreign exchange earnings of the project. This foreign exchange
premium is simply a measure of the increase in indirect tax revenue in the economy that occurs when the
project generates additional foreign exchange. The values of stakeholder gains under each of the
interventions are presented in table 12, below:
Table 12. Stakeholder and Beneficiary Impacts of Project (in US$)
Mono cropping Intercropping
Economic NPV (FNPV + Externalities) 435.38 29.51
Financial NPV (Households) 397.84 12.03
Externalities 37.54 17.48
o Government 34.04 14.43
o Financing Contribution 3.50 3.05
24
SENSITIVITY ANALYSIS
The variables, for which the sensitivity analysis for red haricot beans has been conducted, include the cost
of improved red haricot beans seeds, red haricot beans and maize yields due to intercropping, price of red
haricot beans, the cost of fertilizer and the occurrence of droughts (for mono cropping). The variables
were chosen to test their significance on the participating household’s income.
Mono cropping Intervention in the Red Haricot Beans Value Chain
The joint impact of the red haricot beans price and red haricot beans yields in the mono cropping scenario
is presented in the table 13, below. Similarly the joint impact of the cost of red haricot beans seeds and
fertilizer (DAP) prices on the FNPV are presented in table 14. Table 15 outlines the joint impact of yield
and the selling price of red haricot beans on the net cash flows (NCF) in the year 2 and until the end of the
evaluation period. Lastly, table 16 presents the sensitivity analysis for the occurrence of droughts and
their impact on red haricot beans production under the mono cropping case.
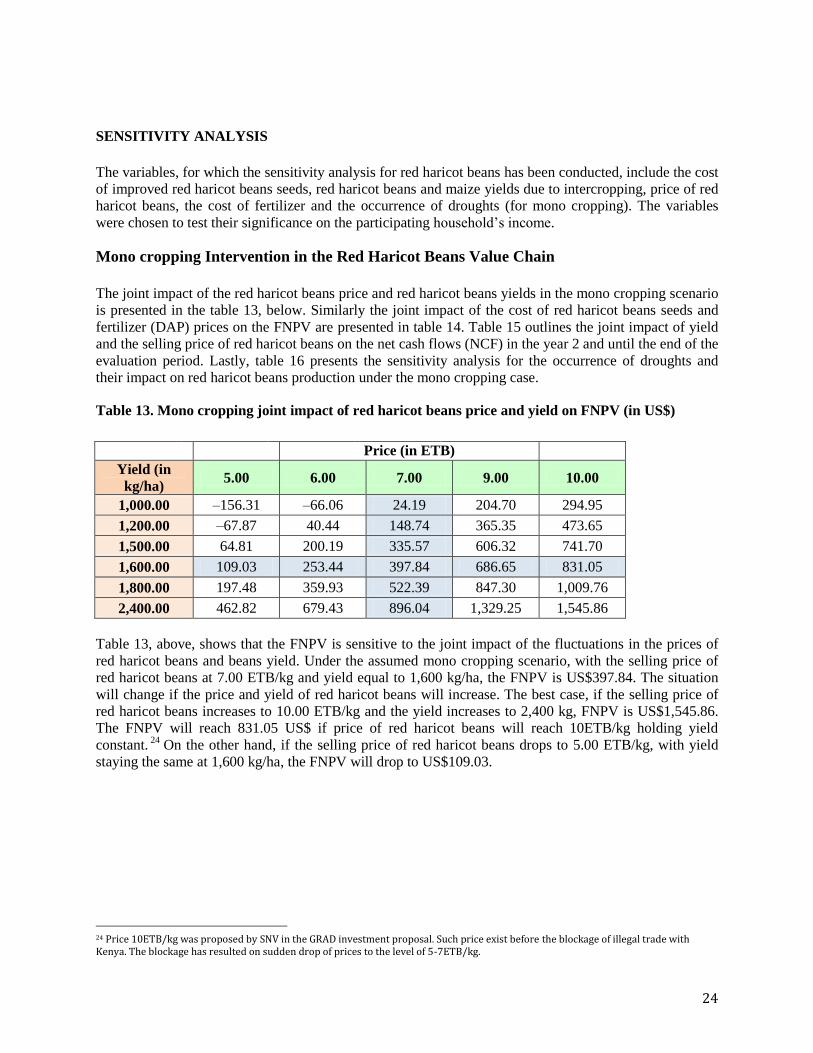
Table 13. Mono cropping joint impact of red haricot beans price and yield on FNPV (in US$)
Price (in ETB)
Yield (in
kg/ha) 5.00 6.00 7.00 9.00 10.00
1,000.00 –156.31 –66.06 24.19 204.70 294.95
1,200.00 –67.87 40.44 148.74 365.35 473.65
1,500.00 64.81 200.19 335.57 606.32 741.70
1,600.00 109.03 253.44 397.84 686.65 831.05
1,800.00 197.48 359.93 522.39 847.30 1,009.76
2,400.00 462.82 679.43 896.04 1,329.25 1,545.86
Table 13, above, shows that the FNPV is sensitive to the joint impact of the fluctuations in the prices of
red haricot beans and beans yield. Under the assumed mono cropping scenario, with the selling price of
red haricot beans at 7.00 ETB/kg and yield equal to 1,600 kg/ha, the FNPV is US$397.84. The situation
will change if the price and yield of red haricot beans will increase. The best case, if the selling price of
red haricot beans increases to 10.00 ETB/kg and the yield increases to 2,400 kg, FNPV is US$1,545.86.
The FNPV will reach 831.05 US$ if price of red haricot beans will reach 10ETB/kg holding yield
constant. 24
On the other hand, if the selling price of red haricot beans drops to 5.00 ETB/kg, with yield
staying the same at 1,600 kg/ha, the FNPV will drop to US$109.03.
24 Price 10ETB/kg was proposed by SNV in the GRAD investment proposal. Such price exist before the blockage of illegal trade with Kenya. The blockage has resulted on sudden drop of prices to the level of 5-7ETB/kg.

25
Table 14. Mono cropping joint impact of the cost of red haricot beans seeds and the DAP price on
FNPV (in US$)
Cost of seeds (in ETB)
Cost of DAP (in
ETB) 10.00 11.00 12.00 15.00 18.00
12.00 451.09 441.50 431.90 403.12 374.33
13.00 441.50 431.90 422.31 393.52 364.74
15.55 417.03 407.44 397.84 369.05 340.27
17.00 403.12 393.52 383.93 355.14 326.36
20.00 374.33 364.74 355.14 326.36 297.57
Table 14, above, shows the effects of changing the costs of red haricot beans seeds and the price of
fertilizer (DAP). Under the assumed scenario, with the cost of red haricot beans seeds at 12.00 ETB/kg
and the cost of DAP at 15.55 ETB/kg, the FNPV is US$397.84. The situation looks different when the
prices of seeds and fertilizer rise. In this situation, at the upper level of tested ranges, with the red haricot
beans seeds price at 18.00 ETB/kg and the cost of fertilizer at 20.00 ETB/kg, the FNPV drops to
US$297.57. On the other hand, if the price of seeds drops to 10.00 ETB/kg and the price of DAP
decreases to 12.00 ETB/kg, the FNPV increases to US$451.09.
Table 15. Mono cropping joint impact of the yield and selling price of red haricot beans on NCF in
year 2 and after (in US$)
Price (in ETB)
Yield (in
kg/ha) 5.00 6.00 7.00 9.00 10.00
1,000.00 –22.98 –9.41 4.16 31.31 44.88
1,200.00 –9.68 6.61 22.89 55.46 71.75
1,500.00 10.27 30.63 50.99 91.70 112.06
1,600.00 16.92 38.64 60.35 103.78 125.49
1,800.00 30.22 54.65 79.08 127.94 152.36
2,400.00 70.12 102.69 135.26 200.41 232.98
Table 15, above, presents the sensitivity analysis conducted on the joint impact of the yield and price of
red haricot beans on a household’s net cash flow (NCF)25. Under the assumed scenario, with the selling
price of red haricot beans at 7.00 ETB/kg and the yield at 1,600 kg, the annual NCF, after year one, is
US$60.35. If the selling price of red haricot beans increases to 10.00 ETB/kg and the yield stays the same,
the NCF increases to US$125.49. On the other hand if the selling price of red haricot beans decreases to
5.00 ETB/kg and the yield stays at the assumed level of 1,600 kg, the NCF also decreases to US$16.92.
The maximum NCF level under the tested scenarios for red haricot beans selling prices and yields can be
achieved when the selling price of red haricot beans is 10.00 ETB/kg and the yield is 2,400 kg. In this
case, the NCF rises to US$232.98.
25 Net cash flow in this case represents additional annual income to the household
26
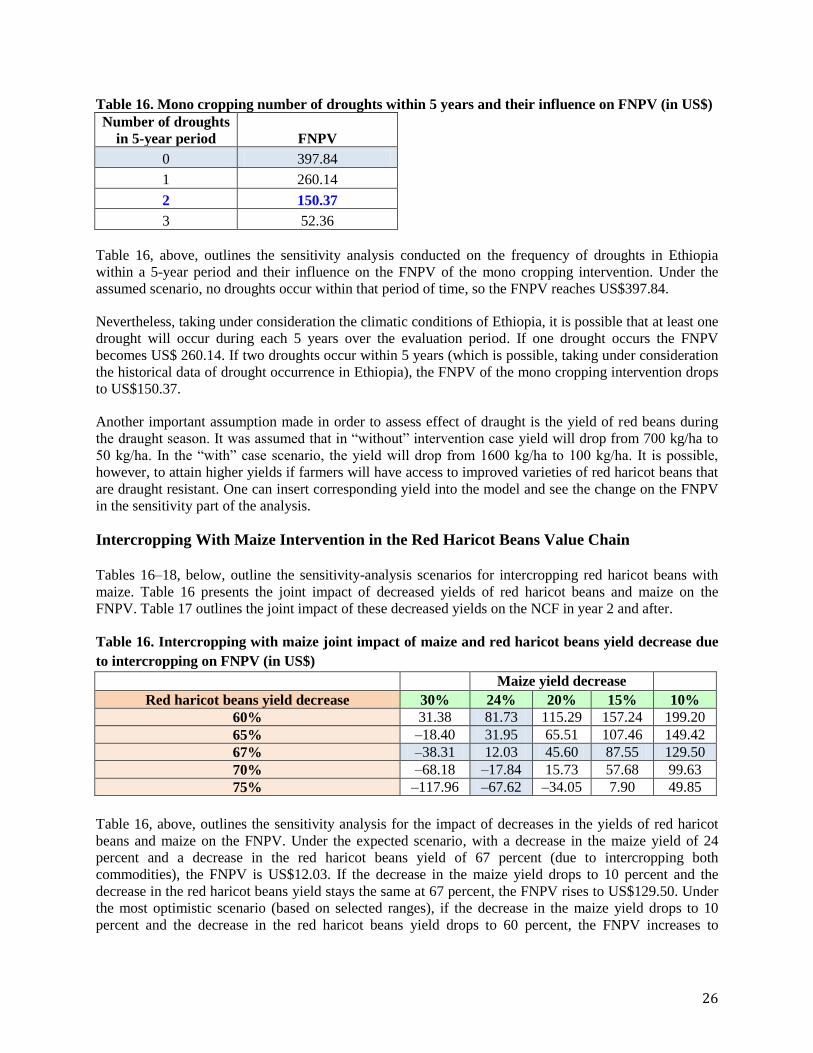
Table 16. Mono cropping number of droughts within 5 years and their influence on FNPV (in US$)
Number of droughts
in 5-year period FNPV
0 397.84
1 260.14
2 150.37
3 52.36
Table 16, above, outlines the sensitivity analysis conducted on the frequency of droughts in Ethiopia
within a 5-year period and their influence on the FNPV of the mono cropping intervention. Under the
assumed scenario, no droughts occur within that period of time, so the FNPV reaches US$397.84.
Nevertheless, taking under consideration the climatic conditions of Ethiopia, it is possible that at least one
drought will occur during each 5 years over the evaluation period. If one drought occurs the FNPV
becomes US$ 260.14. If two droughts occur within 5 years (which is possible, taking under consideration
the historical data of drought occurrence in Ethiopia), the FNPV of the mono cropping intervention drops
to US$150.37.
Another important assumption made in order to assess effect of draught is the yield of red beans during
the draught season. It was assumed that in ―without‖ intervention case yield will drop from 700 kg/ha to
50 kg/ha. In the ―with‖ case scenario, the yield will drop from 1600 kg/ha to 100 kg/ha. It is possible,
however, to attain higher yields if farmers will have access to improved varieties of red haricot beans that
are draught resistant. One can insert corresponding yield into the model and see the change on the FNPV
in the sensitivity part of the analysis.
Intercropping With Maize Intervention in the Red Haricot Beans Value Chain
Tables 16–18, below, outline the sensitivity-analysis scenarios for intercropping red haricot beans with
maize. Table 16 presents the joint impact of decreased yields of red haricot beans and maize on the
FNPV. Table 17 outlines the joint impact of these decreased yields on the NCF in year 2 and after.
Table 16. Intercropping with maize joint impact of maize and red haricot beans yield decrease due
to intercropping on FNPV (in US$)
Maize yield decrease
Maize yield decrease
Red haricot beans yield decrease 30% 24% 20% 15% 10%
60% 31.38 81.73 115.29 157.24 199.20
65% –18.40 31.95 65.51 107.46 149.42
67% –38.31 12.03 45.60 87.55 129.50
70% –68.18 –17.84 15.73 57.68 99.63
75% –117.96 –67.62 –34.05 7.90 49.85
Table 16, above, outlines the sensitivity analysis for the impact of decreases in the yields of red haricot
beans and maize on the FNPV. Under the expected scenario, with a decrease in the maize yield of 24
percent and a decrease in the red haricot beans yield of 67 percent (due to intercropping both
commodities), the FNPV is US$12.03. If the decrease in the maize yield drops to 10 percent and the
decrease in the red haricot beans yield stays the same at 67 percent, the FNPV rises to US$129.50. Under
the most optimistic scenario (based on selected ranges), if the decrease in the maize yield drops to 10
percent and the decrease in the red haricot beans yield drops to 60 percent, the FNPV increases to

27
US$199.20. On the other hand, if the decrease in yield of maize is 30 percent and the yield of red haricot
beans decreases by 75 percent, the FNPV becomes negative, reaching –US$117.96.
The yield decrease of the both intercropped commodities is subject to the level of knowledge of the
households. Some studies report that it is possible to maintain same yield of maize (as when maize is
mono cropped) with decrease of 20 – 30 percent in the yield of pulses. Adequate training on intercropping
technology may help farmers to achieve better intervention outcomes.
Table 17. Joint impact of maize and red haricot beans yield decrease on NFC in year 2 and after (in
US$)
Red haricot beans yield
decrease
Red haricot beans yield decrease 30% 24% 20% 15% 10%
60% 5.18 12.75 17.79 24.10 30.41
65% –2.31 5.26 10.31 16.62 22.93
67% –5.30 2.27 7.31 13.62 19.93
70% –9.97 –2.22 2.82 9.13 15.44
75% –17.28 –9.71 –4.66 1.65 7.95
Table 17, above, presents the sensitivity analysis of the joint impact of yield decreases in red haricot
beans and maize on the NCF. Under the assumed scenario, with a maize yield decrease of 24 percent and
a red haricot beans yield decrease of 67 percent (due to intercropping), the NCF is US$2.27. But if the
maize yield decrease drops by only 10 percent and the red haricot beans yield decrease drops by 60
percent, the NCF increases to US$30.41. On the other hand, if the maize yield decrease rises by 30
percent and the red haricot beans yield decrease by 75 percent, the NFC becomes negative, reaching –
US$17.28.

28
RECOMMENDATIONS
Both intervention scenarios—mono cropping and intercropping with maize—that have been analyzed
show positive financial and economic NPVs, the mono cropping scenario will produce higher NPV values.
Nevertheless, it should be emphasized that for chronically food-insecure households the intercropping
with maize scenario, regardless of the projected NPVs might be more attractive. Intercropping red haricot
beans with maize allows for better mitigation of risks. This is very important in Ethiopia, where the
weather patterns are erratic and crop failures are frequent. This scenario could ensure higher level of food
security for the households; with time and the experience they gain, it is possible that the households will
figure out the perfect balance between intercropping patterns and cost-minimizing levels of fertilizer. This
configuration in turn could result in higher production levels of the intercropped commodities, decreases
in the amount of money spent on fertilizer, and ultimately higher levels of income and food security for
the GRAD-targeted households. With the adequate technology knowledge (that can be transferred to the
households through training program), the decrease in the yield of maize that is intercropped may be
greatly reduced. Corresponding decrease in the yield of red haricot beans will still be high, perhaps
between 55 – 70 percent of mono cropping yield. If this will be the case the FNPV of the intercropping
scenario will reach US$ 335. Increase in annual incomes in this case may increase up to the US$ 50.5.

29
REFERENCES
Abebe, G. (2009). Effect of Np Fertilizer and Moisture Conservation on the Yield and Yield Components
of Haricot Bean (Phaseolus Vulgaris L.) in the Semi-Arid Zones of the Central Rift Valley in Ethiopia.
Advances in Environmental Biology, 3(3): 302–307.
Ayalew, A. (2011). Factors Affecting Adoption of Improved Haricot Bean Varieties and Associated
Agronomic Practices in Dale Woreda, SNNPRS. Master’s thesis, Hawassa University.
Central Statistical Agency (CSA) of Ethiopia. (2012). Agricultural Sample Survey. Retrieved July 20–28,
2012, from
http://www.csa.gov.et/index.php?option=com_rubberdoc&view=category&id=75&Itemid=561.
Ferris, S., and Kaganzi, E. (2008). Evaluating Market Opportunities for Haricot Beans in Ethiopia.
Improving Productivity and Market Success (IPMS) of Ethiopian Farmers Project, International
Livestock Research Institute (ILRI).
Ferris, S., Paschall, M., and Seville, D. (2011). Dried Beans in Ethiopia: Increasing Food Security
Through Trade.(http://seasofchange.net/wp-content/uploads/downloads/2012/03/Case-SFL-Ethiopia-
dried-beans.pdf)
Graduation With Resilience to Achieve Sustainable Development (GRAD). Technical proposal, July 20,
2012.
International Food Policy Research Institute. (2010). Pulses Value Chain in Ethiopia: Constraints and
Opportunities for Enhancing Exports. Working paper, July.
Jenkins, G., Kuo, C., and Harberger, A.. (2011). Cost-Benefit Analysis for Investment Decision, August
2011 Edition.
Kuo, C.Y. (2011). Estimates of the Foreign Exchange Premium and the Premium for Non-Tradable
Outlays for Countries in Africa. John Deutsch International, Department of Economics, Queen’s
University, Canada.
Negash, R. (2007). Determinants of Adoption of Improved Haricot Beans Production Package in Alaba
Special Woreda, Southern Ethiopia. Master’s thesis, Haramaya University.
Shirefaw, A., Berhe, K., Jaleta, M., Gebremedhin, B., and Hoekstra, D. (2010). Improving Elements of
Haricot Bean Value Chain in Alaba Special District, Southern Ethiopia: Experiences From IPMS. ILRI.
SNV. (2010). Red Beans Value Chain Analysis in PSNP Plus—Dale and Loka Abaya Woredas. Era
Agrilink PLC.
SNV and CARE. (2010). Rapid Market Assessment for Red Beans—Dale and Loka Abaya Woredas.
SNV and CARE. (2012). Red Beans Value Chain Analysis, Draft Report.

30
The Sphere Project. (2011). Humanitarian Charter and Minimum Standards in Humanitarian Response (
http://www.spherehandbook.org/).
USAID. (2008). Success Story: Improved Haricot Bean Basic Seed Multiplication Increased
Yield/Income and Quality. Success Story #12, December.
Yilma, K., Berhe, K., Hoekstra, D., Jaleta, M., Alemayehu, F., Gebrehawariat, K., and Ayele, D. (2010).
Innovative Haricot Beans (Phaseolus vulgaris) Seed System for Smallholder Farmers in Dale District
Southern Ethiopia: Experiences From IPMS. IPMS Ethiopia.
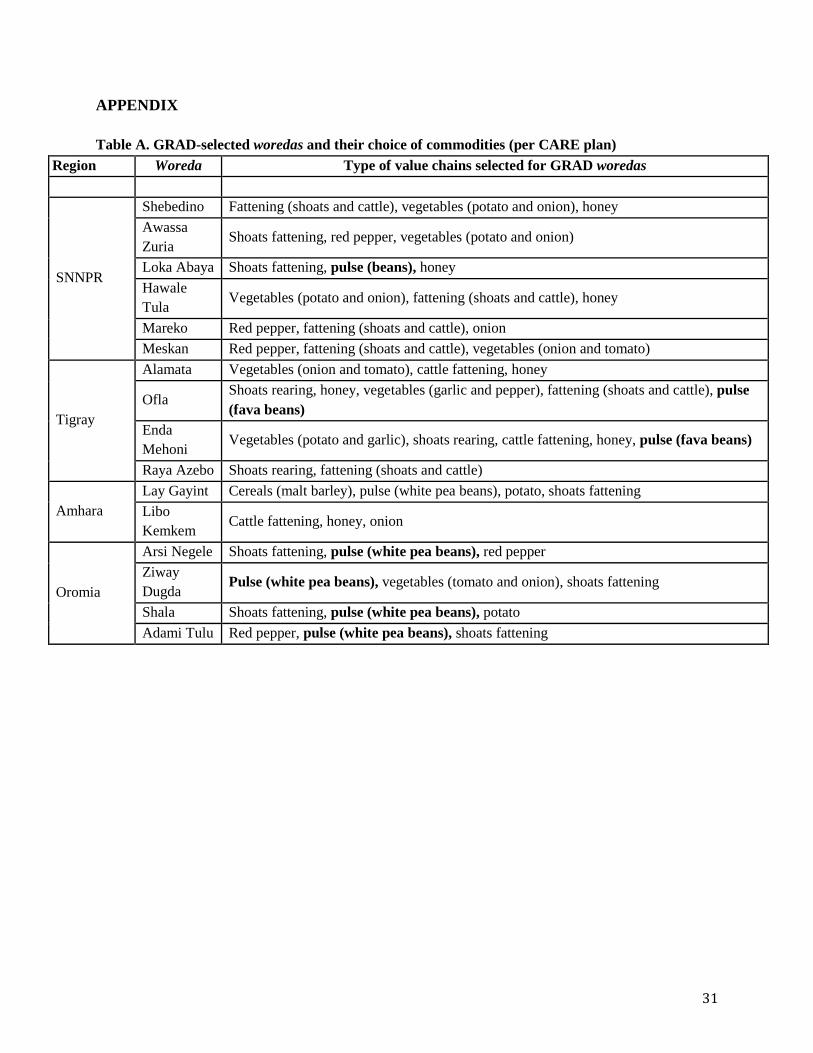
31
APPENDIX
Table A. GRAD-selected woredas and their choice of commodities (per CARE plan)
Region Woreda Type of value chains selected for GRAD woredas
SNNPR
Shebedino Fattening (shoats and cattle), vegetables (potato and onion), honey
Awassa
Zuria Shoats fattening, red pepper, vegetables (potato and onion)
Loka Abaya Shoats fattening, pulse (beans), honey
Hawale
Tula Vegetables (potato and onion), fattening (shoats and cattle), honey
Mareko Red pepper, fattening (shoats and cattle), onion
Meskan Red pepper, fattening (shoats and cattle), vegetables (onion and tomato)
Tigray
Alamata Vegetables (onion and tomato), cattle fattening, honey
Ofla Shoats rearing, honey, vegetables (garlic and pepper), fattening (shoats and cattle), pulse
(fava beans)
Enda
Mehoni Vegetables (potato and garlic), shoats rearing, cattle fattening, honey, pulse (fava beans)
Raya Azebo Shoats rearing, fattening (shoats and cattle)
Amhara
Lay Gayint Cereals (malt barley), pulse (white pea beans), potato, shoats fattening
Libo
Kemkem Cattle fattening, honey, onion
Oromia
Arsi Negele Shoats fattening, pulse (white pea beans), red pepper
Ziway
Dugda Pulse (white pea beans), vegetables (tomato and onion), shoats fattening
Shala Shoats fattening, pulse (white pea beans), potato
Adami Tulu Red pepper, pulse (white pea beans), shoats fattening
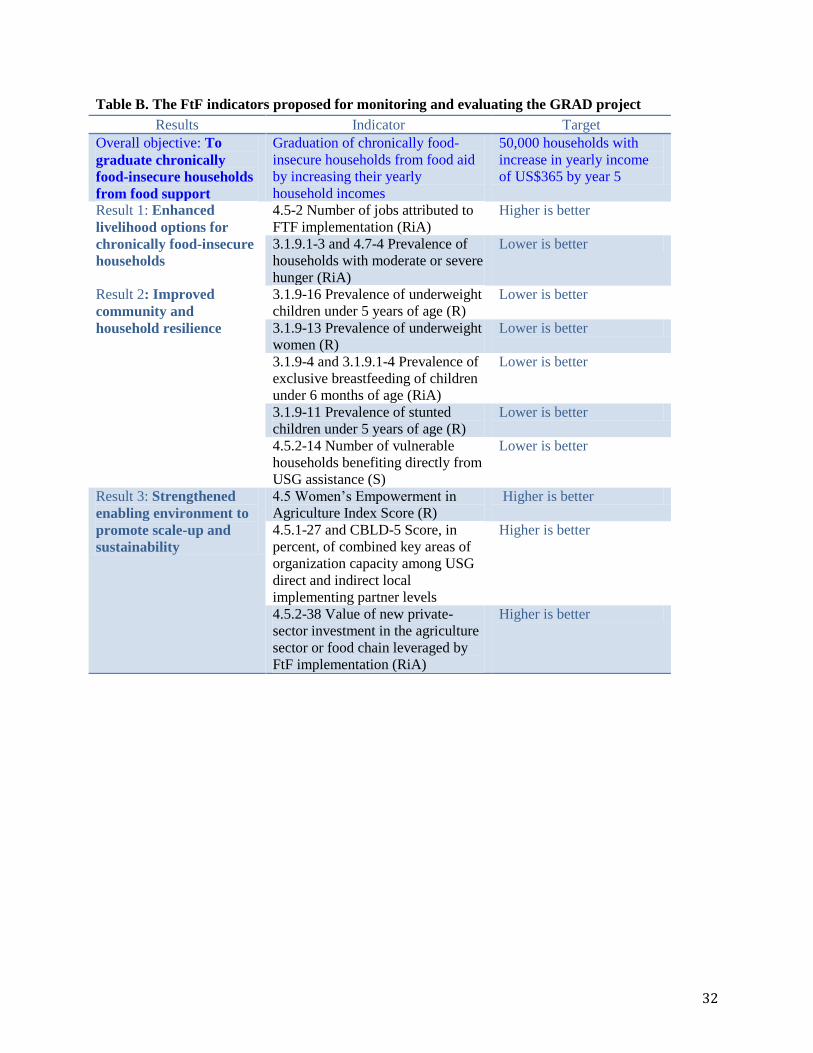
32
Table B. The FtF indicators proposed for monitoring and evaluating the GRAD project
Results Indicator Target
Overall objective: To
graduate chronically
food-insecure households
from food support
Graduation of chronically food-
insecure households from food aid
by increasing their yearly
household incomes
50,000 households with
increase in yearly income
of US$365 by year 5
Result 1: Enhanced
livelihood options for
chronically food-insecure
households
4.5-2 Number of jobs attributed to
FTF implementation (RiA)
Higher is better
3.1.9.1-3 and 4.7-4 Prevalence of
households with moderate or severe
hunger (RiA)
Lower is better
Result 2: Improved
community and
household resilience
3.1.9-16 Prevalence of underweight
children under 5 years of age (R)
Lower is better
3.1.9-13 Prevalence of underweight
women (R)
Lower is better
3.1.9-4 and 3.1.9.1-4 Prevalence of
exclusive breastfeeding of children
under 6 months of age (RiA)
Lower is better
3.1.9-11 Prevalence of stunted
children under 5 years of age (R)
Lower is better
4.5.2-14 Number of vulnerable
households benefiting directly from
USG assistance (S)
Lower is better
Result 3: Strengthened
enabling environment to
promote scale-up and
sustainability
4.5 Women’s Empowerment in
Agriculture Index Score (R)
Higher is better
4.5.1-27 and CBLD-5 Score, in
percent, of combined key areas of
organization capacity among USG
direct and indirect local
implementing partner levels
Higher is better
4.5.2-38 Value of new private-
sector investment in the agriculture
sector or food chain leveraged by
FtF implementation (RiA)
Higher is better

33
Table C. CFs used in the economic analysis of GRAD interventions in the red haricot beans value
chain
Summary of CFs
Red beans 1.07
Red beans seeds 1.07
Maize 1.02
Maize seeds 1.02
Transportation 0.84
Labor 1.00
Land 1.00
UREA 1.05
DAP 1.05