A CONTINUOUS CRYSTALLIZATION APPARATUS by Robert Leonard...
96
A continuous crystallization apparatus Item Type text; Thesis-Reproduction (electronic) Authors Abbott, Robert Leonard, 1941- Publisher The University of Arizona. Rights Copyright © is held by the author. Digital access to this material is made possible by the University Libraries, University of Arizona. Further transmission, reproduction or presentation (such as public display or performance) of protected items is prohibited except with permission of the author. Download date 27/07/2018 15:14:16 Link to Item http://hdl.handle.net/10150/318531
Transcript of A CONTINUOUS CRYSTALLIZATION APPARATUS by Robert Leonard...

A continuous crystallization apparatus
Item Type text; Thesis-Reproduction (electronic)
Authors Abbott, Robert Leonard, 1941-
Publisher The University of Arizona.
Rights Copyright © is held by the author. Digital access to this materialis made possible by the University Libraries, University of Arizona.Further transmission, reproduction or presentation (such aspublic display or performance) of protected items is prohibitedexcept with permission of the author.
Download date 27/07/2018 15:14:16
Link to Item http://hdl.handle.net/10150/318531

A CONTINUOUS CRYSTALLIZATION APPARATUS
byRobert Leonard Abbott, Jr.
A Thesis Submitted to the Faculty of theDEPARTMENT OF CHEMICAL ENGINEERING
In Partial Fulfillment of the Requirements For the Degree ofMASTER OF SCIENCE
In the Graduate CollegeTHE UNIVERSITY OF ARIZONA
1966


E4l^(
36Cx>p •
STATEMENT BY AUTHOR
This thesis has been submitted in partial fulfillment of requirements for an advanced degree at The University of Arizona and is deposited in the University Library to be made available to borrowers under rules of the Library.
Brief quotations from this thesis are allowable without special permission, provided that accurate acknowledgment of source is made. Requests for permission for extended quotation from or reproduction of this manuscript in whole or in part may be granted by the head of the major department or the Dean of the Graduate College when in his judgment the proposed use of the material is in the interests of scholarship. In all other instances, however, permission must be obtained from the author„
SIGNED 3 A U / CMU?
APPROVAL BY THESIS DIRECTOR This thesis has been approved on the date shown below:
EDWARD J. $REEH DateProfessor of Chemical Engineering

ACKNOWLEDGMENT
The author is indebted to the entire faculty of the Department of Chemical Engineering for their encouragement and assistance not only in preparing this thesis but in other academic work as well. Special appreciation is extended to Dr. Edward J. Freeh who, as director of this research, gave invaluable assistance in the completion of this project. The assistance given by Dr. James W. Hall, Dr. Raymond C. Richardson and Dr. Donald H. White during the early stages of this research was appreciated.
Thanks are also given to the Dairy Science Department for use of their equipment and the assistance of Mr. Ralph Taylor in its operation.
In addition the author wishes to thank his parents for their patience, encouragement and financial support which have made this work possible.

TABLE OF CONTENTS
PageLIST OF ILLUSTRATIONS. ..... viLIST OF TABLES .... viiiABSTRACT...... ...........................INTRODUCTION.........____............................. 1
General ........... 1Objective .... 2Fractional Crystallization.................... 3Theory ....... 16Nomenclature ..... 27
APPARATUS. .... 29Experimental Equipment ....... 29System Used......... 32.Analytical Equipment. .... 32
EXPERIMENTAL PROCEDURE .................. 35Column Startup .... 35Column Operation. .... 36Sampling...................................... 36
EXPERIMENTAL RESULTS AND DISCUSSION. ..... 38Experimental Equipment .... 38Computer Simulation........................... 43
CONCLUSIONS.........___ ......___ .................... 56
iv

TABLE OP CONTENTS--Continuedv
PageRECOMMENDATIONS....... 57APPENDIX A - DERIVATION OF HEAT AND MATERIAL BALANCEEQUATIONS.......... 60
Mass Balance....... 6lHeat Balance ..... 65
APPENDIX B - ANALOG COMPUTER CIRCUIT DIAGRAM ANDDETAILS. ........ 71
APPENDIX C - EXPERIMENTAL DATA. ..... 76LITERATURE CITED. ........ . 8l

LIST OF ILLUSTRATIONS
Figure Page1. A laboratory-scale fractional crystallization
column. ..... 42. A typical solid-liquid phase diagram for the
A-B system.. .... 63. A typical solid-liquid phase diagram with
solid solution used to describe theoperation of Phillips1 multi-stagefractional crystallization column............ 9
4. Phillips' para-xylene process. .... 135» Differential element over which heat and i
material balances are made................... 216. Experimental fractional crystallization
apparatus. .... 307. Solid-liquid phase diagram for the sucrose-
water system........ 348. Experimental temperature profile.......... ...» 399. Experimental and proposed monotonic
temperature profiles ..... 4410. The effect of experimental and monotonic
temperature profiles on system parameters.... 4511. The effect of the initial y on the sugar in
the melt ........ 4712. Relative values of mass transfer areas......... 4913. The effect of k a on the Initial concentration
of the liquid moving down the column......... 5014. The effect of on the concentration of the
liquid moving down the column. .... 52
vi

viiLIST OF ILLUSTRATIONS— Continued
Figure Page15. The effect of reflux rate on the concen
tration of the liquid moving down thecolumn. ...... 53
16. Analog computer circuit diagram for thefractional crystallization process........... 75

u.
LIST OF TABLES
Table * Page1. Some properties of ortho-, meta-, and
para-xylene 112. Conditions on the experimental run used in
the computer simulation of the fractional crystallization process...................... 77
3. Uncorrected temperature profiles whenapproaching equilibrium in the experimental fractional crystallization apparatus.................................... 78
4. • Thermocouple calibration....... 795. Values for constants and initial conditions
used in the computer simulation.............. 80
viii
n " ll ' ■ „ ; i IT

I
i . ABSTRACT
A preliminary engineering analysis of a continuous, pulsed, fractional crystallization column was conducted.A pilot fractional crystallization unit, except for control and sampling devices, was built and a mathematical representation of steady-state column operation was derived from heat and material balances. The derivation of the simulation equations is appended.
This model was applicable to the region of the column in which a temperature equilibrium exists between all streams. Values were assumed for the mass transfer and void space as a function of column length in the simulation as empirical data were not available. Both empirical and assumed values were used for the temperature profile,
The model was implemented on an analog computer and the most influential variables were determined to be the mass transfer, the compaction of the slurry, and the reflux up the column. The effect of reflux on the separation given by the model was non-linear.
Recommendations for improvements in the experimental equipment and the manner of operation are included.
ix

INTRODUCTION
General
The concentration of a liquid feedstock is often desired in many chemical processing operations. Some of the more common methods of concentrating such a feedstock are the unit operations of stagewise separation, evaporation, and crystallization. In evaporation, the desired product is usually the concentrated solution, but occasionally may be the evaporated solvent, as in the evaporation of seawater to produce potable water. If the unit operation of evaporation is continued until the solution becomes saturated, the solute may precipitate as a crystalline solid. Such an operation is referred to as crystallization. This method of separation was used by man in prehistoric times to produce salt from seawater.
There are three main types of crystallizers in use today (R-ll). The first type is one which precipitates crystals by cooling a hot concentrated solution. Pan crystallization and agitated batch crystallizers fall into this category. The second type causes crystallization by evaporation of a concentrated solution. Examples of this type are the salting evaporators and the Olso crystallizer. The third main type of crystallizer causes
1

precipitation of crystals by adiabatic evaporation and subsequent cooling of a solution of the substance to be crystallized. An example of this third type is the vacuum crystallizer. All of the above types may be operated continuously; however, the crystals formed are often separated by a centrifuge and then carefully.washed to remove any adsorbed liquid to obtain as pure a crystal as possible. The purity of the crystals in these processes is also dependent upon growing time (i.e., size).
Objective
The objectives of this work were twofold:a) the construction of an apparatus to
give operating experience which could be used in the design of a fully instrumented column, and
b) the development of a mathematical model of the fractional crystallization apparatus.
This model was developed in accordance with the theory that the purification in the column is effected by the decrease in void fraction in addition to the counter- current flow of the melted crystals.

3Fractional Crystallization
A new process called "continuous countercurrent fractional crystallization" by the Phillips Petroleum Company was invented in the late 19401s by P. M. Arnold (R-l, R-2). There are many variations in the equipment used to carry out Arnold's process (R-6, R-12, R-13, R-19, R-20, R-21, R-22, R-23), •
One of the first types of continuous fractional crystallizers was a laboratory-scale column of the type shown in Figure 1. A complete description of the process has been given by McKay (R-l6). The following is a brief summary of the process and will be used to describe fractional crystallization. The column shown in Figure 1 was charged with a "stiff and dry" slurry of the components to be. separated and/or concentrated. The use of a thick crystal slurry with a minimum of free liquid is the most important variable in this type of column (R-l6). A porous piston pushes the mixture down and compacts the crystalline bed while the mother liquor is drawn through the piston with the aid of a vacuum. As the piston is moved downward, a heater wrapped around the lower portion of the column melts the compacted crystal bed. The product in most cases is the high purity melt. The by-product concentrated liquid can be partially recycled or further concentrated in another processing step. When the piston

T h r o t t l e V a l v e A i r Supply
3 - W a y V a l v e
E x h a u s t
F l e x i b l e T u b e
2 P y r e x G l a s s P i p e , 1 8 " L ong
V a n a c
Porous Pist on
500 W a t t E l e c t r i c H e a t e r
M e t a l Spool 2 ” D i a m e t e r 6 " L ong
P r e s s u r e Ga u g e 0 - 5 0 P S I
l e e d l e f -I Valve
- H i g h - P u r i t y P r o d u c t
V a c u u m
M o t h e r L i q u o r R e c e i v e r
Figure 1 A laboratory-Bcale fractional crystallization column (R-16)

completes its stroke and empties the column of both concentrate and melt, it is raised and the column is again charged with slurry. This laboratory model has a concentration gradient in both the melt and the mother liquor with respect to time and is only a semi-continuous operation.
The advantage of using fractional crystallization in separation of a pure component can be seen from Figure2. This diagram shows a eutectic mixture of A and B.If the mixture lies to the left of the eutectic point (a), and is cooled to temperature (b), pure component A will precipitate out in equilibrium with a liquid of concentration (c). Many mixtures are difficult to separate because of similar boiling points or solubilities. The separation of an essentially pure component (assuming no solid solution of A and no occluded liquid on the crystals precipitating out) offers an easy means of separating hard to separate mixtures in one theoretical stage. No other separation process offers one hundred per cent separation in one step, even in theory.
The crystals produced by the scraped-surface chiller are small in size; however Findlay and Weedman (R-8) states "Because the crystals are purified of mother liquor by a countercurrent process rather than by draining as with a centrifuge, the size of the crystals is of minor

Tem
pera
ture
6
L i q u i d
L i q u i d * A
L i q u i d + B
C o m p o s i t i o n , W e i g h t P e r c e n t A
Figure 2 A typical solid-liquid phase diagram for the A - B system.

7importance. Hence less attention is given to the crystal forming step and crystal-growth tanks are eliminated."In later work. Dale and Malick (R-14) state that the crystal size and shape do play a part in the purification operation. These properties are a function of the bed porosity. A bed of low porosity may contain channeling caused by the countercurrent flow of liquid. Dale and Malick further state that the viscosity of the mother liquor has a greater effect than crystal size or shape in all concentration ranges and completely overshadows them above a concentration of forty weight per cent. In this research the crystal size was not changed and it will not be considered as an operational variable.
Systems which form solid solutions cannot be separated in one crystallization stage. Such a system with solid solution phases <*■ and 0 is shown in Figure 3.A method of achieving a complete separation in such a system in a reasonable time has been suggested by K. M. Hachmuth (R-7). Hachmuth proposed the cyclic application of high pressures to the crystals as a means of aiding the normally slow solid state diffusion. The application of pressure would increase the melting point of most crystals. This increase can be illustrated by the Clauslus- Clapeyron equation:
dT TAV (1)dF ^ " M f '

where: -Tp = the rate of change of temperature withphase-equilibrium pressure, °P/psi
AHf = latent heat, Dtu/lbAV = the change in specific volume accompanying
a phase change at a specific temperatureT, ft3/lb.
The alternate freezing and melting of the crystals thus produced would provide an excellent means of separating a pure product.
This method can be described with reference to Figure 3. If a liquid at the point (a) having a temperature tj is compressed to pressure P the phase diagram will "shift” (a) to (b), i.e., the diagram will move up, and a solid (c) will precipitate in equilibrium with liquid (b) at a temperature t + At because of the heat given off in the crystallization. The liquid at (b) is removed as completely as possible at near the maximum pressure and the crystals are melted to a liquid of composition (c) by removing the pressure P and "shifting" the diagram back down again. If no liquid had been removed the temperature would return to t ; however, since the liquid has been removed the temperature is lowered to t2 because of the heat absorbed by the melting crystals, and the mixture is at (d).
If t were initially at a lower temperature, the release of pressure may not give a liquid at (d) but could

L i q u i d
S h i f t at P r e s s u r e P
E►—
C o m p o s i t i o n , W e i g h t P e r c e n t A
Figure 3 A typical solid-liquid phase diagram with solid solution used to describe the operation of Phillips * multistage fractional crystallization column.

10give a mixture at (e). Since the concentrated mother liquor is drawn off at near the maximum pressure, and the system would solidify at this pressure, no more liquid would be removed by further pressurizing until the temperature at (e) is raised to a point where the "shift" of the phase diagram will produce a mixture at the maximum column pressure. ■
It is assumed here that the initial temperature was t and the temperature after the pressure release was tg at (d). The point (d) is then at a position in the diagram where it too would be solidified if pressure P were applied; however, inside the column the crystals are being pushed downward into a warmer temperature zone„At some point the temperature of (d) is increased past tj to ty Now the "shift" in the phase diagram will produce the same effect as before and the purification cycle can be repeated. If there had been no movement of the bed and heating of the crystals there would still be a purification of the crystals by a melting and re- freezing of the crystals alone.
It is likely that a combination of these two effects are responsible for the purification in a column of this type. It is realized that the shape of the phase diagram may not be the same after the "shift as before but it will be similar and is shown the same for purposes of illustration.

11The equipment used to produce this type of sepa
ration is similar to other fractional crystallization apparatus described later; however, there are two pulsing pistons. One piston pulses on a cycle of about one cycle per second as in the normal apparatus and the other provides the pressure on a cycle of about thirty seconds on and thirty seconds off. A flapper type check valve arrangement with porous checks removes the liquid at the appropriate time and keeps the pressure from backing up into the.crystal forming step. This method of separation will work only on systems in which the specific volume of the liquid is greater than that of the solid.
Fractional crystallization was first used commercially on a mixture of ortho-, meta-, and para-xylene.The melting and boiling points of these isomers are shown in Table 1.
Table 1Some Properties of ortho-, meta-, and para-xylene.
_______ Isomer________ Melting Point______ Boiling Pointo-xylene -54.2°F„ +282.4°F.
• m-xylene -13.3°F. +291.9°F.p-xylene +55.9^^" +281.9°$’.
It can be seen that It would be difficult to separate

12ortho-xylene from para-xylene by distillation and that crystallization is the logical separation step in such a process.
A schematic diagram of Phillips1 early crystallization process for the production of para-xylene is shown in Figure 4 (R-8). The xylene feed, composed of ortho-, meta-, and para-xylenes are cooled to about -40°F and then fed to a scraped-surface chiller. Here they are reduced to a slurry at a temperature of about -100°F.This slurry is sent to a rotary vacuum filter where the mother liquor is removed. The cake is then removed, melted and refrozen in another scraped-surface chiller to a slush at a temperature of 0 to -15°F. This slurry is introduced into the column where it is pulsed by a reciprocating piston at pressures up to 600 psig. The refluxed liquid is drawn off through a filter surrounding the column below the point of introduction of the feed.The remaining crystal bed is pushed down the column towards the heater where it is melted and withdrawn as product =Such a column is usually small when compared with the throughput. Early units were often from 2 to 6 inches in diameter and seldom exceeded three feet in height.Green (R-7) has reported capacities of 184 to 495 gallons of product/hr sq ft of column cross-sectional area while producing 99 mole per cent cyclohexane from a cyclo- hexane— isooctane feed mixture. Others (R-13, R~l8, R-2l)
13
M o t h e r L i q u o r
X y l e n eFeed 1 * 4 0 * F 00 F a
R o t a r yF i l t e r
S c r a p e d Su r f a c e C h i l l e r
M e t a , P a r a X y l e n e to f u r t h e r p r oc ess ing
P n e u m a t i c P u l s e r
M o t h e r L i q u o r R e c y c l e
{/ 0 t o - 1 5 #F
S c r a p e d S u r f a c e C h i l l e r
-✓poggwnT9 8 t %
P a r a - X y l e n e
H e a t e r
M e l tT a n k
Figure 4 Phillips1 para-xylene process.

14have produced para-xylene ranging from 98 to 99.6 mole per cent purity in the ortho-, meta-, para-xylene system.
The method of application of pulsation to the column is arbitrary. It may be applied to either the top or the bottom of the column. The pulse may be supplied by a plug piston, a porous piston, or a diaphram pump (R-l8). An important effect of the pulse is to provide an intermittent backwashing of the filter screen thereby keeping it from plugging (R-14). The column has also been operated in the horizontal as well as in the vertical position with favorable results (R-13, R-l8).
The process of fractional crystallization has been used in many food processes as well as on organic mixtures. Some food products that lend themselves to concentration by fractional crystallization are fruit juices, such as grape, pineapple, apple, orange, lemon, lime, tangerine, and grapefruit. Beverages such as milk, wine, beer, coffee, and tea as well as vegetable juices (R-4, R-6, R-15) have also been concentrated by this method. In arid areas potable water can be considered a food product. Findlay (R-10) describes a process in which fractional crystallization of seawater is used to produce potable water. Many of these products have been concentrated on a laboratory scale but their commercial usage has been limited. In the process of concentration of most food

15products (not water) the material of Interest is the mother liquor withdrawn as a concentrate, rather than the melted crystals.
In a binary two-phase mixture the liquid concentration depends on the temperature of the mixture. A mixture at the eutectic temperature will give a maximum strength concentrate; however, for a more- economic operation with a large throughput and sufficient concentration, multi-stage crystallization units operating above the eutectic temperature have been used (R-13).
In the fall of 1963 the Phillips Petroleum Company announced that Its process for concentrating beer was ready for commercial usage. In this process a two-stage concentration was used. The economic production of concentrated beer whose taste when reconstituted could not be distinguished from unconcentrated beer (R-5, R-14) Illustrates the feasibility of concentration of other food products mentioned above. Some food products may actually be better when concentrated by fractional crystallization. The taint given to milk and the loss of essence from citrus juices when concentrated by vacuum evaporation should be minimized by the use of low temperature fractional crystallization. The retention of the essences in citrus juice would abolish the need for over-concentration followed by the addition of either a.fresh juice or pulp cutback to restore the "natural" flavor.

16The use of fractional crystallization as a means
of separation and/or concentration of a mixed feed has not been used as widely as the method justifies. The equipment used in the process has had the emphasis placed on quantity and quality of the product rather than the theory behind it. As a result of this emphasis, the ' equipment, although it can be operated both successfully and economically, is usually quite inefficient. An engineering analysis of a semi-continuous fractional crystallization column of the type shown in Figure 4 has been made (R-8, R-24). The investigation of Yagi,Inoue, and Sakamoto (R-24) gives a good analysis of such an intermittent falling-piston column. The data for continuously operating columns of the pulsed piston type may be different because steady-state operation is closely approached in such a column.
Theory
There are two closely interrelated theories concerning the mechanism of separation in fractional crystallization, Green and other early investigators (R-7, R-13) believe that the following mechanism controls the separation. As the slurry enters the column and is pulsed downward, most of the concentrated mother liquor surrounding the crystals is removed through the filter as described

before, and the remaining crystals are compacted as they are pulsed toward the heater. The melt produced by the heater is partially withdrawn as product and partially forced countercurrent to the impure crystals just above the heater. The contact of the warm high-purity melt with these impure crystals causes a fractional melting of the crystals and partial refreezing of the reflux.' liquid. The high-purity separation of such a column is achieved in a section of the bed above the heater which. is usually less than eighteen inches long (R-7).
The separation of a very pure crystalline product in a centrifuge is prevented by the large amount of mother liquor occluded on the crystals. As much as one to ten pounds of mother liquor will occlude on one pound of pure crystals depending on the crystal size and shape. There are three main types of occlusion. An adsorbed layer on the crystal surface is one type, Another is the mother liquor entrapped within the crystal in small pockets. The third is the mother liquor which is held in a crystal mass by capillarity.
The countercurrent melting and refreezing which takes place in fractional crystallization removes all three types of occlusion (R-9). Separation in a centrifuge or filter removes only one, the portion of the material held by capillarity. The removal of all three

18types of occlusion in fractional crystallization results in a theoretically perfect stage of efficiency. This one hundred per cent stage efficiency can be compared to one of about thirty per cent for a centrifuge.
Another similar theory proposes that a simple "squeezing" of the crystalline bed is responsible for essentially all of the separation, rather than the refreezing of the crystals and countercurrent flow of the melt as proposed previously. The removal of the mother liquor causes a decrease in the void space surrounding the crystals. The void fraction, £ , decreases near the bottom of the column as the crystal bed is pulsed against the heater. There is a countercurrent flow of liquid in this case also, but it is caused almost entirely from the "squeezing" of the liquid concentrate from the crystalline bed and little of it is thought to be the warm melt. The compacted crystalline bed which is melted at the crystal-heater "interface" is composed of essentially pure crystals, therefore giving a pure component melt. There is some.remelting of the crystals and refreezing of the melt; however, this is believed to account for a small part of the total purification. The impurities in the product are a result of the liquid left in the void fraction and/or from-the occluded liquid on the crystals themselves.

A mass and an energy balance could be used to help analyze the separation mechanism In fractional crystallization. A heat balance could be used to determine whether there Is a countercurrent melting and re- freezlng of the crystals as well as countercurrent washing.
If recrystalllzatlon occurs In the system, the weight of recrystallized material within the column per unit weight of product can be given by the formula below:
(t -t ) C— ---& = refreezlng ratio (2)
where: t = freezing point of pure crystal, °F.t = temperature of the slurry feed to the c column, °F.
C = arithmetic average of the crystal heatp capacity between t and t , Btu/(lb) (°F).P c
AHf, = heat of fusion of the melted crystalline product, Btu/lb.
Such an analysis as the one described here has been done on an Intermittently pulsed column (R-16). This analysis shows an estimated refreezlng ratio of 1.9 pounds refrozen per pound of product for the cyclohexane— n-heptane system. With aqueous systems such a column usually operates best when the refreezlng ratio Is 0.02 to 0.10 pounds re- frozen per pound of product (R-14). The research" described here was done on a continuously pulsed column of the type used In the Phillips beer concentration process (R-14).

20.A material and. a heat balance can be made on the
differential element shown in Figure 5. These derive-'\ . tions, and the resulting equations, a%%given in Appendix A. The most readily measured variableVin a fractional crystallization column is the temperature gradient, ^(see Nomenclature at the end of this section for symbol definition).
The material and heat balances on the column are made for the portion of the column in which temperature equilibrium exists between the rising reflux stream and the falling liquid and solid streams. This area of operation will be discussed later. The material and heat balance equations are derived using the following simplifying assumptions:
l) The measured temperature is assumed to bean arithmetic mean of the solids temperature, tg, the temperature of the liquid carried with the solids, t , and the temperature of the refluxed liquid t . This assumption would seem to be valid because the low C caused by the high pressures and liquid removal in the column would cause the thermocouple to measure the solid as well as the liquid temperature.

L z + A z ' SKz + A z Sz + Az
L.Figure 5 Differential element over which heat
and material balances are made.

The liquid phase adsorbed on the solid is always in equilibrium with the crystal phase entering the column.The column is at steady-state.The heat input by radial and axial conduction is negligible.Plug flow of both liquid and crystals is assumed.The heat input to the incremental section is that entering with the solids, S, the reflux liquid, L( 1+C), where L is the refluxed water of sucrose concentration C, and the liquid traveling with the solids, Sy(1+A), where Sy is the descending water of sucrose concentration A.All solid is pure ice, but does carry with it a liquid equal to y times its own weight,S.All sufear moving down the column is included with the liquid Sy.The influence of the size or shape of the crystals on the separation process would be accounted for by the mass transfer coefficient k and the factor y; both of which are functionsB,of column height z.

2310) The transient effect of pressure pulsations
on column operation was not included; however, the gross effect of such pulsations uponthe purification can be approximated by their influence on the parameters ka and 7.
11) The liquid carried with the solid, S7, is in temperature equilibrium with the liquid rising at that point.
12) is approximately equal to (both enthalpies are of liquids of about the same temperature and concentration).
13) The enthalpy, H, is a function of temperature, pressure, and concentration. The effect of pressure on enthalpy was neglected. The effect of concentration on enthalpy, the heat of dilution, was found to be very small and was also neglected.
Using these assumptions, a mass balance on the water entering and leaving the incremental section now gives
l|z + 3(1+7) |z+Az = L|z+&z + S(l+7)|z (3)Dividing by Az and taking the limit as Az approaches zero
§ - s f f , ( n i l i < ->

2h
A rate balance on the sugar in the Sy (liquidmoving down the column with the solids, S) stream candetermine the rate of change of concentration of the
dAdownward moving sugar, ^ . Such a rate balance gives
H = 57 [kaa(A-C) 4- A g§"} (5)where k is a mass transfer term and a is the transfer area per unit volume.
A mass balance on the sugar entering and leaving the differential section gives
1X5L + srA lz+Az - l c U a z + s^ l z <6 >In differential equation notation (6) becomes
d(SyA) _ d(LC) (7)dz dz ' '
Further manipulation of this equation, given in Appendix A, will give
dCdz = i [(A-C) kQa + (A-C) (8)
A heat balance on the differential element shown in Figure 5 gives
L(1+C)Ht I + Sy( 1+A)H I + SH„|1 1 ' 'z+Az lz+Az
L(1+C)Ht I + Sy(l+A)H I + SHgl (9)>z+Az

25Manipulation and expansion of this expression results in
d(SHs ) d[_S7(l+A)H ] d[L(H-C)HL]dz dz 3z
If this equation is expanded and is solved for ^ wearrive at the equation
d[L(l+C)HL ] o d[_7(l+A)H73 dHsdS dz ^ dz ^ dzctz = 7(1+A)H_ + Kg
(10)
(11)
The assumption of temperature equilibrium has been made. This assumption will limit us to the portion of the column above the solid-liquid interface* where this temperature equilibrium actually exists. The greatest changes in a column of this type may occur in the area closer to the heater where these temperatures are not equal. The development of the equations for this case is given in Appendix A. The case given here is for the area in the column in which = tg = t .
The numerator of equation (11) can be expanded and simplified (see Appendix A) to give
dtN = | £ l (1+C) - S7(l+A)"] CPl - scps j at +
-sE(12)
* The solid-liquid interface referred to here may not be a definite boundary.

26
but from a sugar balance
d(LC) = d(SyA) f vdz dz
and from a water balance
dtdz
n*r> g ■ H - sg <»)therefore (12) can be written
N =£[L(1+C) - SyU+A)] - SCp V
H i { ( 1+ 7 ) s l + I # }and the complete solids gradient equation can now be simplified to
^ [ SyA - LC + Sy - L ] c pL + SCpjdS
" H ^ T r sdtdz
(15)
(16)
The sugar and water balances show the terms (S/A - LC) and (Sy - L) are constants. If these constants are used in (16) it can be reduced to the form
§ - <d - .s) g (17)
where
d = --- tbjLl) (18)(CpL - CpsH + AHf
in which f and b are defined in Appendix A, and

27
(CPL - CPS)e = — ---- =---=----- (19)
(CPL - CPs)t + AHfA more complete derivation of the previous equations is given in Appendix A.
Nomenclature
a mass transfer area, ft2/ft?A concentration of sugar in S7, lb/lb H^OC concentration of sugar in L, lb/lb H^O
°p heat capacity, Btu/(lb) (°P)
5p mean heat capacity, Btu/(lb) (°P)d defined by equation 18e = defined by equation 19
AHf heat of fusion, Btu/lbH enthalpy, Btu/lb
kap
mass transfer coefficient, lb water/(hr) (ft )L pure water up the column, lb/hrS — ice down the column, lb/hrt = temperature, °F
%c = temperature of the slurry feed to the column, °F
tP = freezing point of pure crystals, °Ft = average temperature, °PoC solid solution phase in Figure 3/? solid solution phase in Figure 3

7 = fractional amount of liquid HgO moving withlb HgO/lb ice
£ = void fraction within the column, ft^/ft^Subscripts:
L = liquidS = solidz = length in Figure ft
1,2,3 = temperatures in Figure 3.

APPARATUS
Experimental Equipment
The experimental fractional crystallization equipment used in this research is shown in Figure 6.This equipment was located in the Dairy Science Laboratory in the Agriculture Building at The University of Arizona„
The scraped-surface chiller used to supply the slurry was a Cherry-Burrell, Vogt Instant Freezer, model V-85. A three-way splitter valve with sanitary fittings provided a slurry bypass in the event that the capacity of the scraped-surface chiller exceeded that of the column. The slurry was then pumped into the column by a Moyno, model 6M1 type SDQ pump, with a variable speed electric drive. The pump was rated from 2 to 20 gallons per hour and from 100 to 400 psig. A slurry bypass was also provided on the high-pressure outlet of the Moyno pump.
The column itself was a two-inch diameter schedule 40 stainless steel pipe with '150 pound test' flanges welded on either end. The column dimensions are shown in Figure 6. It was 35 inches long from flange to flange. The column was tilted approximately 30 to 45 degrees from
29

Figure 6 Experimental fractional crystallization apparatus,

C o n c e n t r a t e R e m o v a l-HTo M o y n o pump
S c r e e n c o v e r e d t u b e
V a r i d r i v e M o y n o P u mp
< _ From Vo gt F r e e z e r
S l u r r y b y pass V a l v e s yTop F l a n g e P e t a l
C o n c e n t r a t eR e m o v a l
P u l s e P u mpP o t e n t i o m e t e r
T h e r m o c o u p l e s
H e a t e r"A V a r i a cM e l t R e m o v a l
P r e s s u r e G u a g eKw e l e c t r i c h e a t e r
C o m p l e t e A p p a r a t u s P r e s s u r e G u a g eC o l u m n a n g l e is 30° to 45° f r om h o r i z o n t a l .
To pulse pump
Swa ge lok F i t t i n g
* M e l t W i t h d r a w a lBot tom F l a n ge D e t a i l
o

horizontal. The top flange was mated with a flange which was tapped to provide for a 1/2-inch nipple and a 3/8-inch Swagelok tubing fitting. The Swagelok fitting was drilled- out to provide access for the 3/8-inch concentrate withdrawal tube. This tube had two 40-mesh stainless steel screens surrounding two 200-mesh stainless steel screens soldered in its end to prevent the slurry crystals from entering the tube. The tube was at a constant height,29 inches above the bottom flange. The pulse was applied through this tube„ The bottom flange was mated with a flange which had a l/2-inch by 2 1/2-inch nipple in it and a 1/4-inch nipple welded perpendicularly to the 1/4-inch pipe to make a tee 1 1/2-lriches from the flange. A Swagelok needle valve, used to control melt withdrawal, was attached to the 1/2-inch pipe on the bottom flange.The pulse pump was a Simplex model MD 1-23-56 (SM), 1000 psig pump, modified for pulsing by removing the two exit ball check valves.
A one kilowatt copper immersion heater 3/8-inchin diameter, was coiled into a spiral shape and the two
>leads were inserted through holes drilled in the bottom flange, The heater was silver-soldered to the flange andinserted into the column. A 40-mesh screen was wired onthe spiraled end of the heater to distribute the heat moreevenly. The heater was controlled by a Variac.

32The thermocouples used to measure temperature
gradients were copper-constantan thermocouples soldered to the side of the column at two-inch intervals from 6 to 24 inches from the bottom flange. The entire column was insulated with fiberglass insulation, A 600 psig - pressure gauge was provided at the bottom of the column as shown in Figure 6.
System Used
The sucrose-water system was used in this research. Initially this research was to be carried out on orange juice or another food product; however, the sucrose-water system is less expensive and its solid-liquid phase diagram can be assumed to be nearly like that of orange juice (R-l6). The ease of analysis by refractometrie techniques would make this a good system to use if concentration samples were to be taken. The solid-liquid phase diagram for sucrose-water is shown in Figure 7.
Analytical Equipment
The analysis of the sucrose-water samples used to determine equilibrium was done on a Bausch and Lomb refractometer, serial number HD 9663. The temperature profiles were taken with the thermocouples mentioned before and were recorded on a Leeds and Northrop Millivolt

Potentiometer, number 8690. The computer program was run on an Electronic Associates Inc. PACE 231R analog computer.

Tem
pera
ture
,(°F
)
34
E u t e c t i c P o i n t M e t a s t a b l e —
C o m p o s i t i o n , ( W e i g h t P e r ce nt S u c r o s e )
Figure 7 Solid-liquid phase diagram for the sucrose-water system.

EXPERIMENTAL PROCEDURE
Column Start-up
The start-up of the column may be a difficult task if care is not taken to Insure a smooth approach towards equilibrium conditions. The first thing done. during start-up was to make sure the column was full of sugar solution. This will permit start-up of the column while the liquid.is being replaced with slurry thus permitting a smoother start-up operation.
The melt removal valve was opened about half way and the Vogt freezer was turned on. The slurry bypass on the freezer was open during this step, completely bypassing all the slurry. The concentrate removal valve was closed and the pulse pump was off. The heater was then turned on and the Variac was adjusted to about 100 (full scale was 120). The high-pressure slurry bypass was open to prevent extreme pressures from occurring when the feed pump was turned on. The .pulse pump was turned on and allowed to pulse with the melt withdrawal valve partially open. When the feed reached the desired consistency, the input slurry bypass was throttled and the Moyno feed pump was turned on and its speed was adjusted
35

36to maintain the desired throughput to keep the pump feeding smoothly. The column was allowed to run in this manner while the heater setting and the withdrawal valves were manipulated to bring the column to equilibrium.
The pressure in the column was maintained by throttling the high-pressure slurry bypass valve. The composition and temperature of the entering slurry can be checked by sampling that part of the slurry which is bypassed after leaving the feed pump.
Column Operation
With the column in the condition described above the two withdrawal valves were watched closely and equilibrium was maintained by adjusting them in conjunction with the Variac. The pressure in the column cycled between 100 and 400 psig because of the intermittent pulsing superimposed upon the pressure maintained in the column. When apparent equilibrium had been reached the apparatus was ready for sampling.
Sampling
At steady-state melt and concentrate were coming out of their respective discharge lines continuously. Samples were taken of the concentrate and the melt to

determine the separation achieved. The slurry temperature and Variac setting were recorded. The withdrawal line flows were measured using graduated cylinders,
A temperature traverse of the column was also made and recorded. This was done by recording the temperatures measured by the thermocouples soldered on the column walls.
The shutdown of the apparatus was relatively simple. The Vogt freezer, Moyno pump, pulse pump, and heater were shut off. All withdrawal valves were closed. The Moyno pump was disconnected from the Vogt freezer and from the column. The Moyno pump was cleaned by running water through it until all sugar solution was removed. The column was left full of mother liquor and/or slurry to aid in start-up for another run.

EXPERIMENTAL RESULTS AND DISCUSSION
Experimental Equipment
The equipment used in this research was operable and gave some separation of the components of interest.The operation of the equipment was, however, somewhat difficult, usually requiring four people. The installation of automatic control devices and an adequate technique for sampling would simplify the operation of this column and greatly enhance the obtaining of valid data. Some suggestions are given on how to improve the column and its operation in the Recommendations section of this thesis.
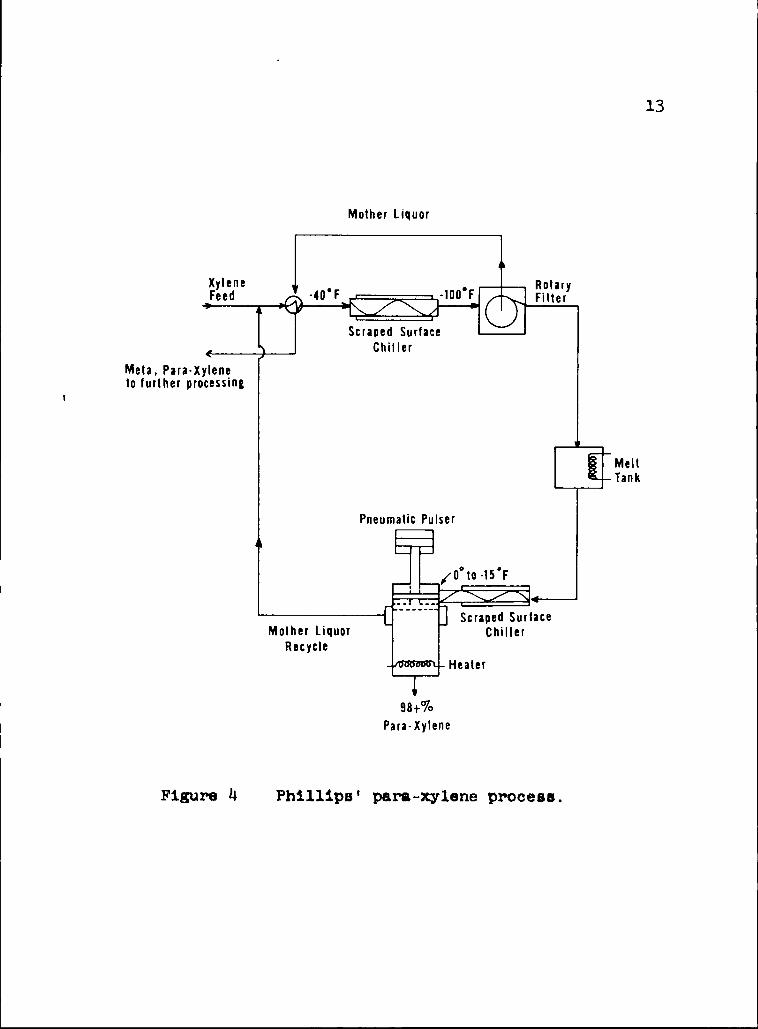
The temperature profile data taken are shown in Figure 8, in which the dashed portion has been extrapolated. This experimental profile shows a drop in the temperature of the slurry to a temperature below that of the feed and then an increase in temperature to that of the melt. At the present writing no clear-cut explanation of the unexpected temperature profile can be presented. The simulation indicated that the concentration difference between the rising and falling liquids may be large at the point where the column changes from cocurrent to countercurrent flow at the liquid withdrawal. It is
,

Tem
pera
ture
,39
Liquid W i t h d ra w a lU_
Feed Tempera ture
1.00 1.500.25
D is ta n ce f rom T e m p e r a t u r e E q u i l i b r a t i o n Po in t , Feet
Figure 8 Experimental temperature profile.
4opossible that the observed temperature depression is caused by this phenomenon. The experimental temperature profile was taken under the following conditions:
feed......... 23.8$ (wt.)concentrate 31.9$ (wt.)melt .... 10.7$ (wt.)
It can be seen that the column did not give a very goodseparation. This poor separation may be due to poor liquid removal, a non-equilibrium condition, or perhaps both.
The column was approaching thermal equilibrium when the semi-continuous three hour run was terminated because of the difficulty in maintaining a continuous slurry feed.
The filter area in industrial crystallization units of this type is much larger than the area in the experimental equipment used. A 6-inch diameter pulsed fractional crystallization column of the Phillips type has a circumferential withdrawal of at least seven inches in length in a column whose purification section is 18 inches long (R-3). The withdrawal area in the experimental column was probably small enough to cause radial gradients in the mother liquor composition near the filter area.
The crystals were separated from the mother liquor by two 200-mesh screens surrounded by two 40-mesh screens.

41The aperture of the 200-mesh screen is 74 microns while the crystals used are on the order of 200 to 300 microns in diameter. The double thickness of screens should have prevented any crystals from leaving with the mother liquor. This rather complete separation of liquid and crystals can be seen by the liquid concentration of 31.9 weight per cent from the column whose calculated mother liquor composition was 33 weight per cent. This data is shown in Table 2 in Appendix C.
The slurry used was of the consistency of a hard sherbert. The major problem in the experimental column operation was the non-continuous flow available to the column. The Vogt freezer supplied the slurry to the inlet of the Moyno pump at a pressure from 10 to 40 psig. The slurry was forced to make a 90° turn on entering the Moyno pump. The inlet pressure was great enough to supply a continuous flow of slurry through this turn only when the throughput of the Moyno pump was several times that of the column. When the throughput of the Moyno pump was the same as that of the column, the slurry would "bridge" in the inlet of the pump and the flow would cease. This "bridging" would tend to perturb the equilibrium in the column.
An attempt to correct the "bridging" problem was the installation of a Slurry bypass on the high-pressure .

42side of the column. The valve used on this bypass was a gate valve. This valve was not the best type to use but was chosen for several reasons. The available needle valves did not have the capacity needed for the application, a globe valve would cause the slurry to dewater and a diaphragm valve, which would seem to be the best choice, was not available. The gate valve used offered some control but was very nearly an "on-off" valve when used with the semi-solid slurry at high (200-400 psig) pressure.
Several methods were tried to prevent the "bridging" of the slurry at the pump inlet. An asbestos covered heating tape was wrapped around the pump entrance flange to cause surface melting of the slurry inside the flange and induce it to "slide" through the turn. This endeavor met with little success and the slurry would still "bridge" after a period of time. The application of steam to the outside portions of the system where "bridging" was suspected was tried but with limited success. The best method observed for continuous flow was the adequate control of the high-pressure bypass of the slurry with a large throughput in the Moyno pump.
The slurry supplied to the Moyno pump was not of uniform temperature (i.e.,, consistency). The variation in temperature made it difficult to control the feed into

the Moyne pump because of the resulting change in consistency. Also these changing properties of the slurry feed did not let the column approach steady-state.
Computer Simulation
The computer implemented analysis of the various streams in the column (here noted by letter symbols for simplicity) was done using a monotonic temperature profile. This temperature profile is shown, with the experimentally measured profile, in Figure 9* The monotonic profile decays from 32°F to 26.5°F, the boundary conditions of the experimental system. The changes in the values of C, L, A, and 3 over the length of the column that are caused by the use of the monotonic profile are small and are shown in Figure 10. The quantities showing the greatest change between the two different temperature profiles are S and A. The Scurve is strongly related to the temperature profile as
dSis shown by its defining equation and A includes , which can be interpreted here as dilution, in its equation. The quantity of liquid refluxed up the column is dependent largely upon a change in 7 (i.e., ^ ) which will be shown later, and only slightly upon the temperature profile in the range investigated. It may be seen from Figure 10 that a change in the temperature profile, even one as dramatic as the one shown in Figure 9, has relatively little effect

Tem
pera
ture
, °F
44
E x p e r i m e n t a
H e i g h t From T e m p e r a t u r e E q u ! P o i n t , F e e t
Figure 9 Experimental and proposed monotonic temperature profiles

45
0.30
0.25
CO
0.15o
0.07
t o
0.025.5
5.0
‘ P r o f i l e From E x p e r i m e n t a l l y M e a s u r e d T e m p e r a t u r e Is Top L i n e On E a c h P a i r Of C u r v e s
x_i
0.0 D i s t a n c e F ro m T e m p e r a t u r e E q u i l i b r a t i o n P o i n t , Feet
Figure 10 The effect of experimental and monotonictemperature profiles on system parameters.

on the simulated operation of the column in the region investigated. Except where mentioned, the values used in the computer simulation were those given in Table 5 of Appendix C. These values were not necessarily the values derived from the experimental column operation.
The variable A, the concentration of the sugar in the Sy stream, is a measure of the effectiveness of the sugar removal in the column. This variable will be observed as various other parameters in the system are changed.
This Investigation was made from the point where the experimentally measured temperature was 32°F to the point where the liquid was removed from the column. This point has been referred to as the temperature equilibration point (TEP) for convenience. If a definite interface actually exists, it may be at some position in the column other than at this point. The properties associated with this point are designated by a subscript zero.
The data in Figure 11 may be derived from a simple mass balance on the system at the interface. This figure shows that the concentration of sugar, kQ} in the down- coming stream is a greater function of yo in the range in which AQ is large. This data also confirms the intuit tive observation that for optimum separation yo should be kept to a minimum.

Suga
r Le
avin
g Ar
ea
Inve
stig
ated
, S}
fA/S
(ltt
f)*
Lb Su
gar/L
b H2
0 A n = 0.20
An = 0.05
Figure 11 The effect of the Initial y on the sugar In the melt.

48The value for A0 Is, among other things, dependent
upon the mass transfer term k a. An estimate of the available mass transfer area, a, based upon the crystal surface area per unit volume in an uncompacted sucrose-
p Owater slurry, has been given as about 10,000 ft /(ft slurry). A fractional crystallization column does not contain an uncompacted slurry and the available transfer area is reduced very much by the high compaction arid refreezing.This was confirmed visually in the pilot unit by observation of the extremely compact bed in the column immediately after operation had ceased. The ice crystals in the pilot unit were hexagonal crystals 200 to 300 microns in diameter (R-14),
The experimental data was analyzed by assuming that the value of a was one order of magnitude greater than that for a completely compacted slurry. This gives a value for a of 48 ft2/ft^. This mass transfer area is compared with that for an uneompacted slurry and that for a completely compacted slurry of minimum area in Figure 12. The experimentally measured values for k&a were 1 to 5 lb water/(ft^)(hr), The above value for a gives k& to be in the range of 0.021 to 0.105 lb water/(ft2)(hr)» No values for k were found for the sucrose-water system.
It can be seen from Figure 13 that an increase in k a (or an increase in k if a is assumed to remain constant)
ct a

49
ai a 2 a 3
1.0 10.0 100.0 1000.0 10,000.0
a, F t 2/ F t 3
a j = M i n i m u m M ass T r a n s f e r Area per F t 3
3 2 = E x p e r i m e n t a l T r a n s f e r A rea per F t 3
a 3 = U n c o m p a c t e d S lu r ry T r a n s f e r Area per F t 3
Figure 12 Relative values of mass transfer areas.

Ka3
. Lb
Wat
er/
(Ft3
)(Hr
)50
Ag, Lb S u g a r / Lb W a t e r
Figure 13 The effect of k^a on the Initialconcentration of the liquid moving down the column.

51will cause a considerable decrease in the amount of sugar in A0, a result of increased transfer from A to C in the reflux. The data here were derived by choosing the concentration of A at the liquid removal to be 0.30 lb sugar/ lb water. The value determined from the phase diagram for the experimental run was 0.33 li> sugar/lb water; however, some transfer between the LC and SyA streams was assumed to have taken place near the point of liquid removal in the choice of the value for A in the simulation.
Figure 14 shows the effect of a change in on the concentration of A at the point of liquid withdrawal, one and one-half feet from the TEP. In this simulation 70 is fixed. An increase in ^ caused a considerable decrease in the change in A across the column. The larger the 7 (or the greater the at the liquid withdrawal, the greater the amount of Syk carried down the column and as a result, A, which is lb sugar/lb water, will become greater. The value chosen for the simulated run was
= 0.10 or 7 changes from 0.05 at the TEP to a value of 0.20 at the liquid withdrawal.
Another variable that was investigated in the simulation was the amount of refluxed liquid. The effect of the reflux on A can be seen from Figure 15. This plot was derived by holding A^ (the A at the liquid withdrawal) constant at a value of 0.30 lb sugar/lb water and letting

, Lb
Suga
r/Lb
Wat
er52
.2 0 -
.05-
D i s t a n c e From T e m p e r a t u r e E q u i l i b r a t i o n Po in t , F e e t
Figure 14 The effect of ^ on the concentration of the liquid moving down the column.\

, Lb
Suga
r/Lb
Wat
er53
0.30
020
Curve N u m b e r L0 , L b / H o u r L 0 / S 0( H Y 0 )
1 0.5002 1.0003 2.1154 3.0005 4.000
0.15
0.0950.1900.4030.5710.762
0.10
0.05K a a » 2.0 Lb W a t e r / ( F t 3) ( H r )
0.00 L
D i s t a n c e From T e m p e r a t u r e E q u i l i b r a t i o n P o i n t , F e e t
Figure 15 The effect of reflux rate on theconcentration of the liquid moving down the column.

the value of A at the TEP be varied as a function of L„It can be seen that as less liquid is refluxed up the column, the concentration of the Sy stream changes less over the length of the column. The reflux value determined from the experimental data is 2.1 lb/hr. This value seems to be a good choice for the simulated run as Figure 15 shows that a further increase in reflux (curves 4 and 5) result in little increase in sugar removal for a relatively large loss of /'product" from the bottom of the column.The reflux in Figure 15 is given in terms of L and a reflux’ ratio of the liquid up the column divided by the solids plus the liquid down the column.
The computer analysis has been•limited to the portion of the column where temperature equilibrium had been reached between the solid ice, the liquid moving down with the ice and the refluxed liquid. The greatest changes in a column of this type may not take place in this region; however, this analysis will show the relative 'magnitudes of the changes that do take place. A similar analysis of such a column, in the region where tg 4 tj **t , could be made by using the appropriate equations in
dSAppendix A for . The use of these equations would require a knowledge of the temperatures of the respective streams. Measurement of these temperatures in an operating

column is very difficult. If such an analysis were made, a heat transfer coefficient could be used to determine the temperatures of the various streams from an average measured temperature. The determination of these coefficients and subsequent determination of the temperatures of the various streams should provide enough information to propose the behavior of such a column in the region where temperature equilibrium has not been reached.

CONCLUSIONS
A pilot fractional crystallization unit was constructed and,sufficient operating experience was obtained to provide a basis for recommendations concerning instrumentation, column design and the production and handling of the feed slurry. A Moyno pump will pump a continuous, high-pressure slurry feed if an adequate method for supplying the slurry to the pump inlet is provided. The liquid removal area in the experimental, column was much smaller than that in comparable units and may have given insufficient liquid withdrawal.
A representative mathematical model of a fractional crystallization column operating at steady-state in the temperature equilibrium zone has been developed and implemented on an analog computer. The most influential variables in the simulation were mass transfer, reflux rate and the void fraction in the column. As expected, the effect of reflux ratio on the sugar concentration of the descending liquid was non-linear. The model suggests that optimum reflux ratios lie in the reflux area near 0.40.
56

RECOMMENDATIONS
■ A better analysis of the mechanism involved in the separation of interest could be made if more'sophisticated equipment were devised. A method of sampling the solids within the column would be of great value in determining ' the decrease in void space within the column as well as the amount of solids present, A method for determining the liquid concentration as a function of height would also be very desirable. The difficulty of analysis of void fraction, concentration, solids, and liquid present within,the column at equilibrium conditions should not be underestimated. The removal of a sample of the bed, without destroying its desired physical characteristics before analysis, is very difficult. A good analysis method would make possible an easier and more complete analysis of fractional crystallization column operation,
A means of measuring the void fraction, ^ , is suggested. The section of the column of interest could be quickly frozen and removed as a core, sliced into sections, and representative melted samples of these sections could be obtained. The concentration of these melted samples- could be compared to that of the concentrate coming off at the time of freezing at that point
57

58and the amount of'solids could be determined. This method assumes a knowledge of the' amount of entrained sugar. • Density gradients could"perhaps be found by the use of radioactive tracers or sonic methods also.
The method of removal of the concentrate would be better if it. were done by a .screened section surrounding the column rather than by a tube in the center of the column. It should be noted that many of the operational units employ circumferential withdrawal of mother liquor.The samples for the concentration profile could be taken with a small adjustable tube in the center of the column but, as recommended above, a better method should be devised. The larger area of the circumferential withdrawal should give a better mother liquor separation.
Several other suggestions that may result in better column operation are the following:
1. A larger heating coil (present coil is 1 Kw):would increase the operation throughput of the column.
2. A better means, of feeding the Moyno pump would assure a constant feed to the column.- This was one of the most difficult problems encountered in the experimental work performed.
3. Automatic pressure controls on the column discharge valves would eliminate many

problems Involved In maintaining constant pressure In the column.
4. A controller on the slurry freezer could maintain a constant temperature for the slurry feed.
The temperature gradient across the column could be maintained by using a temperature sensing device to control the heater in the column. This would permit smooth column operation without constant adjustment of the withdrawal valves, assuming a constant flow of feed.
If these recommendations are followed, the operation of the column and the ease and accuracy of data taking should be greatly improved.
The computer program could be improved by usingcl t/other experimental gradients with and implementing
equations involving fewer assumptions. The use of equation (A-30) in Appendix A would not restrict the column to the portion above the TEP. , As mentioned before, these equations assume a knowledge of the temperatures of the streams L,S and S7 as a function of height in the column. This equation is also for the case where is not equal to H .A knowledge of the entrained sugar in the column would permit rederivation of the mass and energy balance equations for this case.

APPENDIX A
DERIVATION OF HEAT AND MATERIAL BALANCE EQUATIONS
60

61Mass Balance
A mass balance can be made on the differentialsection shown in Figure 5. The following assumptions will be made in the derivation of this balance:
1) The column is at steady state.2) The solid carries with it a liquid (H O)
equal to y times its own weight.3) The solid consists of ice.4) The liquid Sy being carried with the crystal
line mass has a sugar concentration of A lb sugar/lb H^O and represents all sugar moving down the column.
A mass balance on the sugar entering and leavingthe differential section gives (see Nomenclature in Introduction):
Now if we rearrange, divide by Az and take the limit as Az approaches zero, we get
(lc)z h (s7a )z+Az = (lc)z+Az + (S7A)z (A-l)
lim Az-> 0 Az
Xor
d(ySA) = d(LC) (A-3)dz ~ dz

The above equation, which will eventually give the concentration of sugar in the reflux liquid, 5. f will be left in this form for the present. It will be further reduced vjhen the equations needed to reduce it to the desired form have been derived.
A mass balance on the water entering and leaving the incremental section shown in Figure 5 gives
rearranging, dividing by Az and taking the limit as Az approaches zero gives
The rate of interfacial mass transfer between the sugar in the adsorbed liquid and the sugar in the liquid being refluxed (surrounding the crystals) can be given by
(A-4)
or
(A-6 )
which can be written as
(A-7)
r = ka(A-C) (A-8 )
where r is the rate in lb sugar/(hr) (ft'") and kQ is a mass

transfer coefficient in lb water/(hr)(ft2). A rate balanceis made on the S7 stream (see Figure 5) giving
(A-9)
where the term in brackets accounts for bulk flow. A- is the average A from z to z+Az and a is the crystal transfer area per unit length. If the above expression is divided by Az and the limit is taken as Az approaches zero, we get
A 4- S7 ^ = A ft( + A ^ + kaa(A-C) (A-13)
A Z [ S y |z+A2 - s r / z - SAz
(A-10)
or
(A-ll)
Inserting the expression given before for r we get
(A-12)
By expanding this equation we can write

Equation (A-3) can now be reduced to a usable by using the definitions of and — ■ . An expansion equation (A-3) gives
The defining equation for the liquid gradient can be written
d(S7 ) dL dSdz = d^ -
Inserting this equation into equation (A-15) gives
or
dCdz - i (» (g - D * =r i - = g)
d AFrom the definition of ^ we can write
^ at - A af - (A-C)kaaUsing the above equation we can write the equation
ai = i (A-C)kaa + (A-c) at^which is the desired form.
64formof
(A-15)
(A-16)
(A-17)
(A-18)
(A-19)
(A-20)

65Heat Balance
A heat balance, similar to the mass balance, can be made by using the assumptions to be listed here as well as those listed for the mass balance.
1) The heat input to the incremental section is that entering with the solids, (S), and the
^liquid traveling with the solids, (Sy), and the liquid up the column, L.
2) The heat input by longitudinal and radialconduction is considered to be negligible.This does not hold near the heater.
3) The area investigated is adiabatic.4) The enthalpy equals zero at zero temperature.5 ) The enthalpy, H, is a function of tempera
ture, pressure, and concentration. The effect of pressure on enthalpy was neglected. The effect of concentration on enthalpy, the heat of dilution, was found to be very small and was also neglected.
A heat balance on the differential element shown in Figure 5 gives
L(1+C)Hl + S 7 ( 1 + A ) H + SH„z 7 z+Az z+Az
(A-21)L(1+C)Ht + S 7 ( 1 + A ) H + SH„
L z+Az 7 z z

66Rearranging, dividing by Az and taking the limit as Azapproaches zero gives
f S H 1 - SHS |11m J ^'z+Az______ ^ zAz-> 0 J Az
(A-2=)Az
L(1+C)Ht | - L(1+C)Ht I•z+Az L l<
Azor
d(SHs ) d [S7(1+A)H I d rL(l+C)HL]T - + "-"dz.= - d2 ■ ~ (A'23)
By partially expanding the left side we can give
7 (i+a)hd £l( 1+C)H^] (A-24)
7dSdz dz
A term can be factored from the previous equationd [ l ( 1+0)11^ d p(l+A)Hyq dHg
dS dz dz dz / a oc \a? = -------------hs + A i+a)«7---------------- (A"25)
The derivatives in the numerator, N, of the above equation are partially expanded to give

67
N = L( 1+C) _ S % _
S(l+A)y % - SHy ■ (A"26)
The derivative of the enthalpy, H, can be represented in terms of and t by
I- = CP at (A-27)Now equation (A-2 6 ) is written
dt, dtN - L(i+c)cp^ - s(x+A)rc -al -
. SCPS % - „,s -IjUiifl. + » W u ^ <,-28)
If the terms of this equation are expanded
dt, dtN = L(1+C)CP l ^ | - S(l+A)7 Cp_ - Z
7
or
SCP3 "g| - H7S 3z ' HyS + (A-29)
»L i * »L dt, dt_ - dto
N = L(H-C)-^ - S(l+A)7Cp^ -g| - scps-g^
", * s 44# } + \ [n» (A-30)

68This equation can be inserted Into the numerator of (A-25) to give the solids gradient in terms of the temperatures of the different streams, t^, tg and t . We now assume that = tg = ty. This is not true near the bottom of the column. Therefore the equation now derived will be valid only where the reflux liquid (S7 ) has cooled to, or very near to, the temperature of the solids. Also, the enthalpy of the liquid is assumed to be equal to that of the adsorbed liquid With these assumptions equation(A-3 0 ) reduces to
(A-31)
N - jjl.t 1>C) - S(l+A)y] - 3Cp \
\ { $ k » ^ ^ = g ]
We recall from the water balance equation that
a§ - 3 af = (1+7) a# (A'32)and from the sugar balance equation
- 3 = 7A § (A-33)If these equations are inserted into the numerator equation just given
N - {\t-! IIC) - S(1+A}t] cPl - sc % || +
hl [rA i » («) g]

69This equation is put back into equation (A-25) and we get
dS - sU +A)^>pL - sc p3 II + H^rAff + i + rgf]a ? = — - - - - h~” 7Ti+atr;- - - - - - - - - - - - -Collecting the terms gives
fHs + - V L - hl1 i =
{ t ( ^ c ) - s(i+a )7] cPl - s c A ^ i
or
(HS " hl) at^L(1+C)CPl - s [7(1+A)CPl + cp^ \ dt
dz
which can also be written
[L(1+C>CpL - 3 [7(1+A)CP l + Cp^ f f
(A-35)
(A-36)
(A-37)
1 = ------- - n q _ h l ■ ... -J;----- (A-38)
This term can be rearranged to giveffcsrA-LC) + (sr-L)lc + sc 1 §|
S ’ HL -H3 PL '«»>
The simple sugar and water balances give the net sugar down the column to be
SyA - LG = f (A-40)

and the net water down the column to be
3 ( 7 + 1) - L = b (A-4l)where f and b are constants for a given set of operating conditions. The solids gradient equation now reduces to
|(f+b-S)C 4- SCpJj ||i - H, - ns — -
We can assume the difference is essentially constant,that is [(CpLt + AHf) - Cp^t] is constant over the small temperature range of interest. With this assumption we can call
(£. t. Pi------ = d = constant (A-43)- C
PL PSand
(CPL - V(CPL - * “ r
= e = constant (A-44)
and the solids gradient equation is given by the expression

APPENDIX B
ANALOG COMPUTER CIRCUIT DIAGRAM AND DETAILS
71

• 72.V;;Ls An analog computer program was prepared for the
fractional crystallization process and was Implemented on an Electronic Associates Inc. PACE 231R analog computer. The program was written to provide concentration, reflux liquid, solid, and liquid carried with the solids profiles
(1 tvas output from , the temperature profile, a mass transfer term profile and ^ ,.the derivative of the liquid carried with the solids. The gradient ^ was fed into the computer assuming several different slopes on different runs. The quantity of liquid carried with the solid in the feed was initially assumed to be 10$ of the total solids, S. The assumption of 10$ liquid carried with the solids has been used by Dale and Malick (R-lA). Constant values needed in the program are the heat capacities of ice and sugar solutions and the heat of fusion of water. These data and the values used for the other parameters in the simulation are shown in Table 5 of Appendix C. The mean heat capacities of CpL and Cp^ (see Nomenclature in Introduction for definition of terms) are assumed to be equal to Cp^ and Cpg respectively and are assumed to be constant over the range of interest.
The temperatures .t and t^ were nearly equal to t in the range investigated and were assumed to be the same. This, as mentioned before, is only valid in the range where the temperatures of the countercurrent streams have reached

73equilibrium. The warm melt entering the compacted section is cooled to the temperature of the crystals quickly because of the small void fraction in the bed. This small void space would cause the liquid to follow a torturous path, cooling it quickly to a uniform temperature, t.
The equations used in the computer implementation are derived in Appendix A and are listed below:
a! “ s af + at (^-i)dCdz = £ ^(A-C)k^a + (A-C) (B-2)
dAdz “ S7~ [(A-C)kaa + A (B-3)
3# = (d - ^ (B-4)
and the final three equations, not derived before, are*
a£ = fi M (s-5)
at = f2 (z) (B"6)d(k a)— 3 - = 3 (2) (B-7)
In the above equations f^ was assumed to be constant over the column giving a linear increase in 7 . The value for f2

was taken from arbitrary and empirical data and was assumed to be equal to zero, giving a constant k a. The unsealed schematic circuit diagram for the computer simulation is given in Figure 16.
The derivation of the experimentally measured temperature was calculated and introduced into the computer using a variable diode function generator.
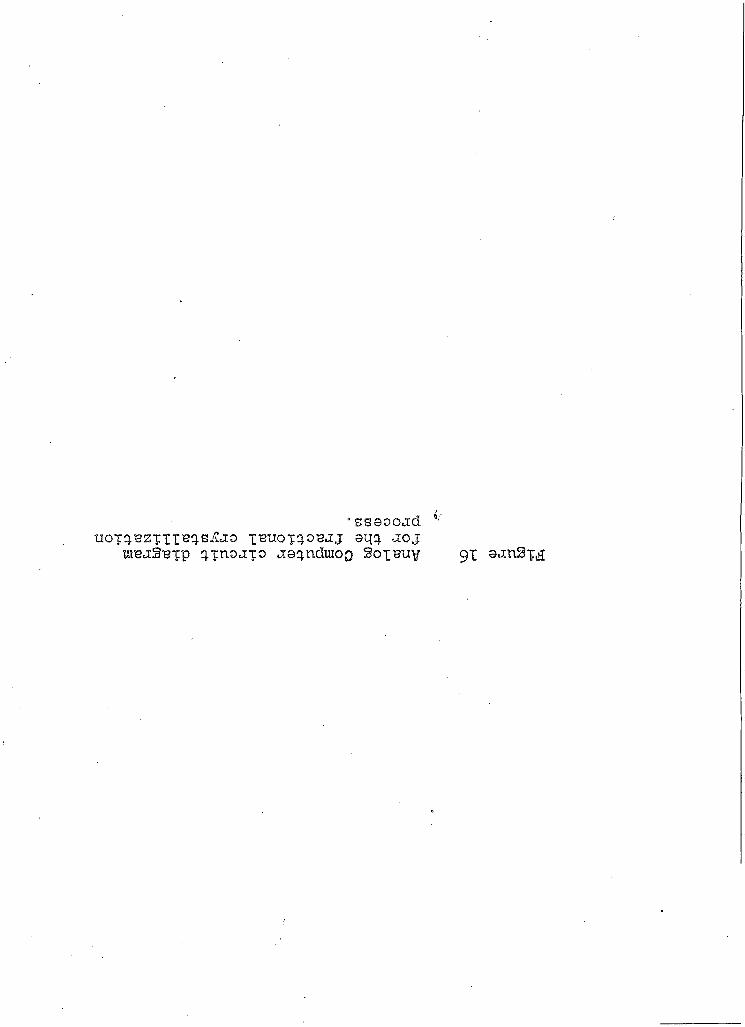
*ssaooad v uof^BZftXB^S-^to xm ox^OBJj aqq. a o j
uiBaSyxP q ino jp o aaqncLraog So ib u v 91 ajnSxa

n(AC)QSM 1
Q S M 2
-K,a(A-C) -(K,a(A-CMA-C)di)s 4i
n xQSM 3>
QSM 4Q S M 5
QSM 6
KE YQ S M Q u a r t e t S q u a r e M u l t i p l i e r D F G D i o d e F u n c t i o n G e n e r a t o r S F S c a l e Fa ct or
- R E FR EF , QSM 7
- R E F , Q S M 8
( d - s e j - ( d - s e )
I
APPENDIX C
EXPERIMENTAL DATA
76

77
Table 2
Conditions on the experimental run used in the computer simulation of the fractional
crystallization process*.
Feed rateSolids rateConcentrate rate
Refluxed melt rateEquilibrium concentrate composition (from phase diagram)
Actual concentrate compositionMelt compositionAverage slurry compositionSlurry
3.11 gph 0.64 gph, (29$)2.47 gph, (7lfo)0.24 gph
33# (wt # sucrose) • 31.9# (wt # sucrose) 10.7# (wt # sucrose) 23.8# (wt # sucrose) 26.5°F
* The run used in the simulation was the run taken after 101 minutes of operation. The temperature data for this run is shown in Table 3 and is plotted in Figure 8.

Table 3 .Uncorrected* temperature profiles when approaching equilibrium in the. experimental fractional crystallization apparatus
inches above heater______ 0 2 . 4_____ 6_____ 8 10 12 14 16____ 18
" Thermocouple output, MillivoltsTime ^
0 4-1.91 -0.08 -0.,10 -0.09 -0. 13 -0, 13 -0. 13 -0. 13 -0,,11 -0.,105 +i. 57 -0.04 -0..13 -0. 11 -0. 15 -0..15 -0. 13 -0. 13 -0.,12 -0. 1213 +0.18 -0.07 ~Q.,14 -0»11 -0. 14 -0..15 -0.15 -0. 16 -0.,16 -0..1541 +i.46 -0.14 -0.,20 -0 «17 -0.20 -0.,20 -0.21 -0.22 ~0., 22 -0.,2049 +i.40 -0.16 -0.,19 -0.17 —o «21 -0..22 -0. 23 -0.23 -0,.22 -0,,2174 -i-2.34 +2.21 +0.,33 -0.20 —0.26 -0., 26 -0. 28 -0.28 -0., 26 -0,.25101 + 2.10 +1.72 -0.,11 -0 o20 -0.27 -0..27 -0.29 -0.29 -0.,28 -0.,27114 + 1.83 +1.14 +0..23 -0.01 -0.24 +0,,08 -0.17 -0.26 -0.,26 -0,; 26
Reference Junction = yH°J? .Time ____ 0 5 13 41 49 74 101 114(min) 'Room Temperature 74.0 74.0 75.0 76.0 77.0 78.0 80.0 80.0(0P)
* Thermoccuple calibration correction included.

79
Table 4 Thermocouple Calibration.
Thermocouple Millivolts at 32°F
1 0.000
2 , 0.000
3 0.000
4 0.030
5 0.000
6 0.000
7 0.000
8 0.005
9 0.000
10 0.000
of Arizona Ltat|

80
Table 5Values for constants and initial conditions used
in the computer simulation
Constant Value
CPL(average) 0.86 Btu/(lb)(°P)
(average) 0.50 Btu/(lb)(°F)
AHf 144.0 Btu/lb
L 2.115 lb/hrC 0.02 lb sugar/lb waterA 0.15 lb sugar/lb waterS 5.0 lb/hr7 0.05
ai 0.10 ft'1
kaa 2.0 lb wateiy(ft^)(hr)

LITERATURE CITED
(R-l) Arnold, P.M. (to Phillips Petroleum Company) Continuous Extractive Crystallisation Process U.S. Patent 2,540,083 (February 6, 1951)„
(R-2) Arnold, P.M. (to Phillips Petroleum Company) Continuous Fractional Crystallisation Process U.S. Patent 2,540,977 (February 6, 1951).
(R-3) Buell, C.K.(Manager, Development Division, Phillips Petroleum Company)Personal communication (September 21, 1965).
(R-4) Editorial StaffFreeze ConcentrationFood Engr. Mag. 35, No. 2, 75, 1963.
(R-5) Editorial StaffKonzentratbier aus den U.S.A. fuhrte selbst Experten aufs GlatteisRuhr Nachrichten, newspaper, Dortmund, Germany, Friday, June 12, 1964.
(R-6) Findlay, R.A. (to Phillips Petroleum Company) Separation by Crystallization U.S. Patent 2,895,835 (July 21, 1959).
(R-7) Findlay, R.A. and McKay, D.L.Reaction Kinetics and Unit Operations Chem. Eng. Progr. Symposium Ser., 55, No. 25, 174-177, 1962.
(R-8) Findlay, R.A. and Weedman, J.A.Separation by Crystallizationin "Advances in Petroleum Chemistry and Refining" vol. 1, pp. 164-165, Interscience, New York, 1957.
81

(R-9) Ibid., p. 153.
(R-10) Findlay, R.A. (to Phillips Petroleum Company) Desalting SeawaterU.S. Patent 3,017,752 (January 23, 1962).
(R-ll) Foust, A.S., others"Principles of Unit Operations" P. 371, Wiley, New York, i960.
(R-12) Green, R.M. (to Phillips Petroleum Company) Crystal Purification Process and Apparatus U.S. Patent 2,765,921 (October 9, 1956).
(R-13) Green, R.M. (to Phillips Petroleum Company)Fractional Crystallization Process and Apparatus U.S. Patent 2,815,364 (December 3, 1957).
(R-14) Maliclc, E.A. and Dale, G.E.Studies of Concentrated and Reconstituted Beefs Paper presented May 6, 1964, at the Annual Convention of American Society of Brewing Chemists, New York, by Phillips Petroleum Company.
(R-15) McKay, D.L. (to Phillips Petroleum Company) Crystal PurificationU.S. Patent 2,815,388 (December 3, 1957).
(R-l6) McKay, D.L., othersA Bench-Scale Crystallization Purification Column Ind. Eng. Chem. 52, No. 3, pp. 197-200, i960.
(R-17) Mullin, J.W."Crystallization"pp. 145-146, Butterworths, London, 1961.
(R-l8) Thomas, R.W. (to Phillips Petroleum Company) Process for Purification of Crystals U.S. Patent 2,854,494 (September 30, 1958).

(R-19) Weedman, J.A. (fco Phillips Petroleum Company) Crystal Purification Process U.S. Patent 2,747,001 (May 22, 1956).
(R-20) Weedman, J.A. (to Phillips Petroleum Company) Crystal Purification Process U.S. Patent 2,813,099 (November 12, 1957).
(R-21) Weedman, J.A. (to Phillips Petroleum Company) Separation by Crystallization U.S. Patent 2,868,830 (January 13, 1959).
(R-22) Weedman, J.A. (to Phillips Petroleum Company) Apparatus for Separation and Purification U.S. Patent 2,903,343 (September 8, 1959).
(R-23) Weedman, J.A. (to Phillips Petroleum Company) Separation by Crystallization U.S. Patent 2,981,773 (April 25, 1961).
(R-24) Yagi, S., othersInvestigation of Countercurrent Crystallization Purification ApparatusKagaku Kogaku, Soc. Chem. Engrs., Japan, 1_, No.115-121, 1963.