A computer tool based on synthetic biology approach to design ... · A computer tool based on...
77
A computer tool based on synthetic biology approach to design microorganisms and bio-based processes São Paulo, October 26, 2010. Prof. Dr. Rubens Maciel Filho State of University of Campinas- Unicamp School of Chemical Engineering Laboratory of Optimization, Design and Advanced Process Control
Transcript of A computer tool based on synthetic biology approach to design ... · A computer tool based on...

A computer tool based on synthetic biology
approach to design microorganisms and
bio-based processes
São Paulo, October 26, 2010.
Prof. Dr. Rubens Maciel Filho
State of University of Campinas- UnicampSchool of Chemical Engineering
Laboratory of Optimization, Design and Advanced Process Control

An Integrated Process for Total Bioethanol Production and Zero CO2 Emission

Real Challenge
Integration of scientific basis with engineering concepts through sophisticated
mathematical and computer tools and experimental data collecting
for all the needed steps
From microorganism model to large scale plant operation, with proposition
of integrated alternative routes and alternative processes for fermentation
and bioethanol separation high efficient plants

COMPUTATIONAL TOOLS
Advances in computational tools and numerical analysis provide
opportunities to develop larger and more realistic models with a wider range
of modeling capabilities.
A guide line to take decisions when multivariability and complex variable
interaction there exist, as the case of metabolic pathways in microorganisms.
Use of Computer Aided and Process Engineering (CAPE) procedures to
have a systematic approach to define the main phenomena taking place in
the microorganism when the whole process is considered
Rational solution among possible options (if that is the case) for the
definition of operational conditions
Achieve a working, in the engineering basis,
microorganism in terms of performance and stability

COMPUTATIONAL TOOLS
•Mathematical models serve as a process knowledge management
• allows to investigate interactions that can be difficult if not
impossible, to view and/or provide only with the experiments,
especially when many factors vary simultaneously.
•Modeling of fermentation processes: mathematical equations -
mass/energy balances for each component in the bioreactor,
coupled with complex biochemical transformations taking into
account the rate with which these transformations take place.

COMPUTATIONAL TOOLS
To simulate a process is necessary:
•A mathematical model that can reproduce, as closely as
possible, the process behavior under various conditions
•To identify and to represent the main phenomena that occur in
the process.
•Reasonable process data
•To have an understanding of the interplay between the
numerous and interconnected reactions responsible for making
it possible for cells to survive and reproduce i.e. the physiology
of the microorganism.


ANHYDRIDE OF THE BIOETHANOL
PRODUCTION PROCESS FROM SUGARCANE

Fermentation


Mass balance equations and reaction rate of the model
eglufeed
egluSSDXRR
t
Scos71
cos
adeacetaldehy
edeacetaldehyiglu
eglu
ea
heglu
eglu
ha
leglu
eglu
l XsKsKs
skX
Ks
skX
Ks
skR
11
cos
1
1cos
cos
1
1cos
cos
111
a
eglu
egluX
Ks
skR
7cos
cos
77
pyruvate
pyruvateSDXRRR
t
S321978.0
a
egluipyruvate
pyruvateX
sKKs
skR
1
1
cos22
22
a
pyruvate
pyruvateX
Ks
skR
3
4
4
33

REQUIREMENTS FOR REAL WORLD APPLICATIONS
xy velocity
field
Concerns to be considered:
Energy spend to stirr
Microorganis maintenance
Well distributed flow (perfect
mixed system)
Conversion achieved and
Concentration, rate of reaction
How much will cost to
separate - To be price
competitive 0,05 US$ /Kg
Costs to sterilize the leaving
streams
Existing GMO based
processes are not competitive
Better design of the GMO
microorganisms are required
Real world – Fermentors 1.500.000 liters (12) 43 thousands ton sugar cane/day

Without a
rational
procedure
Decisions may
be difficult, time
consuming and
too late when
alternative but not
necessarily better
solution is
implemented
is the focus
It is possible to
propose and
evaluate
systematic
procedures to
attack the problem
General objective
of this work
Near Brussels

•Problem identification (where is the bottle neck/restriction)
•Rational Solution among possible options (if that is the case)
•Data collection for computer tools use
•Appropriated Computer Aided Design Tool
•Computer Aided Design of the microorganism taking into account
the physiology to built-up the model (virtual microorganism)
•Evaluation of the model / functional model
•Development of the guidelines either for genetic modified
microorganisms or to stimulate genetic changes naturally
•Optimize the process to achieve high operational performance –
high conversion, higher concentration and large throughput
Proposed Pathways

Brazilian Production Season 2008/2009
569.062.629 ton of sugarcane
27.512.962 thousand liters of ethanol (larger world
exporter)
9.336.343 thousand liters of anhydrous ethanol
18.176.619 thousand liters of hydrous ethanol
31.049.206 ton of sugar (larger world producer)
SUGARCANE – As Raw Material

17
Sugarcane Expansion Potential
2.66Sugarcane for ethanol
0.15Each million kl of ethanol needs
Sugarcane uses less than 0.32% of arable land
90.0Available area for crop
expansion
5.34Sugarcane
60.40all crops
Cultivated land:
320Total arable land
850Brazil
Million ha

18
Sugar
Glycose
Sacarose
FE
RM
EN
TA
TIO
N
Ethanol
Acetic acid
Lactic Acid
butanol Acetone ethanol
CH
EM
ICA
L S
YN
TH
ES
IS
Acetaldhyde
Anhydride acetic
Ethyl Acetate
Vinyl Acetate
Crotonaldhyde
Paraldhyde
Butanol
Buthyl Acetate
Piridine
Nicotinamide
Glycol
Butadiene
Glyoxalate
Succinic acid
Biorefinery Concept: Some Chemical Products via fermentation
Learning curve already competitive
fermentação

19
Etilene
Ethanol
Acetaldehyde
Acetic acid
Propene
Propylene
___Acrylic Acid
Glycerol
Lactic acid
Butadiene
Butanodiol
Succinic acid
BIOMASSH
YD
RO
LY
SIS
Sugar
Glycose
Sacarose
Xylose
Arabynose
FE
RM
EN
TA
TIO
N
Other Products to be obtained from biomass
Learning curve costs have to be reduced

20
Alchoholchemistry Products
Ethanol
Propylene
Acetaldehyde
Ethylene
Acetic Acid
Ethylene-Dichloride
Styrene
Vinyl Acetate
Ethylenediamine
Acetic Anhydride
MonochloroaceticAcid
Ethyl + Other Acetates
2-Ethylhexanol
N-Butanol
Ethylene Oxide/Glycol
Polyethylene
Butadiene
Polyvinil Acetate
Polyvinyl Chloride
Polystyrene
Crotonaldehyde N-Butyral-Dehyde
Ketene
Vinyl Chloride

COMPUTATIONAL TOOLS-
Possible approach
The fermentation models can be divided in four groups depending on
the level of detail in the model: unstructured model; segregated and
non segregated population; structured model.
Unstructured Structured
No
n-S
egre
gat
ed
Cell population is assumed to
be completely homogeneous
Cell multicomponent
description
Seg
reg
ated
Single component
Heterogeneous single cells
Multicomponent
Description of the heterogeneity
of cell by cell
Balanced growth
Cell average
approximation
Balanced growth
Cell average
approximation
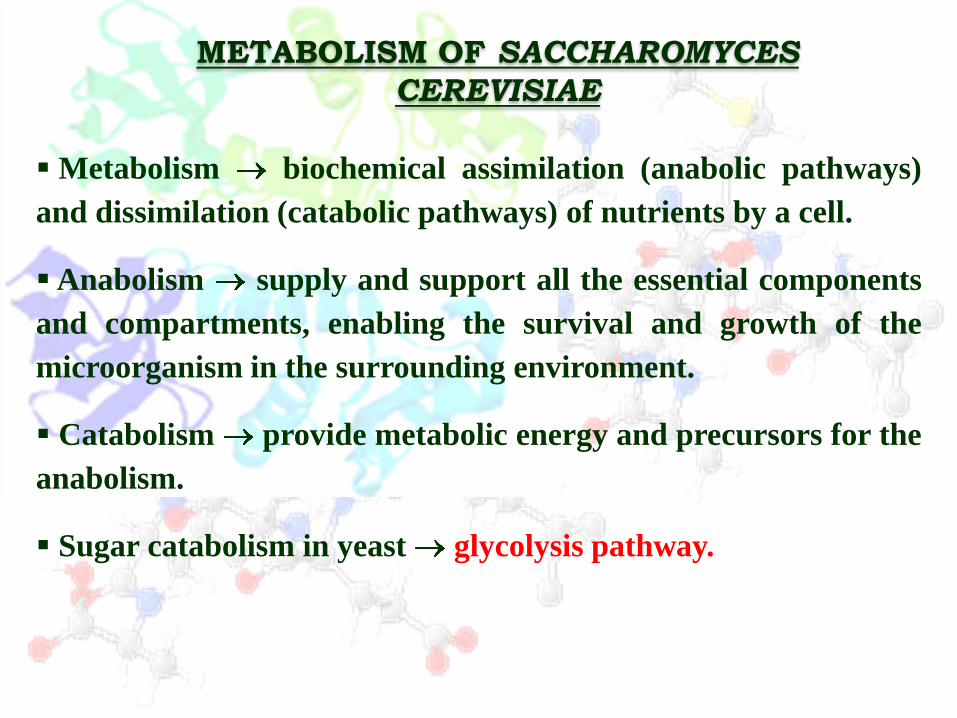
METABOLISM OF SACCHAROMYCES
CEREVISIAE
Metabolism biochemical assimilation (anabolic pathways)
and dissimilation (catabolic pathways) of nutrients by a cell.
Anabolism supply and support all the essential components
and compartments, enabling the survival and growth of the
microorganism in the surrounding environment.
Catabolism provide metabolic energy and precursors for the
anabolism.
Sugar catabolism in yeast glycolysis pathway.

It is used to describe the main pathways dissimilation glucose 6-
phosphate Embden-Meyerhoff-Parnas (EMP) and Pentose
Phosphate (PP) pathways.
EMP is considered the primary route for dissimilation of glucose to
pyruvate during aerobic growth on a glucose-limited substrate.
PP pathway has been recognized to serve both an oxidative as well
as an anaplerotic function.
GLYCOLYSIS
HNADHATPpyruvateNADPADPeglu i 2 2 2 2 2 2 2 cos
HNADPHCONADPphosphateeglu 21 12 6 21 6 cos 2
HNADPHCO-phosphateriboseNADPphosphateeglu 2 2 5 2 6 cos 2

METABOLISM OF SACCHAROMYCES
CEREVISIAE
Membranes – Which are the limitations ?

Glucose
glucose-6-phosphate
fructose-6-
phosphate
fructose-1,6-diphosphate
1,3-
diphosphoglycerate
2 pyruvate
ADP
dihydroxyacetone-
phosphate
3-phosphoglycerate
2-phosphoenolpyruvate
ATP
ADPATP
2-phosphoglycerate
2ATP2ADP
2ATP2ADP
2NAD+
2NADH+2H+
acetyl-phosphate
Acetyl-CoA
Acetaldehyde
NAD+
NAD+
Glucose
glucose-6-phosphate
6-phosphogluconate
ribulose-5-phosphate
ADPATP
ADPATP
pentoses
xylulose-5-phosphate
glyceraldehyde-3-
phosphate
TCA cycleLactic acid
NADH
NADH
Ethanol
Acetic acid
CO2
(EMP)
(PP)

Ethanol fermentation
Glycolitic route and Krebs Cycle
Aerobic oxidation
ENERGY BALANCE OF SACCHAROMYCES CEREVISIAE
ATPOHCOOHHCADPPOHC i 2 2 2 2 22 22526126
3ATP O4H 2 O2
1 3 3 22 NADPADPHNADH i
2 FADHEFumarateFADESuccinate
Phosphorilation
Pyruvate
OHADPPPyruvate i 222 17 15ATP CO3 15 15 .5O2
OHATPC 2i6126 2 2 2H 2NADH 2Pyruvate 2NAD 2ADP P2 OH
OHATPCOADPPOPyruvate i 222 34 30 6 30 30 5 2
OHATPCOADPPOC i 2226126 42 36 2 36 36 6 OH

NUTRIENTES FOR GROWTH OF YEAST
Substrate Intermediates Enzymes Products
Sucrose Invertase Glucose + Fructose
Maltose Maltase Glucose
Melibiose Melibiase Glucose + Galactose
Glucose Glucose products
Ethanol
Acetaldehyde →
Acetyl-CoA →
Oxaloacetate
Alcohol
dehydrogenase
Glucose by
gluconeogenesis
LactatePyruvate
Lactate
dehydrogenase
Glucose by
gluconeogenesis
Glycerol
Glycerol-3-phosphate
→
Dihydroxyaceton-
phosphate
Glucose by
gluconeogenesis

In addition to hexose sugars, yeasts can utilize a number of
non-conventional carbon sources, such as biopolymers,
pentoses, alcohols, hydrocarbons, fatty acids and organic acids.
Pentose sugars can be fermented to ethanol by very few
species, although many yeasts can grow aerobically on pentoses.
Saccharomyces cerevisiae can fermenter xylose by introducing
genes for xylose reductase and xylitol dehydrogenase from xylose
-fermenting species by recombinant DNA technology.
NUTRIENTES FOR GROWTH OF YEAST
IMPACT ON THE MODEL DEVELOPMENT

Bacteria Fungi
D-xylose D-xylose
xylitol
D-xylulose
xylose isomerase
D-xylulose-5-P
NAD(P)H
NAD(P)+
Pentose Phosphate Pathway
xyl. reductase
xyl.
dehydrogenase
xylulokinase
NAD+
NADH
ATP
ADP

Saccharomyces cerevisiae engineered to
metabolize xylose
Ho et al. cloned genes to xylose
reductase (XR), xylose dehydrogenase
(XDH) of Pistichia stipitis, and
introduced in S. cerevisiae
XK TKL
TAL
Xylose Xylitol
Xylitol
XK
XR
XDH

MATHEMATICAL MODELING TO
ETHANOL PRODUCTION
Structured model with free cells
Continuous stirred tank bioreactor (CSTR)
Anaerobic fermentative process
Ethanol, acetaldehyde, pyruvate and biomass production

METABOLISM OF SACCHAROMYCES
CEREVISIAE

STOICHIOMETRIC REACTIONS
NADHpyruvatee glu 33.0 cos
NADHpyruvate .671 CO 2
20.33CO dehyde0.67acetal pyruvate
NADH.acetatedeacetaldehy 50
NADHCOacetate 2 2
ethanolNADH.yde acetaldeh 50
NADHCOeglu 0.119 087.0 .913X0 cos 2a
ADHCOacetate 0.401N 222.0 .778X0 2a
Acdha X X
ndegradatio aX ndegradatio AcdhX
Lei et al., 2001.

a
aeglu
eglu
aa
eglu
egluX
KS
SkX
KS
Skr
1cos
cos
1
1cos
cos
11
a
egluipyruvate
pyruvateX
SKKS
Skr
cos22
221
1
Acdha
deacetaldehy
deacetaldehyXX
KS
Skr
4
44
a
egluiaacetate
acetateaa
acetate
acetate XSKKS
SkX
KS
Skr
cos55
5
5
551
1
a
ethanoledeacetaldehy
ethanoledeacetaldehyX
SKKS
SkSkr
66
6
66
a
egluiaacetate
acetate XSKKS
Skr
cos55
881
1
a
eglu
egluX
KS
Skr
7cos
cos
77
KINETIC RATES
DSSxrrdt
dSegluineglu
eglu
cos cos71
cos
DSxrrrdt
dSpyruvate
pyruvate
321978.0
DSxrdt
dSethanol
ethanol6045.1
DSxrrrdt
dSacetate
acetate854363.1
aa Xrrrrrr
dt
dX8710987 619.0732.0619.0732.0
DSxrrrdt
dSdeacetaldehy
deacetaldehy
6435.0
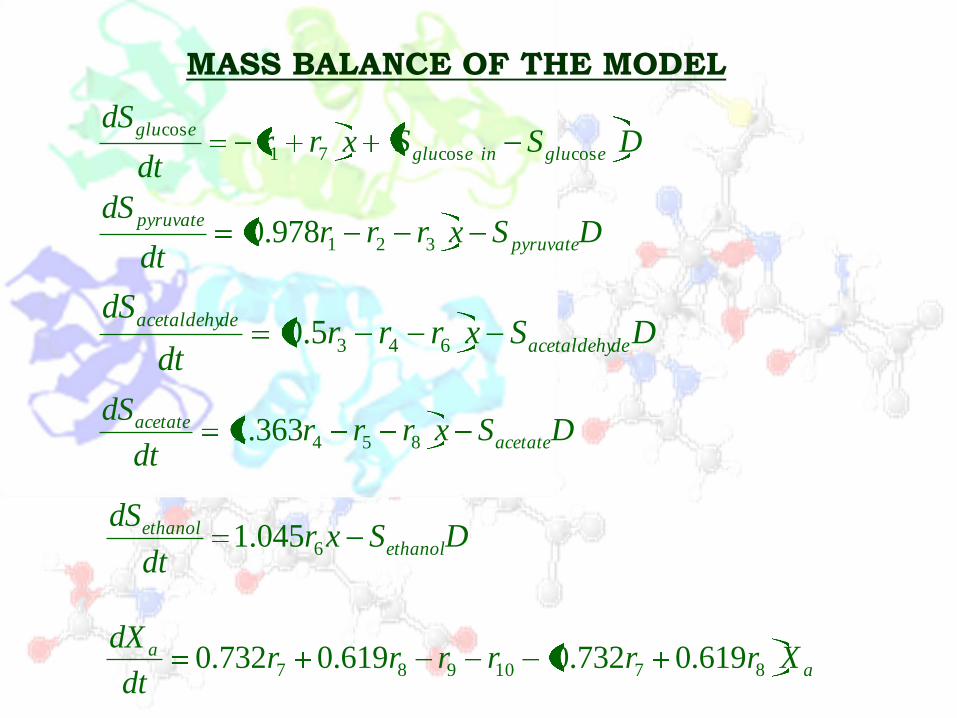
MASS BALANCE OF THE MODEL

X biomass; Xa active cell material;
XAcdh Acetaldehyde dehydrogenase; D dilution rate;
Ki rate constant; Ki affinity constant;
Kji inhibition constant
• Mass balance equations 8
• Kinetic parameter 37
• Parameter adjust Genetic Algorithm
MODEL SOLUTION

CSTR simulations

TRS Total Reductor Sugars

0 2 4 6 8 10 12 14 16 18 20 22 24 26 28 30 32
0
2
4
6
8
10
12
14G
luco
se c
on
cen
trati
on
(g
/L)
Time (h)
0 2 4 6 8 10 12 14 16 18 20 22 24 26 28 30 32
0
5
10
15
20
Time (h)
Py
ruv
ate
con
cen
trat
ion
(g
/L)
0
1
2
3
4
5
6 Acetald
ehy
de co
ncen
tration
(g/L
)
CSTR

0 2 4 6 8 10 12 14 16 18 20 22 24 26 28 30 32
0
10
20
30
40
50
60
Time (h)
Eth
an
ol
co
ncen
trati
on
(g
/L)
0
5
10
15
20
25
Bio
mass c
on
cen
tratio
n (g
/L)
0 2 4 6 8 10 12 14 16 18 20 22 24 26 28 30 32
0,20
0,25
0,30
0,35
0,40
0,45
0,50
Xa
Time (h)
0 2 4 6 8 10 12 14 16 18 20 22 24 26 28 30 32
0,010
0,015
0,020
0,025
0,030
XA
cd
h
Time (h)

Time (h)
Pyru
vate
concentr
ati
on (
g/L
)
Time (h)
Glu
cose
con
cen
trat
ion
(g/L
)BATCH

Time (h)
Ace
tate
con
cen
trat
ion
(g/L
)
Time (h)
Eth
anolc
on
cen
trat
ion
(g/L
)
Bio
mas
sco
ncen
trat
ion
(g/L
)
Time (h)
Biomass
Concentration g/L

Effect of temperature
Kinetic parameters optimized by
Quasi-Newton algorithm at 30, 31.2,
34, 36.8 and 38 C.

Experimental and Model Predictions for different temperatures
Experimental and simulated data
(QN ―) from 30 C to 38 C.
Experimental data are for
concentration of substrate , S( );
cell mass X( ) and ethanol P( ).

MATHEMATICAL MODELING TO
ETHANOL PRODUCTION
Structured model with immobilized cells
Plug flow bioreactor (PFR)
Anaerobic fermentative process
Ethanol, acetaldehyde, pyruvate and biomass production

MASS BALANCE TO FLUID PHASE
Glucose
Pyruvate
Acetaldehyde
Ethanol
Xerrz
Su
z
SD
dt
SethanoleSKpyruvatepyruvate
az
pyruvate
312
2
978.01
Xerrrz
Su
z
SD
dt
SethanoleSKdeacetaldehydeacetaldehy
az
deacetaldehy
6432
2
5.01
Xerz
Su
z
SD
dt
SethanoleSKethanolethanol
azethanol
62
2
045.11
Xerrz
Su
z
SD
dt
SethanoleSKeglueglu
az
eglu
71
cos
2
cos
2
cos 1

Xerrr
Sr
rrR
D
t
SethanoleSKASeglu
71
2
22
cos 1
Xerrrr
Pr
rrR
D
t
SethanoleSKAPpyruvate
321
2
22978.0
1
Xerrrr
Lr
rrR
D
t
SethanoleSKALdeacetaldehy
643
2
225.0
1
Xerr
AAr
rrR
D
t
SethanoleSKAAAethanol
6
2
22945.1
1
XkeX
XXrr
t
Xd
SKe
sat
ethanol`
87 1619,0732.0
aa Xrrrrrr
t
X8710987 619.0732.0619.0732.0
AcdhAcdh Xrrrrt
X87119 619.0732.0
MASS BALANCE TO SOLID PHASE
Glucose
Pyruvate
Acetaldehyde
Ethanol
Cells
Active cells
Acetaldehyde dehydrogenase enzyme

0,0 0,2 0,4 0,6 0,8 1,0
0
20
40
60
80
100
120
140
Simulation - Glucose
Experimental- Glucose
Simulation - Ethanol
Experimental- Ethanol
Co
ncen
trati
on
(g
/L)
Axial position
0 20 40 60 80 100 120 140 160
0
20
40
60
80
100
120
140
160
180
Simulation - glucose
Experimental- glucose
Simulation - ethanol
Experimental- ethanolC
on
cen
trati
on
(g/L
)
Time(h)
Model Validation

Petrochemical resources
Acetaldehyde (CH3CHO)
Lactonitrile (CH3CHOHCN
Only racemic DL-lactic acid
Addition of HCN
and catalyst
Hydrolysis by
H2SO4
Renewable resources
Fermentable carbohydrates
Fermented broth
Optically pure L(+) or D(-) lactic acid
Chemical synthesis
Microbial fermentation
SS
F
Desirable due toi) Recent environmental issuesii) Limited nature of petrochemical resourcesiii) Flexible in terms of required properties
LACTIC ACID

Microorganism: Lactobacillus plantarum (lactic acid isomers L and D
production )isolated from sample of industrial ethanol fermentation.
Carbohydrate source: sucrose obtained from sugarcane .
Fermentation: 5 L New Brunswick
Scientific BioFlo III bioreactor (4.8 L
working volume) equipped with a
control system on-line to monitor the
fermentation parameters, such as
temperature, CO2 and turbidity.
LACTIC ACID - PRODUCTION

POLY LACTIC ACID
Just like its monomer, poly lactic
acid can be found as isomers:
• poly(L-lactic acid) (PLLA),
• poly(D-lactic acid) (PDLA) and
• poly(D, L- lactic acid) (PDLLA).
Depending on the monomer used, the poly lactic acid can be obtained
in different forms, all of them with different properties.
Due to the chirality of the molecule, the properties of polymers of lactic acid
vary greatly depending on the relation and distribution of the two isomers.
Valuable product over US 140/g (application into medical area)

XP
P
SK
S
SK
S
dt
dX
iS max
max 1
XP
P
SK
S
SK
S
Ydt
dS
iSS
X max
max 11
XXP
P
SK
S
SK
S
dt
dP
iS max
max 1
Biomass
Lactic Acid
Sucrose
MATHEMATICAL MODELING TO
LACTIC ACID PRODUCTION
UNSTRUCTURED MODEL – BATCH BIOREACTOR

SIMULATION
Kinetic parameters Value
µmax (h-1) 0.530
KS (g/L) 5.472
α 8.698
β 0.272
YX/S (g/g) 0.0947
Pmax (g/L) 40.808
KINETIC PARAMETERS OF THE PROCESS

MATHEMATICAL MODELING TO
LACTIC ACID PRODUCTION
Use of the model to develop operational conditions to
stimulate the desired genetic modifications naturally – D and L
in any desired proportion.
Lactobacillus pentosus T
DSM 20314 (D79211)
CPQBA 183-10 DRM
Lactobacillus plantarum T
NRRL B14768 (AJ965482)
Lactobacillus brevisT DSM 20054 ( M58810)
Lactobacillus fermentumT
DSM 20052 (X61142)t
Lactobacillus reuteriT
DSM 20016 (L23507)
Lactobacillus panisT
DSM 6035 (X94230)
Lactobacillus fornicalisT DSM 13171 (Y18654)
Lactobacillus acidipiscisT
HSCC 1411 (AB023836)
Pseudomonas aeruginosaT
DSM50071 (X06684)
96
100
79
72
33
42
0.02 RNA ribossomal 16S
(Lb. plantarum e Lb. pentosus) Pentoses fermentation (Whitman
et al., 2009).

LACTIC ACID - RESULTS
0 8 16 24 32 40 48 56 64 72
0
5
10
15
20
25
30
Lactic Acid
Time (h)
Co
nce
ntr
atio
n (
g/L
)
Sucrose
0
100
200
300
400
500
600
700
800
900
2º pulse
1º pulse
NaO
H so
lutio
n (m
L)
NaOH

MATHEMATICAL MODELING TO
LACTIC ACID PRODUCTION
BATCH – SEMI BATCH BIOREACTOR
Use of the model to develop operational
conditions to stimulate the desired genetic
modifications naturally – D and L in any
desired proportion

SIMULATION OF THE BIOETHANOL
PRODUCTION PROCESS FROM SUGARCANE

SIMULATION OF AN INTEGRATED PROCESS FOR
LACTIC ACID, ETHYL LACTATE AND ETHYL
ACRYLATE PRODUCTION

Representative Metabolic Route for the Process of Acrylic Acid
Production
Existing Process are based on petrochemical route
Biological Route – very low concentration with the existing
Genetic Modified Organism (around 2% conversion, very diluted
system
There exist large market for the green acrylic acid
It appears that suitable biological route maybe successfully
developed

Representative metabolic route involved in the process of acrylic
acid production

STOICHIOMETRIC REACTIONS
2 cos 1Rpyruvatee glu
a
R lucose 2 Xg
lactate 3Rpyruvate
OH acid acrylic lactate 2
R4
a
R actate 5 Xl
Ladh
R
a X 6X
ndegradatio 7R
aX

KINETIC RATES
a
a
aa XKS
SkX
KS
SkR
1
1
1
11
a
i
X
K
LKS
SkR
2
2
22
1
1aX
KP
PkR
3
33
aXKL
LkR
4
44a
i
XSKKL
LkR
55
551
1
a
ia
XAAKKL
L
KS
SkR
666
661
1
_
a
a
aa XKAA
AAkX
KS
SkR
7
7
7
77

0 10 20 30 40 50
0
10
20
30
40
50
60
70
80 Glucose
Pyruvate
Lactate
Acrylic acid
Biomass
Co
ncen
trati
on
(g
/L)
Time (h)
0 10 20 30 40 50
0
10
20
30
40
50
60
70 Glucose
Pyruvate
Lactate
Acrylic acid
Biomass
Co
ncen
trati
on
(g
/L)
Time (h)
0 2 4 6 8 10 12 14 16 18 20 22 24 26 28 300
10
20
30
40
50
60
70
80
D(h-1)
0.05
0.1
0.2
0.3
0.4
0.5
Glu
cose
con
cent
rati
on (
g/L
)
Time (h)

Fermentation
Lactic Acid EsterificationE
than
ol
Distillation
Wat
er
Ethyl Lactate
Catalyst
Ethyl Acrylate
WaterDehydration
Eth
ano
l
Substrate
Ino
culu
m

CELL ON CHIP
There exist mass and heat transfer
limitations to improve the microorganism
performance.
Cell membrane has to engineered to
overcome transfer problems, but this has
not been considered suitably.
Cell on chip could be a possible
alternative.


Infra-structure to cell on chip – LOPCA/UNICAMP: Rapid Prototyping
3DPrinter (ZCorporation) FDM (Stratasys)

CELL ON CHIP AND MESH CONSTRUCTION

SIMULATIONS
A B
A
Density = 1.3229 g/cm3
Viscosity = 0.01190 kg/m.s
B
Density = 0.9128g/cm3
Viscosity = 0.00113 kg/m.s

SIMULATIONS
A
Density = 1.3229 g/cm3
Viscosity = 0.01190 kg/m.s
B
Density = 0.9128g/cm3
Viscosity = 0.00113 kg/m.s
A BA B


Practical Case Study:
Biodiesel Production
Experimental Set-up

Cell on chip
“Micro-plants
Reduce heat and mass transfer limitationsCheaper production with high performance operation

CONCLUSIONS
Simulation tools on the level of microorganisms
metabolic pathways is helpful:
To take decisions on the definitions of optimal
operational conditions
Serve as guideline to genetic modified
microorganism in a rational basis taking into
account the process requirements and real world
conditions
Work as tool to the development of operational
conditions to stimulate the desired genetic
modifications naturally
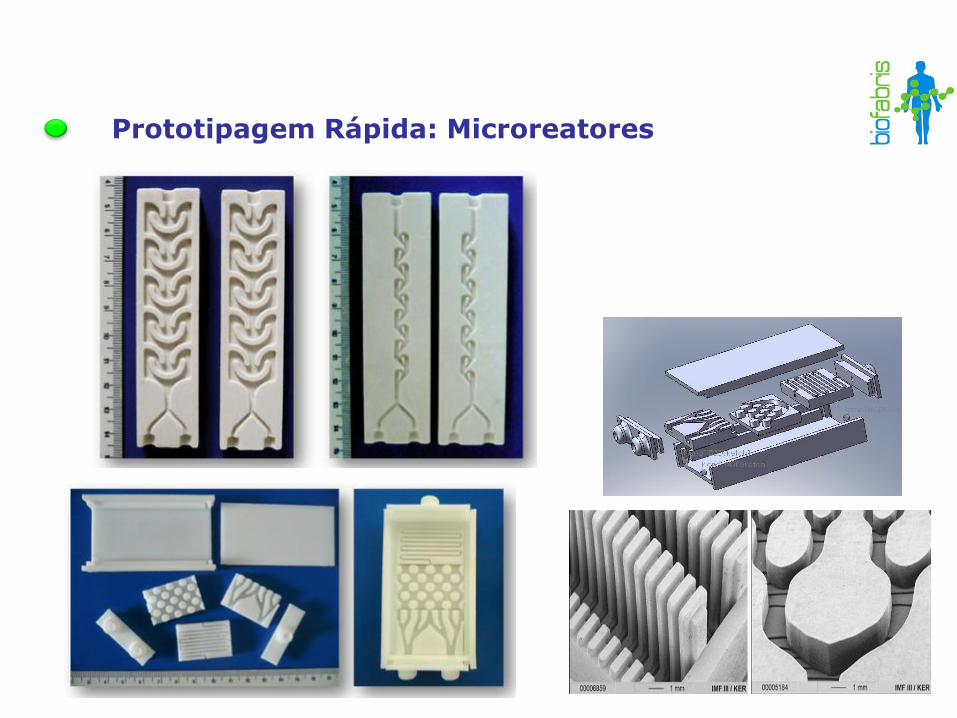
Prototipagem Rápida: Microreatores