A Comprehensive Emissions Inventory of Upstream Oil · PDF fileA Comprehensive Emissions...
25
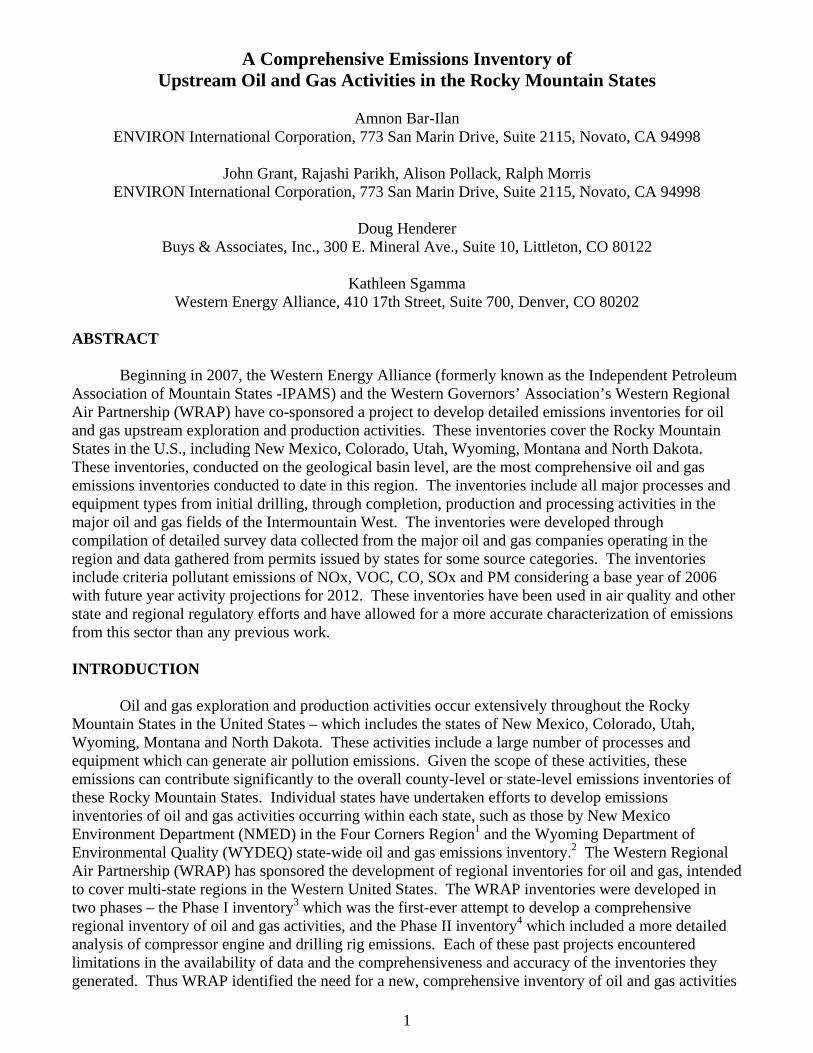
1 A Comprehensive Emissions Inventory of Upstream Oil and Gas Activities in the Rocky Mountain States Amnon Bar-Ilan ENVIRON International Corporation, 773 San Marin Drive, Suite 2115, Novato, CA 94998 John Grant, Rajashi Parikh, Alison Pollack, Ralph Morris ENVIRON International Corporation, 773 San Marin Drive, Suite 2115, Novato, CA 94998 Doug Henderer Buys & Associates, Inc., 300 E. Mineral Ave., Suite 10, Littleton, CO 80122 Kathleen Sgamma Western Energy Alliance, 410 17th Street, Suite 700, Denver, CO 80202 ABSTRACT Beginning in 2007, the Western Energy Alliance (formerly known as the Independent Petroleum Association of Mountain States -IPAMS) and the Western Governors’ Association’s Western Regional Air Partnership (WRAP) have co-sponsored a project to develop detailed emissions inventories for oil and gas upstream exploration and production activities. These inventories cover the Rocky Mountain States in the U.S., including New Mexico, Colorado, Utah, Wyoming, Montana and North Dakota. These inventories, conducted on the geological basin level, are the most comprehensive oil and gas emissions inventories conducted to date in this region. The inventories include all major processes and equipment types from initial drilling, through completion, production and processing activities in the major oil and gas fields of the Intermountain West. The inventories were developed through compilation of detailed survey data collected from the major oil and gas companies operating in the region and data gathered from permits issued by states for some source categories. The inventories include criteria pollutant emissions of NOx, VOC, CO, SOx and PM considering a base year of 2006 with future year activity projections for 2012. These inventories have been used in air quality and other state and regional regulatory efforts and have allowed for a more accurate characterization of emissions from this sector than any previous work. INTRODUCTION Oil and gas exploration and production activities occur extensively throughout the Rocky Mountain States in the United States – which includes the states of New Mexico, Colorado, Utah, Wyoming, Montana and North Dakota. These activities include a large number of processes and equipment which can generate air pollution emissions. Given the scope of these activities, these emissions can contribute significantly to the overall county-level or state-level emissions inventories of these Rocky Mountain States. Individual states have undertaken efforts to develop emissions inventories of oil and gas activities occurring within each state, such as those by New Mexico Environment Department (NMED) in the Four Corners Region 1 and the Wyoming Department of Environmental Quality (WYDEQ) state-wide oil and gas emissions inventory. 2 The Western Regional Air Partnership (WRAP) has sponsored the development of regional inventories for oil and gas, intended to cover multi-state regions in the Western United States. The WRAP inventories were developed in two phases – the Phase I inventory 3 which was the first-ever attempt to develop a comprehensive regional inventory of oil and gas activities, and the Phase II inventory 4 which included a more detailed analysis of compressor engine and drilling rig emissions. Each of these past projects encountered limitations in the availability of data and the comprehensiveness and accuracy of the inventories they generated. Thus WRAP identified the need for a new, comprehensive inventory of oil and gas activities
-
Upload
nguyentram -
Category
Documents
-
view
217 -
download
2
Transcript of A Comprehensive Emissions Inventory of Upstream Oil · PDF fileA Comprehensive Emissions...
1
A Comprehensive Emissions Inventory of Upstream Oil and Gas Activities in the Rocky Mountain States
Amnon Bar-Ilan
ENVIRON International Corporation, 773 San Marin Drive, Suite 2115, Novato, CA 94998
John Grant, Rajashi Parikh, Alison Pollack, Ralph Morris ENVIRON International Corporation, 773 San Marin Drive, Suite 2115, Novato, CA 94998
Doug Henderer
Buys & Associates, Inc., 300 E. Mineral Ave., Suite 10, Littleton, CO 80122
Kathleen Sgamma Western Energy Alliance, 410 17th Street, Suite 700, Denver, CO 80202
ABSTRACT
Beginning in 2007, the Western Energy Alliance (formerly known as the Independent Petroleum Association of Mountain States -IPAMS) and the Western Governors’ Association’s Western Regional Air Partnership (WRAP) have co-sponsored a project to develop detailed emissions inventories for oil and gas upstream exploration and production activities. These inventories cover the Rocky Mountain States in the U.S., including New Mexico, Colorado, Utah, Wyoming, Montana and North Dakota. These inventories, conducted on the geological basin level, are the most comprehensive oil and gas emissions inventories conducted to date in this region. The inventories include all major processes and equipment types from initial drilling, through completion, production and processing activities in the major oil and gas fields of the Intermountain West. The inventories were developed through compilation of detailed survey data collected from the major oil and gas companies operating in the region and data gathered from permits issued by states for some source categories. The inventories include criteria pollutant emissions of NOx, VOC, CO, SOx and PM considering a base year of 2006 with future year activity projections for 2012. These inventories have been used in air quality and other state and regional regulatory efforts and have allowed for a more accurate characterization of emissions from this sector than any previous work. INTRODUCTION
Oil and gas exploration and production activities occur extensively throughout the Rocky Mountain States in the United States – which includes the states of New Mexico, Colorado, Utah, Wyoming, Montana and North Dakota. These activities include a large number of processes and equipment which can generate air pollution emissions. Given the scope of these activities, these emissions can contribute significantly to the overall county-level or state-level emissions inventories of these Rocky Mountain States. Individual states have undertaken efforts to develop emissions inventories of oil and gas activities occurring within each state, such as those by New Mexico Environment Department (NMED) in the Four Corners Region1 and the Wyoming Department of Environmental Quality (WYDEQ) state-wide oil and gas emissions inventory.2 The Western Regional Air Partnership (WRAP) has sponsored the development of regional inventories for oil and gas, intended to cover multi-state regions in the Western United States. The WRAP inventories were developed in two phases – the Phase I inventory3 which was the first-ever attempt to develop a comprehensive regional inventory of oil and gas activities, and the Phase II inventory4 which included a more detailed analysis of compressor engine and drilling rig emissions. Each of these past projects encountered limitations in the availability of data and the comprehensiveness and accuracy of the inventories they generated. Thus WRAP identified the need for a new, comprehensive inventory of oil and gas activities

2
in the Rocky Mountain States. The current work, co-sponsored by WRAP and the Western Energy Alliance , builds on the older Phase I and Phase II inventories and is termed the Phase III inventory. The Phase III inventory project was begun in 2007, and is intended to be a comprehensive inventory of all major oil and gas exploration and production activities, processes and equipment in the Rocky Mountain States.
The Phase III project covers criteria pollutants, including nitrogen oxides (NOx), carbon monoxide (CO), volatile organic compounds (VOC), sulfur oxides (SOx) and particulate matter (PM). The inventory considers a base year of 2006, and “midterm” projections to 2012, with a plan to generate far future year projections to 2018. The inventory considers both combustion-generated emissions and those from oil and gas exploration or production processes:
• Combustion-generated emissions – includes gas compressor engines, tank and separator heaters, boilers and reboilers in dehydrators and gas sweetening processes, flaring, drilling rig and workover rig engines, and miscellaneous engines (e.g. on-site generators, air compressors, vapor recovery units);
• Process emissions – includes flashing and working and breathing losses from condensate and oil tanks, venting emissions from dehydrators and gas sweetening units, fugitive emissions from well site and central facility components, vented emissions from pneumatic devices, vented emissions from pneumatic chemical injection pumps, vented emissions from well completions and recompletions, and vented emissions from well blowdowns
The Phase III inventory considers all oil and gas exploration and production activities up to the
outlet of a natural gas processing facility, or the inlet to a refinery. This scope is generally consistent with the definition of the “upstream” oil and gas sector, as defined separately from oil refining and natural gas transmission and distribution.5 The Phase III inventory scope does not include on-road and off-road mobile sources associated with exploration and production activity, with the exception of drilling and workover rigs. However these mobile sources are being addressed in a new pilot study for the U.S. Environmental Protection Agency (EPA) that will focus on the Piceance Basin in Northwestern Colorado.6
The Phase III project has many advantages over the previous inventory efforts conducted in this region. The inventory is regionally consistent in scope and methodology, and develops emissions at the level of the geologic basin, which is considered a reasonable geographic unit in which oil and gas activities and the produced gas and oil products are likely to be similar in nature. The Phase III project is significantly more comprehensive in scope than previous inventories, covering emissions source categories that had not previously been inventoried. The Phase III projects considers a more recent 2006 baseline year for the inventory than previous inventory projects, and includes the midterm emissions projection year of 2012 which both provides a third projection point to aid in developing the far future year projections and a more accurate future year projection. The detailed data in the Phase III inventory represents a better snapshot of actual equipment in use in fields throughout the region and can better capture the types of controls and practices in use than previous inventories.
Currently the Phase III project has completed 2006 baseline and 2012 midterm projection emissions inventories for 6 geologic basins, which are described in this paper. Two additional basins in Wyoming – the Powder River and Greater Green River Basins – are being studied now. The final remaining basin, the Williston Basin in Montana and North Dakota, is expected to be completed in 2011. Work will then begin on updating the 2006 baseline inventories to 2009, with anticipated triennial updates henceforth. At the end of this paper summarizing the methodology and results of the current inventories we provide more detail on planned future work in this area. METHODS
The general methodology for developing the Phase III inventories for each basin is presented below, including the results to date for the basin inventories. More detailed presentation of the specific

3
emissions estimation methodologies by source category are presented in the series of technical reports which have been developed for each basin and published by WRAP.7
The Phase III baselines inventories are developed from a combination of (1) production statistics from a commercially available database; (2) survey data from oil and gas companies; and (3) permit data from states and the EPA for larger point-source facilities. These three data sources are then compiled to generate the complete baseline inventory for each basin. Oil and Gas Production Statistics
Oil and gas related activity data across the entire Rocky Mountain region were obtained from the IHS Enerdeq database queried via online interface. The IHS database uses data from Oil and Gas Conservation Commissions (or their equivalents) in each state as a source of information on oil and gas activity. The IHS database tool was evaluated and determined to be more complete and accurate than the Oil and Gas Conservation Commission databases for each state, since IHS makes significant efforts to gap-fill missing production data, clarify inconsistencies in data directly with the companies that report the data, and remove data that is erroneous or cannot be evaluated completely. Two types of data were queried from the Enerdeq database: production data and well data. Production data includes information relevant to producing wells in a given basin while well data includes information relevant to drilling activity (“spuds”) and completions in the basin.
Production data were obtained for the counties that make up each basin in the form of PowerTools input files. PowerTools is an IHS application which, given PowerTools inputs queried from an IHS database, analyzes, integrates, and summarizes production data in an ACCESS database. From a database created by PowerTools, extractions of the following data relevant to the emissions inventory development were made:
• 2006 active wells, i.e. wells that reported any oil or gas production in 2006. • 2006 oil, gas, and water production by well and by well type.
The production data are available by API number. The API number in the IHS database consists
of 14 digits as follows:
• Digits 1 to 2: state identifier • Digits 3 to 5: county identifier • Digits 6 to 10: borehole identifier • Digits 11 to 12: sidetracks • Digits 13 to 14: event sequence code (recompletions)
Based on the expectation that the first 10 digits, which include geographic and borehole
identifiers, would predict unique sets of well head equipment, the unique wells were identified by the first 10 digits of the API number. Well data were also obtained from the IHS Enerdeq database for the counties in each basin in the form of “297” well data. The “297” well data contain information regarding spuds and completions. The “297”well data were processed to arrive at a database of by-API-number, spud and completion dates with latitude and longitude information. Drilling events in 2006 were identified by indication that the spud occurred within 2006. If the well API number indicated the well was a recompletion, it was not counted as a drilling event, though if the API number indicated the well was a sidetrack, it was counted as a drilling event.
Tables 1 and 2 below show the 2006 baseline production statistics for the five basins completed thus far in the inventory, and help to explain some of the variation in basin inventories.

4
Table 1. 2006 Oil and Gas Production Statistics Summary for the Six Basins Completed to Date in the Phase III Project.
Basin
Oil Production (barrels)
Gas Production (thousand cubic feet)
Total Oil Well Oil
Gas Well Condensate Total Conventional CBM
D-J Basin 14,242,088 0 14,242,088 234,630,779 234,630,779 0Uinta Basin 11,528,121 9,758,247 1,769,874 331,844,336 254,219,432 77,624,904Piceance Basin 7,158,305 5,755,076 1,403,229 421,358,666 420,165,237 1,193,429N. San Juan Basin 32,529 27,962 4,567 443,828,500 28,642,418 415,186,082S. San Juan Basin 2,636,811 1,002,060 1,634,751 1,020,014,851 520,060,869 499,953,982Wind River Basin 3,043,459 2,563,912 479,547 198,190,024 197,166,868 1,023,156
Table 2. 2006 Oil and Gas Well Count Statistics Summary for the Six Basins Completed to Date in the
Phase III Project.
Basin
Well Counts Spud Counts
Total Conv. CBM Total D-J Basin 19,841 19,841 0 1500Uinta Basin 6,881 6,018 863 1069Piceance Basin 6,315 6,255 60 1186N. San Juan Basin 2,676 1,009 1,667 127S. San Juan Basin 20,649 16,486 4,163 919Wind River Basin 1,350 1,330 20 98
As Tables 1-2 demonstrate, basins show wide variation in the total production of gas, oil and
condensate, and in the number of wells and spuds occurring in the baseline year 2006. In particular the number of spuds is a strong indication of where oil and gas exploration and production activity was concentrated in 2006 – in particular in new development areas in the Uinta and Piceance Basins, and in the Denver-Julesburg basin. Gas production among the six basins completed to date in the study ranged from 200 bcf to greater than 1,000 bcf in the 2006 baseline year. Total oil production also varies significantly among basins, from approximately 32,000 barrels in 2006 in the North San Juan Basin, to greater than 14 million barrels in the Denver-Julesburg Basin. There is also significant variation in the fraction of the oil production that is true oil, versus condensate production from gas wells. In both the Uinta and Piceance Basin, a significant fraction of the production of oil is from true oil wells, as defined by the IHS database. In the Denver-Julesburg Basin, the production of liquid hydrocarbons is only in the form of condensate production.
The extracted oil and gas well locations by type and maps for the 6 basins completed thus far in the study are presented in Figures 1-6 below.

5
Figure 1. Oil and Gas Well Locations by Well Type within the North San Juan Basin.
Figure 2. Oil and Gas Well Locations by Well Type within the South San Juan Basin.

6
Figure 3. Oil and Gas Well Locations by Well Type within the Uinta Basin.
Figure 4. Oil and Gas Well Locations by Well Type within the Piceance Basin.

7
Figure 5. Oil and Gas Well Locations by Well Type within the Denver Julesburg Basin.
Figure 6. Oil and Gas Well Locations by Well Type within the Wind River Basin.

8
Survey Data
Survey forms consisting of spreadsheets were forwarded to participating oil and gas companies in each basin. Each spreadsheet contained a request for specific data related to one of the combustion or process source categories that were included in this study. The specific source category list varied by state and basin, depending upon the reporting requirements in different states and in Indian tribal and non-tribal land. In some states with more stringent reporting requirements, the inventory relied more on data from permits for some source categories. In states with less stringent reporting thresholds, the surveys were more comprehensive as it was assumed that more source categories would not be captured in state permit databases. The source categories for which data were gathered from surveys are referred to in this study as “unpermitted sources” and those source categories for which data was gathered from permits are referred to as “permitted sources.”
The companies that participated in the survey process by providing some survey responses for each basin represented only a fraction of ownership of the oil and gas activity in any basin, with differing fractions of ownership of gas production, oil production and wells. These fractions were determined for each basin from the IHS database analysis described above. The goal of the project was to gather enough survey data from oil and gas companies such that the responding companies represented 70% or greater of the oil and gas activity surrogate. This target representation was determined to be a sufficiently large percentage of the activity in any basin that it was felt that the responses were representative of all oil and gas operations in the basin. The survey data was combined to create a compiled survey response for each source category, where the combination was conducted using a weighted average of survey responses with a weighting factor corresponding to the fraction of the production surrogate represented by each survey respondent. The combined survey responses for individual source categories were then scaled to estimate total emissions from that source category in the basin by the ratio of the fraction of ownership of the activity surrogate for that source category by the survey respondents, to the total of the activity surrogate in the basin. This is described in more detail below.
For emissions from those source categories that relied on estimates of volume of gas vented or leaked, such as well blowdowns, completions, and fugitive emissions, gas composition analyses were requested from all responding oil and gas companies for all produced gas types in the basin. These would typically include conventional or unconventional gas, coal bed methane (CBM) gas, and composition analyses for tank flash gas or amine unit vented gas. These composition analyses were averaged to derive basin-wide gas composition averages for the various types of processes for which emissions were estimated. The average composition analysis was used to determine the average VOC volume and mass fractions of the vented gas basin-wide.
It is assumed implicitly in the study that the survey respondents represent the typical activities and equipment usage for oil and gas exploration and production activities. It is possible that the companies not participating in the survey have very different practices from those who did participate, but the results of the survey process for several basins indicated very consistent process data that provided confidence that the surveys were representative. However one limitation of this methodology is that for source categories not operated by any survey respondent, no information was gathered and emissions from these source categories were not included in the inventory. Water disposal facilities and water tanks were frequently not reported in the surveys, but prior work indicated that these are not significant source categories relative to the major source categories which were included in the study.3 Permit Data
Permitted sources in this study refer primarily to larger sources in use in midstream, gas gathering applications that are generally treated in inventories as point sources. This includes large gas processing plants, major compressor stations, and other smaller compressor stations, including the associated equipment at these stations. The midstream sources are often not owned by the same production companies that responded to the surveys on upstream oil and gas activity in the basin,

9
therefore the permit data was needed to capture emissions from these sources. Permitting requirements vary significantly from state to state,3 and in some states (primarily Colorado and Wyoming) minor wellhead equipment is also permitted and these permits were used. In general, the process to evaluate permit data in each basin occurred prior to distribution of surveys so that the surveys would only target information requests for emissions source categories not already covered by state or federal permits. For reference, Table 3 provides a summary of the permit threshold levels for each of the states in the Phase III study region.
Table 3. Permit thresholds by state for the Rocky Mountain States in the Phase III study region.
State Emissions Thresholds (tons/yr)
Comments
New Mexico
Notice of Intent Required for Facilities with Emissions >
10tpy Criteria Pollutants;Permits Required for Facilities
> 25 tpy
Due to technical issues with the permit data, only major source facility permits (> 100 tpy) were used in New Mexico
Colorado
Permits Required for All Sources with Emissions
> 2 tpy Criteria Pollutants
Air Permit Emission Notices (APENs) used for all sources with emissions
> 2 tpy
Utah
Permits Required for All Sources with Potential to Emit
(PTE) > 100 tpy
Sources subject to NSPS or with HAPs emissions at 10 tpy for one pollutant or
25 tpy for combination of HAPs must be issued permits
Wyoming
Combustion Sources: Engines with HP < 200 (Equivalent to
Approx. 1 tpy NOx) Permit Not Required;
Oil and Gas Process Sources (Tanks and Dehydration):
Variable Depending on Development Region but Not
Less than 6 tpy VOC Emissions in Most Areas
(Some Sources Require Permits at Any Emissions
Levels in JPAD Area)
Wyoming permit data treated separately depending on the development region:
the Jonah-Pinedale Anticline Development (JPAD) area; the
“concentrated” development area including seven Counties in SW WY;
and state-wide development areas.
Montana
Permits Required for All Sources with Potential to Emit
(PTE) > 25 tpy
North Dakota
Permits Required for All Sources with Potential to Emit
(PTE) > 100 tpy
Permit data available on facilities with actual emissions > 25 tpy
The practical effect of different permitting thresholds for various states is that the inventories of
fixed equipment (point sources) often varies in percentage contribution of pollutants versus the contribution of area sources. For example a compressor engine which emits 20 tpy of NOx operating in Colorado, where the permitting threshold is 2 TPY, would appear in the point source inventory, whereas that same compressor located in North Dakota would appear in the area source inventory. Thus it is important to keep in mind this dichotomy when evaluating various inventory sectors, and it is necessary to look at the total impact from both point and area sources to determine the true impact of the oil and gas industrial sector.

10
This is one reason why the inventories of the oil and gas industry were historically incomplete. State agencies typically permit point sources, while generally not issuing formal permits for area sources. Thus it was imperative for the WRAP to begin compiling the Phase III inventories to allow for a more complete look at regional air pollution impacts.
The permit data were obtained from states for permitted sources on state or private land and from the EPA for sources on tribal land. For tribal land, EPA maintains permits only for large Title V sources such as gas processing plants or major compressor stations. Where possible, actual emissions from permits were used, rather than permitted emissions. Actual emissions represent periodic inventories that were conducted at permitted facilities, or emissions measurements taken after installation of control devices, and were considered more accurate than permitted emissions levels. If the permits were owned by oil and gas companies that were participants in the survey process, those permits were provided to the companies for review. Companies indicated whether permits were accurate – facilities that were no longer operating or which were never operational were removed, facilities which were missing from the permit data were added, and emissions levels at some facilities were changed to reflect actual conditions. The permitted sources list was also reviewed against the Phase II inventory’s point source list to check for consistency and completeness of the point sources.4 Compilation
The survey and permit data were compiled in several steps to generate the baseline 2006 inventory. A set of surrogates were applied to each unpermitted source category for which survey data was compiled. The surrogates represented different oil and gas production statistics, such as conventional gas production, CBM gas production, oil or gas well counts and spud (drilling event) counts. For each source category, the total value of the surrogate represented by all responding oil and gas companies whose data contributed to the survey was compared to the total value of the surrogate in the basin. A scaling factor was developed, which was the ratio of the total value of the surrogate in the basin to that represented by the combined survey responses. The scaling factor was used to grow the total emissions for unpermitted sources for each source category from the survey data to the basin-wide emissions. This was done because the survey respondents did not represent all activity in the basin.
Following this, the emissions from permitted sources were added to the emissions from the unpermitted sources. The permitted sources were treated as point sources, since the exact locations of these sources were known. The resulting emissions inventory represented the total baseline inventory. The surrogates for each source category were then used to scale the inventory down to the county level, such that the final inventories were reported on a county basis. The scaling factors for the county-level emissions estimates were the ratio of a surrogate’s value in a single county to that of the entire basin. A similar analysis was conducted for tribal versus non-tribal land. An analysis was conducted to determine the values of surrogates within tribal land in the basin, as opposed to non-tribal land. A similar scaling was then conducted on the total inventory for the basin to determine the tribal portion of the inventory. Figure 7 shows a flow diagram for the inventory compilation process.

11
Figure 7. Phase III Project Emissions Inventory Compilation Flow Chart.
2012 Midterm Emissions Projections
In addition to the baseline 2006 inventory, the Phase III project considers midterm projections to 2012. These projections are more detailed than those conducted in previous inventory efforts3,4 in that they project a greater number of activity parameters, and use more detailed information to develop the projection factors. Previous inventories have relied on only a single broad projection factor, such as oil or gas production projections. The Phase III midterm projections also use well and drilling count projections, and develop the gas and oil production projections from basic information about expected per-well production.
The projections are developed by first generating historic data curves for gas production by type, oil production, condensate production, well counts by type and spud counts. These historic trends include data from approximately the late 1970’s through the present, depending on the initial year that statistics were kept and recorded by state oil and gas commissions. Projections of the drilling activity were developed by reviewing the recent historic data and creating a best-fit extrapolation from 2006 to 2012, or by gathering actual planned drilling counts from the oil and gas companies participating in the survey process. A historic ratio of drilling events to the number of active wells in the basin were developed, and used as a means to estimate the success rate of drilling events. The drilling success rate and the projected drilling activity were used to develop the growth in number of new wells in the basin as a result of planned drilling activity. These projections were conducted separately for oil wells, conventional gas wells, and CBM gas wells. Well abandonment or well shut-in rates were also tracked historically, and the historic data was used to develop an estimate of the average annual well shut-in rate in each basin. The projected growth rate in well counts from drilling and the projected shut-in rate from the historic data were combined to develop the projected total active well counts in each basin in 2012. Production decline curves were obtained for different well types in regions where active drilling was occurring or expected to occur in the time frame 2006 to 2012. The decline curves track production over the first 10 years of life of a new well, and were used in combination with the projected well counts to project the production from these wells. The final results of this analysis were production and well and spud count projections for 2012. This methodology allowed the projections to track both downturns in oil and gas production activities, and upturns in the activity that were projected for the near future. Figure 8 shows an example of a conventional gas production projection for Carbon County Utah in the Uinta Basin, which demonstrates the effect on the projection of a recent downturn in drilling activity.
Unpermitted sources surveys to O&G
producers
Combined survey responses for all
participating companies
Permitted sources data from state and/or federal standard
Any additional state reporting data
Complete oil and gas emissions inventory for
entire basin
IHS database (oil and gas production
and well and spud counts)
Scaled-up unpermitted sources emissions for
entire basin

12
Figure 8. Example of a Gas Production Projection in Carbon County, Utah Incorporating Well Decline Curves and Projected Downturn in Drilling Activity.
If planned drilling activity was not available, or average well decline curves could not be determined or were not consistent with recent historic data, projections were made using only the historic data. Best-fit extrapolations were conducted on the historic well count or production data, and these were used to determine the projected activity levels in 2012.
The ratios of the value of the projected parameters in 2012 to the values in 2006 were considered the scaling factors for purposes of the midterm projections. The scaling factors by activity parameter were applied to the baseline 2006 emissions to generate “uncontrolled” 2012 emissions projections. The application of the scaling factors to various source categories followed the same cross-reference between parameter and source category as was used to scale the combined survey response data to develop baseline emissions for each basin. The final step in developing the 2012 emissions projections was to apply control factors to the uncontrolled 2012 emissions, representing state and federal regulations that require implementation of emissions control devices or practices. These include flaring requirements for VOC emissions control for tanks, requirements to install low-bleed pneumatic devices, or requirements to utilize lean-burn natural gas-fired compressor engines to reduce NOx emissions. The controls requirements varied by state and by tribal land, and these were evaluated separately for each basin. RESULTS AND DISCUSSION Inventory Results
The 2006 baseline and 2012 midterm projection emissions inventories for the six basins completed to date are presented below in Tables 4 and 5.
0
10,000,000
20,000,000
30,000,000
40,000,000
50,000,000
60,000,000
1985 1990 1995 2000 2005 2010
Year
Gas
Pro
duct
ion
[mcf
]
Historic Gas Production
Projected Gas Production

13
Table 4. Baseline 2006 Emissions Inventories for the Five Basins Completed in the Phase III Project to Date.
Basin Emissions (tons/yr) NOx VOC CO SOx PM
D-J Basin 20,783 81,758 12,941 226 636 Uinta Basin 13,093 71,546 8,727 396 623 Piceance Basin 12,390 27,464 7,921 314 992 North San Juan Basin 5,700 2,147 6,450 15 52 South San Juan Basin 42,075 60,697 23,471 305 574 Wind River Basin 1,814 11,981 2,840 1,792 37
Table 5. Midterm 2012 Emissions Projections for the Five Basins Completed in the Phase III Project to
Date.
Basin Emissions (tons/yr) NOx VOC CO SOx PM
D-J Basin* 24,408 88,989 15,412 131 771 Uinta Basin 16,547 127,495 44,925 24 631 Piceance Basin 9,951 20,962 7,668 77 374 North San Juan Basin 4,195 1,598 4,661 0.34 47 South San Juan Basin 43,050 55,705 25,421 132 523 Wind River Basin 1,758 12,480 2,738 1,618 39
*Projections for the D-J Basin were conducted for 2010.
The emissions inventory results show significant variation in the inventories between basins for NOx and VOC emissions. This is a result of a number of factors, including the differences in production levels in each basin and the requirements for control of emissions from oil and gas sources (both historic and current controls requirements). The Piceance Basin in Northwestern Colorado borders the adjacent Uinta Basin in Northeastern Utah, yet the VOC emissions inventories for both basins are significantly different. This is partially due to the controls requirements in Colorado, where green completions and flaring of large tank batteries and dehydrators is regulated by Colorado’s Department of Public Health and the Environment (CDPHE) or the Colorado Oil and Gas Conservation Commission (COGCC). By contrast, there are no such requirements in Utah and much of the oil and gas development occurs on tribal land where the Utah Division of Air Quality (UTDAQ) does not have regulatory jurisdiction. The North and South San Juan Basins are also adjacent, straddling the border between Southwestern Colorado and Northwestern New Mexico. The significant differences in both NOx and VOC emissions between these two basins are a result of both the regulatory differences between the two states, but more significantly are a result of the high levels of CBM gas production in the North San Juan Basin (with little VOC content of the produced gas) versus the mixed conventional and CBM gas production in New Mexico. The inventory results and production statistics for the Wind River Basin in Wyoming show that although there are relatively few active wells in the basin as compared to other basins, the gas production in the basin is high and comparable to that of other basins. This is because of a small number of deep wells with a significant amount of gas production. Because of this small number of wells, NOx emissions in the Wind River Basin are low since most NOx source categories are driven by the number of active wells.
The results of the 2012 projections show that in the D-J, and Uinta Basins, continued growth is projected through the 2012 year. In the D-J Basin this growth is primarily the result of in-fill drilling in oil and gas fields that have already been developed. In the case of the Uinta Basin, the growth is primarily the result of new oil and gas exploration and production in regions of the Basin not previously developed. The growth in VOC emissions in the D-J Basin is more modest than in the Uinta Basin, and reflects the effects of controls on VOC emissions sources required in Colorado. The Piceance Basin, by contrast, is projected to decline in emissions in this same period. This is primarily a result of a decrease

14
in drilling activity in the basin, resulting from the recent economic downturn and falling natural gas prices. The North and South San Juan Basins, while showing continued oil and gas activity in the period 2006-2012, are older basins that have been in decline for a number of years, based on the historic data compiled for these basins. The current oil and gas activity in these basins is primarily targeted at maintaining flat levels of production, while some equipment turnover and controls requirements continue to reduce emissions. The net effect of these competing forces is that emissions are largely unchanged in these two basins in the projection period. The projections for the Wind River Basin are similar to those of the North and South San Juan Basins – a combination of growth in activity but more stringent future controls requirements. The net effect for the Wind River Basin is also little change in the inventory from 2006 to 2012.
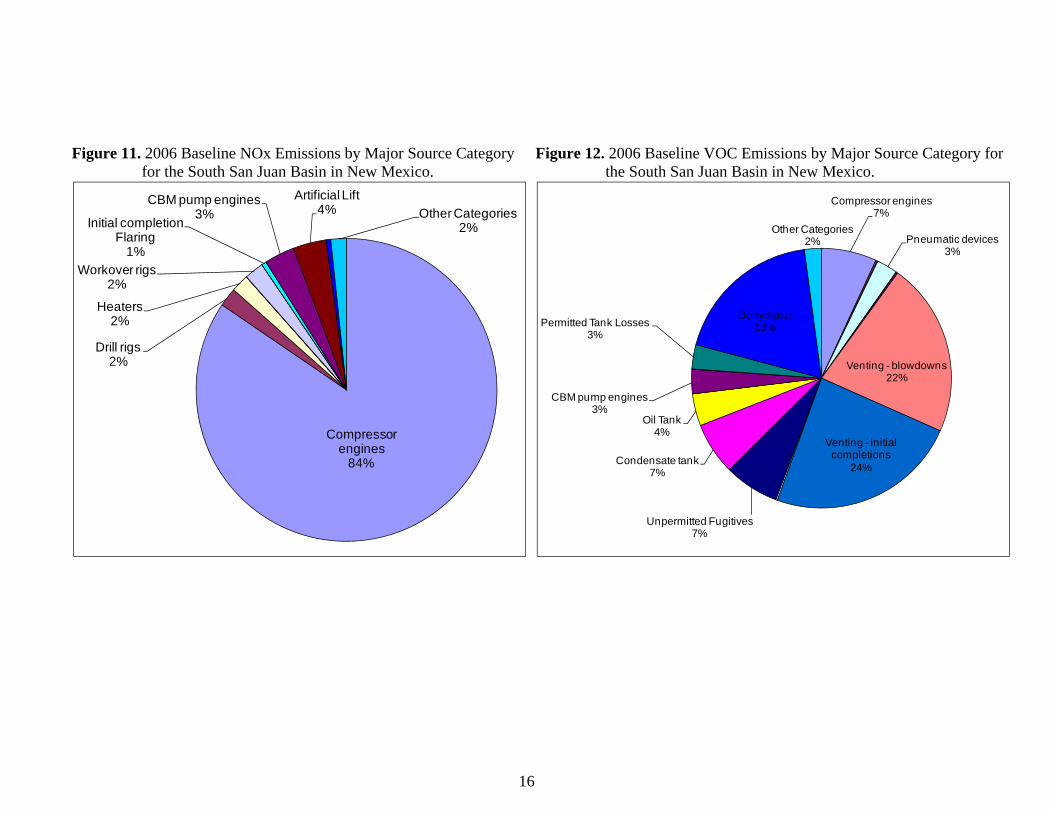
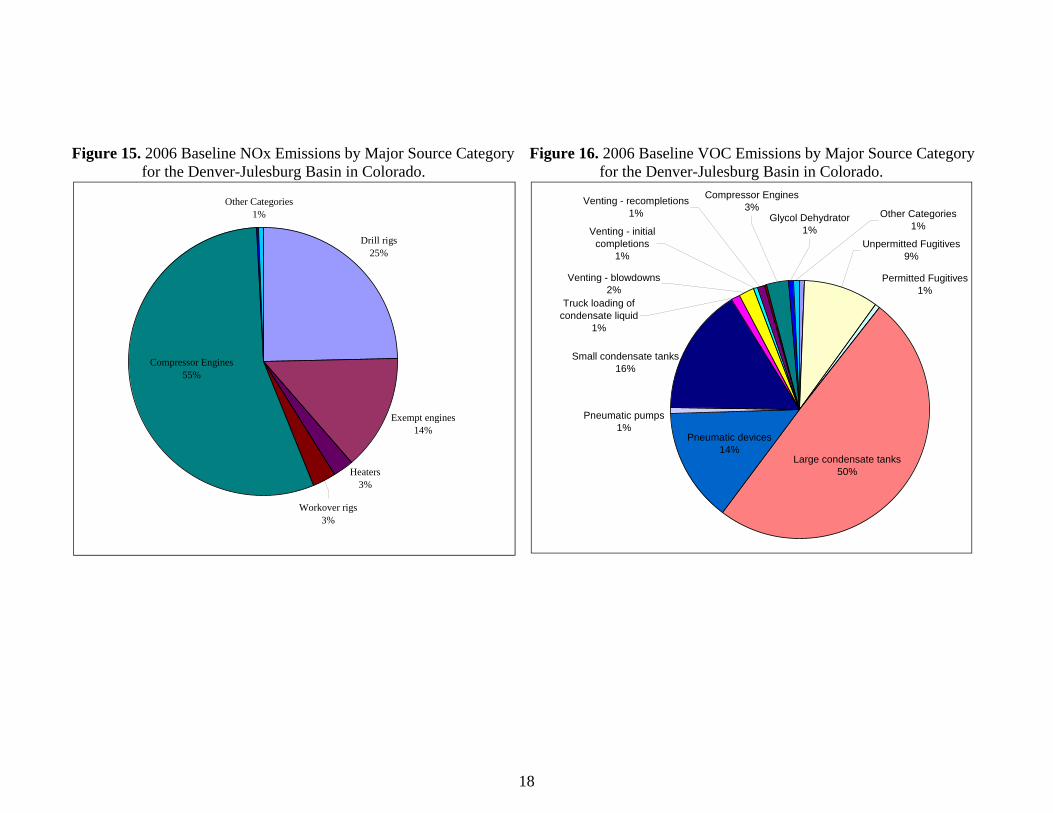
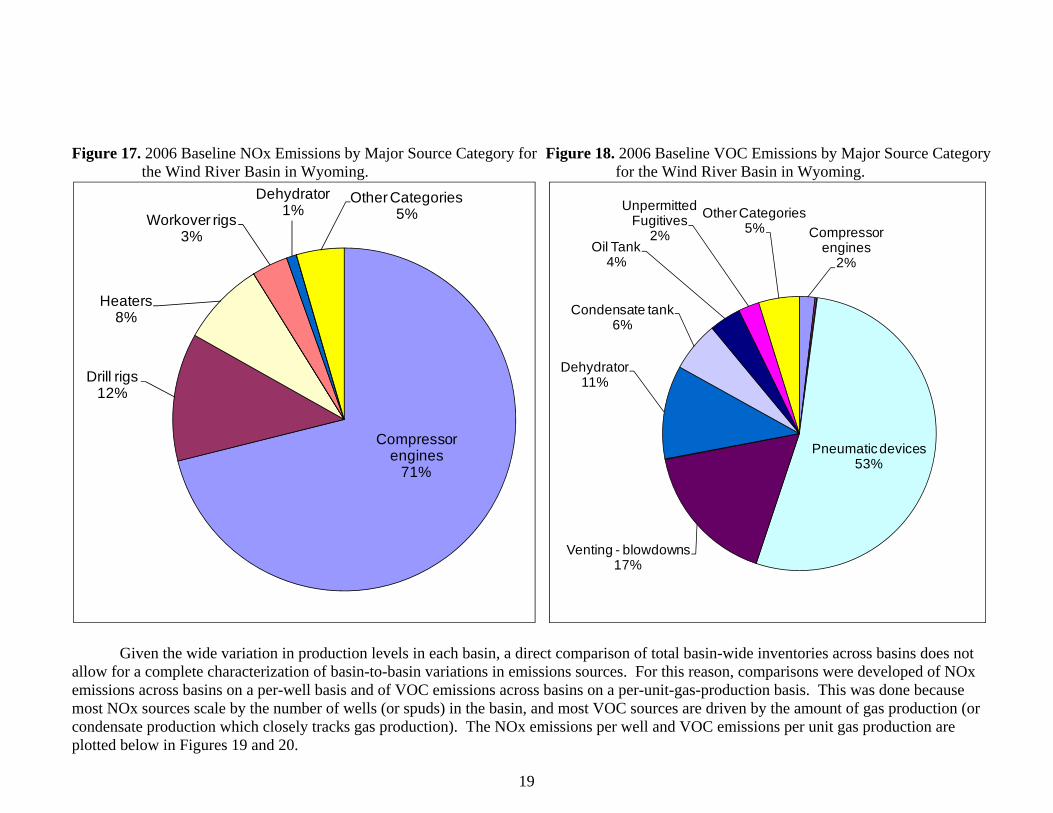
Emissions are also summarized by source category for the baseline 2006 emissions inventories for each basin, as shown in Figures 9-18 below for both NOx and VOC emissions. The by-source-category breakdown of the emissions inventories for the various basins shown below demonstrate the variability between basins in equipment usage and activities, and further demonstrate the importance of regional inventories at the basin level to capture this variability. In the D-J Basin, low field pressures require more frequent usage of compression to achieve adequate pipeline pressure, with resulting NOx emissions. In the Uinta Basin, where exploration and production activity is more recent, field pressures are higher resulting in less usage of compressors and hence lower NOx emissions than in the D-J Basin. However, the Uinta Basin is more active in terms of drilling and therefore drilling-related NOx emissions are correspondingly more significant in the Uinta Basin than in the D-J Basin. In the North San Juan Basin, the vast majority of NOx emissions are driven by compression as there is little drilling activity occurring in this basin, low VOC content of the gas and little condensate production leading to minimal usage of flares and associated emissions from flaring. The South San Juan Basin NOx emissions are dominated by the high usage of wellhead compressors relative to other basins, to compensate for declining field pressures. Similarly the Wind River Basin NOx emissions are compressor-dominated, with relatively little drilling activity. The VOC emissions break-down by source category is highly variable among basins. The VOC emissions in the D-J Basin are dominated by condensate tanks, due to the large condensate production region in Weld County in the D-J Basin. In the Uinta Basin pneumatic devices and dehydrators (both of which are unregulated in Utah) are the dominant VOC source categories. In the North San Juan Basin, because of the low VOC content of the predominantly CBM gas production and some controls practices in usage in the basin, VOC emissions from compressor engines are the dominant VOC source. In the Wind River Basin, well blowdowns and pneumatic devices make up the majority of VOC emissions.
The results of the inventory for the basins indicate that despite the stringent permitting requirements in many states, a considerable fraction of the basin-wide emissions can be from unpermitted sources. Table 6 shows the fraction of NOx and VOC emissions from the 6 basins completed to date from unpermitted and permitted sources. It should be noted that in some basins state permit data was not used for technical reasons, which is not intended to indicate that state inventories derived from permit data would not capture these emissions. The Colorado basins, show that despite the use of the APENs data and the low permitting threshold of 2 tpy for all sources, this inventory study added significant unpermitted emissions to the basin-wide total inventories for oil and gas. Table 6. 2006 Baseline NOx and VOC Emissions in the D-J and Piceance Basins in Colorado from
Permitted and Unpermitted Sources.
Source N. San Juan Basin
S. San Juan Basin
Piceance Basin
Uinta Basin
D-J Basin
Wind River Basin
%NOx Permitted Sources 29.3% 29.5% 49.1% 17.9% 55.8% 42.3%Unpermitted Sources 70.7% 70.5% 50.9% 82.1% 44.2% 57.7%
%VOC Permitted Sources 7.9% 8.9% 20.6% 1.8% 54.4% 4.3%Unpermitted Sources 92.1% 91.1% 79.4% 98.2% 45.6% 95.7%

15
Figure 9. 2006 Baseline NOx Emissions by Major Source Category for the North San Juan Basin in Colorado.
Figure 10. 2006 Baseline VOC Emissions by Major Source Category for the North San Juan Basin in Colorado.
Compressor engines 87%
Drill rigs 4%
Heaters 8%
Miscellaneous Engines 1%
Compressor engines87.9%
Heaters0.8%
Miscellaneous Engines
0.3%
Dehydrator0.7%
Oil Tank7.7% Other Categories
1.7%
16
Figure 11. 2006 Baseline NOx Emissions by Major Source Category for the South San Juan Basin in New Mexico.
Figure 12. 2006 Baseline VOC Emissions by Major Source Category for the South San Juan Basin in New Mexico.
Compressor engines
84%
Drill rigs2%
Heaters2%
Workover rigs2%
Initial completion Flaring
1%
CBM pump engines3%
Artificial Lift4% Other Categories
2%
Compressor engines7%
Pneumatic devices3%
Venting - blowdowns22%
Venting - initial completions
24%
Unpermitted Fugitives7%
Condensate tank 7%
Oil Tank4%
CBM pump engines3%
Permitted Tank Losses3%
Dehydrator19%
Other Categories2%

17
Figure 13. 2006 Baseline NOx Emissions by Major Source Category for the Uinta Basin in Utah.
Figure 14. 2006 Baseline VOC Emissions by Major Source Category for the Uinta Basin in Utah.
Dehydrator1%
Artificial Lift17%
Miscellaneous engines1%
Workover rigs2%
Heaters8%
Permitted Sources18% Compressor engines
17%
Drill rigs36%
Compressor engines1%
Drill rigs1%
Pneumatic devices21%
Pneumatic pumps12%
Unpermitted Fugitives3%
Artificial Lift1%
Venting - Compressor Startup
1%
Venting - Compressor Shutdown
1%
Dehydrator28%
Condensate tank 9%
Oil Tank20%
Permitted Sources2%
18
Figure 15. 2006 Baseline NOx Emissions by Major Source Category for the Denver-Julesburg Basin in Colorado.
Figure 16. 2006 Baseline VOC Emissions by Major Source Category for the Denver-Julesburg Basin in Colorado.
Drill rigs25%
Exempt engines14%
Other Categories1%
Workover rigs3%
Heaters3%
Compressor Engines55%
Large condensate tanks50%
Other Categories1%
Pneumatic devices14%
Permitted Fugitives1%
Venting - recompletions1%
Truck loading of condensate liquid
1%
Venting - initial completions
1%
Small condensate tanks16%
Pneumatic pumps1%
Venting - blowdowns2%
Unpermitted Fugitives9%
Glycol Dehydrator1%
Compressor Engines3%
19
Figure 17. 2006 Baseline NOx Emissions by Major Source Category for the Wind River Basin in Wyoming.
Figure 18. 2006 Baseline VOC Emissions by Major Source Category for the Wind River Basin in Wyoming.
Given the wide variation in production levels in each basin, a direct comparison of total basin-wide inventories across basins does not allow for a complete characterization of basin-to-basin variations in emissions sources. For this reason, comparisons were developed of NOx emissions across basins on a per-well basis and of VOC emissions across basins on a per-unit-gas-production basis. This was done because most NOx sources scale by the number of wells (or spuds) in the basin, and most VOC sources are driven by the amount of gas production (or condensate production which closely tracks gas production). The NOx emissions per well and VOC emissions per unit gas production are plotted below in Figures 19 and 20.
Compressor engines
71%
Drill rigs12%
Heaters8%
Workover rigs3%
Dehydrator1%
Other Categories5%
Compressor engines
2%
Pneumatic devices53%
Venting - blowdowns17%
Dehydrator11%
Condensate tank 6%
Oil Tank4%
Unpermitted Fugitives
2%Other Categories
5%

20
Figure 19. 2006 Baseline and 2012 Midterm Projection NOx Emissions Per Well for All Basins Completed To Date.
Figure 20. 2006 Baseline and 2012 Midterm Projection VOC Emissions Per Well for All Basins Completed To Date.
0.00
0.50
1.00
1.50
2.00
2.50
D-J Uinta Piceance North San Juan
South San Juan
Wind River
Em
issi
on
s (t
on
s/ac
tive
wel
l)
Base Year (2006)Future Year (2012*)
0
50
100
150
200
250
300
350
400
D-J Uinta Piceance North San Juan
South San Juan
Wind River
Em
issi
on
s(t
on
s/B
CF
tota
l gas
pro
du
ctio
n)
Base Year (2006)Future Year (2012*)

21
As Figures 19 and 20 show, NOx emissions per well per year are relatively consistent across a large
number of basins, including the Uinta, Piceance, North San Juan, and South San Juan. Both the D-J and Wind River Basins are outliers. In the case of the D-J this may be due to some centralization of compression and the use of low-NOx compression (such as lean-burn engines and turbines) driven by concerns over ozone formation in Weld County and the nearby metropolitan Denver area. Similarly, in the Wind River Basin the compression is subject to the NOx Best Available Control Technology (BACT) requirements promulgated by the Wyoming Department of Environmental Quality (WYDEQ) in Fremont County, which is a concentrated development area. NOx emissions on a per-well basis are projected to decrease for all basins between 2006 and 2012, primarily as a result of the EPA’s New Source Performance Standards (NSPS) for compressors. For the comparison of VOC emissions on a per-unit-gas-production basis across basins, the D-J and Uinta basins are outliers. In the D-J Basin, large volumes of condensate are produced along with the gas production and the VOC content of the gas is high relative to other basins on a basin-wide average basis. Thus, despite stringent controls requirements the VOC emissions per unit gas production are high in this basin. Similarly, in the Uinta Basin the condensate and oil production are high relative to other basins, but the controls requirements are minimal in this basin and much of the development occurs on tribal land where the Utah Division of Air Quality (UTDAQ) does not have jurisdiction for air quality issues. Emissions of VOC on a per-unit-gas-production basis are not uniformly expected to decrease for all basins, and this is largely driven by the applicability of state-driven controls requirements. In the Uinta Basin there are few controls requirements for VOC-generating processes in oil and gas exploration and production, and in the case of the Wind River Basin, despite stringent requirements by the WYDEQ, some production is expected to grow on tribal land where the WYDEQ regulations are not applicable. Inventory Use in Air Quality Modeling
The results of the Phase III inventory development project have already been used in air quality modeling efforts in the Rocky Mountain region. Recently the Denver Regional Air Quality Council (RAQC) utilized the Phase III inventories for the D-J and Piceance Basins in ozone State Implementation Plan (SIP) modeling for the Denver metropolitan area8. The baseline 2006 and 2012 projected emissions from the Phase III work were used for these two years respectively. New 2015 and 2020 projections were developed from the historic data and extrapolations created as part of the Phase III 2012 emissions projection work. The RAQC chose to use the Phase III inventory because of the significant additional emissions inventory of NOx and VOC emissions from unpermitted sources which were not captured in the inventory developed by the CDPHE through the APENs database. The resulting modeling indicated that oil and gas sources were significant for future year ozone attainment, and a subsequent controls scenario for oil and gas sources was developed incorporating information on existing controls for oil and gas sources from the inventory.
To better understand potential air quality impacts of oil and gas development in the Uinta Basin, the Western Energy Alliance and the Bureau of Land Management in conjunction with other state agencies initiated the Uinta Basin Air Quality Study (UBAQS)9. This was the first complete air quality modeling study that utilized the Phase III oil and gas inventory results to analyze air quality impacts. The baseline 2006 and projected 2012 Phase III emissions inventories were used to determine whether ozone National Ambient Air Quality Standards (NAAQS) would be met in the 2012 year. Despite predictions of continued extensive oil and gas development and increases in both NOx and VOC emissions from the oil and gas sector, the modeling predicted that no additional monitoring sites would violate the ozone NAAQS in the rural counties of the basin where most oil and gas development is occurring. This study was only possible because of the detailed oil and gas inventory data collected as part of the Phase III work, since the State of Utah permit data would not cover most minor well site oil and gas sources.
The New Mexico Environment Department (NMED) and other stakeholders have been involved in joint work to conduct air quality modeling in the Four Corners region in Northwestern New Mexico through the Four

22
Corners Air Quality Task Force10. The Task Force worked with its members to develop an air quality modeling analysis for the 10-county Four Corners region considering a base year of 2005 and projections to 201811. The base year inventory for oil and gas sources in this analysis was the WRAP Phase II data4, and future year mitigation options were developed considering the by-source-category emissions contributions developed in the Phase II study. Subsequent to the completion of this report and the publication of the Phase III inventory results for the South San Juan Basin, the NMED informally reviewed the findings of the Phase III study relative to the Phase II study. NMED determined that there were significant differences between these studies, particularly for VOC emissions source categories such as pneumatic devices and fugitive emissions. The Task Force is currently considering additional studies to incorporate the results of the Phase III inventory work into the air quality modeling. Future Work
As mentioned earlier in the paper, the Phase III inventory scope does not include on-road and off-road mobile sources associated with exploration and production (E&P) activity, other than drilling and workover rigs. To evaluate the full emission picture and allow complete assessment of the impact of oil and gas field operations, the WRAP is coordinating a pilot study focusing on the Piceance Basin in Northwestern Colorado known as the Piceance Pilot Project (P3). P3 will evaluate the tailpipe exhaust, fuel evaporative emissions and particulate from tire/brake wear and paved/ unpaved road dust generated from vehicular activity (employee access, management and equipment service traffic, light and heavy duty delivery vans, etc.) and heavy duty construction equipment (graders, scrapers, bulldozers, cranes, etc.) operating continuously in western oil and gas fields. Once the Piceance mobile source inventory is quantified, the emission totals will be compared against the point and area source emissions to evaluate the significance of the mobile source emissions in the overall picture of impacts from the oil and gas industry. In addition, under the project a set of “unit operation” factors will be developed to help translate the evaluation of Piceance Basin mobile activity to other oil and gas basins in the Rocky Mountain west. The project is sponsored by the Air Quality management agencies for the States of Colorado, New Mexico, Utah and Wyoming, and funded through EPA’s Energy Overtarget program.Also mentioned earlier in this paper was the fact that the Phase III project has a 2006 calendar year baseline inventory. Because the oil and gas industry is a rapidly changing industry, with new operations starting and production from older fields eventually dropping off, the 2006 baseline inventory falls further out of date as time goes on. Therefore, after completing the 2006 work, a Phase IV inventory effort will begin to bring the inventory to a more current 2009 baseline. And the WRAP in envisions making these triennial updates regularly in the future to make sure that the inventories remain current for accurate policy determination and analysis.
Several studies were mentioned in the “Air Quality Modeling” section of this paper which have already made use of the Phase III oil and gas emission inventory. Another potential use of these inventories is in a regional analysis of potential control strategies for the states impacted by oil and gas operations. Oil and gas operations potentially affect compliance with ambient air quality standards for ozone, particulate and other pollutants. Thus state agencies are interested in evaluating what potential emissions control measures may accomplish to help ameliorate the impacts from the oil and gas industry.
Finally, since most western oil and gas operations are undertaken on public lands, the U.S. Bureau of Land Management (BLM) is the agency that reviews applications and grants leases for oil and gas development on these public lands. In order to weigh the consequences and benefits of developing a specific proposal, the BLM typically conducts Environmental Assessments or Environmental Impact Statements under the National Environmental Policy Act (NEPA). Historically these economic/environmental evaluations have been conducted in isolation, using emission inventories compiled for a particular project, without full consideration of the impacts of other projects in the region. There is a benefit to using WRAP Phase III inventories and triennial updates in these NEPA analyses, which are regionally consistent in calculation methodology and assumptions. Thus it is anticipated that the WRAP oil and gas emission inventories which are regionally

23
consistent will eventually be used in regional NEPA evaluations to assure that all area impacts are considered with uniform analysis.
CONCLUSIONS
This work presents the results of an inventory development project to estimate emissions from oil and gas exploration and production activities in the Rocky Mountain States. This inventory project builds on past inventories developed for the Rocky Mountain region oil and gas activities by WRAP and other state agencies. This Phase III inventory makes significant improvements in scope and level of detail over the past inventories, including more source categories of emissions from both combustion-related activities and gas venting processes, examining the emissions in more detail using both detailed survey data and permit data for facilities, and projecting the emissions to 2012 using a very geographically localized methodology that considers planned activities in specific oil and gas development areas. The results of the inventory are an improvement over state inventory efforts, as seen in the analysis of permitted and unpermitted source emissions in Colorado. The Phase III inventories are already being used in a variety of regional and local air quality projects with plans to incorporate the remaining uncompleted basin inventories into additional studies once these inventories have been completed. REFERENCES
1. Pollack, A.K.; Russell, J.; Grant, J.; Friesen, R.; Fields, R.; Wolf, M., “Ozone Precursors Emissions Inventory for San Juan and Rio Arriba Counties, New Mexico”; Prepared for New Mexico Environment Department by ENVIRON International Corporation, Novato, CA 2006.
2. Pollack, A.K.; Russell, J.; Rao, S.; Mansell, G., “Wyoming 2002 Emission Inventory: Mobile and Area Source Emissions”; Prepared for Wyoming Department of Environmental Quality by ENVIRON International Corporation, Novato, CA 2005.
3. Russell, J.; Pollack, A.K., “Oil and Gas Emission Inventories for the Western States”; Prepared for Western Governors’ Association by ENVIRON International Corporation, Novato, CA 2005.
4. Bar-Ilan, A.; Friesen, R.; Pollack, A.; Hoats, A., “WRAP Area Source Emissions Inventory Protections and Control Strategy Evaluation Phase II”; Prepared for Western Governors’ Association by ENVIRON International Corporation, Novato, CA 2007.
5. ENVIRON International Corporation; SAIC., “Oil and Gas Exploration and Production Greenhouse Gas Protocol”; Prepared for Western States Regional Air Partnership, 2009.
6. WRAP O&G Mobile Sources Pilot Project. http://wrapair.org/forums/ogwg/meetings/090129c/2009-01_Mobile_Source_Pilot_Project_SOW_draft_1-15.pdf (accessed February 2010).
7. WRAP Phase III. http://wrapair.org/forums/ssjf/ (accessed February 2010). 8. ENVIRON International Corporation; Alpine Geophysics., “Denver Metropolitan Area and North Front
Range 8-Hour Ozone State Implementation Plan Emissions Inventory, Draft Final Report”; Prepared for Regional Air Quality Council and Colorado Department of Public Health and the Environment, 2008.
9. ENVIRON International Corporation., “Uinta Basin Air Quality Study (UBAQS)”; Prepared for Independent Petroleum Association of Mountain States, 2009.
10. Four Corners Air Quality Task Force. http://www.nmenv.state.nm.us/aqb/4C/ (accessed March 2010). 11. Stoeckenius, T.E.; Emery, C.A.; Shah, T.P.; Johnson, J.R.; Parker, L.K.; Pollack, A.K., “Air Quality
Modeling Study for the Four Corners Region”; Prepared for New Mexico Environment Department, Air Quality Bureau by ENVIRON International Corporation, Novato, CA 2007.

24
ACKNOWLEDGEMENTS
The authors wish to acknowledge the support of Tom Moore and Lee Gribovicz with the Western Regional Air Partnership (WRAP), and the support of air division staff in New Mexico, Colorado, Utah and Wyoming for their participation in the project and their assistance in obtaining information on permitted sources. The authors also wish to acknowledge the extensive support received from the oil and gas companies who have participated in this study by providing detailed survey data and other information.

25
KEY WORDS Oil and Gas Emissions Inventories Rocky Mountain Venting Fugitive