
A COMPARITIVE STUDY OF Acoustics in university lecture theatres (Autosaved)
54
A Comparative Study of Acoustics in University Lecture Theatres Paul McEvoy BEng Architectural Engineering Heriot Watt University School of the Built Environment 8 th /4 th /2015 “The copyright in this thesis is owned by the author. Any quotation from the thesis or use of any of the information contained in it must acknowledge this thesis as the source of the quotation or information."
-
Upload
paul-mcevoy -
Category
Documents
-
view
202 -
download
0
Transcript of A COMPARITIVE STUDY OF Acoustics in university lecture theatres (Autosaved)

A Comparative Study of Acoustics in
University Lecture Theatres
Paul McEvoy
BEng Architectural Engineering
Heriot Watt University
School of the Built Environment
8th/4th/2015 “The copyright in this thesis is owned by the author. Any quotation from the thesis or use of any of the information
contained in it must acknowledge this thesis as the source of the quotation or information."

Paul McEvoy
1
Abstract Building Bulletin 93, used in conjunction with the Building Regulations approved document E, requires designers of all new school buildings to comply with new standards, set out in order to improve the acoustic environment of all school buildings. This legislation came into force in 2003 leaving many educational buildings with poor acoustic properties. Given the significant amount of research carried out on the effects of poor acoustics on students and teachers in primary and secondary schools in the UK, little knowledge on the acoustic qualities and the impact of poor acoustics upon students and lecturers of higher educational buildings currently exists.
This dissertation compares two lecture theatres, one built pre 2003 (James Watt Centre 1), and the other built after (Cairn Auditorium) these regulations came about. External, occupied and ambient noise levels were measured for each lecture theatre along with their associated reverberation times. These were compared and checked to see where they lie in relation to current design standards. The student’s and Lecturer’s perceptions of each lecture theatre was also investigated through the use of a questionnaire survey. A detailed statistical analysis of participant’s responses to the survey, using SPSS, followed in order to identify a significant difference between each lecture theatre.
It was found that no major difference between the acoustic metrics of each lecture theatre currently exists. Students and lecturers also have very similar perceptions of the acoustic conditions in each of the lecture theatres on the Heriot Watt campus. Through research, it was found that in 2007 alterations were made to bring the acoustic properties of the James Watt Centre 1 up to BB93 standards. This explains why a theatre opened in 1990 would have similar acoustic properties to one opened 20 years later. This leads us to the conclusion that design standards set out by Building Bulletin 93 are proven to satisfy the learning and teaching capabilities of students and lecturers in university buildings, and once dated buildings are brought up to current BB93 standards, the risk of poor classroom acoustics and its negative impact on learning and teaching is eliminated.

Paul McEvoy
2
Contents Abstract ...................................................................................................................................... 1
List of Figures ............................................................................................................................ 4
Dissertation Declaration ............................................................................................................. 5
Acknowledgements .................................................................................................................... 6
Introduction ................................................................................................................................ 6
Literature Review ....................................................................................................................... 7
School Analysis ...................................................................................................................... 7
Current Standards and Legislation for Acoustic Design of University Buildings ................. 7
The Building Regulations Part E – Resistance to the Passage of Sound ............................ 7
Building Bulletin 93 ........................................................................................................... 8
The History of Acoustic Design for Universities in the UK ................................................ 10
The Impact of Poor Acoustics on Student and Lecturers ..................................................... 10
Students ............................................................................................................................ 10
Teachers ............................................................................................................................ 11
Materials ............................................................................................................................... 12
Aim .......................................................................................................................................... 12
Objectives ............................................................................................................................. 12
Demographics ................................................................................................................... 12
Disturbances ..................................................................................................................... 13
Sound Evaluation .............................................................................................................. 13
Methodology ............................................................................................................................ 14
Participants ........................................................................................................................... 14
Setting ................................................................................................................................... 14
James Watt Centre 1 ......................................................................................................... 14
Cairn Auditorium (PGG01) .............................................................................................. 15
Stimuli .................................................................................................................................. 15
James Watt Centre 1 ......................................................................................................... 15
Cairn Auditorium (PGG01) .............................................................................................. 16
Apparatus ............................................................................................................................. 16
Measures ............................................................................................................................... 17
External Noise Level ........................................................................................................ 17
.......................................................................................................................................... 18
Paul McEvoy
3
Occupied Noise Level ...................................................................................................... 19
Ambient Noise Level ........................................................................................................ 20
.......................................................................................................................................... 21
Reverberation Times ......................................................................................................... 21
Students and Lectures Perception of their Acoustic Environment ................................... 21
Procedure .............................................................................................................................. 24
Analysis .................................................................................................................................... 25
External Noise Level ............................................................................................................ 25
Occupied Noise Level .......................................................................................................... 25
Ambient Noise Level ........................................................................................................... 25
Reverberation Time .............................................................................................................. 25
Student and Lecturers Perceptions of their Acoustic Environment ..................................... 26
Demographics ....................................................................................................................... 26
Hearing Impairment .......................................................................................................... 26
Home Location ................................................................................................................. 26
Disturbances ......................................................................................................................... 27
Sound Evaluation ................................................................................................................. 27
Sound Evaluation .............................................................................................................. 27
Ease of Hearing ................................................................................................................ 27
Concentration .................................................................................................................... 28
Teaching ........................................................................................................................... 28
Difficulty Hearing ............................................................................................................. 28
Results ...................................................................................................................................... 29
External Noise Level ............................................................................................................ 29
James Watt Centre 1 ......................................................................................................... 29
Cairn Auditorium .............................................................................................................. 29
Occupied Noise Level .......................................................................................................... 29
James Watt Centre 1 ......................................................................................................... 29
Cairn Auditorium .............................................................................................................. 29
Unoccupied Noise Level ...................................................................................................... 30
James Watt Centre 1 ......................................................................................................... 30
Cairn Auditorium .............................................................................................................. 30
Reverberation Time .............................................................................................................. 30
Paul McEvoy
4
James Watt Centre 1 ......................................................................................................... 30
Cairn Auditorium .............................................................................................................. 31
Demographics ....................................................................................................................... 31
Home Location ................................................................................................................. 31
Disturbances ......................................................................................................................... 33
Noise from Inside the Lecture Theatre ............................................................................. 33
Noise from Outside the Lecture Theatre .......................................................................... 34
Sound Evaluation ................................................................................................................. 36
Sound Evaluation .............................................................................................................. 36
Ease of Hearing ................................................................................................................ 37
Concentration .................................................................................................................... 38
Teaching ........................................................................................................................... 38
Difficulty Hearing ............................................................................................................. 39
Discussion ................................................................................................................................ 40
Conclusion ............................................................................................................................... 45
Further Work ............................................................................................................................ 45
Bibliography ............................................................................................................................ 46
Appendix .................................................................................................................................. 49
Reverberation Time Calculations ......................................................................................... 49
Student Questionnaire Survey .............................................................................................. 50
Lecturers Questionnaire Survey ........................................................................................... 52
List of Figures Figure 1: James Watt Centre 1, Heriot Watt University 14
Figure 2: Cairn Auditorium, Heriot Watt University ............................................................... 15 Figure 3: Environmental and Industrial Sound Level Meter Class 1 ....................................... 16 Figure 4: Gitzo GT2941 Basalt Tripod .................................................................................... 16 Figure 5: Stanley Fat Max Tru Laser ....................................................................................... 17 Figure 6: External Sound Pressure Level Measure Locations – James Watt Centre 1 ............ 18 Figure 7: Figure 6: External Sound Pressure Level Measure Locations – Cairn Auditorium . 18 Figure 8: Occupied Noise Level Measure Location - James Watt Centre 1 ............................ 19 Figure 9: Occupied Noise Level Measure Location - Cairn Auditorium ................................ 19 Figure 10: Unoccupied Noise Level Measure Locations - James Watt Centre 1 .................... 20 Figure 11: Unoccupied Noise Level Measure Locations - Cairn Auditorium ......................... 21
Paul McEvoy
5
Figure 12: List of Possible Noise Sources from Inside the Lecture Theatre (Image taken from Questionnaire Survey) ............................................................................................................. 22 Figure 13: Part Example of Coding Sheet Produced During SPSS Data Entry ....................... 26 Figure 14: SPSS Cross Tabulation Comparing Concentration Level of Students from Country Location to Students from Urban Location in the Cairn Auditorium ...................................... 32
Dissertation Declaration I hereby declare that this dissertation is my own work and effort and it has not been previously submitted to any other University. Sources of information that have been used in this dissertation have been acknowledged.
Signature: ………………………………
Date: …………………………………….
Paul McEvoy
6
Acknowledgements This dissertation would not have been possible without the guidance and help of several individuals, who in one way or another contributed and extended their valuable assistance in the preparation and completion of this study.
The researcher would like to begin by thanking Dr Sarah R Payne for her continuous guidance, support and endless encouragement throughout the duration of his final year. Not only providing her own expertise, she gave the opportunity for the researcher to gather further knowledge from other talented faculty members.
The researcher would like to express his sincere appreciation to Dr Laurent Galburn for his in depth knowledge and expertise in the field of acoustics, and in allowing generous use of sound measuring equipment. Professor Michael Danson and Emma Guion Akdag were again of invaluable help in allowing the researcher to carry out essential measurements during their dedicated teaching time.
Finally, the researcher would like to offer a special thanks to family and friends who gave full support throughout the duration of this dissertation.
Introduction Building Bulletin 93, used in conjunction with the Building Regulations, requires designers of all new school buildings to comply with new standards, which have been set out in order to improve the acoustic environment of all school buildings. These standards outline specific design parameters, which are to be met through improved ambient noise control, sound insulation requirements and reverberation time limits. This change came into force in 2003 leaving many educational buildings with poor acoustic properties.
Over the last number of years a significant amount of research has gone into investigating specific effects of poor acoustics on students and teachers. However, most of the studies carried out have focused primarily on the effects that noise and reverberation has on students and teacher’s health and performance in both primary and secondary school buildings. Additionally, surveys of acoustic conditions in schools in the UK have also been undertaken, (Shield & Dockrell, 2004) in order to establish whether or not schools are meeting current acoustic design standards mainly in primary and secondary schools. This leaves little knowledge on acoustic qualities of university buildings and the impact of poor acoustics upon the students and lecturers of these buildings.
The overall acoustic conditions along with student’s and lecturer’s attitude towards their acoustical environment of two lecture theatres in Heriot Watt University, Edinburgh, Scotland will be compared and checked to see if they comply with current design standards set out by Building Bulletin 93. On completion of this study, a conclusion will be made on whether or not a significant difference exists between both lecture theatres.

Paul McEvoy
7
Literature Review
School Analysis Shields and Dockrell reviewed issues relating to the effects of noise on children in primary school. They investigated factors that affect speech intelligibility in classrooms, how environmental and classroom noise effects children’s academic performance and children’s annoyance due to noise. Their study also included a series of classroom noise in order to determine whether or not these classrooms were complying with current standards or not. On completion of their review, they concluded with current acoustic design standards that exist for classrooms and established if the classrooms they reviewed met these requirements or not, (Shields,Doclrell, 2003)
Conetta, Cox, Mydlarz, Connolly, Shields and Dockrell investigated the acoustic conditions of secondary schools in England in order to examine how the acoustic environment impacts on teaching and learning of children aged between 11 and 16 years old. They conducted a number of detailed acoustic and noise surveys from a total of 185 teaching spaces within 13 different schools. Questionnaire surveys along with cognitive testing were also conducted in different noise conditions. Results from these surveys of unoccupied spaces are presented and compared to the current standards that were introduced by the Building Regulations in 2003. Noise levels that were measured are summarised and levels associated with different subjects and teaching activities have been examined. After they compared noise levels with unoccupied acoustic data, they found that the better the acoustic design of the school building was the lower were lesson noise levels (Shields.Conetta.Cox.Mydlarz.Dockrell.Connolly, 2013).
Current Standards and Legislation for Acoustic Design of University Buildings
The Building Regulations Part E – Resistance to the Passage of Sound Section E4 of the Building Regulations (Acoustic Conditions in Schools) states that for the design of acoustic conditions in schools, each room or other spaces within the school shall be designed and constructed in such a way that it has the acoustic conditions and the insulation against disturbances by noise appropriate to its intended use. Through improved design of ambient noise control, sound insulation requirements and reverberation time limits, each school buildings teaching space must now have a maximum indoor ambient noise level of 35 dB with a reverberation time of less than 0.6 seconds, (Department of Education & Skills, 2003). The secretary of state has said that in order to meet the requirements of section E4, the values for sound insulation, reverberation time and internal ambient noise set out in Building Bulletin 93 (Acoustic Design of Schools) should be followed (The Building Regulations, 2010). This bulletin and its required values will be discussed below in detail.

Paul McEvoy
8
Building Bulletin 93 This guide strives to provide acoustic conditions in schools that will facilitate clear communication of speech between students and teachers and so that the design won’t interfere with study activities. This objective is achieved through careful design of the following variables:
Ambient Noise Ambient noise, also known as background noise, is any sound other than the sound that is being monitored. Sound meters are used to establish ambient noise levels, (Smith.Peters.Owen, 1982). The control of ambient noise is a key factor in providing an environment that allows clear communication of speech between students and teachers, between the students themselves and carrying out study activities. Indoor ambient noise levels are influenced by external sources, building services, teaching activity, equipment and climate issues, (Brunel University London, 2003). External sources relates to noise from outside the school premises, excluding the playground area. This noise can be from road, rail or air traffic, industrial plants and also commercial premises. Building services equipment such as the ventilation system, heating system, rain water harvesting system or any other piece of equipment located in the plant room will have an impact on the ambient noise level. If the school is to be naturally ventilated, it is assumed that the windows or any other vented openings are fully opened and if it is to be mechanically ventilated, maximum load will be taken as a constant. Sound from staff, students and equipment such as cleaning, computers and projectors will also have an effect on the overall ambient indoor noise level. This noise that is transmitted through spaces is known as airborne and it impacts sound insulation requirements in which we will look at later. Finally, climate issues such as noise from rain will also contribute to the overall ambient noise levels of the school. This is measured when such building elements like lightweight roof material or roof lights are being considered in the design (Department of Education & Skills, 2003).
Sound Insulation
Airborne Sound Insulation between Spaces BB93 displays values for the required minimum airborne sound insulation between specific rooms within an educational building. The reason for sound insulation between spaces is to attenuate airborne sound transmitted between spaces through walls and floors.
Airborne Sound Insulation between Circulation and Other Spaces Used By Students Sound insulation between walls of circulation and other common areas corridors and stairs for example is required to attenuate airborne sound from these areas being transmitted to other areas of the school where expected noise levels will be less. BB93 provides values for minimum sound insulation requirements for separating wall constructions, door sets in the walls, and any ventilators in the wall (Department of Education & Skills, 2003).
Paul McEvoy
9
Impact Sound Insulation The objective to attenuate any noise being transmitted into spaces through the floor also exists in BB93. Values for recommended maximum weighted standardised impact sound pressure level for receiving rooms of different types and uses are giving in BB93. Impact sound pressure level, in decibel (dB) corresponds to BB93’s reference value of reverberation time in a receiving room (Department of Education & Skills, 2003). This value is calculated using an intricate formula. The resulting impact sound pressure level is measured in accordance with BS EN IOS 140-7:1998, (BATOD, 2001) .
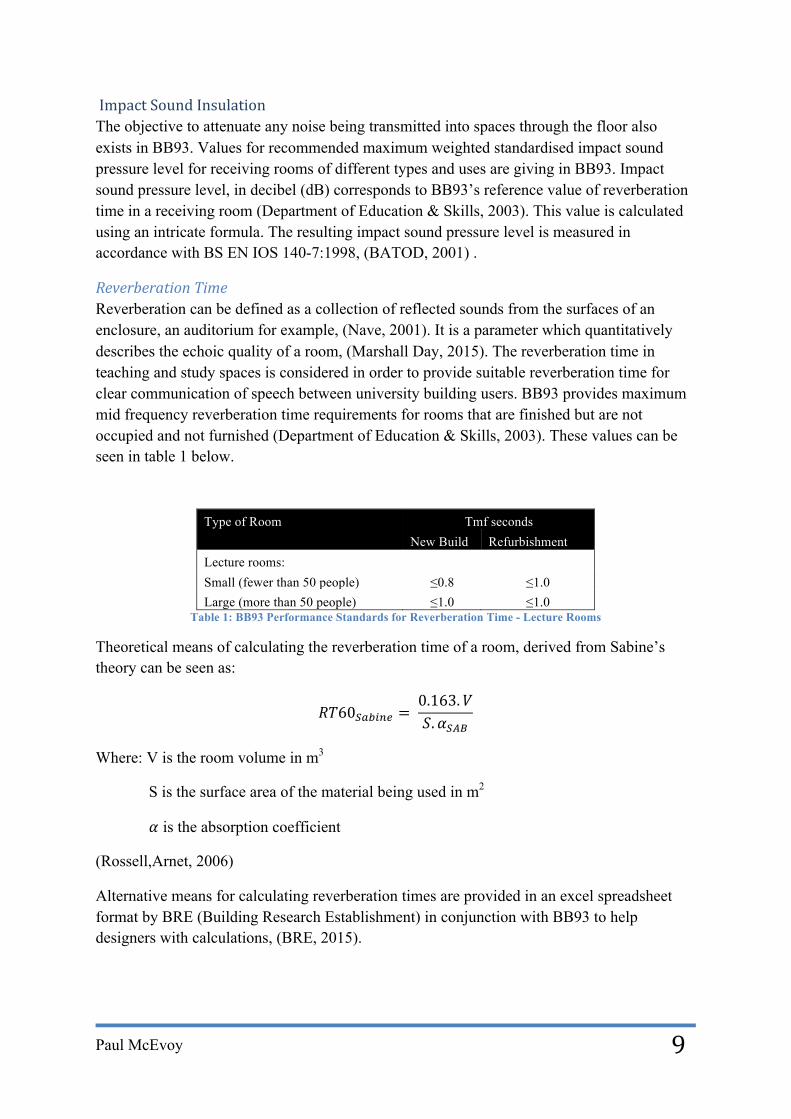
Reverberation Time Reverberation can be defined as a collection of reflected sounds from the surfaces of an enclosure, an auditorium for example, (Nave, 2001). It is a parameter which quantitatively describes the echoic quality of a room, (Marshall Day, 2015). The reverberation time in teaching and study spaces is considered in order to provide suitable reverberation time for clear communication of speech between university building users. BB93 provides maximum mid frequency reverberation time requirements for rooms that are finished but are not occupied and not furnished (Department of Education & Skills, 2003). These values can be seen in table 1 below.
Type of Room Tmf seconds New Build Refurbishment Lecture rooms:
Small (fewer than 50 people) ≤0.8 ≤1.0 Large (more than 50 people) ≤1.0 ≤1.0
Table 1: BB93 Performance Standards for Reverberation Time - Lecture Rooms
Theoretical means of calculating the reverberation time of a room, derived from Sabine’s theory can be seen as:
!"60!"#$%& = 0.163.!!.!!"#
Where: V is the room volume in m3
S is the surface area of the material being used in m2
! is the absorption coefficient
(Rossell,Arnet, 2006)
Alternative means for calculating reverberation times are provided in an excel spreadsheet format by BRE (Building Research Establishment) in conjunction with BB93 to help designers with calculations, (BRE, 2015).

Paul McEvoy
10
The History of Acoustic Design for Universities in the UK Higher educational buildings in the past and still to this day are not required to comply with standards in relation to good acoustic design. However, as many of the specifications outlined in BB93 are desirable, Universities and other higher educational buildings can be designed to the same standard, (Agency, 2012). In the past, a number of key factors have prevented the design of good acoustics for educational buildings; enforcement of legislation, financial constraints and guidance in this field.
Before 2003, part E of the Building Regulations ‘Resistance to the Passage of Sound’ did not apply to buildings used for educational purposes. The standard now includes these types of buildings within its scope. Previously, Constructional Standards for Schools quoted Building Bulletin 87 (BB87) as the standards for acoustics in schools, however many designers were unaware of the requirements of BB87 and therefore the standards were rarely enforced (Skills, 1997). More recently, these standards have been updated in order to reflect current research and the relevant requirements of the Disability Discrimination Act, (Legislation, 1995) which are all included in the compliance section, section one of Building Bulletin 93.
Another key factor that has affected good acoustic design in the past is finance related. The pressure of finance in the past has meant that acoustics came low on the list of design priorities. This is no longer the case, as now good acoustics will have a higher priority, as they will be subject to building control approval procedures, (Department of Education & Skills, 2003).
And finally, there has been little guidance in the past on how to achieve the right balance of acoustics in the complex and dynamic environment of a University building. Architects and designers have found it difficult finding information on how to make the design easy and in particular, to help them choose the correct values of appropriate parameters, (Department of Education & Skills, 2003).
The Impact of Poor Acoustics on Student and Lecturers
Students Schneider states that “good acoustics are fundamental to good academic performance”, (Schneider, 2002). Hines, Earthman and Lanham all carried out studies that investigated the overall condition of school buildings and how it affects student’s overall academic performance. In relation to acoustics; they found that it has been shown to have an impact on student learning. Acoustical control matters such as chronic noise exposure have been shown to hinder cognitive functioning and to impair pre reading and reading skills of students, (Hines, 1996) (Earthman, 2004) (Lanham, 1999). An online questionnaire survey of secondary school students on their impression of their schools acoustic environment was produced by Connolly, Dockrell, Shield, Conetta, and Cox. Ease of hearing in school spaces, sensitivity to noise, the consequences of noise in the classroom, and annoyance to intermittent noise, accounted for 43 per cent of the total variance in student’s responses to the

Paul McEvoy
11
questionnaire. Once responses were analysed they found that students with learning needs such as hearing impairment were significantly more affected by poor school acoustics than students who reported no additional learning needs. Students in the older age bracket were more sensitive to noise annoyance and to the consequences of poor acoustical conditions on their learning and behaviour than younger students. Finally, results showed that suburban school students that were not exposed to nearby noise sources were more positive about their school acoustics than students who attended schools that were exposed to external noise sources, (Connolly,Dockrell,Shield,Conetta,Cox, 2013). Additionally, Earthman and Lemaster found that the higher achievement student is associated with schools that have less external noise, (Earthman,Lemasters, 1998). Fleming and Storr investigated issues surrounding the impact of lecture facilities on students learning experience. They produced a questionnaire survey for students, asking questions in relation to the design of the lecture theatre in which they were timetabled in. One of the questions asked “Does the quality of a lecture theatre affect the learning experience?” found that 77.8 per cent of respondents indicated that the quality of the lecture theatre affected their learning experience. The students were also asked “How important are lecture theatre facilities to this teaching session” and the results showed that 85.5 percent of students rated facilities as being important with only 0.3 percent considering them to be irrelevant, (Fleming,Storr, 2006).
Teachers Teaching spaces with excessive background noise and reflective surfaces could be a barrier to learning and teaching, (Ramma, 2009). Lackney found that teachers believe noise can significantly impair academic performance, (Lackney, 1999). Poor acoustic conditions can increase strain on the voices of teachers and most teachers find it somewhat difficult to cope with high levels of noise. This often leads to prolonged use of the voice and the need to shout in order to keep control within the classroom. Recent surveys throughout the UK and elsewhere tell us that teachers form a misappropriate percentage of voice clinic patients, (Department of Education & Skills, 2003). Results from a study carried out on the ‘Frequency and Effects of Teacher’s Voice Problems’ suggest that teachers are at high risk of voice symptoms compared with others in the working population, (Smith, Gray,Dove,Kirchner and Heras, 1997), with the reason for this being largely dominated by poor acoustics.

Paul McEvoy
12
Materials Since the European Parliament made the protection against noise for building occupants a compulsory requirement in December 1988 and later amended in 2003, (Parliament, 2011) the selection of building materials has a key role to play in good acoustic design. The right materials have the potential to increase a sense of wellbeing, promote concentration, and reduce noise pollution, (Copper,Boyko,Codinhoto, 2008). Room acoustics is one of the easiest things for architects and designers to modify by varying materials and the surface areas of those particular materials. Acoustic ceilings, textiles, or perforated wood-based materials can be used to influence the proportion of direct sound in the overall sound level, direction of early reverberations and time decay, (Peters, 2013). Lecture theatres require a significant level of speech intelligibility and therefore a short reverberation time of less than one second is desirable, (BSRIA, 2015). The impact of acoustic materials is described as absorption coefficients (!) , with a value of between zero and one. Materials that produce an absorption coefficient value of 0.5 means that half of the sound is absorbed and half reflected whereas a value of one means that all of the sound reflection properties are cancelled out, (Peters, 2013).
Aim The aim of this dissertation is to compare the acoustic metrics along with student’s and lecturer’s perceptions of their acoustic environment in two lecture theatres in Heriot Watt University.
Objectives 1. Once the setting is selected, external, occupied and unoccupied noise level
measurements will be taken from each lecture theatre, compared and checked against current BB93 design standards.
2. The reverberation time of each lecture theatre will be calculated, compared and also checked to see whether or not it complies with current design standards.
3. After an in depth review of past literature and research on similar studies carried out, a comprehensive questionnaire survey will be developed for the students and lecturers to understand their perception of the acoustics in each lecture theatre.
4. The questionnaire survey will be split into three separate sections:
Demographics
Hearing Impairment Carry out a check to see if a participant has a hearing impairment or not and if they do their results must be analysed separately.
Home Location The idea behind asking this question is based on the fact that people who grew up in a quiet setting, who would be use to learning with little distraction such as external noise sources from traffic for example, would find it more difficult to concentrate in a room with external noise sources influencing the internal sound pressure level to those who grew up in an urban
Paul McEvoy
13
location with regular exposure to external noise sources. Similar with lecturers, if they grew up in a quiet setting, they might find it difficult to teach in a space with external noise sources impacting on the internal noise level.
Disturbances The thought behind this question is to try and establish the types of sounds participants are exposed to within the lecture theatres, and if these sounds have a negative impact on their learning or teaching abilities.
Sound Evaluation
Sound Evaluation A question asking the participants to evaluate the sound in the lecture theatre will be provided via nines attributes to see if they evaluate one lecture theatre better than the other.
Ease of Hearing This question will be asked with the intention of finding out if the students have trouble hearing the lecturer speak during a class or if the lecturer had trouble hearing his or her students during a class as a result of poor room acoustics.
Concentration Since concentration is a key trait that students must hold whilst trying to learn, it is important to know if the acoustic properties of the lecture theatres allow them to concentrate with ease or if their concentration levels are negatively impacted on due to the poor acoustic properties of the space in which they are being taught in.
Teaching Lecturers/teachers ability to teach is one of the most important attributes in education as it can be seen as the transformation from non-educated to educated students. If lecturers teaching capabilities are reduced as a result of poor room acoustics, this will have a drastic effect on the learning outcomes of the students.
Difficulty Hearing This question is aimed at finding out how difficult participants find it to hear in the lecture theatre under certain noise sources.
5. All data from the questionnaire surveys will be collected and entered into SPSS (Statistical Package for the Social Sciences) and a statistical analysis will be carried out for each separate section.
6. Results from the statistical analysis will be reviewed to see if the students and lecturers have a different perception of the acoustic environment in one lecture theatre than the students and lecturers of the other lecture theatre.
Paul McEvoy
14
Methodology
Participants Both students and lecturers, the key occupiers of the lecture theatres were asked to participate in this experiment.
Once an appropriate time and date for each experiment was decided, the lecturer was contacted via email. A brief description of the study being carried out was provided along with a request to be granted permission to attend their lecture on the chosen date, asking their students to take part in a questionnaire survey was given. It was made clear that the researchers presence would be of no disruption to the class and that it was of complete discretion whether the lecturer and their students wished to take part in the experiment or not.
Setting After much consideration, it was decided that two locations on the Heriot Watt University campus would be used. They were;
1. James Watt Centre 1, Heriot Watt University, Edinburgh. 2. Cairn Auditorium, (Room PGG01), Heriot Watt University, Edinburgh.
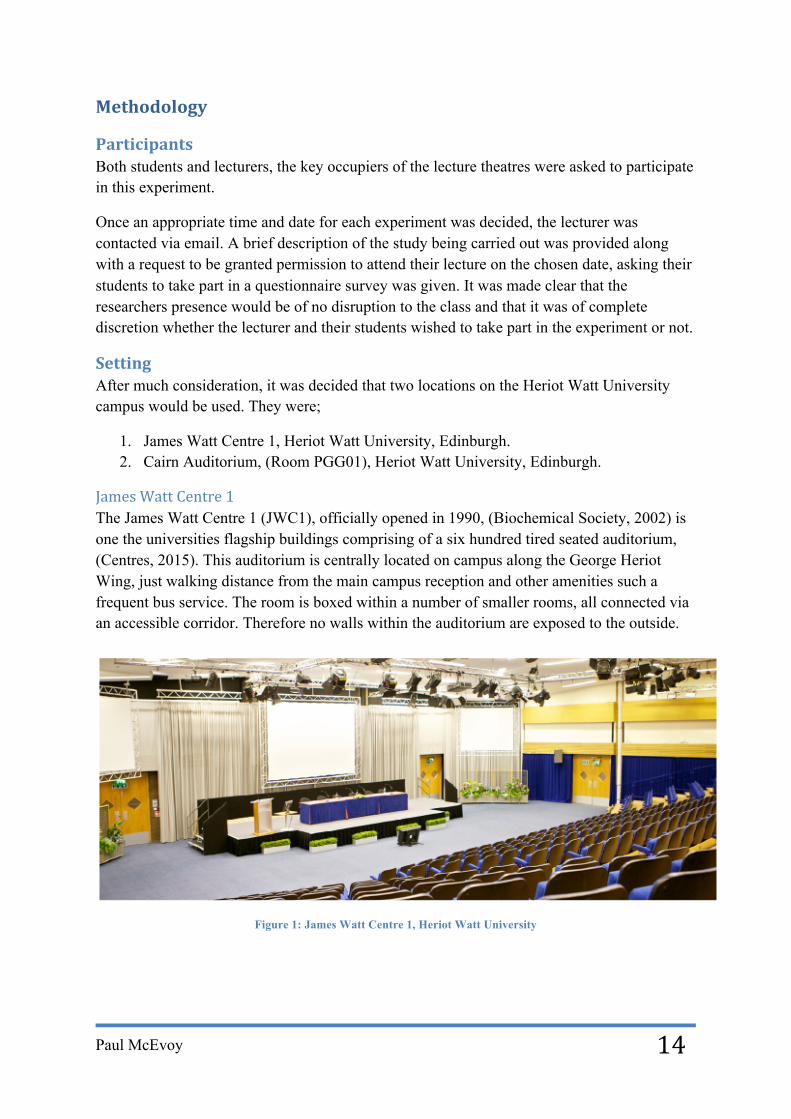
James Watt Centre 1 The James Watt Centre 1 (JWC1), officially opened in 1990, (Biochemical Society, 2002) is one the universities flagship buildings comprising of a six hundred tired seated auditorium, (Centres, 2015). This auditorium is centrally located on campus along the George Heriot Wing, just walking distance from the main campus reception and other amenities such a frequent bus service. The room is boxed within a number of smaller rooms, all connected via an accessible corridor. Therefore no walls within the auditorium are exposed to the outside.
Figure 1: James Watt Centre 1, Heriot Watt University

Paul McEvoy
15
Cairn Auditorium (PGG01) The Cairn Auditorium (CA) is located within the new postgraduate Centre on the North West side of the campus, officially opened in 2009, (Heriot Watt University, 2015). The auditorium comprises a one hundred and fifty tiered seating layout with state of the art sound, lighting and projection facilities. The room is located on the ground floor of the building; with close access to amenities such as a student café/restaurant and public toilets in addition to being just walking distance from a public bus stop that has a frequent bus service into Edinburgh city center. Two sides of the theatre are exposed to external conditions with the assumption that a heavy form of sound proof insulation has been used.
Figure 2: Cairn Auditorium, Heriot Watt University
Both locations have been selected based on the fact that they are the two largest spaces throughout the campus in which teaching and learning takes place. Another reason for this selection is that one of these theatres (James Watt Centre 1) would have been built pre 2003, which is the year that acoustic design standards for schools came into place and the other (Cairn Auditorium) was built after these regulations came about. It will be interesting to compare the acoustic metrics of both buildings to see if the changes in time have impacted on teaching and learning spaces for the better.
Stimuli
James Watt Centre 1 The first of the two experiments took place in the James Watt Auditorium during a typical 9.15am Friday morning lecture. The course module was Research Philosophy and Practice and the lecture given was in relation to the value of archival research and strengths. There were a total of forty students and one lecture present in the auditorium at the time of the experiment and class activity consisted of the lecturer speaking with students listening and taking notes.

Paul McEvoy
16
Cairn Auditorium (PGG01) Experiment two took place in the Cairn Auditorium on a Wednesday morning during the time of an average 9.15am lecture. Critical writing and Analysis was the name of the module for this class with a lecture on ‘Identifying Voices in Texts’ being given. Class activity included the lecturer speaking to a class of forty-eight students as they listened and took notes. The second part of class consisted of the students getting into groups of twos and threes and discussing specific questions that the lecturer asked of them. This resulted in a very slight increase in overall classroom noise level.
Apparatus
Figure 3: Environmental and Industrial Sound Level Meter Class 1
An environmental and industrial sound level meter with a range of between 30 ~ 130db (Accuracy +/-1.5db) (Starmeter, 2015) was used to measure the equivalent continuous sound pressure level (LAeq) of both auditoriums during occupied and unoccupied times.
Figure 4: Gitzo GT2941 Basalt Tripod
The Gitzo GT2941 tripod with a maximum load capacity of 10 Kg (Adorama, 2015) was used to extend the sound level meter 1.5 meters above ground level.
Paul McEvoy
17
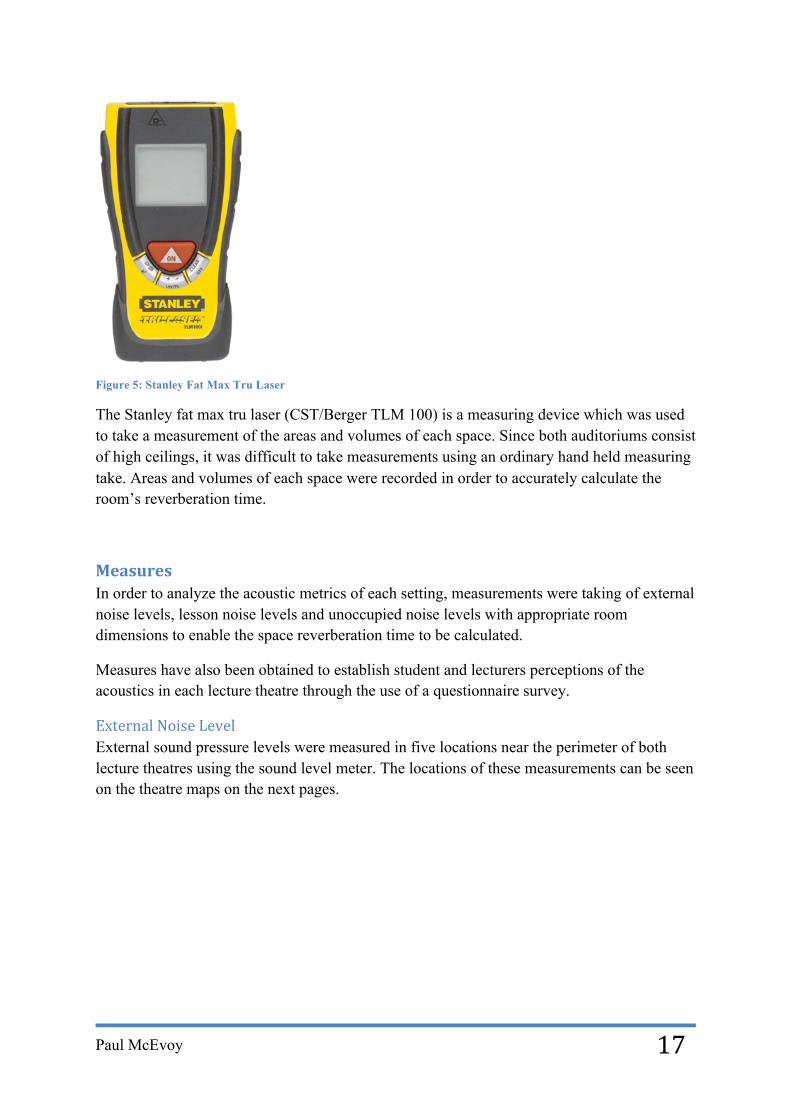
Figure 5: Stanley Fat Max Tru Laser
The Stanley fat max tru laser (CST/Berger TLM 100) is a measuring device which was used to take a measurement of the areas and volumes of each space. Since both auditoriums consist of high ceilings, it was difficult to take measurements using an ordinary hand held measuring take. Areas and volumes of each space were recorded in order to accurately calculate the room’s reverberation time.
Measures In order to analyze the acoustic metrics of each setting, measurements were taking of external noise levels, lesson noise levels and unoccupied noise levels with appropriate room dimensions to enable the space reverberation time to be calculated.
Measures have also been obtained to establish student and lecturers perceptions of the acoustics in each lecture theatre through the use of a questionnaire survey.
External Noise Level External sound pressure levels were measured in five locations near the perimeter of both lecture theatres using the sound level meter. The locations of these measurements can be seen on the theatre maps on the next pages.

Paul McEvoy
18
Figure 6: External Sound Pressure Level Measure Locations – James Watt Centre 1
Figure 7: Figure 6: External Sound Pressure Level Measure Locations – Cairn Auditorium

Paul McEvoy
19
Occupied Noise Level Measures were taking of the noise level during a typical lecture using the sound level meter positioned 1.5 meters above ground level. The sound level meter was placed in the centre of each lecture theatre, in close proximity to were the researcher was seated, causing no disruption to the class. A similar approach of measuring the LAeq of both theatres occupied noise levels was used.
Figure 8: Occupied Noise Level Measure Location - James Watt Centre 1
Figure 9: Occupied Noise Level Measure Location - Cairn Auditorium
Paul McEvoy
20
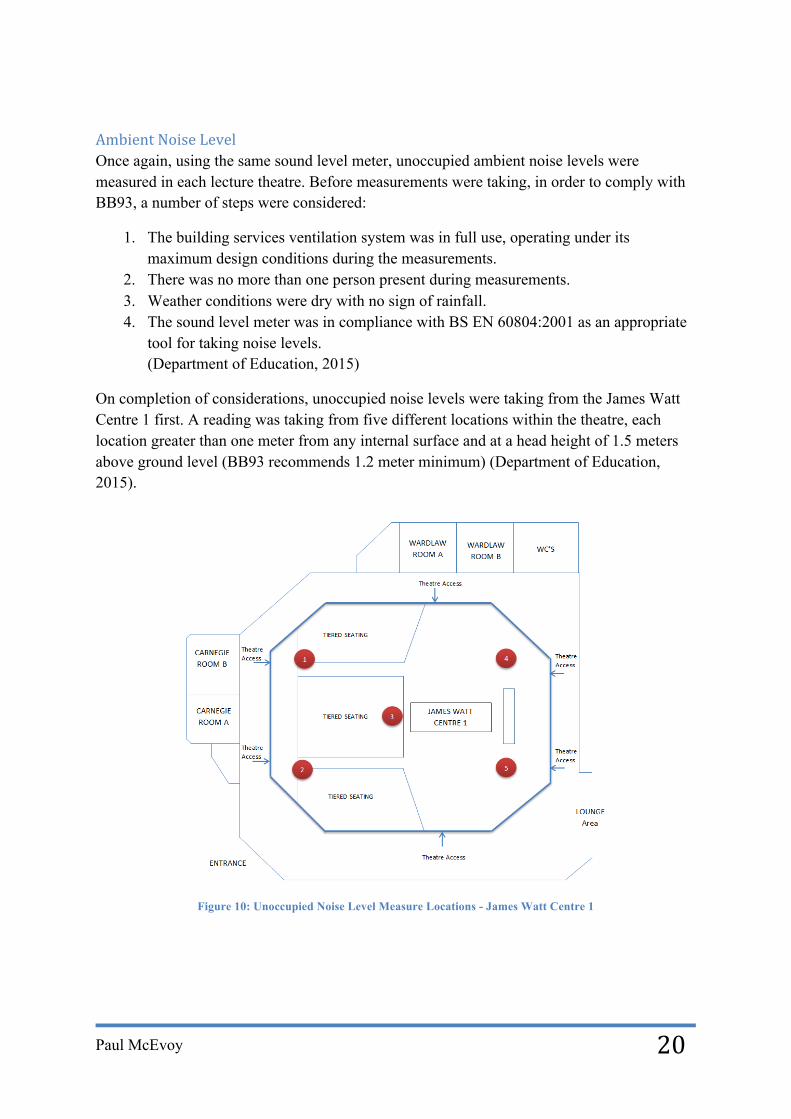
Ambient Noise Level Once again, using the same sound level meter, unoccupied ambient noise levels were measured in each lecture theatre. Before measurements were taking, in order to comply with BB93, a number of steps were considered:
1. The building services ventilation system was in full use, operating under its maximum design conditions during the measurements.
2. There was no more than one person present during measurements. 3. Weather conditions were dry with no sign of rainfall. 4. The sound level meter was in compliance with BS EN 60804:2001 as an appropriate
tool for taking noise levels. (Department of Education, 2015)
On completion of considerations, unoccupied noise levels were taking from the James Watt Centre 1 first. A reading was taking from five different locations within the theatre, each location greater than one meter from any internal surface and at a head height of 1.5 meters above ground level (BB93 recommends 1.2 meter minimum) (Department of Education, 2015).
Figure 10: Unoccupied Noise Level Measure Locations - James Watt Centre 1

Paul McEvoy
21
Figure 11: Unoccupied Noise Level Measure Locations - Cairn Auditorium
Reverberation Times The reverberation time of each lecture theatre was established using the BB93 BRE (Building Research Establishment) reverberation time calculation spreadsheet, (BRE, 2015). In order to obtain a reverberation time value, the following criteria had to be known:
1. School type and room usage 2. Room volume (m3) 3. Room materials and there surface areas (m2)
Students and Lectures Perception of their Acoustic Environment Students and lecturers, the occupants of the lecture theatres were asked a number of key questions via a detailed questionnaire survey in order to determine factors that may or may not impact there learning and teaching abilities. The questionnaire survey was subdivided into three different categories with the hope of obtaining a greater understanding of the individual, their perception of the acoustic environment in which they learn or teach in and finally their evaluation of the acoustics to see whether or not they are overall satisfied or dissatisfied.
A brief description of the research being carried out was presented to each class. The questionnaire survey was described, informing the participants that if they had any trouble understanding any specific question to raise their hand and the researcher would come and aid them with their query. It was also made very clear to each of the participants that it was of their own discretion whether or not they wished to participate in this research.
The questionnaire survey used to gather these measures can be broken down into the following subheadings:

Paul McEvoy
22
Demographics A question on gender was one of first questions asked in relation to demographics. The next question asked whether they had a hearing impairment or not. Participants were then asked to rate on a scale of one to seven which best described the place in which they grew up, numbers one to three being from the countryside and five to seven being an urban location.
Disturbances A list of possible noise sources from inside the lecture theatre was provided on the questionnaire survey.
Figure 12: List of Possible Noise Sources from Inside the Lecture Theatre (Image taken from Questionnaire Survey)
The participants were asked to rate on a scale of one to seven:
1. Frequency-How often they heard that particular sound during a typical lecture and 2. Annoyance-How annoying they found that particular sound.
The same format of question was asked for noise from outside the lecture theatre.
Sound Evaluation In order to evaluate the acoustics in the space, nine attributes were formulated into a question in which the participants were asked to rate the attribute which best described their impression of the sound in the lecture theatre. For example:
a) Noisy -1 -2 -3 0 1 2 3 Quiet
If the participants felt that the sound in the lecture theatre was noisy, they would have selected a value anywhere from minus one to minus three or if they felt it was quiet a value from one to three. The remaining attributes included: Clear - Unclear, Unpleasant - Cheerful, Warm - Cool, Inconsistent - Unity, Oppressive - Open, Distinctive - Indistinctive, Artificial - Natural, and Dislike - Like.
Participants were then asked to rate on a scale of one to seven their ease of hearing in the lecture theatre, one being easy to hear and seven being difficult to hear.
The next question in relation to sound evaluation asked students to rate again on a scale of one to seven if they agreed or disagreed with the following statement:
‘The sounds in this lecture make it easy for me to concentrate’

Paul McEvoy
23
It was hoped that the results from this question would help the researcher establish whether or not the students have any difficulties concentrating in each lecture theatre due to the acoustic properties of the space.
A similar style question was asked to both lecturers who participated in this research. The statement was as follows:
‘The sounds in this lecture theatre make it easy for me to teach’
This question was asked in order to find out how the lecturers felt about the acoustics in the lecture theatres in Heriot Watt University, and if they felt that the acoustic properties made it difficult for them to teach the researcher would discover what areas were not up to current standards and regulations and what alterations could be made to improve this.
The final question asked on the subject of sound evaluation was the participant’s difficulty in hearing when specific noise sources were present. A number of possible situations where noise sources may influence the internal sound pressure level of the spaces were presented to the participants in the questionnaire survey. For the students, these were:
1. Noise from other students talking 2. Noise from other students/staff in nearby rooms, corridors etc. 3. When sitting at the back of the lecture theatre 4. When the lecturer is speaking with their back turned 5. Noise from heating, ventilation, or other building services systems 6. Noise from external sources (Cars, Buses, Construction work etc.)
And for the lecturers, these were:
1. Noise from other students talking 2. Noise from other students/staff in nearby rooms, corridors etc. 3. When the student is sitting at the back of the lecture theatre 4. Noise from heating, ventilation, or other building services systems 5. Noise from external sources (Cars, Buses, Construction work etc.)
Participants were asked to rate each situation on a scale of one to seven their difficulty in hearing.

Paul McEvoy
24
Procedure An appropriate time and place for conducting the study was selected. The lecturer at the time of the chosen location was contacted in advance and informed on the study being carried out. They were then asked if it would be possible to attend the lecture, take sound level measurements and ask their class to complete a questionnaire survey at their own discretion during the interval. Once permission was given by both lecturers in each setting, the study was now ready to be conducted.
The researcher arrived at the lecture theatre 15 minutes before the scheduled time of the class to insure equipment was already set up so as to not cause any disruption to the class. A brief overview of the study was presented to the participants at the beginning of the class, notifying them on the questionnaire survey during the interval. As class began, the researcher started to take the occupied noise level measurements. Notes on the occupancy level, noise sources – projector, doors banging, students shuffling books and paper for example, room materials and lesson activity were all recorded.
During the interval, the researcher explained to the class that the questionnaire surveys would now be distributed. It was also made clear that if a participant had any difficulty with any particular question to raise their hand and the researcher would come and aid them with their query. Participants did not have to complete the questionnaire if they did not wish to do so.
At the end of the class, the researcher thanked both the lecturer and the students for taking part in the study and that their feedback was truly valuable. The questionnaire surveys were all collected. When the students and lecturer left the theatre, the researcher them began to take the rooms unoccupied noise level at each of the five locations. The room dimensions along with the surface area of materials were measured and recorded. A week from that particular class, during the same time, a measure was taken of the external noise level at each of the five locations around the perimeter of the lecture theatre.
The data from the questionnaire surveys was inserted into SPSS so that a statistical analysis could be performed in conjunction with the objectives set out. The reverberation time of each lecture theatre was calculated using BB93 BRE R.T Calculation Spreadsheet. The acoustic parameters of each setting were analyzed, compared and checked against current design standards.

Paul McEvoy
25
Analysis
External Noise Level The equivalent continuous sound pressure level (LAeq) was monitored for a period of 3-5 minutes at each of the five different locations, near the perimeter of each lecture theatre. LAeq. The measurements were tabulated and the equivalent continuous sound pressure level range was determined for each lecture theatre. Both theatres external LAeq’s could now be compared.
Occupied Noise Level Noise levels during class were measured for a period of 30 minutes. After the 30 minutes, the equivalent continuous sound pressure level (LAeq) was recorded and taken as the theatres occupied noise level. After measurements for each lecture theatre were recorded, these could now be compared.
Ambient Noise Level A 30 minute period for each locations reading was the target time set out. However, the measurement period used was between one and five minutes; since the noise within the lecture theatre was constant it was assumed that this reasonably short measurement period was satisfactory to give an approximation of the 30 minutes LAeq level. This decision was influenced by Shields, Conetta, Cox, Mydlarz, Dockrell and Conolly in their similar study on Acoustics and noise in English secondary schools. (Shields.Conetta.Cox.Mydlarz.Dockrell.Connolly, 2013). A similar approach was adapted for both settings.
The measurements taking from each location was tabulated and reviewed. The range in which the LAeq varied across all five measurements was then determined. The range of each lecture theatres unoccupied noise level could now be compared and finally checked against current lecture room design standards outlined by BB93.
Reverberation Time The area and volume of each space was calculated following necessary room dimension measurements. The BB93 BRE reverberation time calculation spreadsheet automatically applied appropriate absorption coefficients to each specific material that was selected. The absorption coefficient of a material is the fraction of incident sound that is not reflected, (Smith.Peters.Owen, 1982). However, the surface area of that material had to be known in order for the reverberation time to be successfully calculated. Surface areas were measured whilst taking room dimension measurements at the time of the study.
Once the necessary criteria were entered into the BB93 BRE R.T calculation spreadsheet, a reverberation time for that specific space was established. It was now possible to compare the reverberation times of each lecture theatre and check them against BB93 standards.

Paul McEvoy
26
Student and Lecturers Perceptions of their Acoustic Environment Data received from the questionnaire surveys was entered into IBM SPSS Statistics Data Editor. A coding sheet was produced to remind the researcher what each value represented.
Figure 13: Part Example of Coding Sheet Produced During SPSS Data Entry
In SPSS, the data was entered in ‘Data View’ where data values can be seen and in ‘Variable View’ the data was described, labelling each variable with what it means, (SPSS, 2015).
Demographics
Hearing Impairment Participants were asked to state whether or not they had any hearing impairments. If they did so, their questionnaire surveys would have to be analyzed separate to those with no hearing impairments. After the data was analyzed, it was seen that none of the participants had any hearing impairments. Therefore all data was analyzed as one data set.
Home Location The participants were asked to rate on a scale of one to seven the area in which they grew up in where one being from a quiet location and seven from a loud location. After the data was analyzed, it was grouped into two separate variables. Participants who answered between one and three on the questionnaire were grouped into ‘Country’ (1) and those who answered between five and seven were grouped into ‘Urban’ (2). Participants who selected a value of four on the questionnaire were eliminated from the grouped sets as it was assumed they were from neither a quiet or loud location.
Once the two grouped variables were set up, the data file was split into groups based on occupation – Students and Lecturers. This was done so that the objective of finding out if
Paul McEvoy
27
‘Students’ who grew up in a quiet setting, that would be use to learning with little to no distraction such as external noise sources from traffic for example, find it more difficult to concentrate in a room with possible external noise sources influencing the internal sound pressure level to those who grew up in an urban location with regular exposure to external noise sources. Failure to split the data file would have led to an incorrect result as ‘Lecturers’ would have also been included in the statistical analysis.
The students grouped file was analysed using a cross tabulation. A statistical analysis was then carried out using a Chi-Square test, taking the Pearson Chi-Square values in order to establish whether there was a significant difference or not between the student’s concentration levels in relation to their home location.
Disturbances Frequency was determined after participants were asked ‘How often you hear these sounds?’ on a seven point scale with one meaning never and seven meaning regularly. Annoyance was determined after participants were asked ’How annoying do you find these sounds?’ on a seven point scale with one meaning ‘it doesn’t annoy me’ and seven ‘extremely annoying’.
On SPSS, data was analyzed for noise from inside the lecture theatre, both on the frequency and annoyance scale. A One-Way Anova was used to compare the means of participant’s disturbance level in each lecture theatre. For example, is there a significant difference between how frequent the participants of the James Watt Centre 1 hear noise from the ventilation system to the participants of the Cairn Auditorium? The same analysis was carried out for noise from outside the lecture theatre.
Sound Evaluation
Sound Evaluation The optional values on the questionnaire ranged from minus three to three. On SPSS, these values were coded in a range of one to seven. A One-Way Anova was used to compare the means of the participant’s evaluation of the sound in each lecture theatre to see if there is a significant difference or not.
Ease of Hearing On a scale of one to seven participants were asked to rate their ease of hearing in the lecture theatre, one being easy to hear and seven being difficult to hear.
On SPSS, data was grouped into two separate variables, the first being ‘Easy to Hear’ for participants who answered values from one to three on the questionnaire survey and the second being ‘Difficult to Hear’ for those who answered from five to seven.
This data was analyzed using a cross tabulation. A Chi-Square Test was then used to perform a statistical analysis upon which the Pearson Chi-Square values were taken in order to establish whether or not a significant difference exists between the hearing abilities of each lecture theatres participant.
Paul McEvoy
28
Concentration On the agreement/disagreement to concentration scale, students who selected a value from one to three meant that they agreed with the statement and disagreed if they selected a value from five to seven.
Similar to the ‘Ease of Hearing’ question, on SPSS data was grouped into two separate variables, the first being ‘Agree’ for students who answered a value from one to three and the second being ‘Disagree’ for students who answered a value from five to seven.
A cross tabulation was again used to analyzes this data and a statistical analysis carried out using a Chi-Square Test, taking the Pearson Chi-Square values so as to see if there was a significant difference between the concentration levels of the students in each lecture theatre.
Teaching Likewise with the concentration statement intended for students, if lecturers selected a value from one to three it meant they agreed and disagreed if they selected a value from five to seven.
The data was grouped exactly the same as it was for the students ‘Concentration Statement’, the only difference being the participants – ‘Lecturers’.
The statistical analysis carried out was also completed in the same manner as that of the students ‘Concentration Statement’ analysis in order to establish whether there was a significant difference between the lectures ability to teach in one lecture theatre over the over.
Difficulty Hearing Participants who selected a value from one to three meant that they never found it difficult to hear during that particular noise source and participants who selected a value from five to seven meant that they regularly found it difficult to hear during that noise source.
On SPSS, like with the ‘Home Location’ question, the data file was split into groups based on occupation- Students and Lecturers. This was necessary as both sets of participants were asked the same question but were provided with different noise source situations.
A One-Way Anova was used to compare the means of student’s difficulty in hearing during that particular noise source in each lecture theatre. The same statistical analysis was used for the lecturers.

Paul McEvoy
29
Results
External Noise Level
James Watt Centre 1 Location LAeq (db)
1 45.9 2 45.8 3 45.1 4 46.1 5 46.9
Table 2: External Noise Level Measures at Each Location
Cairn Auditorium Location LAeq (db)
1 52 2 52.4 3 52.7 4 55.2 5 56.9
Table 3: Table 1: External Noise Level Measures at Each Location
Occupied Noise Level
James Watt Centre 1 Time (Minutes) LAeq (db)
0 53 0-‐5 52 5-‐10 51 10-‐15 52 15-‐20 53 20-‐25 53 25-‐30 53
Table 4: Table 3: Occupied Noise Level Measures taking Between a Period of 0-30 minutes
Cairn Auditorium Time (Minutes) LAeq (db)
0 52.7 0-‐5 52.5 5-‐10 52.3 10-‐15 52.2 15-‐20 49.4 20-‐25 50 25-‐30 49
Table 5: Table 3: Table 3: Occupied Noise Level Measures taking Between a Period of 0-30 minutes

Paul McEvoy
30
Unoccupied Noise Level
James Watt Centre 1 Location LAeq (db)
1 38.4 2 38.4 3 37.7 4 39.8 5 37.2
Table 6: Unoccupied Noise Level Measures at Each Location
Cairn Auditorium Location LAeq (db)
1 39.9 2 39 3 38.4 4 38.6 5 38.6
Table 7: Unoccupied Noise Level Measures at Each Location
Reverberation Time
James Watt Centre 1
School Type/Room Usage Lecture Rooms (More than 50 people)
Room Volume 2886 m3
Materials and Surface Areas Element Material Surface Area (m2) Floor
6 mm carpet finished floor bonded over a closed-cell foam underlay 599
Ceiling
12.5 mm plasterboard finish and 100 mm airspace with mineral wool 599
Internal Walls
Draped cotton curtains, approximately 130 mm from the wall 325
Seats Cloth upholstery finish per m2 300
Doors Sold timber framed doors 22.8
Table 8: Materials and Surface Areas - James Watt Centre 1
Reverberation Time 0.7 !!" !"#$%&'
Paul McEvoy
31
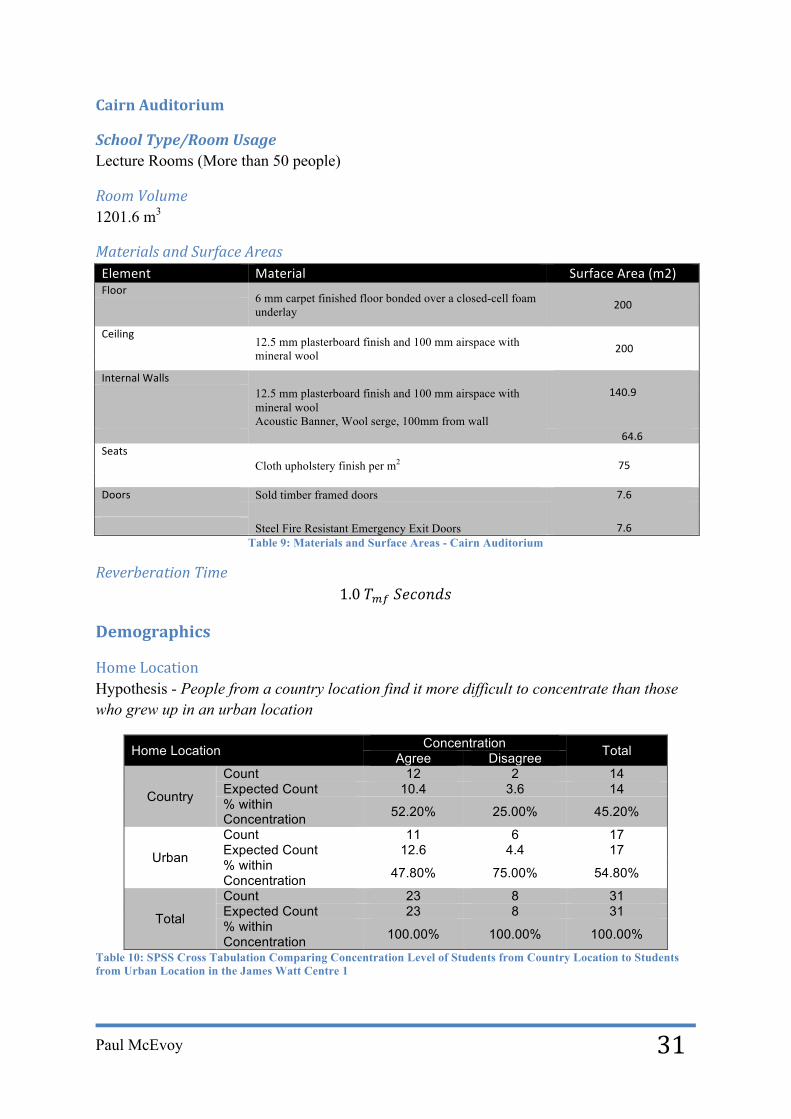
Cairn Auditorium
School Type/Room Usage Lecture Rooms (More than 50 people)
Room Volume 1201.6 m3
Materials and Surface Areas Element Material Surface Area (m2) Floor
6 mm carpet finished floor bonded over a closed-cell foam underlay 200
Ceiling
12.5 mm plasterboard finish and 100 mm airspace with mineral wool 200
Internal Walls
12.5 mm plasterboard finish and 100 mm airspace with mineral wool Acoustic Banner, Wool serge, 100mm from wall
140.9
64.6 Seats
Cloth upholstery finish per m2 75 Doors Sold timber framed doors 7.6
Steel Fire Resistant Emergency Exit Doors 7.6 Table 9: Materials and Surface Areas - Cairn Auditorium
Reverberation Time 1.0 !!" !"#$%&'
Demographics
Home Location Hypothesis - People from a country location find it more difficult to concentrate than those who grew up in an urban location
Home Location Concentration Total Agree Disagree
Country
Count 12 2 14 Expected Count 10.4 3.6 14 % within Concentration 52.20% 25.00% 45.20%
Urban
Count 11 6 17 Expected Count 12.6 4.4 17 % within Concentration 47.80% 75.00% 54.80%
Total
Count 23 8 31 Expected Count 23 8 31 % within Concentration 100.00% 100.00% 100.00%
Table 10: SPSS Cross Tabulation Comparing Concentration Level of Students from Country Location to Students from Urban Location in the James Watt Centre 1

Paul McEvoy
32
For the James Watt Centre 1, (n=12) students who grew up in a country location agree and (n=2) disagree with the statement. For students from an urban location, (n=11) agree and (n=6) disagree with the statement. A chi square of goodness test was then used to statistically analyse this data and as a result we can see the null hypothesis is retained.
!! 1 = 1.770,! > 0.183
Home Location Concentration Total Agree Disagree
Country
Count 13 7 20 Expected Count 10.9 9.1 20 % within Concentration 68.40% 43.80% 57.10%
Urban
Count 6 9 15
Expected Count 8.1 6.9 15
% within Concentration 31.60% 56.30% 42.90%
Total
Count 19 16 35 Expected Count 19 16 35 % within Concentration 100.00% 100.00% 100.00%
Figure 14: SPSS Cross Tabulation Comparing Concentration Level of Students from Country Location to Students from Urban Location in the Cairn Auditorium
In the Cairn Auditorium, (n=13) students who grew up in a country location agree and (n=7) disagree with the statement. For students from an urban location, (n=6) agree and (n=9) disagree with the statement. A chi square of goodness test was then used to statistically analyse this data and as a result we can see the null hypothesis is retained.
!! 1 = 2.159,! > 0.142
Paul McEvoy
33
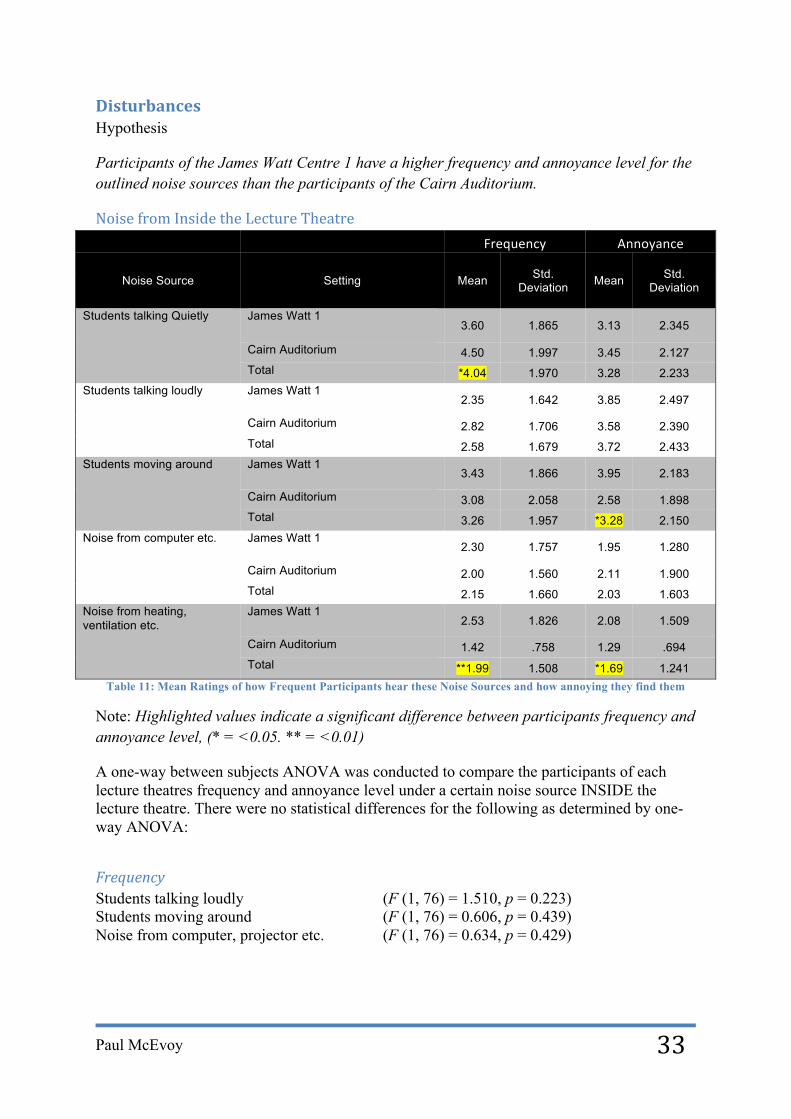
Disturbances Hypothesis
Participants of the James Watt Centre 1 have a higher frequency and annoyance level for the outlined noise sources than the participants of the Cairn Auditorium.
Noise from Inside the Lecture Theatre Frequency Annoyance
Noise Source Setting Mean Std. Deviation Mean Std.
Deviation
Students talking Quietly James Watt 1 3.60 1.865 3.13 2.345
Cairn Auditorium 4.50 1.997 3.45 2.127 Total *4.04 1.970 3.28 2.233
Students talking loudly James Watt 1 2.35 1.642 3.85 2.497
Cairn Auditorium 2.82 1.706 3.58 2.390 Total 2.58 1.679 3.72 2.433
Students moving around James Watt 1 3.43 1.866 3.95 2.183
Cairn Auditorium 3.08 2.058 2.58 1.898 Total 3.26 1.957 *3.28 2.150
Noise from computer etc. James Watt 1 2.30 1.757 1.95 1.280
Cairn Auditorium 2.00 1.560 2.11 1.900 Total 2.15 1.660 2.03 1.603
Noise from heating, ventilation etc.
James Watt 1 2.53 1.826 2.08 1.509
Cairn Auditorium 1.42 .758 1.29 .694 Total **1.99 1.508 *1.69 1.241
Table 11: Mean Ratings of how Frequent Participants hear these Noise Sources and how annoying they find them
Note: Highlighted values indicate a significant difference between participants frequency and annoyance level, (* = <0.05. ** = <0.01)
A one-way between subjects ANOVA was conducted to compare the participants of each lecture theatres frequency and annoyance level under a certain noise source INSIDE the lecture theatre. There were no statistical differences for the following as determined by one-way ANOVA:
Frequency Students talking loudly (F (1, 76) = 1.510, p = 0.223) Students moving around (F (1, 76) = 0.606, p = 0.439) Noise from computer, projector etc. (F (1, 76) = 0.634, p = 0.429)
Paul McEvoy
34
Annoyance Students talking quietly (F (1, 76) = 0.403, p = 0.527) Students talking loudly (F (1, 76) = 0.239, p = 0.626) Noise from computer, projector etc. (F (1, 76) = 0.181, p = 0.672) A statistical difference does however exist for the following as determined by one-way ANOVA:
Frequency Students talking quietly (F (1, 76) = 4.237, p = 0.043) Noise from heating, ventilation etc. (F (1, 76) = 11.93, p = 0.001)
Annoyance Students moving around (F (1, 76) = 8.723, p = 0.004) Noise from heating, ventilation etc. (F (1, 76) = 8.574, p = 0.004)
Noise from Outside the Lecture Theatre Frequency Annoyance
Noise Source Setting Mean Std. Deviation Mean Std.
Deviation
People in Corridors James Watt 1 1.60 1.150 1.75 1.481
Cairn Auditorium 1.24 .714 1.24 .714 Total 1.42 .974 1.50 1.193
People in Adjacent Room James Watt 1 1.63 1.314 1.75 1.463
Cairn Auditorium 1.21 .622 1.18 .609 Total 1.42 1.051 *1.47 1.159
People Outside James Watt 1 1.43 .931 1.70 1.506
Cairn Auditorium 1.32 .842 1.18 .609 Total 1.37 .884 1.45 1.180
Doors Banging James Watt 1 2.05 1.339 2.98 2.057
Cairn Auditorium 1.82 1.111 1.95 1.708 Total 1.94 1.231 *2.47 1.952
Noise From Speakers James Watt 1 1.43 1.279 1.63 1.547
Cairn Auditorium 1.08 .273 1.11 .311 Total 1.26 .946 *1.37 1.152
Noise From Vehicles James Watt 1 1.30 1.137 1.40 1.257
Cairn Auditorium 1.11 .311 1.11 .311 Total 1.21 .843 1.26 .932
Table 12: Mean Ratings of how Frequent Participants hear these Noise Sources and how annoying they find them
Note: Highlighted values indicate a significant difference between participants frequency and annoyance level, (* = <0.05)
Paul McEvoy
35
A one-way between subjects ANOVA was conducted to compare the participants of each lecture theatres frequency and annoyance level under a certain noise source OUTSIDE the lecture theatre. There were no statistical differences for the following as determined by one-way ANOVA:
Frequency People in Corridors (F (1, 76) = 2.772, p = 0.100) People in Adjacent Room (F (1, 76) = 3.114, p = 0.082) People Outside (F (1, 76) = 0.294, p = 0.589) Doors Banging (F (1, 76) = 0.703, p = 0.405) Noise from Speakers (F (1, 76) = 2.663, p = 0.107) Noise from Vehicles (F (1, 76) = 1.040, p = 0.311)
Annoyance People in Corridors (F (1, 76) = 3.737, p = 0.057) People Outside (F (1, 76) = 3.859, p = 0.053) Noise from Vehicles (F (1, 76) = 1.974, p = 0.164) A statistical difference does however exist for the following as determined by one-way ANOVA:
Annoyance People in Adjacent Room (F (1, 76) = 4.877, p = 0.030) Doors Banging (F (1, 76) = 5.732, p = 0.019) Noise from Speakers (F (1, 76) = 4.126, p = 0.046)

Paul McEvoy
36
Sound Evaluation
Sound Evaluation Hypothesis
Participant’s sound evaluation will be different for each lecture theatre.
Attributes Setting Mean Std. Deviation
Noisy-Quiet James Watt 1 5.43 1.599 Cairn Auditorium 5.26 1.288
Total 5.35 1.449 Clear-Unclear
James Watt 1 3.43 1.907 Cairn Auditorium 4.34 1.990
Total *3.87 1.989 Unpleasant-Cheerful
James Watt 1 4.85 1.027 Cairn Auditorium 4.63 1.303
Total 4.74 1.167 Inconsistent-Unity
James Watt 1 5.10 1.516 Cairn Auditorium 4.74 1.223
Total 4.92 1.384 Warm-Cool James Watt 1 3.80 1.539
Cairn Auditorium 4.42 1.536 Total 4.10 1.559
Oppressive-Open
James Watt 1 4.95 1.431 Cairn Auditorium 4.95 1.506
Total 4.95 1.458 Distinctive-Indistinctive
James Watt 1 3.63 1.254 Cairn Auditorium 4.47 1.623
Total *4.03 1.498 Artificial-Natural
James Watt 1 4.40 1.630 Cairn Auditorium 4.87 1.647
Total 4.63 1.644 Dislike-Like James Watt 1 4.83 1.693
Cairn Auditorium 5.03 1.442 Total 4.92 1.569
Table 13: Comparison of Participants Sound Evaluation in each Setting
Note: Highlighted values indicate a significant difference between participants response for the same attribute, (* = <0.05)
A one-way between subjects ANOVA was conducted to compare the participants’ sound evaluation for each of the nine attributes of each lecture theatre. There were no statistical differences as determined by one-way ANOVA: Noisy - Quiet (F (1, 76) = 0.241, p = 0.625) Unpleasant - Cheerful (F (1, 76) = 0.68, p = 0.412) Warm - Cool (F (1, 76) = 3.18, p = 0.079) Inconsistent - Unity (F (1, 76) = 1.347, p = 0.249) Oppressive - Open (F (1, 76) = 0, p = 0.994)
Paul McEvoy
37
Artiticial – Natural (F (1, 76) = 1.593, p = 0.211) Dislike - Like (F (1, 76) = 0.318, p = 0.574
A statistical difference does however exist between lecture theatres for participants’ evaluation of the lecture theatre in terms of attributes Clear – Unclear and Distinctive – Indistinctive.
Clear - Unclear (F (1, 76) = 4.34, p = 0.041) Distinctive - Indistinctive (F (1, 76) = 6.715, p = 0.011)
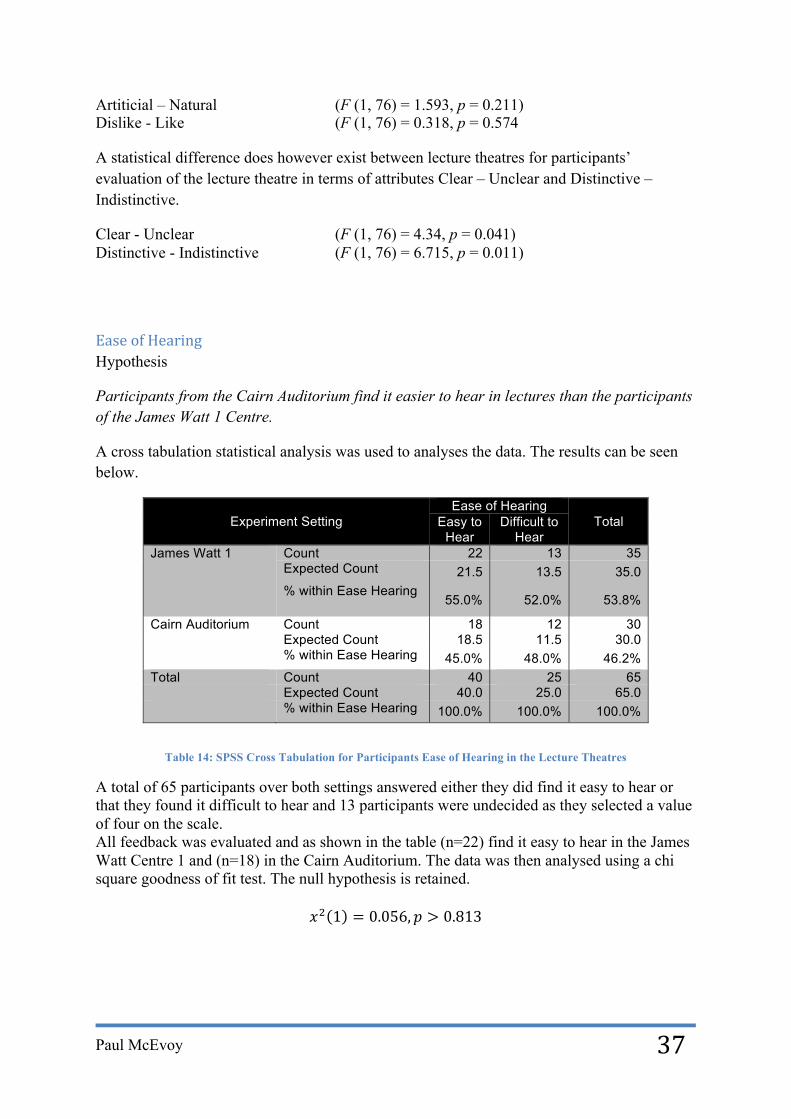
Ease of Hearing Hypothesis
Participants from the Cairn Auditorium find it easier to hear in lectures than the participants of the James Watt 1 Centre.
A cross tabulation statistical analysis was used to analyses the data. The results can be seen below.
Experiment Setting Ease of Hearing
Total Easy to Hear
Difficult to Hear
James Watt 1 Count 22 13 35 Expected Count 21.5 13.5 35.0 % within Ease Hearing
55.0% 52.0% 53.8%
Cairn Auditorium Count 18 12 30 Expected Count 18.5 11.5 30.0 % within Ease Hearing 45.0% 48.0% 46.2%
Total Count 40 25 65 Expected Count 40.0 25.0 65.0 % within Ease Hearing 100.0% 100.0% 100.0%
Table 14: SPSS Cross Tabulation for Participants Ease of Hearing in the Lecture Theatres
A total of 65 participants over both settings answered either they did find it easy to hear or that they found it difficult to hear and 13 participants were undecided as they selected a value of four on the scale. All feedback was evaluated and as shown in the table (n=22) find it easy to hear in the James Watt Centre 1 and (n=18) in the Cairn Auditorium. The data was then analysed using a chi square goodness of fit test. The null hypothesis is retained.
!! 1 = 0.056,! > 0.813

Paul McEvoy
38
Concentration Hypothesis Students from the Cairn Auditorium find it easier to concentrate during a lecture than the students of the James Watt Centre 1.
Experiment Setting Concentration Total Agree Disagree James Watt 1 Count 26 9 35
Expected Count 21.7 13.3 35.0 % within Concentration 59.7% 33.3% 49.3%
Cairn Auditorium Count 18 18 36 Expected Count 22.3 13.7 36.0 % within Concentration 40.9% 66.7% 50.7%
Total Count 44 27 71 Expected Count 44.0 27.0 71.0 % within Concentration 100.0% 100.0% 100.0%
Table 15: Table 1: SPSS Cross Tabulation for Concentration Statement
From the cross tabulation it can be seen that a total of 71 students either agreed or disagreed with the statement in relation to concentration within the lecture theatres, with five students saying neither as they selected a value of four. After the feedback was evaluated, (n=26) students agree and (f=9) disagree with the statement in the James Watt Centre 1 and (n=18) students agree and (f=18) disagree with the statement in the Cairn Auditorium. A chi square of goodness test was then used to statistically analyse this data and as a result we can see the null hypothesis is retained.
!! 1 = 4.441,! > 0.035
Teaching Hypothesis
The lecturer of the James Watt Centre 1 finds teaching more difficult to the Lecturer of the Cairn Auditorium.
Experiment Setting Concentration Total Agree
James Watt 1
Count 1 1 Expected Count 1 1 % within Concentration 50.00% 50.00%
Cairn Auditorium
Count 1 1 Expected Count 1 1 % within Concentration 50.00% 50.00%
Total Count 2 2 Expected Count 2 2 % within Concentration 100.00% 100.00%
Table 16: Table 1: SPSS Cross Tabulation for Teaching Statement
No statistics could be computed for this as both lecturers agreed with the statement. Therefore no significant difference exist here, thus the null hypothesis is retained.
Paul McEvoy
39
Difficulty Hearing
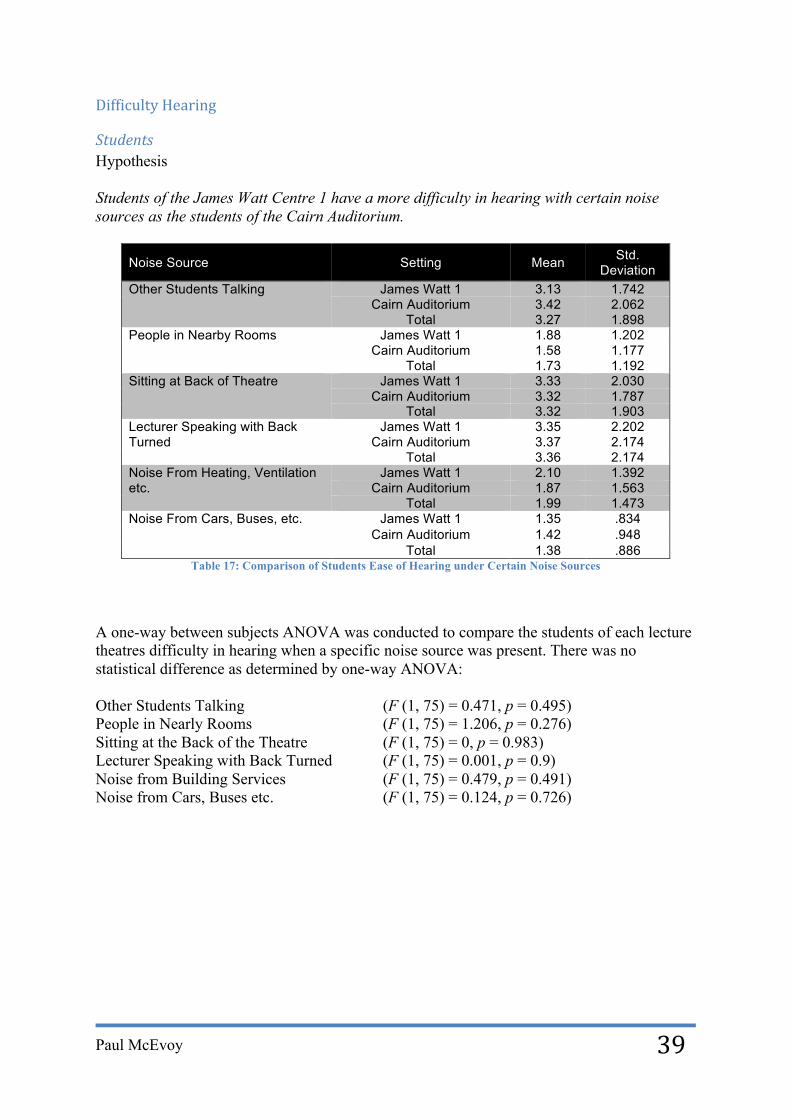
Students Hypothesis Students of the James Watt Centre 1 have a more difficulty in hearing with certain noise sources as the students of the Cairn Auditorium.
Noise Source Setting Mean Std. Deviation
Other Students Talking James Watt 1 3.13 1.742 Cairn Auditorium 3.42 2.062
Total 3.27 1.898 People in Nearby Rooms James Watt 1 1.88 1.202
Cairn Auditorium 1.58 1.177 Total 1.73 1.192
Sitting at Back of Theatre James Watt 1 3.33 2.030 Cairn Auditorium 3.32 1.787
Total 3.32 1.903 Lecturer Speaking with Back Turned
James Watt 1 3.35 2.202 Cairn Auditorium 3.37 2.174
Total 3.36 2.174 Noise From Heating, Ventilation etc.
James Watt 1 2.10 1.392 Cairn Auditorium 1.87 1.563
Total 1.99 1.473 Noise From Cars, Buses, etc. James Watt 1 1.35 .834
Cairn Auditorium 1.42 .948 Total 1.38 .886
Table 17: Comparison of Students Ease of Hearing under Certain Noise Sources
A one-way between subjects ANOVA was conducted to compare the students of each lecture theatres difficulty in hearing when a specific noise source was present. There was no statistical difference as determined by one-way ANOVA: Other Students Talking (F (1, 75) = 0.471, p = 0.495) People in Nearly Rooms (F (1, 75) = 1.206, p = 0.276) Sitting at the Back of the Theatre (F (1, 75) = 0, p = 0.983) Lecturer Speaking with Back Turned (F (1, 75) = 0.001, p = 0.9) Noise from Building Services (F (1, 75) = 0.479, p = 0.491) Noise from Cars, Buses etc. (F (1, 75) = 0.124, p = 0.726)

Paul McEvoy
40
Lecturers Hypothesis The lecturer in the James Watt Centre 1 has more difficulty hearing over certain noise sources than the lecturer of the Cairn Auditorium.
Noise Source Setting Mean Std. Deviation
Other Students Talking James Watt 1 1.00
Cairn Auditorium 6.00 Total 3.50 3.536
People in Nearby Rooms James Watt 1 1.00
Cairn Auditorium 2.00 Total 1.50 .707
Student Sitting at Back of Theatre James Watt 1 2.00
Cairn Auditorium 6.00 Total 4.00 2.828
Noise From Heating, Ventilation etc. James Watt 1 1.00
Cairn Auditorium 2.00 Total 1.50 .707
Noise From Cars, Buses, etc. James Watt 1 1.00
Cairn Auditorium 2.00 Total 1.50 .707
Table 18: Comparison of Lecturers Ease of Hearing under Certain Noise Sources
A statistical analysis was unable to be carried out as only two cases (lecturers) were involved.
Discussion The aim of this study was to compare the acoustic metrics, in addition to students and lectures perceptions of their acoustic environment in two lecture theatres on the Heriot Watt University campus. Through previous research on similar studies carried out on primary and secondary schools and literature on current design standards, acoustic metrics were successfully measured and checked to see if they comply and a relevant questionnaire survey was produced, distributed and all collected data successfully analyzed.
Although Building Regulations approved document E4 does not apply to external noise, BB93 does provide recommendations that are considered good practice for providing good acoustic conditions outside educational buildings. It is possible to achieve specified indoor ambient noise levels on sites where external noise levels are as high as 70 db LAeq 30minutes, (Department of Education & Skills, Acoustic Design of Schools Design Guide, 2003). From the results, we can see that the external noise level around the JWC1 ranges from 45.9 – 46.9 db LAeq 30 minutes and the CA from 52 – 56.9 db LAeq 30 minutes. The external noise level of the JWC1 is approximately 8 db lower than that of the CA. One reason for this may be due to the location the theatres. As Marshall Day state in their guide on ‘Acoustic Design – Rooms for Speech’ if possible, position the theatre away from busy roads

Paul McEvoy
41
or other noisy areas, (Marshall Day, 2015). The JWC1 is entirely enclosed with no perimeter walls exposed to the outside. A corridor leading to other small seminar rooms in addition to a large lounge area, surround the external side of the theatre and therefore eliminates any noise from outside sources entering the lecture theatre. The CA on the other hand is semi exposed to external noise sources as two sides of the theatre are adjacent to the outside, with one side being a car park, which is in close proximity to a road with a frequent bus service. Although there is a significant difference between both lecture theatres external noise levels, they are still well below the good practice level of 70 db LAeq 30 minutes as outlined by BB93.
Table three and four of the results section show us that the JWC1 has an occupied noise level of 53 db LAeq 30 minutes and the CA of 52.7 db LAeq 30 minutes. We can see from this that both lecture theatres acoustic conditions are almost identical in situations when the students and lecturers are present. These values also support Shield and Dockrell’s findings from their study on ‘The effects of Noise on Children at School’ that regardless of the noise levels when the room is empty, or of the age of the students, the presence of students, even when quiet, increases the noise level in a room to around 56 db (A) LAeq, (Shields,Doclrell, 2003).
Ambient noise levels are one of the most critical elements in lecture theatre design as the lecturer’s voice needs to be clearly heard above all background noise, (Marshall Day, 2015). BB93 recommends 35 – 40 db LAeq 30 minutes for lecture theatres, (Department of Education, 2015). From the results, we know that the JWC1 has an ambient noise level range of 37.2 – 39.8 db LAeq 30 minutes and the CA of 38.4 – 39.9 db LAeq 30 minutes. Based on these recorded measurements, we know that the current criteria in BB93 for lecture theatres is being met by both the JWC1 and the CA. Since the CA is a relatively new build, it should ideally be more in the range of 35 db LAeq 30 minutes. A reason for this may be due to the fact that the theatre is semi exposed to the outside with possible external noise sources influencing the ambient noise level. Appropriate placement on architectural plan during the design phase can provide significant savings on noise control treatment, (Marshall Day, 2015). Another possible reason could be the choice of materials used within the theatre as it may not have as good of an absorption coefficient as the materials in the JWC1. However, as it does not exceed the 40 db LAeq 30 minutes value we can still consider it as having good room acoustic conditions.
Rooms designed for speech, lecture theatres for example, typically have a short reverberation time of less than one second, (BSRIA, 2015). BB93 recommends a reverberation time of less than or equal to 1.0 !!" seconds for lecture theatres with an occupancy level of more than 50 people, (Department of Education & Skills, 2015). On completion of the BB93 BRE R.T calculation, the results show that a reverberation time of 0.7 !!" seconds exists for the JWC1 and 1.0 !!" seconds for the CA. This tells us that both lecture theatres comply with the criteria of BB93. Despite both theatres meeting BB93 standards it is interesting to see that the JWC1 has a lower reverberation time than the CA, seeing as it was built 19 years before the CA. One reason for this may be that the JWC1 uses a cotton curtain material with an

Paul McEvoy
42
absorption coefficient of 0.56 to cover all internal wall surfaces and although the CA comprises an acoustic material on the internal walls to the rear of the theatre, there is still a significant amount of wall space exposed (140.74 m2) with an absorption coefficient as low as 0.06, (Department of Education & Skills, 2015). Nevertheless, similar to both lecture theatres ambient noise levels, the reverberation times are in compliance with current acoustic design standards and for that reason we can consider them as having good acoustic conditions.
Out of all 78 participants, 33 male students, 45 female students, one male lecturer and one female lecturer, there was no evidence of any participant having any hearing impairment. For that reason all data was analyzed in the same manner.
It was thought that students who grew up in a quiet location would have different learning capabilities to students who grew up in an urban location due to an assumed external noise source influence on the internal sound pressure level in the lecture theatres of Heriot Watt University. From the results we can see that this is not the case. After carrying out a statistical analysis on the concentration levels of students from a country location to students from an urban location, it can be seen that no significant difference exists, thus both sets of students have equal learning capabilities and where the student grew up does not have an impact on this. However, this finding is only relevant to these lecture theatres, which can be regarded as being in a quiet location. If the theatre was poorly sound insulated, or sited in an urban location, the ambient noise level may be affected as Shields, Conetta, Cox, Mydlarz, Dockrell and Connolly found in their study on ‘Acoustic and Noise in English Secondary Schools’ that the highest lesson noise levels occurred in urban sited schools. Therefore students from a quiet setting may have a different perception in this instance.
An assumption was made that the participants of the JWC1 would have a higher frequency and annoyance level for the outlined noise sources based on the age of the lecture theatre and presumed acoustics were not be up to current design standards. A one-way Anova was completed to see if the outlined noise sources occurred more frequently in the JWC1 and if the participants found these noise sources more annoying than those in the CA. It was found that students were talking quiet more frequently in the CA than in the JWC1. Noise from the heating and ventilation system was more frequent and annoying in the JWC1 than in the CA. The mean value for this stood at 2.53 for frequency and 2.08 for annoyance out of a possible seven; therefore this is irrelevant as it was stated in the analysis that a value of five to seven would only be considered as a problem. A student moving around was more annoying for the participants in JWC1. This was interesting to see as a number of participants noted on the questionnaire that the steps leading up to the tiered seating area were constantly squeaking anytime people walked on them. People in adjacent rooms, doors banging and noise from speakers was more annoying for the participants of the JWC1, however the mean values for these were 1.75, 2.98 and 1.31 respectively out of a possible seven, therefore making these noise sources irrelevant.
Once a statistical analysis was completed for the sound evaluation question, using nine attributes, it can be seen that the only significant difference was for attributes Clear-Unclear

Paul McEvoy
43
and Distinctive-Indistinctive. The participants of the JWC1 rated the sound to be more clear than unclear in the theatre while the participants in the CA felt the sound was not as clear as a mean value of 4.34 was produced from the data. Likewise, the participants of JWC1 felt that sound was more distinct within the theatre and the CA participants favored more towards indistinct since a mean value of 4.47 was the final result. Since the option of one to seven existed on the questionnaire, it is difficult to define whether participants who selected a value of four did so because they felt the attribute was even for both or that they failed to understand the question correctly and therefore they decided to select a value that is neither one nor the other. For this situation, it is assumed participants did not fully understand what the attribute meant in relation to the sound in the lecture theatre and so it can be said that there is no significant difference between the participants sound evaluation in both lecture theatres.
The participants were asked to rate their ease of hearing in the lecture theatre as it was thought that students in the CA found it easier to hear in the lecture theatre than the participants in the JWC1. This again was based on the fact that the CA is a relatively new theatre, constructed under current design standards unlike the JWC1 which was officially opened in 1990 and therefore before BB93 design standards were introduced. After a statistical analysis was successfully carried out it can be seen that no significant difference exist between the two lecture theatres, which fails to support our hypothesis. The participants find it equally easy to hear, which suggest that both lecture theatres acoustic conditions are at a standard that does not negatively affect the hearing abilities of the students and lecturers.
Similar to ease of hearing, in relation to concentration levels, the hypothesis suggested that students from the CA find it easier to concentrate during a lecture than those of the JWC1. This assumption is incorrect as the results from a statistical analysis show us that students of the CA actually find it more difficult to concentrate than the students of the JWC1. Students from the JWC1, out of 39, 35 gave a valid response, 26 saying they agreed with the statement ‘The sounds in this lecture theatre make it easy for me to concentrate’ and nine disagreeing. The remaining four students answered four on the scale and therefore their values were excluded from the analysis as four was seen as neither agreeing nor disagreeing with the statement. Out of the 37 students in the CA, 36 gave a valid response, 18 saying they agreed with the statement and 18 disagreeing. One student selected four on the scale set and therefore their value was excluded based on the reason previously stated. It is reasonable to suggest that students found it more difficult to concentrate in the CA than in the JWC1 because students were talking quietly more frequently as the results from the disturbance section showed. If this is the case it could easily be rectified if the lecturer was to implement a stricter regime with regard to students talking in class as opposed to physically improving the theatres acoustic properties.
When lecturers were asked if they agreed or disagreed with the statement ‘The sounds in this lecture theatre make it easy for me to teach’, both lecturers agreed. This tells us that from a teaching perspective, lecturers feel that the room acoustics of each theatre do not affect their teaching abilities. It was assumed that the lecturer of the JWC1 would find teaching more

Paul McEvoy
44
difficult, again due to the age of the theatre, however this is not the case as teaching capabilities are equal to those of the CA and not affected by the rooms acoustics.
The hypothesis determined for students and lecturer’s ability to hear under certain noise sources suggested that the students and lecturer of the JWC1 would have more trouble hearing under these noise sources than the students and lecturers of the CA. After a statistical analysis was carried out, it can be seen that this hypothesis is not supported as both sets of students have a similar difficulty in hearing under these noise sources. It is also interesting to note that the mean value of both sets of participants was fewer than four. This tells us that students in both lecture theatres did not have any difficulty hearing under the outlined noise sources, which may suggest that these noise sources are not present within the lecture theatres as a result of good room acoustic conditions. A statistical analysis was unable to be carried out for the lecturers as only two lecturers were involved in this study. However the values that each lecturer selected were studied and it was seen that the lecturer in the CA found it more difficult to hear while other students were talking and when the student was sitting at the back of the lecture theatre. All other noise source situations were significantly similar and below a value of four which again suggest that these noise sources are nonexistent within the lecture theatre as result of good room acoustics. Similar to student’s concentration levels in the CA, student’s talking during classes seems to be an issue and is proven to have a negative effect on learning and teaching abilities within the lecture theatre. This can also lead to emotional responses such as annoyance and physiological responses such as stress as discovered by Scannell, Hodgson, Villarreal and Gifford, (Scannell, Hodgson, Villarreal, Gifford, 2015) . A student sitting at the back of the theatre was also an issue for the lecturer of the CA as they rated a value of six out of a possible seven. The tired seating in the CA is relatively high up in comparison to the JWC1 and without appropriate amplification measures in place it is understood how the lecturer would find it difficult to hear a student sitting at the back of the theatre. Brunel Media Services, in their project on ‘The Development of University Lecture Room Audio Visual Presentation Facilities’, state that it is desirable to build in a level of audience interactivity by offering some facility that would allow students to use microphones in addition to the lecturer, (Brunel University London, 2003), therefore improving the lecturers ability to hear the student seated at the back of the theatre.

Paul McEvoy
45
Conclusion An attempt to compare the acoustic metrics in addition to student’s and lecturer’s perception of their acoustic environment in two lecture theatres on the Heriot Watt University Campus has been successful. Through excessive research, planning and with the use of necessary equipment, acoustic metric measurements were able to be taken. This allowed a comparison of both lecture theatres and an objective check against current BB93 design standards. It also enabled the production of a questionnaire survey which successfully gathered valuable responses to help aid with further knowledge on student’s and lecturer’s perceptions of room acoustics in lecture theatres.
Findings show that the James Watt Centre 1 and the Cairn Auditorium ambient noise levels and reverberation times do not differ and noticeably meet BB93 design standards. External and occupied noise levels were again similar for both lecture theatres, with the results of external noise meeting good practice values and occupied noise levels supporting literature on similar studies. There was little to differentiate between students and lecturer’s perceptions as both gave evidence of being pleased with the acoustic conditions of each lecture theatre. However, students talking during class in the Cairn Auditorium proved to be a problem for the students and lecturer whereas this was not a problem in the James Watt Centre 1.
It was thought that the acoustic properties of the James Watt Centre 1 would not be up to current design standards and that theatre users would be dissatisfied. Research however found that the summer of 2007 saw the commencing of work to a £57,000 upgrades project which included improvements to the sound facilities within the auditorium (myvenues, 2007), and therefore bringing the theatre up to current design standards.
Further Work Lecture theatres in an urban setting such as inner city locations where external noise levels are high could be compared to the lecture theatres used in this study. This would be interesting to see if the lecture theatres acoustic conditions were negatively impacted on as a result of exposure to external noise sources.
Research predominantly focused on the effects of poor classroom acoustics on teachers/lecturers is not common, and therefore very little literature currently exists. Further work in this area would an interesting study and would also go a long way in providing useful literature for future researchers.
Finally, Building Bulletin 93 states that acoustic design standards do not apply to colleges of further education or university buildings, (Association of Interior Specialist, 2003). Although many architects and designers use BB93 as a guideline, this statement could be investigated in depth and a conclusions as to whether or not they should be made comply could be produced.
Paul McEvoy
46
Bibliography 1. Adorama. (2015). Accessories & Gadgets. Retrieved from Adorama:
http://www.adorama.com/alc/0013051/article/Buying-Guide-Five-Tripods-for-Travelers
2. Agency, E. &. (2012). Acoustic Performance Standards fot the Priority of School Building Programme. Education & Funding Agency .
3. Association of Interior Specialist. (2003). Acoustic Design of Schools - A Design Guide. Building Bulletin 93.
4. BATOD. (2001). Classroom Acoustics - recommended standards . Retrieved from The British Association of Teacher of the Deaf.
5. Benkreira, K. a. (2011). Sustainable Acoustic & Thermal Insulation Materials from Elastromeric Waste Residues. Chemical Engineering Science .
6. Biochemical Society. (2002, April). Conferences & Events. Retrieved from BiochemcialSociety.org: http://www.biochemistry.org/Events/tabid/379/View/GeneralInfo/Filter/64/Page/35/MeetingNo/676/Default.aspx
7. BRE. (2015). Acoustics. Retrieved from BRE: http://www.bre.co.uk/acoustics
8. Brunel University London. (2003). Physical & Technical Standards. Retrieved from Managing, Devilving and Supporting Lecture Room Services: http://www.agocg.ac.uk/reports/mmedia/casestudy/brunel/standard.htm
9. BSRIA. (2015). Sound Absorption. Designing Buildings.
10. Centres, E. C. (2015). James Watt Centre 1. Retrieved from Edinburgh Conference Centre: http://www.edinburgh-conference.com
11. Connolly,Dockrell,Shield,Conetta,Cox. (2013). Adolescent's Perceptions of their School's Acoustic Environment. Noise Health .
12. Copper,Boyko,Codinhoto. (2008). The Effect of the Physical Environment on Mental Wellbeing. In F. Copper, Mental Capital & Wellbeing.
13. Department of Education & Skills. (2003). Acoustic Design of Schools Design Guide. Building Bulletin 93.
14. Department of Education & Skills. (2015). Absorption Coeifficients of Materials. Retrieved from http://www.google.co.uk/url?sa=t&rct=j&q=&esrc=s&source=web&cd=1&ved=0CCQQFjAA&url=http%3A%2F%2Fweb.arch.usyd.edu.au%2F~densil%2FAudio%26Acoustics%2FAbsorption%26InsulationData.xls&ei=YssjVaTuJ4LPaN6YgOAD&usg=

Paul McEvoy
47
AFQjCNEhPbtEYJOFYNa8ka-npe6WjeL2yQ
15. Department of Education. (2015, February). Acoustic Design of Schools: Performance Standards. In Building Bulletin 93.
16. Earthman, G. I. (2004). Prioritization of 31 Criteria for School Building Adequacy . Virginia Polytechnic Institute & State University .
17. Earthman,Lemasters. (1998). Where Children Learn: A Discussion of How a Facility Affects Learning .
18. Fleming,Storr. (2006). The impact of Lecture theatre design on learning experience. Emerald Insight.
19. Heriot Watt University. (2015). Postgraduate Centre. Retrieved from Heriot Watt University Campus Life: http://www.hw.ac.uk/student-life/campus-life
20. Hines, E. W. (1996). Building Condition and Student Achievement and Behaviour . Doctor of Education .
21. Lackney. (1999). Assessing School Facilities for Learning/Assessing the Impact of the Physical Environment on the Educational Process: Integrating Theoritical Issues with Practical Concerns.
22. Lanham. (1999). Relating Building and Classroom Condition to Student Achivement in Virginias' Elementary Schools. Dissertation .
23. Legislation. (1995). Disibility Discrimination act Part IV. Retrieved from Legislation.gov.uk: http://www.legislation.gov.uk/ukpga/1995/50/contents
24. Levia, S.-G. M. (2012). Recycled blocks with improved sound and fire insulation containing construction and demolition waste. Waste Management .
25. London South Bank University. (2014). People Finder. Retrieved 2014, from London South Bank University: http://www.lsbu.ac.uk/about-us/people-finder/prof-bridget-shield
26. London, I. o. (2014). Department of Physcology & Human Development . Retrieved from Institute of Education University of London: http://www.ioe.ac.uk/staff/phdt/phdt_19.html
27. Marshall Day. (2015). Acoustic Design - Rooms for Speech. Retrieved from Marshall Day Acoustics: http://marshallday.com/regionpage/marshall-day-acoustics-united-kingdom
28. myvenues. (2007). finder. Retrieved from myvenues.co.uk: http://www.myvenues.co.uk/new
29. Naticehia, & Carbonari. (2006). Feasibility analysis of an active technology to
Paul McEvoy
48
improve acoustic comfort in buildings. Building and Environment.
30. Nave, R. (2001). Reverberation. Retrieved from HyperPhysics Sound: http://hyperphysics.phy-astr.gsu.edu/hbase/acoustic/reverb.html
31. Parliament, E. (2011). Construction Products (CPD/CPR. Retrieved from EU Enterprise and Industry .
32. Peters, S. (2013). Acoustic Materials. In S. Peters, Materials Revolution 2: New Sustainable and Multipurpose Materials for Design and Architecture.
33. Ramma. (2009). Knowledge & Attitudes of Teachers Regarding the Impact of Classroom Acoustics on Speech Perception & Learning. The South African Journal of Communication Disorders.
34. Rossell,Arnet. (2006). Theorticial and Practical Review of Reverberation Formulae for Rooms with Non Homogenyc Absorption Distribution.
35. Scannell, Hodgson, Villarreal, Gifford. (2015). The Role of Acoustics in the Perceived Suitability of, and Well-Being in, Informal Learning Spaces. Environment & Behaviour.
36. Schneider, M. (2002). Do School Facilities Affect Academic Outcomes?
37. Shield & Dockrell. (2004). External and internal noise surveys of London primary schools. J. Acoust. Soc. of Am.
38. Shields,Doclrell. (2003). The Effect of Noise on Children at School. Building Acoustics Volume 10, 97-116.
39. Shields.Conetta.Cox.Mydlarz.Dockrell.Connolly. (2013). Acoustic and Noise in English Secondary Schools. Noise Control for Quality of Life.
40. Skills, D. o. (1997). Guidelines for Environmental Design in Schools .
41. Smith, Gray,Dove,Kirchner and Heras. (1997). Frequency & Effects of Teacher's Voice Problems .
42. Smith.Peters.Owen. (1982). Room Acoustics. In P. O. Simth, Acoustic and Noise Control (p. 36). London.
43. SPSS. (2015). IBM SPSS Statistical Data Editor.
44. Starmeter. (2015). Environmental & Industrial Sound Level Meters. Retrieved from Starmeters Instruments : http://starmeter.en.made-in-china.com/product/sMjxBVGrAikW/China-Environmental-and-Industrial-Digital-Sound-Level-Meter-Class-1.html
45. The Building Regulations. (2010). Resistance to the Passage of Sound. HM

Paul McEvoy
49
Government.
46. WiseGeek. (2014). Ambient Noise. Retrieved from WiseGeek : http://www.wisegeekhealth.com/what-is-ambient-noise.htm
Appendix
Reverberation Time Calculations
Figure 15: BRE BB93 Reverberation Time Calculation - James Watt Centre 1
Figure 16: Figure 15: BRE BB93 Reverberation Time Calculation - Cairn Auditorium

Paul McEvoy
50
Student Questionnaire Survey

Paul McEvoy
51
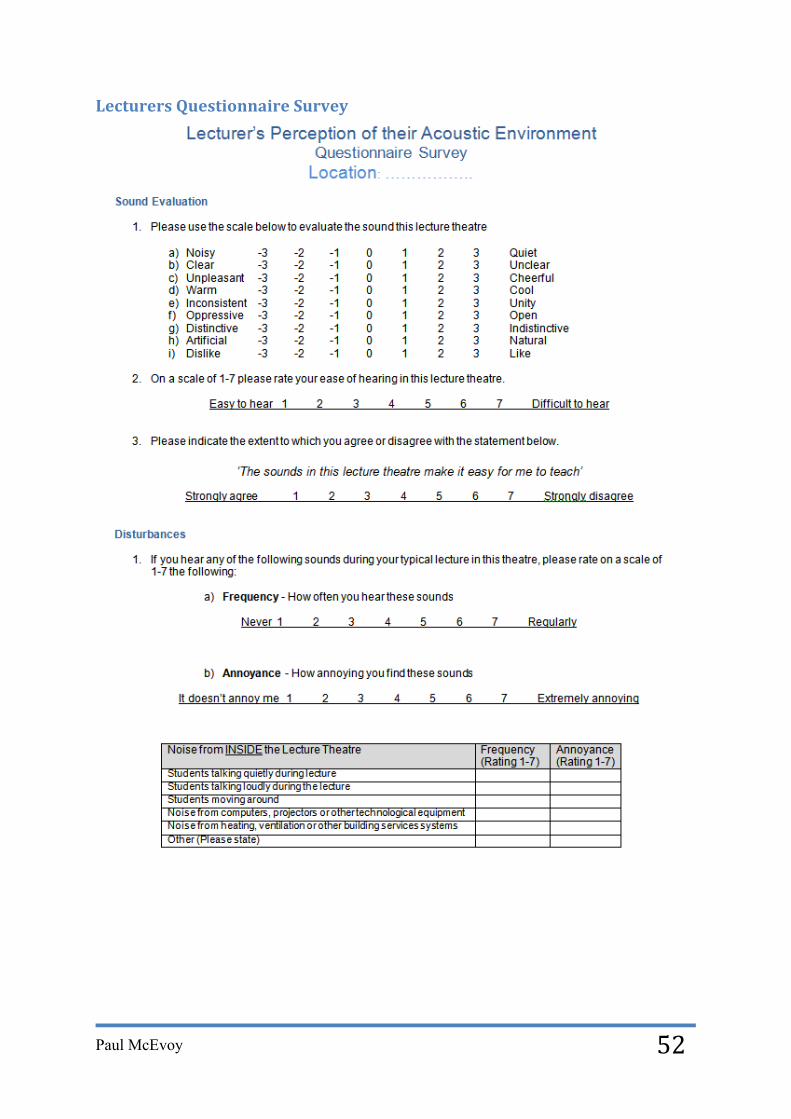
Paul McEvoy
52
Lecturers Questionnaire Survey

Paul McEvoy
53


![Man of steel [autosaved] [autosaved]](https://static.fdocuments.us/doc/165x107/5551d154b4c905922b8b51a1/man-of-steel-autosaved-autosaved.jpg)


![Presentation3 [Autosaved] [Autosaved]](https://static.fdocuments.us/doc/165x107/577d2e691a28ab4e1eaef4b4/presentation3-autosaved-autosaved.jpg)
