A Comparison of the Mobile Wireless Value Proposition ... Final Study.pdf · A Comparison of the...
33
© NERA Economic Consulting 1 A Comparison of the Mobile Wireless Value Proposition *† Christian M. Dippon, PhD Jason Claman NERA Economic Consulting Washington, DC, USA March 2, 2020 Abstract Since its humble beginnings in the 1980s, the mobile wireless services sector has fundamentally altered cultures, shaped societies, and contributed to economic growth. The nascent worldwide deployment of the fifth generation (5G) of mobile wireless technology is expected to have the most significant economic impact yet. Across the world, politicians, regulators, and competition authorities are analyzing the state of competition in their respective countries, considering regulatory and policy actions, and measuring the key performance indicators of mobile wireless service providers. To compare their country’s standing relative to international peer groups, they rely on international ranking lists. The interest in international comparisons in the mobile wireless sector has created a cottage industry in which regulators, consulting firms, and think tanks regularly rank countries based on a single variable—price. These price rankings, so several of them claim, are the Swiss Army knife of competition analysis. A country with a low ranking is viewed as noncompetitive and thus purportedly in need of regulatory intervention. Recent research has raised concern as to whether the methods employed in these ranking studies are sound and produce meaningful results. The studies’ simplistic analytical techniques assume a world where consumers are indifferent to all other competitive differentiators (i.e., monthly service allowance and quality differences) beyond price. The price rankings also fail to consider the vast differences between the study countries that affect the building of networks. The purpose of this study is to fill this void by ranking countries not solely by their nominal retail price points for mobile wireless services but rather by comparing them based on their more holistic mobile wireless value propositions. This study uses data from 1,554 retail plans offered by 213 mobile wireless providers in the summer of 2019 in the 36 countries of the Organisation for Economic Co-operation and Development (OECD). The data were used to fit a hedonic regression model using seven different country peer groups. Each of these models is used separately to predict the prices of every plan in the database and to calculate the ratios of actual prices to predicted prices. The average ratios for the providers are aggregated to the country level to create a specific country subscriber-share weighted average. Rankings reflect a country’s weighted average ratio. A ratio below one indicates that, on average, the country charges lower prices than its peer group. This approach overcomes the shortcomings of the price-only rankings and instead compares the value propositions of mobile wireless services. It also demonstrates that correcting for the omitted variable bias inherent in the price-only studies shows the United States ranking favorably against its peers with a ratio always below one as well as the best ratio in 76 percent of the cases. JEL Classification: C52, C93, D11, L96, O51, O52 Keywords: international price comparison, competition analysis, hedonic regression, regulation, bundled services * Comments welcome: [email protected]; [email protected] † The authors acknowledge funding for this paper from CTIA (www.ctia.org) and valuable comments and research assistance from Bernard Reddy, Dirk van Leeuwen, Jonathan Falk, Jason Sabatelle, Benjamin Schrock, Claire Huther, Caitlin Thompson, and Patricia Cunkelman.
Transcript of A Comparison of the Mobile Wireless Value Proposition ... Final Study.pdf · A Comparison of the...

© NERA Economic Consulting 1
A Comparison of the Mobile Wireless Value Proposition*†
Christian M. Dippon, PhD Jason Claman
NERA Economic Consulting
Washington, DC, USA
March 2, 2020
Abstract Since its humble beginnings in the 1980s, the mobile wireless services sector has fundamentally altered cultures, shaped societies, and contributed to economic growth. The nascent worldwide deployment of the fifth generation (5G) of mobile wireless technology is expected to have the most significant economic impact yet. Across the world, politicians, regulators, and competition authorities are analyzing the state of competition in their respective countries, considering regulatory and policy actions, and measuring the key performance indicators of mobile wireless service providers. To compare their country’s standing relative to international peer groups, they rely on international ranking lists. The interest in international comparisons in the mobile wireless sector has created a cottage industry in which regulators, consulting firms, and think tanks regularly rank countries based on a single variable—price. These price rankings, so several of them claim, are the Swiss Army knife of competition analysis. A country with a low ranking is viewed as noncompetitive and thus purportedly in need of regulatory intervention. Recent research has raised concern as to whether the methods employed in these ranking studies are sound and produce meaningful results. The studies’ simplistic analytical techniques assume a world where consumers are indifferent to all other competitive differentiators (i.e., monthly service allowance and quality differences) beyond price. The price rankings also fail to consider the vast differences between the study countries that affect the building of networks. The purpose of this study is to fill this void by ranking countries not solely by their nominal retail price points for mobile wireless services but rather by comparing them based on their more holistic mobile wireless value propositions. This study uses data from 1,554 retail plans offered by 213 mobile wireless providers in the summer of 2019 in the 36 countries of the Organisation for Economic Co-operation and Development (OECD). The data were used to fit a hedonic regression model using seven different country peer groups. Each of these models is used separately to predict the prices of every plan in the database and to calculate the ratios of actual prices to predicted prices. The average ratios for the providers are aggregated to the country level to create a specific country subscriber-share weighted average. Rankings reflect a country’s weighted average ratio. A ratio below one indicates that, on average, the country charges lower prices than its peer group. This approach overcomes the shortcomings of the price-only rankings and instead compares the value propositions of mobile wireless services. It also demonstrates that correcting for the omitted variable bias inherent in the price-only studies shows the United States ranking favorably against its peers with a ratio always below one as well as the best ratio in 76 percent of the cases. JEL Classification: C52, C93, D11, L96, O51, O52 Keywords: international price comparison, competition analysis, hedonic regression, regulation, bundled services
* Comments welcome: [email protected]; [email protected] † The authors acknowledge funding for this paper from CTIA (www.ctia.org) and valuable comments and research assistance from Bernard Reddy, Dirk van Leeuwen, Jonathan Falk, Jason Sabatelle, Benjamin Schrock, Claire Huther, Caitlin Thompson, and Patricia Cunkelman.

2
1. INTRODUCTION
In the United States, mobile wireless service providers introduced first generation (1G) mobile phone services in the 1980s. High prices, limited network coverage, relatively poor quality of service, and large and heavy mobile phones limited the initial adoption of mobile telephony, which remained a luxury throughout the 1980s and well into the 1990s. In November 1992, the San Francisco Chronicle reported, “Cellular phone users are finding that the price of making wireless phone calls has remained high—in some cases, as much as 80 times the price of a conventional call.”1 The literature on mobile market development seems to confirm that when first introduced mobile telephony was more of a status symbol than a mass-market service. Some two decades later, the attributes that describe mobile wireless services have completely changed. Prices have dropped to a fraction of their original levels, and mobile wireless service has emerged as an economic—and practical—substitute to conventional (landline) service. In fact, an increasingly large percentage of the global population no longer subscribes to conventional service. Nationwide network coverage is now the norm in all developed countries; the quality of service has massively improved, and handsets now fit in the palm of your hand. Consequently, mobile wireless service adoption rates are high—often at levels indicating that all potential users subscribe to mobile wireless services. Remarkably, in the developed world, the mobile wireless sector made this transition with little regulatory intervention. With fame comes responsibility. Today, mobile wireless services affect the culture of its users by introducing new customs and affecting traditions, skills, and intellectual achievements. Society is the amalgamation of individuals with different cultural backgrounds. Thus, given the cultural impact of mobile wireless services, this technology also makes significant societal contributions. The cultural and societal contributions, in turn, create contributions that profoundly influence economies and economic growth around the world. As the US Federal Communications Commission (FCC) Chairman Ajit Pai noted, “5G is critical to our economy, security, and quality of life….”2 The Chairman further cited to a consultancy study that “pegs 5G’s potential at 3 million new jobs, $275 billion in private investment, and $500 billion in new economic growth.”3 Similarly, the European Commission highlighted the importance of mobile wireless services and 5G in particular:
5G is also a key asset for Europe to compete in the global market. Worldwide 5G revenues should reach the equivalent of €225 billion in 2025. Benefits of 5G introduction across four key industrial sectors, namely automotive, health, transport and energy, may reach €114 billion per year.4
1 Anthony Ramirez, “Tiny Mobile Phones on the Way, They Could be Cheaper and More Versatile than Cellular Units,” San Francisco Chronicle, Nov. 12, 1992, 1992 WLNR 2475152.
2 Remarks of FCC Chairman Ajit Pai at The National Spectrum Consortium, 5G Collaboration Event, Arlington, VA, April 30, 2019, https://docs.fcc.gov/public/attachments/DOC-357245A1.pdf.
3 Ibid. 4 European Commission, Questions and Answers – Commission recommends common EU approach to the
security of 5G networks, Strasbourg, 26 March 2019, https://europa.eu/rapid/press-release_MEMO-19-1833_en.htm.
3
Economist and Chairman of the World Economic Forum Klaus Schwab “is convinced that we are at the beginning of a revolution that is fundamentally changing the way we live, work and relate to one another.”5 The disruptive technologies (e.g., drones, autonomous vehicles, and telemedicine) that underlie the fourth industrial revolution are largely based on mobile wireless technical developments, rendering mobile wireless the enabler of this anticipated industrial revolution. Given the increasing economic importance of mobile wireless services, politicians, regulators, and competition authorities are keen to take advantage of the economic benefits that 5G stands to generate. Thus, they analyze the state of competition in their respective domestic markets and consider regulatory and policy steps in the hope of influencing innovation and downstream prices. As market success is relative, the countries’ leaders are eager to understand how their markets compare to those in their peer group. For instance, Innovation, Science and Economic Development (ISED) Canada, a department of the Canadian government, annually commissions a report that intends to compare the prices of wireline, wireless, and Internet Services within Canada and internationally.6 Until 2017, the British regulator Ofcom conducted an annual international comparison called the International Communications Market Report “to compare the UK communications sector with a range of countries in order to assess how the UK is performing in an international context.”7 The interest in international comparisons in the mobile wireless sector has created a cottage industry in which regulators, consulting firms, and think tanks regularly rank countries. Although these rankings differ in their specific methodologies, each of them ranks the countries based on a single variable—price. These price rankings, so several of the authors claim, are the Swiss Army knife of competition analysis. A country that ranks lower on a list is declared noncompetitive and thus supposedly in need of regulatory intervention. Recent research has raised concerns as to whether the methods employed in these ranking studies are sound and produce meaningful results. For instance, I found a price ranking study by the Canadian consultancy NGL Nordicity Group Ltd. (Nordicity) “false because of the poorly designed and executed methodology used to conduct the Study.”8 Fruits et al. critically evaluated a price ranking study by Finnish consultancy Rewheel and concluded, “The Rewheel study is, in effect, the epitome of a flawed study …. a careless mish-mash of data points from which no
5 World Economic Forum, The Fourth Industrial Revolution, by Klaus Schwab, 2019, https://www.weforum.org/pages/the-fourth-industrial-revolution-by-klaus-schwab.
6 See Wall Communications Inc., “Price Comparisons of Wireline, Wireless and Internet Services in Canada and with Foreign Jurisdictions 2018 Edition,” prepared for Innovation, Science and Economic Development Canada, August 29th, 2018, https://www.ic.gc.ca/eic/site/693.nsf/vwapj/telecom2018e.pdf/$file/telecom2018e.pdf.
7 Ofcom, “International Communications Market Report 2017,” December 18, 2017, p. 4. In response to an email request to Ofcom asking why it stopped commissioning the report after the 2017 version, the regulator explained, “Over time we found that it was becoming increasingly difficult to verify or have confidence on the comparability of the data across countries owing to differing techniques for measurement.” (See email from Ofcom Analyst Relations to Jason Claman of NERA Economic Consulting, re: Ofcom International Communications Market Report, October 1, 2019.)
8 Christian M. Dippon, Ph.D., “An Accurate Price Comparison of Communications Services in Canada and Select Foreign Jurisdictions,” NERA Economic Consulting, October 19, 2018, Executive Summary (hereinafter Dippon Wall/Nordicity Critique).
4
reliable conclusions can be [drawn].”9 Similarly, I concluded that Rewheel’s study “is a highly simplistic international price comparison exercise that results in economically meaningless rankings.”10 Kenny and Broughton (2013) have pointed out that the study’s assumptions “have no good justification” and there is “no empirical evidence to support” Rewheel’s theories.11 Further, a Solchaga Regio review of Rewheel’s study found that “conceptual inconsistencies […] render[] it invalid as an indicator of price level or change over time.”12 The fundamental problem with the existing price ranking studies is that they all suffer from an omitted variable bias, albeit to different degrees. The studies assume a world where consumers are indifferent to all other competitive differentiators (e.g., monthly service allowances and quality differences) beyond price. The rankings also fail to consider the vast differences in building networks in the study countries. Given the increasing importance of international comparisons, it is critical that these studies consider all value components and rely on proper analytical tools. The purpose of this study is to fill this void by ranking countries not simply by their retail price points for mobile wireless services but by comparing them based on their more holistic mobile wireless value propositions. A customer’s value proposition is the value of the experiences a user will realize upon purchase and use of a product. For instance, a simple price comparison would indicate that a $30 plan is a better proposition than a $40 plan. However, if the value proposition of the second plan exceeds that of the first by the equivalent of $10 or more, the second plan is a better proposition because it provides more bang for the buck. The mobile wireless value proposition consists of not only how many megabytes of data the plan includes but also how many voice minutes, SMS messages, and other services the plan includes. The value proposition also accounts for network quality because a low price on a spotty network with low download speeds may offer a lower value to the consumer than a higher price on a more ubiquitous network with excellent download speeds. The value proposition also considers the fact that serving smaller countries with high urbanization rates is less costly than building a network in a large country with sizable rural regions. This study uses data from 1,554 retail plans offered by 213 mobile wireless providers in the summer of 2019 in the 36 countries of the Organisation for Economic Co-operation and Development (OECD). The data were fit to hedonic regression models using seven different country peer groups. Each of the models is used separately to predict the prices of every plan in the database and to calculate the ratios of actual prices to predicted prices. The average ratios for
9 Eric Fruits, Justin (Gus) Hurwitz, Geoffrey A. Manne, Julian Morris, and Alex Stapp, “A Review of the
Empirical Evidence on the Effects of Market Concentration and Mergers in the Wireless Telecommunications Industry,” International Center for Law & Economics (ICLE Antitrust & Consumer Protection Research Program White Paper 2019-09-17): 29, https://laweconcenter.org/wp-content/uploads/2019/09/ICLE-Telco_Merger_Lit_Review_Jud_Rpt_FINAL.pdf.
10 Christian M. Dippon, Ph.D., “Oversimplified and Misleading International Price Comparisons Must Not Guide Policy and Regulatory Decisions A Critical Review of Rewheel’s Digital Fuel Monitor Reports,” NERA Economic Consulting, March 13, 2019, p. 1 (hereinafter Dippon Rewheel Critique).
11 Robert Kenny and Tom Broughton, “A critical analysis of the Rewheel paper, EU27 mobile data cost competitiveness report – May 2013,” Communications Chambers, June 17, 2013, pp. 3, 19.
12 Solchaga Recio & Associates, “Rebuttal of the mobile internet prices analysis using the incremental gigabyte,” Telefonica, April 2015, p. 4.

5
the providers are aggregated to the country level with a subscriber-share weighted average. The ranking reflects a country’s weighted average ratio. A ratio below one indicates that, on average, the country charges lower prices than its peer group. This approach overcomes the shortcomings of the price-only rankings and instead compares the value proposition of mobile wireless services. It also demonstrates that correcting for the omitted variable bias embedded in the price-only studies shows that the United States ranks favorably against its peers with a ratio always below one and the best ratio in 76 percent of the cases. The structure of this paper is as follows. Section 2 discusses several studies currently available that rank countries. Section 3 provides a brief literature review. Section 4 describes the database. Section 5 provides database summary statistics. Section 6 discusses the hedonic regression model used to fit the data. Section 7 calculates the price index for various peer groups within the OECD and ranks the countries. Section 8 concludes. The appendix contains the detailed regression results. 2. Studies Making Comparative Rankings
Several studies are available that attempt to rank groups of countries by the performance of their telecommunications markets. Interest in the comparative ranking of countries is substantial, as evidenced by the number of studies available. Rankings are beneficial if properly done because they can indicate areas in need of improvement. However, most of the existing studies are significantly limited because they focus almost exclusively on price and ignore all other competitive distinguishers, including plan attributes other than price and service quality. They all also inherently assume that building and maintaining a mobile wireless network costs the same in all study countries. That is, building and maintaining a network in a country the size of Belgium costs the same as building and maintaining a network in countries such as the United States and Canada. One of these studies is a pricing comparison commissioned by ISED Canada and executed over the years by either Wall Communications Inc. (Wall) or Nordicity. Conducted annually, this ranking compares select retail prices in Canada to retail prices offered by providers in the G7 countries and Australia.13 The 2018 edition of the Wall/Nordicity study ranks the United States between sixth and seventh out of the eight countries.14 To rank the study countries, Wall/Nordicity creates six artificial demand baskets, which it calls Levels. For instance, Wall/Nordicity’s Level 3 basket consists of a hypothetical subscriber that consumes 1,200 voice minutes, 300 Short Message Service (SMS) messages, and 1 gigabyte (GB) of data each month. Wall/Nordicity provides no information on how it derived its baskets. Because providers design their retail plans to meet the needs of their subscribers, they typically do not have plans that conform to the Wall/Nordicity artificial baskets. Wall/Nordicity ignores this fundamental problem and simply compares the prices of the cheapest plan that meets or exceeds a given Wall/Nordicity basket. Because the baskets lack an empirical foundation, this results in a price
13 See, e.g., Wall Communications, Price Comparisons of Wireline, Wireless and Internet Services in Canada and with Foreign Jurisdictions, Aug 29, 2018 (hereinafter Wall 2018); see also NGL Nordicity Group, 2017 Price Comparison Study of Telecommunications Services in Canada and Select Foreign Jurisdictions, October 5, 2017.
14 Not all baskets have a price for all countries. This statement reflects the rankings in Mobile Wireless Baskets 4, 5, and 6. (See Wall 2018, pp. 68–69.)
6
comparison of drastically different plans that produces meaningless results. In fact, a country could easily top Wall/Nordicity’s ranking by having one provider introduce a plan that exactly meets the criteria for each of the six baskets. Moreover, depending on how similar or dissimilar the plans are in each basket, the study reports drastic and incredible price fluctuations from year to year. This includes a claimed price decrease of 48.3 percent in France (for Level 4 plans), a price increase of 26.4 percent in Australia (for Level 3 plans), and a price decrease in Canada of 25.7 percent (for Level 1 plans). Without testing the plausibility of its conclusions against real world data, Wall/Nordicity reports these numbers not realizing that they are the result of a flawed study design. In fact, in one of its earlier reports, Nordicity acknowledged its limitations:
Prices in Canada and international jurisdictions are driven by a complex mix of a number of factors: cost of service, competitive positioning, technological advances, consumer behaviour and regulatory frameworks.… This Study did not take into account the network technologies deployed in the networks nor the speed or quality of service of those networks. Finally, this Study did not account for any cost of service or socio-economic factors that may be relevant for price differences across different domestic and international jurisdictions. Thus, factors such as population density, terrain and climate have significant impacts on the cost of service.15
Through 2017, the British regulator Ofcom also conducted a yearly price ranking study titled The International Communications Market.16 Ofcom states, “This report is intended to be used in a number of ways: to benchmark the UK’s communications sector, to learn from market and regulatory developments in other countries, and to provide the context for Ofcom’s regulatory initiatives.”17 Using a variety of data sources and desktop research, the regulator used a basket approach in evaluating the UK’s communications market relative to its peer group. Specifically, the study creates three baskets (low, medium, and high users) for mobile wireless services that contain varying call, SMS, and data volumes. The voice volume was measured in number of calls instead of the more common voice minutes. Ofcom then compared the “best prices available from the leading providers by retail market share in each country to buy a ‘basket’ of services.”18 As such, the study was limited to plan attributes and did not consider differences in network and country attributes. Ofcom limited its peer group to the United States, France, Germany, Italy, and Spain.19 More important, Ofcom clearly lists the limitations of its approach. For example, Ofcom highlights, “Our pricing analysis is based on a limited number of baskets, when actual consumer use will span a much wider range of types of use.”20 Finnish consultancy Rewheel/research biannually publishes an international price comparison called the Digital Fuel Monitor. Rewheel also uses a basket approach although data is the only variable in the basket. Specifically, Rewheel reports the maximum GBs of data that consumers in
15 NGL Nordicity Group, 2016 Price Comparison Study of Telecommunications Services in Canada and
Select Foreign Jurisdictions, March 22, 2016, p. 12. For a detailed review of the Wall/Nordicity price comparison, see Dippon Wall/Nordicity Critique.
16 See Ofcom “International Communications Market Report 2017,” 18 December 2017, https://www.ofcom.org.uk/__data/assets/pdf_file/0032/108896/icmr-2017.pdf.
17 Ibid, p. 4. 18 Ibid, p. 38. 19 Ibid, p. 43. 20 Ibid, p. 39.

7
each study country can buy at one or more monthly price points (i.e., €5, €10, €15, €20, €25, €30, €40, €50, €60, €70, and €80). Rewheel then divides the monthly recurring charges (MRCs) for these plans by the monthly data allowances to arrive at what the consultancy calls fully allocated gigabyte prices. It then ranks the 41 countries according to the one plan that offers the maximum monthly GB allowance at each price point and the one plan that represents the median fully allocated GB price. In Rewheel’s study, the assumption is that consumers care only about how much data they can get for a certain budget. All other competitive differentiators (i.e., plan and quality differences) and cost differences (e.g., size of network built) are irrelevant. There is an easy way to demonstrate that Rewheel’s world differs starkly from the actual world. If consumers cared only about data, as assumed by Rewheel, then they would purchase only the plans offering the most data for a given budget. However, marketplace evidence clearly refutes this simplistic assumption; there is no indication of a positive correlation between providers offering data rich plans and market share, thus refuting the notion that consumers care only about data allowances. Based on these limitations, the Rewheel study has been repeatedly criticized and found unscientific and meaningless.21 The OECD has been collecting communications prices across countries for over 20 years.22 The OECD uses a basket approach consisting of 12 baskets split into three groups (low, medium, and high users) in which “each group includes different levels of voice calls, messages (SMS) and data use (GB).”23 The OECD harvests the data via various programs, including questionnaires completed by the member countries’ official statistics producers.24 It does not appear that the OECD evaluates the data collected on mobile wireless services. Rather, several consultancies use the OECD-collected data to build their own statistics and rankings. For instance, Teligen/Strategy Analytics (Teligen) produces commercially available ranking reports that it updates regularly.25 The rankings based on the OECD data suffer from some of the same flaws as other international price comparisons because the focus is on an overly narrow value proposition that considers only select plan attributes and omits all network and country attributes. In fact, the OECD warns, “All statistical country comparisons should be undertaken with caution….”26 The
21 See Dippon Rewheel Critique; see also Robert Kenny and Tom Broughton, “A critical analysis of the Rewheel paper, EU27 mobile data cost competitiveness report – May 2013,” Communications Chambers, June 17, 2013; Solchaga Recio & Associates, “Rebuttal of the mobile internet prices analysis using the incremental gigabyte,” Telefonica, April 2015; Frontier Economics, “Mobile prices in Austria, What Has Happened After the Mobile Merger in Austria,” May 2015.
22 See Before the Federal Communications Commission, International Comparison Requirements Pursuant to the Broadband Data Improvement Act; International Broadband Data Report, Sixth Report, GN Docket No. 17-199, 31 FCC Rcd at 748, n. 128 (2018) (hereinafter Sixth International Broadband Report).
23 OECD Working Party on Communication Infrastructures and Services Policy, “Revised OECD Telecommunications Price Baskets,” 19 Dec 2017, p. 8, http://www.oecd.org/officialdocuments/publicdisplaydocumentpdf/?cote=DSTI/CDEP/CISP(2017)4/FINAL&docLanguage=En.
24 See OECD, “OECD Data Collection Programme,” https://www.oecd.org/statistics/data-collection/ (accessed October 1, 2019).
25 The low mobile basket included 100 calls and 500 MBs of data. (See Strategy Analytics, “OECD Mobile Voice and Data Price Benchmarking Q3 2019 update,” October 2, 2019, https://www.strategyanalytics.com/access-services/service-providers/tariffs---mobile-and-fixed/voice/oecd-mobile-voice/market-data/report-detail/oecd-mobile-voice-and-data-price-benchmarking-q3-2019.)
26 OECD, “Broadband Methodology OECD Broadband Subscriptions Criteria (2015),” https://www.oecd.org/sti/broadband/broadband-methodology.htm.

8
organization also emphasizes, “There is a breadth of market, regulatory and geographic factors which help determine penetration rates, prices, and speeds.”27 More important, the OECD highlights, “It is important that policy makers examine a wide range of broadband indicators when considering key policy decisions.”28 In 2017, the FCC conducted an international comparison of fixed and mobile broadband services.29 As required by law,30 the FCC compares the extent of broadband service capability between the United States and at least 25 other countries that should be similar to the United States “with respect to population size, population density, topography, and demographic profile.”31 The aim of the FCC’s study is to provide “comparative international information on broadband services and, where possible, a year-to-year measure of the extent of broadband service capability in the United States and select communities and countries abroad.”32 The FCC selected 28 OECD countries for comparison with the United States. In forming its peer group, the FCC focused on countries with the highest level of broadband adoption, using this as an indicator of highly developed broadband markets.33 Unlike other studies that focus predominately or uniquely on price, the FCC evaluated broadband offerings based on speed and separately on price. With respect to speed, the FCC relied on actual speeds as collected by Ookla (proprietor of speedtest.net).34 With respect to price, the FCC created a ranking based simply on “unweighted average prices for standalone fixed broadband plans within certain download speed ranges and mobile plans within bands of data usage allowances.”35 However, the FCC did opt to use two additional methodologies: a weighted average broadband price index and a hedonic price index.36 With respect to the hedonic price index, the FCC collected a database of 555 mobile plans from provider websites across the comparison countries. For mobile broadband pricing, the FCC considered several plan attributes (i.e., voice minutes, SMS messages, GBs of data, plan contract length, long distance voice, and the inclusion of a handset) and several country factors (content availability by language, 4G availability, population density, education level, income, data usage, and a dummy to indicate whether a country’s primary language is English). The FCC’s ranking contained no network attributes (i.e., download speeds, upload speeds, latency, etc.). The FCC study included several regressions that predicted mobile services prices using these plan and country factors. Not all country attributes were used in all regressions.37
27 Ibid. 28 Ibid. 29 Sixth International Broadband Report. 30 See 47 U.S.C. § 1303(b). 31 Sixth International Broadband Report, ¶ 2. 32 Ibid, ¶ 1. 33 Specifically, for comparison with the United States, the FCC selected Australia, Austria, Belgium,
Canada, Czech Republic, Denmark, Estonia, Finland, France, Germany, Greece, Iceland, Ireland, Italy, Japan, Latvia, Luxembourg, Netherlands, New Zealand, Norway, Portugal, South Korea, Spain, Sweden, Switzerland, and UK. In addition, “To increase geographic diversity and representation of the Americas region,” the FCC also included OECD members Chile and Mexico. (Ibid, ¶ 6.)
34 Ibid, ¶ 10. 35 Ibid, Appendix C, ¶ 2. 36 Ibid, ¶ 13. 37 Ibid, ¶ 15.
9
This summary of available comparative studies reveals that except for the regression approach used in part of the FCC’s study, international price rankings build on the basket approach. The basket approach, however, has long been criticized, and its limits have been well documented.38 Even the OECD, which was instrumental in developing the basket approach, warns its readers not to draw competitive or policy decisions based on such an approach: “There is a breadth of market, regulatory and geographic factors which help determine penetration rates, prices, and speeds. Therefore, it is important that policy makers examine a wide range of broadband indicators when considering key policy decisions.”39 3. Literature Review
In addition to the international ranking studies conducted by the regulators, consultancies, and think tanks, the economic literature contains several price comparisons, albeit with a different focus and not always from an international perspective. Nevertheless, the literature is informative because it provides examples of best practices when comparing domestic and international mobile wireless plans. Kim and Kim examine the services of three major mobile network operators (MNOs) in South Korea (SK Telecom, KT, and LGU+) with the objective of constructing price indices that measure annual price changes, net of quality and volume changes. The study relies on a database of postpaid smartphone plans offered in the retail market between 2010 and 2017.40 The authors do not disclose the number of observations but explain the use of a quality-adjusted price index to compare the three MNOs’ retail offerings. Price indices are derived using several econometric models in which the monthly recurring charge is regressed on plan attributes (data quantities, voice minutes, VoIP calls, and video call minutes), network attributes (LTE and 3G download speeds), and an indicator for the firm offering the plan (brand value). Relevant to the present purpose, the Kim and Kim study highlights that prices cannot be compared year over year without also adjusting for changes in plan and network attributes. This is in stark contrast to several of the international price ranking studies that make little to no adjustments for changes in the service volume and quality. Similarly, Schöni and Seger use linear hedonic regressions to predict mobile service prices in Switzerland, controlling for plan attributes (quantity of minutes, SMS messages, and data as well as roaming allowances and handset subsidies).41 The authors estimate separate hedonic regressions for each of Switzerland’s major providers and compare them using price indices, thereby implicitly also considering network and brand effects. The study database consists of
38 See, for example, Solchaga Recio & Associates, “Rebuttal of the mobile internet prices analysis using the
incremental gigabyte,” Telefonica, April 2015. 39 OECD, Broadband Methodology, https://www.oecd.org/sti/broadband/broadband-methodology.htm. 40 See Wook Joon Kim and Yongkyu Kim, “An estimation of quality-adjusted prices for mobile services in
Korea,” at The 22nd Biennial Conference of the International Telecommunications Society: “Beyond the boundaries: Challenges for business, policy and society,” June 24th–27th, 2018, Seoul, Korea, p. 10.
41 See Olivier Schöni and Lukas Seger, “Comparing Mobile Communication Service Prices Among Providers: A Hedonic Approach” (FSES Working Papers 448, Faculty of Economics and Social Sciences, University of Freibourg/Fribourg Switzerland, 2014), pp. 2, 10.
10
monthly invoices for students and employees of the University of Fribourg, all of which are for the three major MNOs in Switzerland. Plans were recorded from Q1 2012 through Q1 2013 and totaled 415 observations. Yun, Kim, and Kim analyze the prices of mobile telecommunications services in 12 cities with different levels of service quality in order to derive a quality-adjusted price index for international comparisons.42 The 12 cities include Los Angeles, San Francisco, New York, Toronto, London, Madrid, Stockholm, Frankfurt, Paris, Rome, Tokyo, and Melbourne.43 The plan database consists of “the service plans offered by the operator with the largest number of subscribers in each of the ten countries.”44 All plans are from 2015 and include unlimited voice and SMS. It is unclear exactly how many plans the authors recorded. Plan variables include the MRC, whether or not taxes are included, the data quantity, the subscription fee, the contract duration, whether or not a device is included, and the subsidized device price (if applicable). The study includes data about actual observed speed in each city in a variety of settings (road, buildings, subway) in both absolute terms and standard deviation (variation). The authors estimate parameters by regressing the price of mobile service on the characteristics of each service plan and the quality of service. The authors estimate seven models, all of which include the quantity of data. Some models account for handset subsidy, one-time fees, city-level service quality, and variation in service quality. 45 In the quality-adjusted models, the three US cities vary widely in rankings, placing between first and sixth.46 The review of the existing ranking studies and the economic literature reveals an interesting trend. The commercial ranking studies (i.e., those executed by consultancies and think tanks) focus on price only and adjust for only a few select variables, thereby ignoring the many other attributes that explain price differences among mobile wireless plans. The academic ranking studies (i.e., those executed by the FCC and studies in peer-reviewed journals), however, use regression analyses to evaluate the data, thereby minimizing or potentially eliminating the omitted variable bias contained in the commercial ranking studies. It is unclear why the commercial ranking studies refrain from using econometric techniques to adjust for known differences. The present study employs the statistical tools of the economic literature (i.e., regression analysis) to adjust prices for differences in plans, network quality, and country characteristics. As such, it resembles most closely the approach used by the FCC. It is different from the FCC approach in that it also considers network attributes and a broader array of plans. 4. Database
To rank the international mobile wireless value proposition, a database of mobile wireless plans in the 36 OECD countries was constructed containing prices (as measured by the monthly recurring charge, net of taxes, and a prorated portion of the installation fees), plan attributes, network attributes, and country attributes.
42 Seong Hun Yun, Yongjae Kim, and Minki Kim, “Quality-adjusted international price comparisons of mobile telecommunications services,” Telecommunications Policy 43, Issue 4 (May 2019): 346.
43 Ibid, 349. 44 Ibid, 343. 45 Ibid, 347. 46 Ibid, 350.
11
As detailed below, 1,554 retail plans were recorded from a variety of providers in OECD countries. It is important to note that these plans were actual retail offerings per the providers’ websites during the harvesting period of June 10, 2019 through July 25, 2019. Although website offerings provide no information on how many subscribers opted for the selected plans, it is reasonable to assume that providers carefully tailor their plans to their anticipated demand profiles. Furthermore, the study intentionally includes plans offered by both facilities-based providers (i.e., MNOs) and service-based providers (i.e., MVNOs) because those are the actual service offerings experienced by the users. 4.1. Provider and Plan Selection
Providers were selected based on type and provider share. For each of the OECD countries, the objective was to include consumer retail plans offered by the three largest MNOs by subscriber share, the two largest operator-owned (OO) MVNOs, and the two largest independently owned (IO) MVNOs. For instance, in the United States, the database contains retail plans from MNOs Verizon, AT&T, and T-Mobile; OO MVNOs Cricket and Virgin; and IO MVNOs Tracfone and Consumer Cellular. Although all OECD countries had at least three MNOs, not all study countries had two OO MVNOs or two IO MVNOs. Plans were selected based on type and price or service volume. For each of the selected providers, the objective was to harvest three prepaid plans and four postpaid plans. The three prepaid plans were selected based on price, recording the cheapest, the most expensive, and the plan closest to the middle of the price range. The four postpaid plans were selected based on volume, recording one postpaid individual plan with unlimited voice and SMS, one postpaid individual plan with limited voice or SMS, one postpaid group (family) plan with unlimited voice and SMS, and one postpaid group (family) plan with limited voice or SMS. If a certain type of plan was not available, a plan from the next closest category was substituted. For instance, if only two postpaid plans were available from a provider, the database contains five prepaid plans. If there were no group postpaid plans with limited voice and SMS, the database contains an additional group postpaid plan with unlimited voice and SMS. For group plans that included multiple lines, a separate observation was recorded for each possible quantity of lines. For example, if a provider offered a shared plan with up to five subscribers, the database contains five separate observations. Plan prices and quantities include promotions. If a plan offered multiple contract options, the term length that offered the lowest price was recorded. 4.2. Plan Attributes
For each selected plan, the following plan attributes were recorded: MRC, price to add a line, number of lines included in the MRC, one-time fees, contract term, GBs of data, SMS messages, minutes, provider type (MNO or MVNO), plan type (prepaid/postpaid), and technology (all, 3G only, etc.). All price components exclude taxes and are expressed in USD and adjusted for purchasing power parity (PPP). 4.3. Network Attributes
The mobile wireless value proposition is also a function of network quality. Although provider-specific quality metrics are not available, there are two important quality metrics available at the

12
country level. Specifically, the database includes average network download speeds (Mbps), as reported by the Ookla Global Speedtest Index,47 and 4G network coverage, as reported by the Economist Intelligence Unit.48 4.4. Country Attributes
Retail prices must also be adjusted for the vastly different geographic and socioeconomic environments in which networks are built and services are provisioned. For instance, the per capita investment requirements in a country with a low population density (e.g., Australia with three people per square kilometer) may be significantly higher than in a country with high population density (e.g., South Korea with 527 people per square kilometer). Similarly, as reflected in the FCC study, a country with a high English proficiency index stands to have a higher demand for mobile wireless data than a country with a low index. Consequently, the study database contains several country level attributes from a variety of sources, including the ITU, the Economist Intelligence Unit, TeleGeography, the World Bank, the OECD, and the CIA World Factbook, among others. Variables of interest include urban population percentage, surface area, Gross National Income (GNI) per capita, English proficiency index, and website availability in a country’s most widely spoken language. 5. Descriptive Statistics
As shown in Table 1, the database selection process yields 1,554 consumer retail plans offered by 108 MNOs, 63 IO MVNOs, and 42 OO MVNOs.
Table 1. Database Summary
47 See Ookla, Speedtest Global Index, “Global Speeds April 2019,” https://www.speedtest.net/global-index
(accessed June 5, 2019). 48 See The Economist Intelligence Unit, “Inclusive Internet Index 2019,” February 2019,
https://theinclusiveinternet.eiu.com/explore/countries/performance.
# of Plans 1554# of MNOs 992# of IO MVNOs 345# of OO MVNOs 217% MNO 63.8%% MVNO 36.2%
# of Single-Line Plans 1135# of Multi-Line Plans 419# of Providers 213
# of MNOs 108# of IO MVNOs 63# of OO MVNOs 42% MNO 50.7%% MVNO 49.3%

13
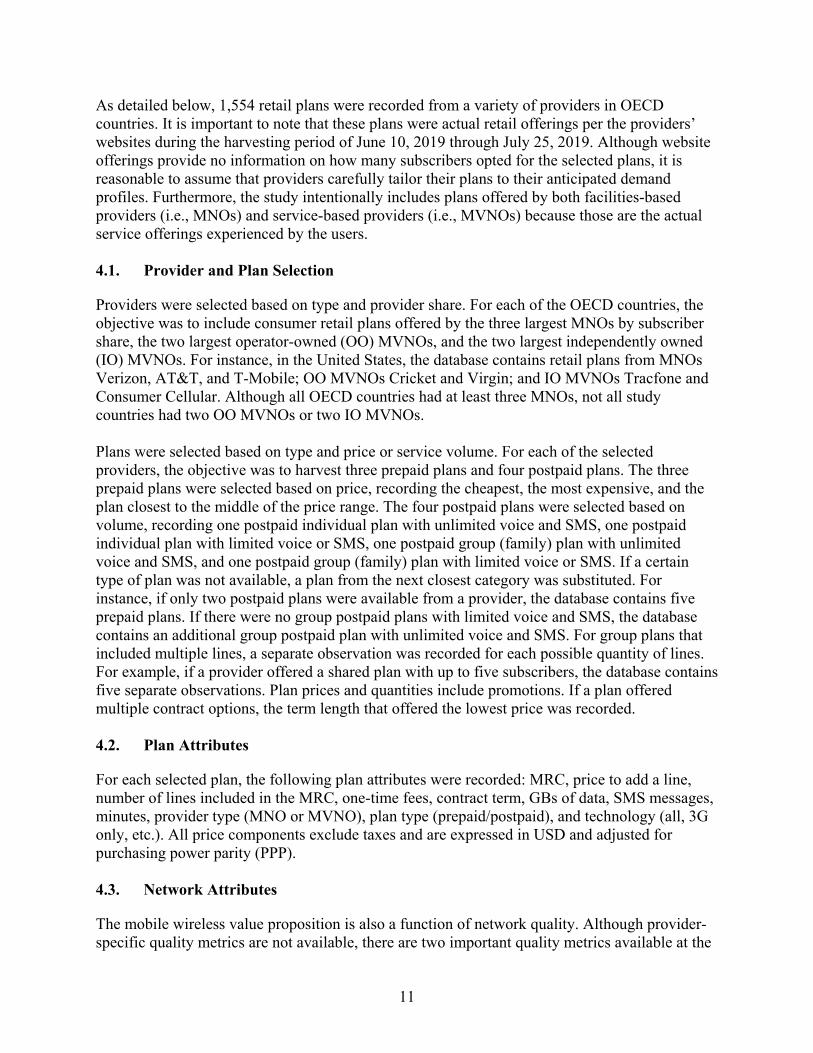
Table 2 provides the database summary statistics by country. Interestingly, as shown in Table 2, in most OECD countries, family plans are rare or not offered. Specifically, no family plans were found in Austria, Belgium, Finland, France, Ireland, Italy, Latvia, Lithuania, Mexico, Norway, Slovakia, South Korea, and Switzerland. It is well-known that the availability and uptake of family plans varies widely between countries. In the United States, 68 percent of smartphone users are part of a family plan.49
49 Aaron Smith, “U.S. Smartphone Use in 2015,” Pew Research Center, April 1, 2015, Chapter One: A
Portrait of Smartphone Ownership.
14
Table 2. Database Summary by Country
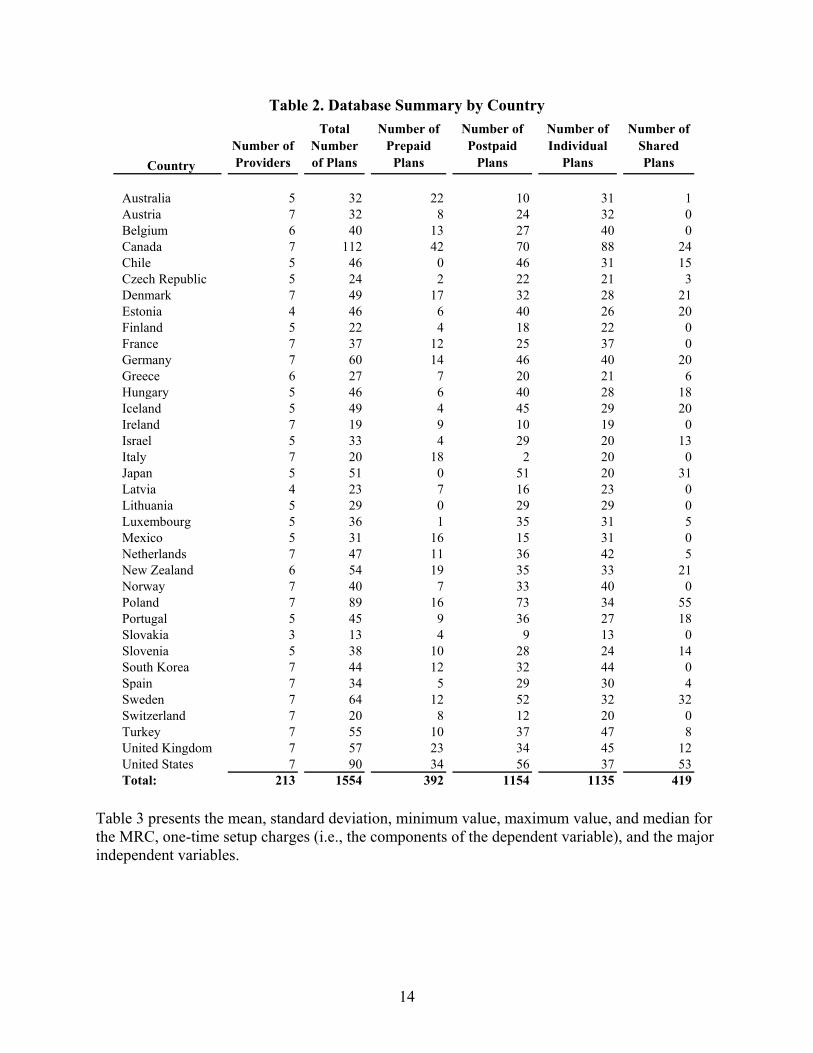
Table 3 presents the mean, standard deviation, minimum value, maximum value, and median for the MRC, one-time setup charges (i.e., the components of the dependent variable), and the major independent variables.
Country
Australia 5 32 22 10 31 1Austria 7 32 8 24 32 0Belgium 6 40 13 27 40 0Canada 7 112 42 70 88 24Chile 5 46 0 46 31 15Czech Republic 5 24 2 22 21 3Denmark 7 49 17 32 28 21Estonia 4 46 6 40 26 20Finland 5 22 4 18 22 0France 7 37 12 25 37 0Germany 7 60 14 46 40 20Greece 6 27 7 20 21 6Hungary 5 46 6 40 28 18Iceland 5 49 4 45 29 20Ireland 7 19 9 10 19 0Israel 5 33 4 29 20 13Italy 7 20 18 2 20 0Japan 5 51 0 51 20 31Latvia 4 23 7 16 23 0Lithuania 5 29 0 29 29 0Luxembourg 5 36 1 35 31 5Mexico 5 31 16 15 31 0Netherlands 7 47 11 36 42 5New Zealand 6 54 19 35 33 21Norway 7 40 7 33 40 0Poland 7 89 16 73 34 55Portugal 5 45 9 36 27 18Slovakia 3 13 4 9 13 0Slovenia 5 38 10 28 24 14South Korea 7 44 12 32 44 0Spain 7 34 5 29 30 4Sweden 7 64 12 52 32 32Switzerland 7 20 8 12 20 0Turkey 7 55 10 37 47 8United Kingdom 7 57 23 34 45 12United States 7 90 34 56 37 53Total: 213 1554 392 1154 1135 419
Number of Providers
Total Number of Plans
Number of Prepaid
Plans
Number of Postpaid
Plans
Number of Individual
Plans
Number of Shared Plans
15
Table 3. Database Descriptive Statistics
Table 3 reveals several interesting findings such as the mean MRC per line is $29.80 with a standard deviation of $20.13. In addition, the tails of the distribution are quite wide. Amaysim, an Australian IO MVNO, offers the lowest observed price of $0.68 per line. This prepaid plan includes 1 GB of data plus unlimited voice and SMS and a term of 28 days. When recorded, it had a promotional price of AUD 1. Converting to USD PPP, removing taxes, and prorating to 30 days, this comes to USD 0.68 per month. Turkcell, a Turkish MNO, offers the most expensive plan in the database. This postpaid plan includes 50 GBs of data plus 100 SMS messages and 2,000 voice minutes with a 12-month contract. The MRC is TL 349.90. Converting to USD PPP and removing taxes, this comes to USD 190.05. The average MRC in the United States is $39.29, and although higher than the mean of plans in the database, it is within a standard deviation from the mean. In addition, the median nonrecurring setup fee of $0.00 indicates that most mobile wireless providers do not charge setup fees, which is not surprising because mobile wireless services typically do not require installation and SIM activation is executed remotely. At $44.71, the plans offered by O2 (Telefonica’s German MNO) seem to be the exception as each plan includes a €39.99 activation fee. None of the recorded plans in the United States includes one-time fees. If SMS is included in a database plan, it usually contains unlimited SMS messages, indicating that the metered model for SMS is no longer common practice. This observation also applies to the United States where 83 of the 90 recorded plans include unlimited SMS. Most plans also include unlimited voice calling with the exception being entry-level plans. For instance, at 6.67 minutes per line, a prepaid plan offered by Slovenian MNO Telemach Mobil includes the fewest minutes of all plans in the database. This plan offers 20 units per month with a unit defined as one voice minute, one SMS, or 1 MB of data. The database assumes that a user distributes the available units equally over the three service types. Of the 90 US plans in the database, 77 include unlimited minutes thus aligning with the OECD trend of offering plans with unlimited voice calling.
Attribute Min Max Median Mean Std. Dev.
MRC per Line (USD, PPP) $0.68 $190.05 $24.03 $29.80 $20.13One-Time Fees (USD, PPP) $0.00 $44.71 $0.00 $1.83 $6.18SMS per Line 0 Unlimited Unlimited n/a n/aMinutes per Line 6.67 Unlimited Unlimited n/a n/aData per Line (GB) 0.0067 Unlimited 8.5 n/a n/aPlan Term (months) 0.1 24 1 7.1 9.2Urban Population (%) 53.8% 98.0% 80.1% 77.9% 11.5%GNI per Capita (USD) $8,940 $78,890 $38,310 $36,342 $19,186Download Speed (Mbps) 18.9 65.4 44.1 41.6 12.3Website Availability in Main Language 0.1% 54.0% 1.6% 11.1% 20.2%Surface Area (sq. km) 2,430 9,147,420 114,575 957,680 2,384,675English Proficiency Index (0-100) 47.2 100.0 62.8 67.7 16.74G Coverage (% pop.) 58.0% 100.0% 99.0% 95.4% 9.2%
16
There is a wide range in the quantity of data included in the plans. The aforementioned Slovenian plan includes the smallest data quantity of 6.67 MBs per month. Conversely, unlimited data plans are becoming increasingly common throughout the OECD. Of the 1,554 plans in the database, 168 (11 percent) offer unlimited data. The proportion is even larger in the United States where 36 of 90 plans (40 percent) include unlimited data. With a median term length of one month, the industry seems to have moved beyond the common term contract model. Reflecting this trend, the United States has an average term length of 1.2 months and 85 of 90 plans have a term of one month or less. In addition, at 65.4 Mbps, Norway leads the OECD in terms of average mobile wireless download speeds followed by Canada with 64.4 Mbps. Chile recorded the lowest download speeds at 18.9 Mbps. The US average download speed is 36.2 Mbps and is within one standard deviation from the mean. As indicated in Table 3, OECD countries differ widely with respect to urbanization. In Slovakia, only 54 percent of the population lives in urban areas. In contrast, 98 percent of Belgians live in urban areas. The United States has an urbanization rate of 82 percent and thus is close to the OECD mean of 77.9 percent. The large difference in urbanization, which most existing international price rankings ignore, can be expected to have a significant impact on retail prices. Further, network deployment costs are also affected by local labor rates. Again, the values for the OECD countries differ significantly. With an average GNI per capita of $8,940, Mexico represents the lowest income in the OECD, whereas Switzerland is the highest at $78,890. The United States has a GNI per capita of $59,160, which is near the upper end of the distribution and 1.2 standard deviations from the OECD mean of $36,342. This implies that the United States has more expensive labor rates than the OECD average. A country’s demand for mobile wireless data (or any broadband data for that matter) depends on the amount of online content available to its inhabitants. One way to measure this is the percentage of online content in a country’s most widely spoken language. However, 54 percent of online content is in English, so a measure of English proficiency in each country should also capture a major aspect of content availability.50 This study uses both types of metrics, which is consistent with other studies including the FCC’s. Understandably, the larger a country is the greater the capital investment requirements to build the geographic layer of the mobile wireless network. The largest country by land surface area (excluding water) among the countries considered here is the United States followed by Canada, potentially putting upward pressure on these countries due to their high capital requirements. The United States has a land surface area of 9.14 million square kilometers, whereas Canada has 9.09 million square kilometers. Finally, 4G coverage is likely to affect demand for services because users tend to demand more data if they are able to access it quickly in a wide service region. Belgium, Denmark, Poland, and
50 W3 Techs Web Technology Surveys, “Usage of content languages for websites,” August 2019, w3techs.com/technologies/overview/content_language/all.

17
Sweden have universal 4G coverage, whereas Mexico’s 58 percent coverage places it at the bottom of the OECD. The United States has 4G coverage of 99.8 percent. 6. Ranking Methodology
The study ranks countries using the following methodological steps. First, a hedonic regression model is fitted to the data based on the assumption that the price of mobile wireless service is affected by the plan, the network, and country attributes. Second, for each plan in the database, the estimated model can be used to predict the price that a provider of the same type would charge for the given plan. Third, the ratio of actual price to predicted price is calculated for each plan used in estimating the model. Fourth, the provider ratio is calculated using a simple average of the individual provider’s plan ratios. Fifth, the country ratio is calculated using a subscriber share weighted average for all providers in the country. Sixth, countries are ranked by their weighted average country ratios. The following example illustrates the methodology. 1. A US MNO offers a postpaid single-line plan with unlimited voice minutes and SMS
messages as well as 5 GBs of data for $40.00 with no term contract. 2. Predictions with a regression model estimated with data for the United States, Canada,
France, Germany, Italy, Japan, the UK (G7), and Australia imply a charge of $45.52 for the same US plan. This plan’s ratio is $40.00/$45.52 or 0.88. This plan ratio serves as an input to the MNO’s ratio.
3. For the given US MNO, simply averaging the plan ratios for all of that US MNO’s plans in
the database yields a provider ratio for that US MNO of 1.039. The provider ratio serves as an input to the US country ratio.
4. For the considered providers in the United States, calculating a weighted average of the
provider ratios (using weights equal to the provider shares of total subscribers) yields a country ratio for the United States of 0.976. This implies that relative to a peer group consisting of the G7 countries and Australia and after adjusting for the mobile value proposition, US mobile prices are on average 2.4 percent lower than the international benchmark.
5. Ranking the country ratios for all countries in the peer group reveals the United States as
offering the second highest value proposition relative to its G7 peers and Australia. Canada is in first place with a country ratio of 0.955. France ranks last in this peer group with a country ratio of 1.259.
It is important to note that each model uses a different set of observations and therefore has a different baseline value. Thus, countries may have different price ratios depending on the peer group that is used. The following discussion explains the hedonic regression model and the rankings of the United States relative to seven different peer groups.

18
6.1. The Fitted Model
A hedonic regression is a special type of regression model that assumes the price of a good is affected by product characteristics and external characteristics, which can be analyzed through regression analysis to produce a price prediction for any combination of these attributes.51 As the FCC discusses in its international price ranking study, the primary objective of a hedonic regression is not to understand what drives the value proposition but the model’s overall predictive power:
As such, in imperfectly competitive markets, hedonic coefficients should only be considered a reduced-form description of how prices (costs and markups) vary with changes in product characteristics and should not be given any interpretation beyond this. The focus should not be on the particular value or precision of any one coefficient, but rather on how predictive the hedonic pricing function is of provider prices in each country.52
Thus, the model’s explanatory power, as measured through the R-squared or the root mean square error, is more important than the significance and sign of the individual regression coefficients. The fitted model regresses the natural logarithm of the per-line sum of the MRC and a 24-month prorated portion of the activation fee (if any) on a set of independent variables that normalize for differences in provider type, plan attributes, network attributes, and country attributes. The country variables were selected from a large list of potential variables with the objective of obtaining the most precise price predictions. If multiple data sources exist for the same variable, the source that yielded the most accurate model was chosen. The final list of explanatory variables is summarized in Table 4.
51 See Sixth International Broadband Report for a general discussion of the hedonic regression model. 52 Ibid, Appendix C, ¶ 63 (footnotes omitted).

19
Table 4. List of Independent Variables
The models include dummy variables that indicate whether a variable is missing for a given country. Rather than dropping all countries for which a variable was missing, this solution sets the variable in question to zero and allows the model to calculate an average value for the missing variable. The model assumes that the countries with a missing country variable all would have had similar values had those values been observed. This allows the model to control for a systematic difference between countries with observed and unobserved values for the missing variable. Building a model using all 36 countries yields a heightened sensitivity to prediction error, raising concerns about the size of the forecast error and whether it can be too large to create a robust country ranking. To avoid this problem and consistent with the literature and the FCC’s international price comparison, this model was fitted to meaningful subsets of countries that can be compared more easily. Specifically, and borrowing from prior studies, this model was fitted to the following country subsets. Model 1 (G7+) fits the above model to the G7 countries plus Australia. This is the peer group used by the Canadian government and includes the United States, Australia, Canada, France, Germany, Italy, Japan, and the UK.53
53 See ISED, Request for Proposal, # 401706, Name of Project: 2018 Price Comparison Study of
Communications Services in Canada and Select Foreign Jurisdictions, February 8, 2018, p. 3.
Variable Description
mno_dummy Dummy to indicate provider type (1 if MNO, 0 if MVNO)lines_ln Log of lines included in plansms_per_line Monthly SMS allowance per linesmsperline_unlim Dummy to indicate unlimited SMSmins_per_line_ln Log of monthly minute allowance per lineminsperline_unlim Dummy to indicate unlimited minutesdata_per_line_ln Log of monthly data allowance per linedatagbperline_unlim Dummy to indicate unlimited dataworldbank_urbanpct Percentage of population in urban areas (World Bank)worldbank_gnipc17_atlas_ln Log of GNI per capita in USD using Atlas method (World Bank)ookla_mdspeed_ln Average mobile download speed in Mbps (Ookla)ookla_mdspeed_ln_m Dummy to indicate missing speed information (Ookla)w3_websites Percentage of websites in country's largest language (W3)w3_websites_m Dummy to indicate missing website information (W3)worldbank_surface18 Surface area in sq. km (World Bank)ef_english English proficiency index, 0-100 (EF)ef_english_m Dummy to indicate missing English proficiency information (EF)eiu_4g 4G coverage (Economist Intelligence Unit)eiu_4g_m Dummy to indicate missing 4G coverage information (Economist)

20
Model 2 (GDP) fits the above model to countries with similar GDP per capita to the United States. This yields a list comprising the United States, Australia, Austria, Denmark, Iceland, Ireland, Luxembourg, the Netherlands, Norway, and Switzerland. Model 3 (Density) fits the above model to countries with similar population densities to the United States. This yields a list comprising the United States, Chile, Estonia, Finland, Greece, Ireland, Latvia, Lithuania, Mexico, Spain, and Sweden. Model 4 (EU15++) fits the above model to the United States, Canada, and the EU15 countries under the hypothesis that these countries share important commonalities. The EU15 includes countries that joined the EU in 1995 or earlier and were not part of the Soviet bloc during the Cold War. This model is estimated with data for Austria, Belgium, Canada, Denmark, Finland, France, Germany, Greece, Ireland, Italy, Luxembourg, the Netherlands, Portugal, Spain, Sweden, the UK, and the United States. Model 5 (Business Index) fits the above model to countries with World Bank Business Index rankings similar to that of the United States. The index purports to measure the ease of doing business, regulatory quality, and other factors that comprise the business environment. This yields a list comprising the United States, Denmark, Estonia, Finland, Lithuania, New Zealand, Norway, Sweden, South Korea, and the UK. Model 6 (Ofcom) fits the above model to the countries included in Ofcom’s international ranking study. This list includes the United States, the UK, France, Germany, Italy, and Spain. Model 7 (Leading competitive regulatory regimes) fits the above model to the leading competitive regulatory regimes including the United States, Australia, Austria, Canada, Germany, Ireland, the Netherlands, New Zealand, and the UK. Every model uses the same regression variables, which is important because it allows for consistency. If a given set of variables explains price in the United States, the same list should apply to its hypothetical peer countries. Relatedly, applying the model to several subsets of countries allows the model to operate as a sensitivity test for all the others, thereby ensuring a robust result. As the results show, the United States ranks similarly highly in every model. 6.2. Ranking Results
Model 1: Benchmarking the United States against the G7 and Australia This first model benchmarks the United States’ value proposition against a peer group consisting of Australia and the member countries of the G7 (i.e., Canada, France, Italy, Japan, Germany, and the UK). This is the peer group that ISED Canada uses.54 As summarized in Appendix A, the model fits the data well with an R2 of 0.7244, implying that the model explains over 72 percent of the price fluctuations observed in the peer group. As shown in Table 5, the country with the highest value proposition in this peer group is Canada with a country ratio of 0.953, implying that prices in this country are some 4.7 percent lower than the average price that the peer group
54 See, e.g., Wall 2018.
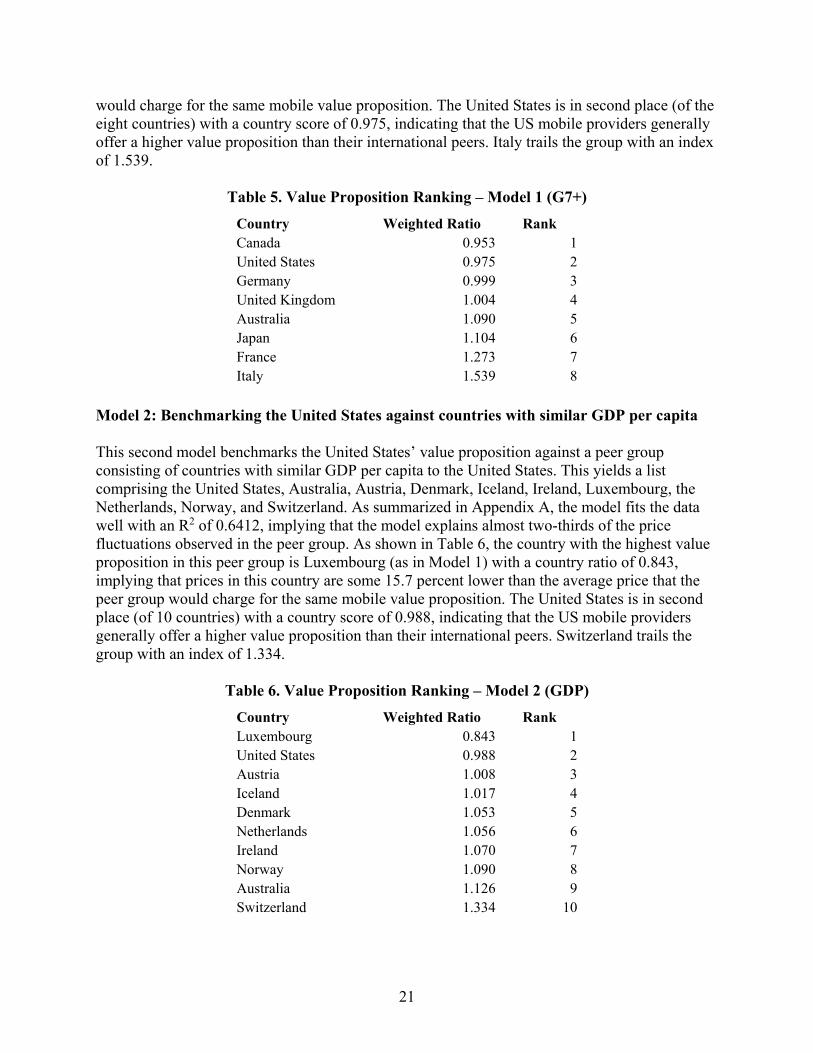
21
would charge for the same mobile value proposition. The United States is in second place (of the eight countries) with a country score of 0.975, indicating that the US mobile providers generally offer a higher value proposition than their international peers. Italy trails the group with an index of 1.539.
Table 5. Value Proposition Ranking – Model 1 (G7+)
Model 2: Benchmarking the United States against countries with similar GDP per capita This second model benchmarks the United States’ value proposition against a peer group consisting of countries with similar GDP per capita to the United States. This yields a list comprising the United States, Australia, Austria, Denmark, Iceland, Ireland, Luxembourg, the Netherlands, Norway, and Switzerland. As summarized in Appendix A, the model fits the data well with an R2 of 0.6412, implying that the model explains almost two-thirds of the price fluctuations observed in the peer group. As shown in Table 6, the country with the highest value proposition in this peer group is Luxembourg (as in Model 1) with a country ratio of 0.843, implying that prices in this country are some 15.7 percent lower than the average price that the peer group would charge for the same mobile value proposition. The United States is in second place (of 10 countries) with a country score of 0.988, indicating that the US mobile providers generally offer a higher value proposition than their international peers. Switzerland trails the group with an index of 1.334.
Table 6. Value Proposition Ranking – Model 2 (GDP)
Country Weighted Ratio RankCanada 0.953 1United States 0.975 2Germany 0.999 3United Kingdom 1.004 4Australia 1.090 5Japan 1.104 6France 1.273 7Italy 1.539 8
Country Weighted Ratio RankLuxembourg 0.843 1United States 0.988 2Austria 1.008 3Iceland 1.017 4Denmark 1.053 5Netherlands 1.056 6Ireland 1.070 7Norway 1.090 8Australia 1.126 9Switzerland 1.334 10

22
Model 3: Benchmarking the United States against countries with similar population densities
This third model benchmarks the United States’ value proposition against a peer group consisting of countries with similar population densities to the United States. This yields a list comprising the United States, Chile, Estonia, Finland, Greece, Ireland, Latvia, Lithuania, Mexico, Spain, and Sweden. As summarized in Appendix A, the model fits the data well with an R2 of 0.6881, implying that the model explains over two-thirds of the price fluctuations observed in the peer group. As shown in Table 7, the country with the highest value proposition in this peer group is Latvia with a country ratio of 0.923, implying that prices in this country are some 7.7 percent lower than the average price that the peer group would charge for the same mobile value proposition. The United States is in third place (of 11 countries) with a country score of 0.974, indicating that the US mobile providers generally offer a higher value proposition than their international peers. Mexico trails the group with an index of 1.251.
Table 7. Value Proposition Ranking – Model 3 (Density)
Model 4: Benchmarking the United States against the EU15 and Canada This fourth model benchmarks the United States’ value proposition against a peer group consisting of Canada and the member countries of the EU15 (i.e., Austria, Belgium, Denmark, Finland, France, Germany, Greece, Ireland, Italy, Luxembourg, the Netherlands, Portugal, Spain, Sweden, and the UK). As summarized in Appendix A, the model fits the data well with an R2 of 0.6677, implying that the model explains over two-thirds of the price fluctuations observed in the peer group. As shown in Table 8, the country with the highest value proposition in this peer group is Luxembourg with a country ratio of 0.742, implying that prices in this country are some 26 percent lower than the average price that the peer group would charge for the same mobile wireless value proposition. The United States is in fifth place (of 17) with a country score of 0.977, indicating that the US mobile providers generally offer a higher value proposition than their international peers. Greece trails the group with an index of 1.516.
Country Weighted Ratio RankLatvia 0.923 1Lithuania 0.924 2United States 0.974 3Chile 0.982 4Estonia 0.993 5Ireland 1.034 6Spain 1.040 7Sweden 1.088 8Finland 1.153 9Greece 1.236 10Mexico 1.251 11
23
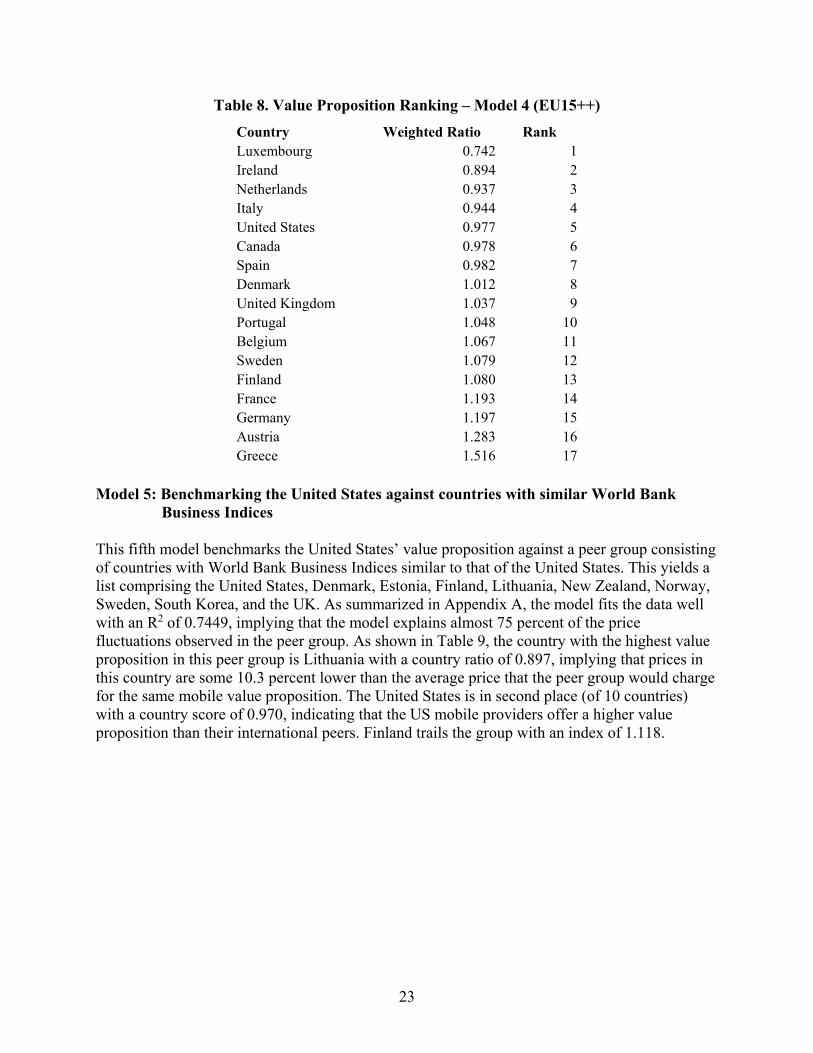
Table 8. Value Proposition Ranking – Model 4 (EU15++)
Model 5: Benchmarking the United States against countries with similar World Bank
Business Indices This fifth model benchmarks the United States’ value proposition against a peer group consisting of countries with World Bank Business Indices similar to that of the United States. This yields a list comprising the United States, Denmark, Estonia, Finland, Lithuania, New Zealand, Norway, Sweden, South Korea, and the UK. As summarized in Appendix A, the model fits the data well with an R2 of 0.7449, implying that the model explains almost 75 percent of the price fluctuations observed in the peer group. As shown in Table 9, the country with the highest value proposition in this peer group is Lithuania with a country ratio of 0.897, implying that prices in this country are some 10.3 percent lower than the average price that the peer group would charge for the same mobile value proposition. The United States is in second place (of 10 countries) with a country score of 0.970, indicating that the US mobile providers offer a higher value proposition than their international peers. Finland trails the group with an index of 1.118.
Country Weighted Ratio RankLuxembourg 0.742 1Ireland 0.894 2Netherlands 0.937 3Italy 0.944 4United States 0.977 5Canada 0.978 6Spain 0.982 7Denmark 1.012 8United Kingdom 1.037 9Portugal 1.048 10Belgium 1.067 11Sweden 1.079 12Finland 1.080 13France 1.193 14Germany 1.197 15Austria 1.283 16Greece 1.516 17
24
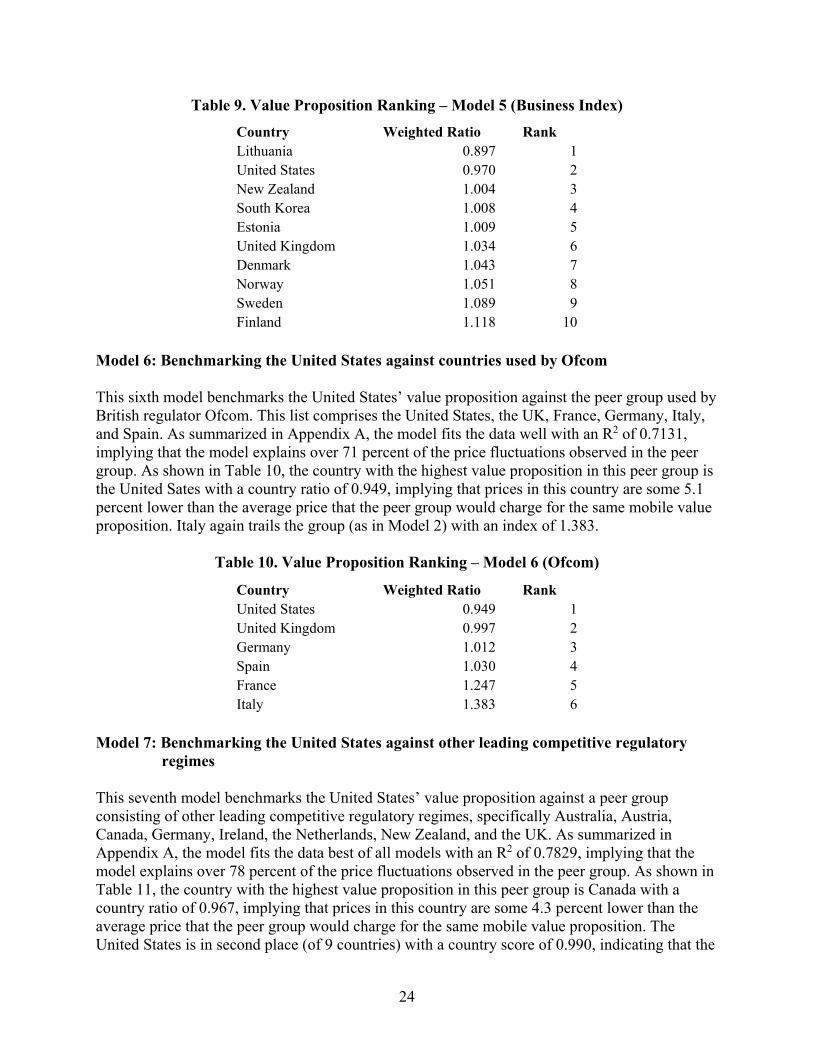
Table 9. Value Proposition Ranking – Model 5 (Business Index)
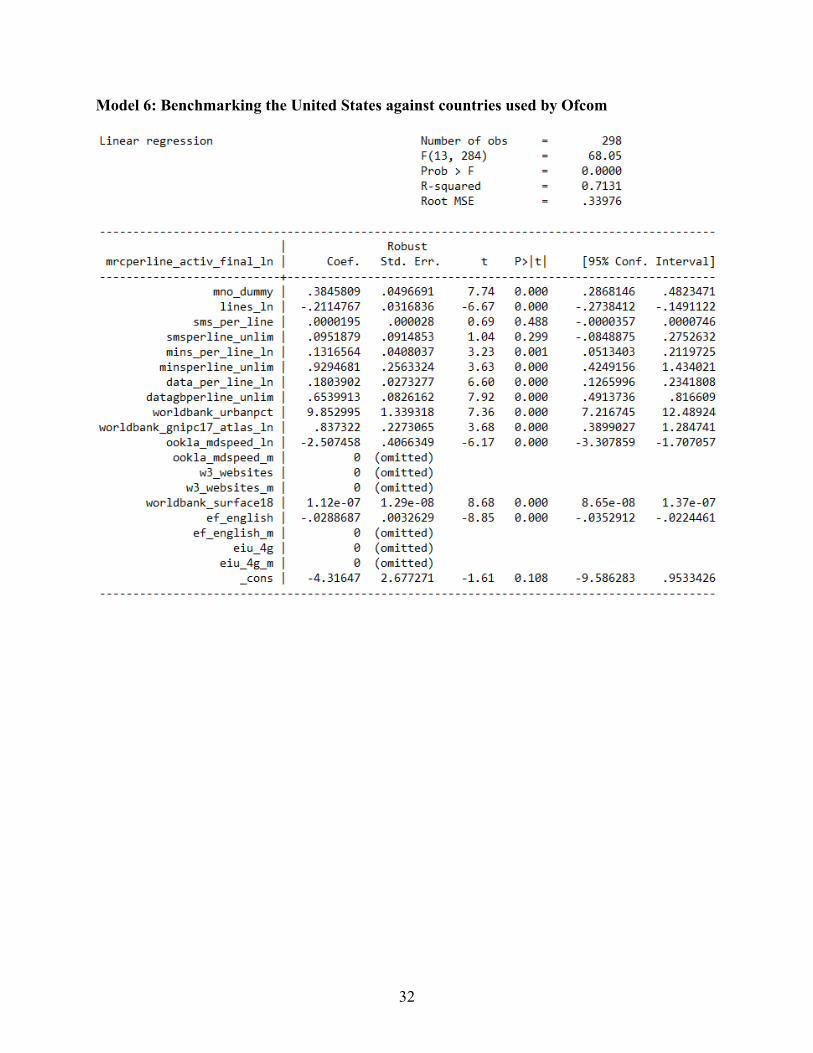
Model 6: Benchmarking the United States against countries used by Ofcom This sixth model benchmarks the United States’ value proposition against the peer group used by British regulator Ofcom. This list comprises the United States, the UK, France, Germany, Italy, and Spain. As summarized in Appendix A, the model fits the data well with an R2 of 0.7131, implying that the model explains over 71 percent of the price fluctuations observed in the peer group. As shown in Table 10, the country with the highest value proposition in this peer group is the United Sates with a country ratio of 0.949, implying that prices in this country are some 5.1 percent lower than the average price that the peer group would charge for the same mobile value proposition. Italy again trails the group (as in Model 2) with an index of 1.383.
Table 10. Value Proposition Ranking – Model 6 (Ofcom)
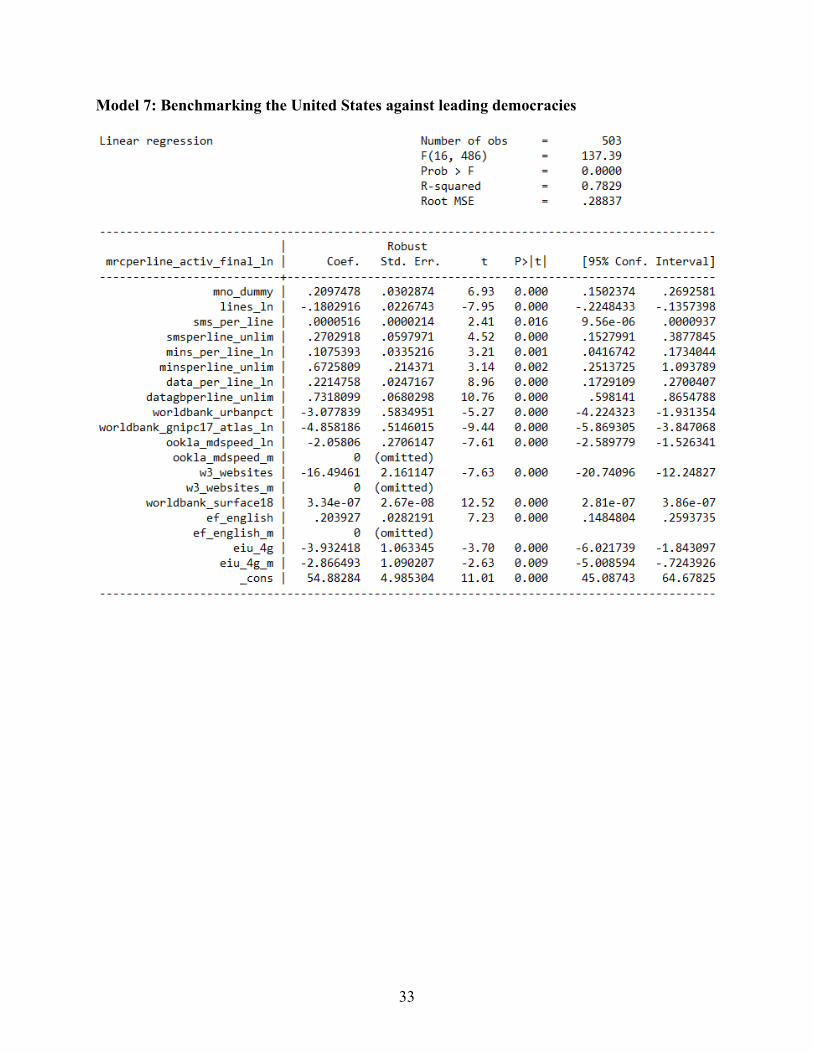
Model 7: Benchmarking the United States against other leading competitive regulatory
regimes This seventh model benchmarks the United States’ value proposition against a peer group consisting of other leading competitive regulatory regimes, specifically Australia, Austria, Canada, Germany, Ireland, the Netherlands, New Zealand, and the UK. As summarized in Appendix A, the model fits the data best of all models with an R2 of 0.7829, implying that the model explains over 78 percent of the price fluctuations observed in the peer group. As shown in Table 11, the country with the highest value proposition in this peer group is Canada with a country ratio of 0.967, implying that prices in this country are some 4.3 percent lower than the average price that the peer group would charge for the same mobile value proposition. The United States is in second place (of 9 countries) with a country score of 0.990, indicating that the
Country Weighted Ratio RankLithuania 0.897 1United States 0.970 2New Zealand 1.004 3South Korea 1.008 4Estonia 1.009 5United Kingdom 1.034 6Denmark 1.043 7Norway 1.051 8Sweden 1.089 9Finland 1.118 10
Country Weighted Ratio RankUnited States 0.949 1United Kingdom 0.997 2Germany 1.012 3Spain 1.030 4France 1.247 5Italy 1.383 6

25
US mobile providers generally offer a higher value proposition than their international peers. Australia trails the group with an index of 1.125.
Table 11. Value Proposition Ranking – Model 7 (Leading Democracies)
7. CONCLUSIONS
Benchmarking the value proposition of the United States against seven different peer groups yields remarkably robust results. More important, the United States’ country scores are below one in all seven models, implying that the country’s mobile wireless value proposition consistently outperforms the international average. In fact, as summarized in Table 12, the United States leads its peers relative to the countries used by Ofcom (i.e., the UK, France, Germany, Italy, and Spain) and is in second position relative to three peer groups (i.e., G7 + Australia, countries with similar GDPs, and leading competitive regulatory regimes).
Table 12. Examining the US Mobile Wireless Value Proposition
An overall combined score can allow for an easily understandable overview of the results. If points were assigned to each country that it outranked in the seven models, the United States would have a raw score of 54 points. Having faced 64 countries, this implies that the United States outranked 84 percent of its pairwise comparisons. Table 13 ranks all countries in the seven models by the percentage of countries that each country outranked. To ensure the robustness of the results, only countries that were ranked in three or more models are included in this ranking.
Country Weighted Ratio RankCanada 0.967 1United States 0.990 2Germany 1.003 3Austria 1.017 4New Zealand 1.021 5United Kingdom 1.039 6Ireland 1.057 7Netherlands 1.070 8Australia 1.125 9
Model US Rank Out of
1. G7 & Australia 2 82. GDP Per Capita 2 103. Population Density 3 114. EU15 & Canada 5 175. Business Index 2 106. Ofcom Countries 1 67. Leading Democracies 2 9

26
Table 13. Selected OECD Ranking by Countries Surpassed
This final ranking indicates that the United States leads the OECD countries with its mobile wireless value proposition followed by Canada and Ireland. France, Finland, and Australia offer a lower mobile wireless value proposition relative to the other countries.
Country
United States 54 64 84.4% 1Canada 26 31 83.9% 2Ireland 25 43 58.1% 3Netherlands 19 33 57.6% 4Spain 16 31 51.6% 5United Kingdom 23 45 51.1% 6Denmark 17 34 50.0% 7Italy 13 28 46.4% 8Germany 16 36 44.4% 9Austria 13 33 39.4% 10Sweden 9 35 25.7% 11France 5 28 17.9% 12Finland 6 35 17.1% 13Australia 4 24 16.7% 14
Total Countries Surpassed
Total Countries Compared
Percent Surpassed Rank

27
APPENDIX A: REGRESSION DETAILS
Model 1: Benchmarking the United States against the G7 & Australia

28
Model 2: Benchmarking the United States against countries with similar GDP per capita

29
Model 3: Benchmarking the United States against countries with similar population densities

30
Model 4: Benchmarking the United States against the EU15 & Canada

31
Model 5: Benchmarking the United States against countries with similar World Bank Business Indices
32
Model 6: Benchmarking the United States against countries used by Ofcom
33
Model 7: Benchmarking the United States against leading democracies

![15-744: Computer Networking L-19 Wireless. Wireless Intro TCP on wireless links Wireless MAC Assigned reading [BPSK97] A Comparison of Mechanism for Improving.](https://static.fdocuments.us/doc/165x107/56649de55503460f94adc765/15-744-computer-networking-l-19-wireless-wireless-intro-tcp-on-wireless-links.jpg)

![Design and Comparison Wireless Power Transfer … — Magnetically ... phones [4]-[7], and mobile laptop charging [8], [9]. ... Design and Comparison Wireless Power Transfer Base on](https://static.fdocuments.us/doc/165x107/5ab660ff7f8b9a6e1c8d9cc7/design-and-comparison-wireless-power-transfer-magnetically-phones-4-7.jpg)


![CS 268: Computer Networking L-10 Wireless. Wireless Intro TCP on wireless links Wireless MAC Assigned reading [BPSK97] A Comparison of Mechanism for Improving.](https://static.fdocuments.us/doc/165x107/5697bf841a28abf838c86b1d/cs-268-computer-networking-l-10-wireless-wireless-intro-tcp-on-wireless-links.jpg)