A comparison of the effects glucose and fructose have on ... · PDF fileA comparison of the...
24
1 A comparison of the effects glucose and fructose have on the growth rate of activated sludge in an activated sludge process. Name: Kristoffer Alexander Krogerus School: Mattlidens Gymnasium Country: Finland
-
Upload
phungnguyet -
Category
Documents
-
view
217 -
download
1
Transcript of A comparison of the effects glucose and fructose have on ... · PDF fileA comparison of the...

1
A comparison of the effects glucose and fructose have on the growth rate of activated sludge in an activated sludge process.
Name: Kristoffer Alexander Krogerus School: Mattlidens Gymnasium
Country: Finland

2
Abstract
I decided to make my investigation in the area of wastewater treatment, as wastewater
and pollution has become a growing problem globally. I wanted to study biological
wastewater treatment, and this led me to the activated sludge process. I was sceptical
at first about the effectiveness of the process, which led me to my research question:
Will the growth rate of activated sludge in an activated sludge process differ
depending on whether glucose or fructose is given to it as BOD, and which
monosaccharide will increase the growth rate more?
I decided to compare the effects fructose and glucose have on the activated sludge
process and my final objective was to calculate the growth rates of activated sludge
fed by glucose and fed by fructose. I had to design a method using the change of
substrate concentration in the tank as a basis, i.e. the amount of fructose and glucose
consumed by the sludge, because through research I found an expression for the
growth rate dependent on the susbstrate concentration, Monod’s equation. I scanned
through various methods of measuring the substrate concentration in water, and using
the density turned out to be the simplest and cheapest. I then used the change of
substrate concentration in Monod’s equation to receive a calculated value for the
growth rate, and to derive at my conclusion: The growth rate of activated sludge in an
activated sludge process differs whether fructose or glucose is given to it as BOD, and
glucose will increase the growth rate more. Thus I was able to show to myself that the
process really works, and that the effectiveness of the process depends on the
substances that are to be oxidised (i.e. broken down).

3
Table of Contents
Abstract ..........................................................................................................................1
Table of Contents...........................................................................................................3
Introduction....................................................................................................................4
An outline of the Activated Sludge Process ..................................................................4
Simple carbohydrate metabolism in micro-organisms ..................................................6
Planning A .....................................................................................................................8
Research Question: ....................................................................................................8
Hypothesis: ................................................................................................................8
Variables: ...................................................................................................................8
Material Used:............................................................................................................9
Method: ....................................................................................................................10
Observation Log and Data Collection..........................................................................12
Observation Log and Data Collection..........................................................................12
Data Processing and Presentation ................................................................................14
Conclusion and Evaluation ..........................................................................................22
Errors and Suggestions of Improvement..................................................................22
Bibliography ................................................................................................................24

4
Introduction
As all living organisms depend on water as a key requirement of survival, it makes the
preservation of the water quality important. Factors negatively affecting the quality of
the water found in nature include the wastewater produced by public sewage,
industries, and during agricultural and urban runoffs (due to precipitation).1 Among
the defects this pollution brings is that it helps breed bacteria and other perhaps
harmful micro-organisms, as a consequence of the substances in the pollution, which
give nutrients and energy to micro-organisms, and it can bring poisonous substances
into the water, which can threaten the surrounding ecosystem and its members. This
has led to the fact that many new techniques of treating water has arisen, including the
biological wastewater treatment method called the Activated Sludge Process. Other
techniques exist in different areas (chemical), but the benefits of the Activated Sludge
Process include that it is the only process that effectively removes substances which
put a biological oxygen demand, i.e. micro-organisms will strive to break down these
substances, which requires oxygen. Therefore I decided to make my investigation in
the Activated Sludge Process, and my research question is: Will the growth rate of
activated sludge in an activated sludge process differ depending on whether glucose
or fructose is given to it as BOD, and which monosaccharide will increase the growth
rate more?
An outline of the Activated Sludge Process
1 Eckenfelder Jr., Wesley, 1980:1
5
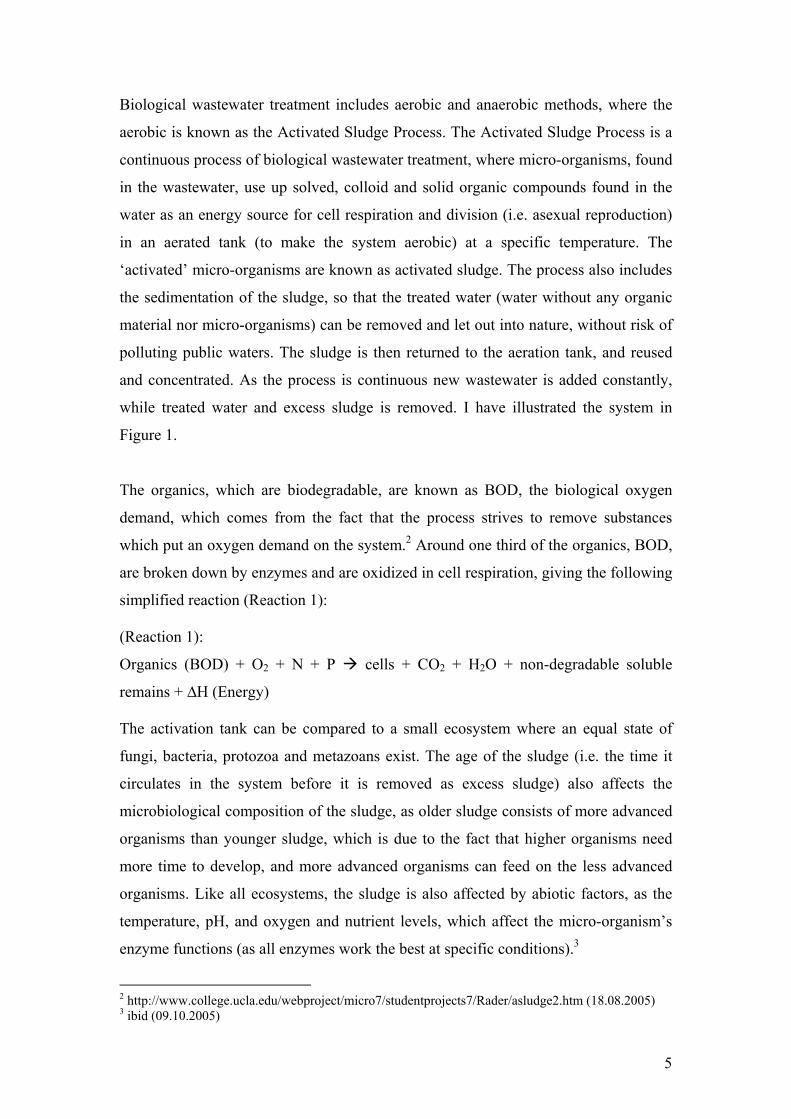
Biological wastewater treatment includes aerobic and anaerobic methods, where the
aerobic is known as the Activated Sludge Process. The Activated Sludge Process is a
continuous process of biological wastewater treatment, where micro-organisms, found
in the wastewater, use up solved, colloid and solid organic compounds found in the
water as an energy source for cell respiration and division (i.e. asexual reproduction)
in an aerated tank (to make the system aerobic) at a specific temperature. The
‘activated’ micro-organisms are known as activated sludge. The process also includes
the sedimentation of the sludge, so that the treated water (water without any organic
material nor micro-organisms) can be removed and let out into nature, without risk of
polluting public waters. The sludge is then returned to the aeration tank, and reused
and concentrated. As the process is continuous new wastewater is added constantly,
while treated water and excess sludge is removed. I have illustrated the system in
Figure 1.
The organics, which are biodegradable, are known as BOD, the biological oxygen
demand, which comes from the fact that the process strives to remove substances
which put an oxygen demand on the system.2 Around one third of the organics, BOD,
are broken down by enzymes and are oxidized in cell respiration, giving the following
simplified reaction (Reaction 1): (Reaction 1):
Organics (BOD) + O2 + N + P cells + CO2 + H2O + non-degradable soluble
remains + ∆H (Energy) The activation tank can be compared to a small ecosystem where an equal state of
fungi, bacteria, protozoa and metazoans exist. The age of the sludge (i.e. the time it
circulates in the system before it is removed as excess sludge) also affects the
microbiological composition of the sludge, as older sludge consists of more advanced
organisms than younger sludge, which is due to the fact that higher organisms need
more time to develop, and more advanced organisms can feed on the less advanced
organisms. Like all ecosystems, the sludge is also affected by abiotic factors, as the
temperature, pH, and oxygen and nutrient levels, which affect the micro-organism’s
enzyme functions (as all enzymes work the best at specific conditions).3
2 http://www.college.ucla.edu/webproject/micro7/studentprojects7/Rader/asludge2.htm (18.08.2005) 3 ibid (09.10.2005)
6
Simple carbohydrate metabolism in micro-organisms
The biological oxidation of organic compounds into ATP molecules (used as energy)
and other simpler organic compounds by bacteria for use in biosynthetic4 and
assimilatory5 reactions is known as heterotrophic metabolism, and starts with the
process of glycolysis.6
The process of glycolysis7, carried out by prokaryotes and eukaryotes, can take
several pathways in converting monosaccharides into energy. These pathways include
the one common in cyanobacteria and eukaryotes, the Embden-Meyerhof pathway,
and the bacteria specific pentose phosphate pathway and Entner-Doudoroff pathway.8
The oxidation of glucose in the Embden-Meyerhof pathway takes place in the
following way:9,10
Glucose reacts with ATP to form Glucose-6-phosphate and ADP under the presence
of the enzymes Hexokinase and Glucokinase. Glucose-6-phospate is then converted
into Fructose-6-phospate with the enzyme Phosphohexose Isomerase. Fructose-6-
phosphate again reacts with ATP in the presence of the enzyme Phosphofructokinase-
1, to form ADP and Fructose-1,6-bisphosphate. Fructose-1,6-bisphosphate is then
hydrolysed with the help of Aldolase to form Glyceraldehyde-3-phosphate (G3P) and
Dihydroxyacetone Phosphate (DHAP), which both are molecules containing of 3
carbon atoms (the original glucose molecule containing 6). DHAP can then be
catalysed by Triose Phosphate Isomerase into G3P (and vice versa), as DHAP and
G3P exist in equilibrium. The following steps are repeated once per G3P molecule
produced in the previous step: G3P reacts with NAD+, H- and P to give NADH, H+
and 1,3-Bisphosphoglycerate, catalysed by the enzyme Glyceraldehyde-3-phosphate
Dehydrogenase. 1,3-Bisphosphoglycerate then reacts with ADP to form 3-
Phosphoglycerate and ATP, catalysed by Phosphoglycerate Kinase. 3-
Phosphoglycerate is then transformed into 2-Phosphoglycerate under the presence of
4 A reaction producing a chemical compound by a living organism 5 A reaction which adds elements to the organisms biomass 6 http://gsbs.utmb.edu/microbook/ch004.htm (20.08.2005) 7 The conversion of monosaccharides into pyruvate 8 http://gsbs.utmb.edu/microbook/ch004.htm (20.08.2005) 9 http://web.indstate.edu/thcme/mwking/glycolysis.html (04.09.2005) 10 Green: Carbohydrate backbone. Blue: Enzyme. Dark Red: Energy-related or waste substance.

7
Phosphoglycerate Mutase. 2-Phosphoglycerate is transformed into
Phosphoenolpyruvate by the enzyme Enolase. Phosphoenolpyruvate then reacts with
ADP to form Pyruvate and ATP, catalysed by Pyruvate Kinase, giving the following
combined reaction (Reaction 2): (Reaction 2):
Glucose + 2 ADP + 2 NAD+ + 2 P -----> 2 Pyruvate + 2 ATP + 2 NADH + 2 H+
The oxidation of fructose takes place in a similar way, where fructose reacts in the
following way to produce G3P (see oxidation of glucose), from where the pathway
follows the same steps as glucose’s pathway:11,12
Fructose reacts with ATP under the presence of Fructokinase to form Fructose-1-
Phosphate and ADP. Fructose-1-Phosphate is then split into Glyceraldehyde and
DHAP with the help of Fructose-1-P Aldolase. Glyceraldehyde then reacts with ATP
to form G3P and ADP, catalysed by Triose Kinase, while DHAP is transformed into
G3P with the help of Triose Phosphate Isomerase. G3P then enters the glucose
pathway.
Through glycolysis micro-organisms are able to convert 1 mole glucose, as well as 1
mole fructose, into 2 moles of ATP, 2 moles of NADH and 2 moles Pyruvate. The 2
moles of NADH can be further synthesized in Oxidative Phosphorylation to produce
either 4 or 6 moles ATP, while the 2 moles of Pyruvate can be oxidized through the
TCA cycle to form a further 30 moles of ATP. Therefore the total ATP yield of the
oxidation of 1 mole glucose or fructose is 36 or 38 moles of ATP.13
Before reproduction the micro-organism’s cell increases slightly in size, leading to an
increase in respiration and use of organics. This means that growth rate of micro-
organisms is affected by the amount of substrates it can absorb and convert into
energy.
11 Green: Carbohydrate backbone. Blue: Enzyme. Dark Red: Energy-related or waste substance. 12 http://web.indstate.edu/thcme/mwking/non-glucose-sugar-metabolism.html (04.09.2005) 13 http://web.indstate.edu/thcme/mwking/glycolysis.html (04.09.2005)

8
Planning
My experiment consisted of two parts, whereas the first was to simulate the activated
sludge process used in wastewater plants to maintain the growth of activated sludge,
needed and researched during the experiment. The second part consisted of the
methods needed to answer the research question, which included the measuring of
sludge’s monosaccharides consumption, and investigating the change of biomass.
Research Question: Will the growth rate of activated sludge in an activated sludge process differ
depending on whether glucose or fructose is given to it as BOD, and which
monosaccharide will increase the growth rate more?
Hypothesis: Both prokaryotic (e.g. bacteria) and eukaryotic (e.g. protozoa) organisms carry out the
oxidation of organic compounds to pyruvate through glycolysis, which means that
glucose and fructose should both affect the growth rate of the sludge, as they both are
carbohydrates, and are both oxidized in the process of glycolysis. As reproduction and
living require energy, the oxidation of fructose and glucose should both affect the
growth rate, while fructose has less ‘steps’ in its oxidative pathway than glucose, and
has a less complex pathway, which would mean the conversion of fructose to
pyruvate is faster than the conversion of glucose to pyruvate. My hypothesis is hence
that the growth rate of activated sludge will differ depending on whether fructose or
glucose is given to it, and that fructose will increase the growth rate more than
glucose.
Variables: Independent: The monosaccharide used as BOD. In the experiment fructose and
glucose are used.
Dependent: The measured growth rate of the micro-organisms found in the activated
sludge.
9
Controlled:
• The daily addition of BOD into both tanks is kept equal for both tanks, making
the measurement of the growth rate more accurately. This is achieved by
giving an equal amount of fructose and glucose (in mass14) to the tanks.
• The volume of both tanks is equal, 1.5 liters, along with the volume of water
inside the tanks, 1.2 liters. The source of water of both tanks is the same, so
that the environment affects the sludge in the same way, giving a more
accurate answer to the research question.
• The aeration of both tanks is also kept the same, by dividing the cable from the
pump with a Y-piece, into two cables, each placed into the two tanks, giving
equal aeration.
• The amount of living organisms in both samples are attempted to being kept at
the same level and of the same species. The organisms in both tanks are
originally from the same ecosystem/tank (used when establishing the activated
sludge from the mud collected from the lake bed) and was split equally by
mass to the two new tanks.
• The amount of nutrients (hen faeces) given to both samples in mass is also the
same, to make sure that the growth rate will be affected equally by the
nutrients, as a difference in nutrients given can affect the growth rate
differently.
Material Used:
Tools:
• 2 Cylinders, with a volume of 1.5 liters, used as aeration tanks in the
simulation of the activated sludge process. One tank was used per
monosaccharide.
• Aquarium Pump, used to oxidise the water, by pumping air through it. The
same pump is used for both cylinders with a Y-cable.
• Litre Measure, for use in removal and addition of water to the system.
14 Both compounds have the same molecular mass, samples of the same mass contain equal amounts of glucose and fructose

10
• Light Microscope, made by Motic, magnification 40-400x, to look for life in
the sludge.
• 8 plastic bottles, with a volume of 100 ml, for storing of samples.
• 50 ml burette, to use in density measurement.
• Analytical Scales, to use in density measurement and sample weighing.
• Beakers, volumes of 250 ml, for use as containers.
Substances:
• Mud and Water collected from the lake bed of Myllylampi, a small
oligotrophic lake in the area of Lohja in southern Finland, 200 meters from
Lohjanjärvi, the greatest lake in the area. This is used to start of sludge growth.
• Sucrose, used as simulated BOD during experiment.
• Glucose, used as simulated BOD during experiment.
• Fructose, used as simulated BOD during experiment.
• Hen faeces, given as nutrients.
Method:
The process was initiated by collecting the mud from the lake bed. This was
then placed into a 1.5 liter tank, and water was added until the volume of the
contents was 1.2 liters. The aquarium pump cable was then placed into the
tank, with the cable-end at the bottom of the tank. As an initial BOD addition,
1 teaspoon (tsp) of sucrose was added to the process, together with one pellet
of hen faeces for the necessary minerals and nutrients.
Each day during a 4 week period, the aeration pumps were removed, thus
stopping the air flow, and the water circulation. This led to the sedimentation
of the sludge, making it possible to exchange approx. 1 liter of water (to add
new natural nutrients). After the water was changed sucrose was added
(between 0.5-2 tsps per day) and along with one pellet of hen faeces.
The activated sludge was split into two equal parts, and added to the two
cylinders, equal in volume. Water is added to both tanks until the aqueous
volume is 1.2 liters. The aeration pump is connected to both tanks, having the
pump as a common source, using a Y-piece to divide the air cable.

11
To determine the growth rate of the activated sludge, Monod’s Equation is
used (which uses the change in BOD concentration to calculate the growth
rate), as well as a physically observing the change in volume of the sludge in
both tanks.
A sample (50 ml) is taken from both tanks, and added to a plastic bottle
(samples are to be used later for density measurements). After this fructose is
added to the first tank and glucose to the other tank (1g in each tank during
Sample 1 (S1), 2g during Sample 2 (S2), and 3g during Sample 3 (S3)). The
sugar is let to dissolve, and a sample from both tanks is taken and added to an
empty plastic bottle (used for density measurement). The sludge is then left to
consume and react with the sugar for 1 hour and 10 hours. After 1 hour and 10
hours new samples are taken from both tanks, and added to empty bottles (for
density measurement), adding up to a total of 4 samples per tank per S1-S3.
The previous step is repeated once per sugar sample (S1-S3).
Due to a systematic error15 I discovered in the burette a fourth sample (S4) had
to be taken with new equipment and careful measuring to ensure accurate
results.
Density Measurement: A sample is added to a burette. The initial volume is
recorded. Approximately 10 ml is poured from the burette into a beaker on an
analytical scale, with the beaker’s weight tared to zero weight. After the water
has been dropped into the beaker, the exact change of volume is read off the
burette and the mass of the sample is read off the scales, and recorded. The
density is calculated by dividing the mass with the volume. The samples’
densities are then compared with standard measurements, where I have
measured the density of samples of water containing fructose and glucose in
different16 concentrations.
Finally the physical change of sludge was noted, i.e. the increase/decrease in
volume of the sludge between the days S1 and S4 was taken.
Constantly any observations are observed in a log.
15 Described on page 14. 16 0.1-1.0 g/L with 0.1 g/L intervals, and 1.0-2.5 g/L with 0.5 g/L intervals

12
Observation Log and Data Collection
Week 1 (10.7-16.7):
I started the Activated Sludge Process by gathering water from the lake bed of
Myllylampi, by stirring around in the muddy bed, and collecting 0.5 L water in a
bottle. I added the water to the aeration tank, and added tap water until a total volume
of 1.2 L is reached. Color is brownish-grey. A strong smell of decay, as a result of
anaerobic conditions in the lake. During sedimentation some bubbles rise from sludge
to surface, as methane is released (as a result of anaerobic conditions).
Week 2 (17.7-23.7):
During week 2 the amount of daily sugar added to the sludge tank is increased, which
has led to an increase of methane produced, as the oxygen pumps can not pump
enough oxygen as is needed by the aerobic cell respiration reactions, therefore
methane is produced and most of the sludge floats on the surface. The smell is
stronger now.
Week 3 (24.7-30.7):
During this week the sugar addition is decreased with around a third, which led to the
fact that in the end of the week all sludge had sunk again, and almost no smell was
present, as a result of complete aerobic respiration.
Week 4 (31.7-6.8):
Appearance is similar to that of Week 3, but no smell.
Week 5 (7.8-13.8):
During a microscope observation of 35-day-old sludge, I looked at some samples of
the sludge to search for any organisms, and life could be noted through moving
Difflugia and Paramecium, while the pH of the activated sludge was measured to be
6.17
Week 6-8 (14.8-3.9):
Appearance similar to that of previous week. Sludge is prepared for analysis.
Week 9 (4.9-10.9):
For the trials (S1-S3), I took 8 samples in total, 4 samples from each sugar, the first
being before addition, the second directly after the addition, the third 1 hour after
17 Micro-organisms identified with the help of ’Planktonopas’ Suomen Kalastusyhdistys n:o 34, by Järnefelt, Naulapää and Tikkanen and Knuffa För Limnologi by B. Andersson, M. Bengtsson, T. Elmqvist, O. Nordell, and L. Westin.

13
Table 1 - Data from Density Measurement of Sample 1, initially containing 1g sugar / 1.2 L (0.83 g/L)Volumes in ml, +/-0.05ml FructoseMasses in g, +/-0.001g Standard Sample Directly After S. A. 1 Hour After S.A. 10 Hours After S.A.Initial Volume 9.8 11.05 12.75 13.45
Change in Volume 10.0 10.35 9.55 10.05Change of Mass 9.657 10.162 9.544 9.983
Change in Volume 10.0 10.1 9.65 9.5Change of Mass 10.035 10.080 9.630 9.540
Change in Volume 13.1 - - 10.0Change of Mass 13.099 - - 9.968
GlucoseStandard Sample Directly After S. A. 1 Hour After S.A. 10 Hours After S.A.
Initial Volume 9.85 14.0 13.25 11.75
Change in Volume 10.05 9.85 10.1 9.8Change of Mass 9.703 9.782 10.039 9.755
Change in Volume 9.9 9.45 9.65 9.95Change of Mass 9.862 9.389 9.631 9.952
Change in Volume - 9.75 - 9.45Change of Mass - 9.772 - 9.286
addition, and the fourth 10 hours after the addition of the respective sugars, fructose
and glucose. The data from the density measurement of Sample 1 (S1) is found in
Table 1.18 Each sample’s density was measured 2 or 3 times, depending on the
preciseness of the result. The data from the density measurement of Sample 2 (S2) is
found in Table 2 and Sample 3 (S3) in Table 3.
Week 10-13 (11.9-7.10):
After samples S1-3 were taken a systematic error was found in the burette, as air was
collected in the bottom, and affecting the volume of water let out, and therefore the
results, which can’t be found reliable, and as seen in the Data Processing and
Presentation section won’t give any results. Therefore a fourth S4 (2.5g / 1.2 L)
sample was made with a new burette, and carried out with great caution to ensure as
accurate results as possible were gained. These are displayed in Table 4.
A new microscope investigation is carried out, and filamentous bacteria are spotted
(Figure 6-7), and often imply that the system lacks oxygen, nutrients, or
carbohydrates. The data from the density measurement of water with different
concentrations of fructose and glucose are found in Table 5.
As the process was finished the volume of the sludge was compared visually in both
tanks, and the volume of the glucose sludge was slightly greater (0.5 cm more) than
the fructose sludge.
18 S.A. refers to ‘Sugar Addition’, and will be used for the rest of the document

14
Table 2 - Data from Density Measurement of Sample 2, initially containing 2g sugar / 1.2 L (1.67 g/L)Volumes in ml, +/-0.05ml FructoseMasses in g, +/-0.001g Standard Sample Directly After S. A. 1 Hour After S.A. 10 Hours After S.A.Initial Volume 19.8 18.5 17.9 18.1
Change in Volume 9.9 10.1 10.0 10.0Change of Mass 9.850 10.114 9.998 10.053
Change in Volume 10.15 10.0 10.1 10.0Change of Mass 10.149 9.960 10.105 10.034
Change in Volume 9.9 10.1 10.15 11.1Change of Mass 9.944 10.149 10.144 11.148
GlucoseStandard Sample Directly After S. A. 1 Hour After S.A. 10 Hours After S.A.
Initial Volume 18.5 17.7 17.2 18.9
Change in Volume 10.2 10.0 10.0 10.0Change of Mass 10.131 9.985 9.863 9.896
Change in Volume 9.9 10.0 10.0 10.1Change of Mass 9.930 9.996 9.957 10.166
Change in Volume 10.0 10.1 10.0 10.15Change of Mass 10.032 10.180 10.036 10.178
Table 3 - Data from Density Measurement of Sample 3, initially containing 3g sugar / 1.2 L (2.5 g/L)Volumes in ml, +/-0.05ml FructoseMasses in g, +/-0.001g Standard Sample Directly After S. A. 1 Hour After S.A. 10 Hours After S.A.Initial Volume 18.5 18.5 19.8 19.4
Change in Volume 10.0 9.95 10.0 10.1Change of Mass 10.002 9.913 9.980 10.137
Change in Volume 10.0 10.1 10.15 10.05Change of Mass 10.067 10.132 10.212 10.080
Change in Volume 10.0 10.1 10.0 10.45Change of Mass 10.075 10.169 10.055 10.536
GlucoseStandard Sample Directly After S. A. 1 Hour After S.A. 10 Hours After S.A.
Initial Volume 15.9 18.4 19.8 19.8
Change in Volume 9.95 9.85 10.0 9.9Change of Mass 9.948 9.820 10.030 9.845
Change in Volume 10.1 10.05 10.0 10.1Change of Mass 10.121 10.087 10.004 10.096
Change in Volume 10.0 10.0 10.0 10.05Change of Mass 10.070 10.057 10.040 10.050
Table 4 - Data from Density Measurement of Sample 4, initially containing 2.5g sugar / 1.2 L (2.08 g/L)Volumes in ml, +/-0.05ml FructoseMasses in g, +/-0.001g Standard Sample Directly After S.A. 1 Hour After S.A. 10 Hours After S.A.Initial Volume 19.0 20.0 20.0 19.0
Change in Volume 10.0 10.0 10.0 10.0Change of Mass 10.107 10.126 10.118 10.103
Change in Volume 10.0 10.0 10.0 10.0Change of Mass 10.104 10.119 10.112 10.102
Change in Volume 10.0 10.0 10.0 10.0Change of Mass 10.109 10.130 10.127 10.110
GlucoseStandard Sample Directly After S.A. 1 Hour After S.A. 10 Hours After S.A.
Initial Volume 20.0 19.0 18.0 20.0
Change in Volume 10.0 10.0 10 10.0Change of Mass 10.092 10.135 10.109 10.098
Change in Volume 10.0 10.0 10.05 10.0Change of Mass 10.109 10.122 10.167 10.110
Change in Volume 10.0 10.0 10.05 10.0Change of Mass 10.116 10.136 10.175 10.090

15
Table 5 - Data from Density Measurement of different fructose and glucose solutions (Volumes in ml, +/-0.05ml. Masses in g, +/-0.001g)Fructose
Grams / Liter 0 0.1 0.2 0.3 0.4 0.5 0.6 0.7 0.8 0.9 1.0 1.5 2.0 2.5Initial Volume 3.4 4.9 8.0 8.0 9.0 8.0 9.0 8.0 10.0 9.5 9.0 8.0 8.0 7.0
Change in Volume 10.0 9.9 10.0 10.05 10.0 10.0 10.0 10.0 10.0 10.0 10.0 10.0 10.0 10.0Change of Mass 9.933 9.850 9.961 10.014 9.986 9.974 9.982 9.986 9.975 9.983 9.991 9.990 9.975 9.991
Change in Volume 10.0 10.0 10.0 10.0 10.0 10.0 10.0 10.0 10.0 10.0 10.0 10.1 10.0 10.0Change of Mass 9.944 9.962 9.975 9.983 9.960 9.977 9.974 9.979 9.980 9.974 9.990 10.096 10.002 9.996
Change in Volume 9.5 10.0 10.0 9.95 9.95 10.0 10.05 10.0 10.0 10.0 10.5 10.0 10.05 10.0Change of Mass 9.443 9.943 9.979 9.936 9.946 9.993 10.045 9.988 10.008 10.011 10.487 9.988 10.053 10.018
GlucoseGrams / Liter 0 0.1 0.2 0.3 0.4 0.5 0.6 0.7 0.8 0.9 1.0 1.5 2.0 2.5Initial Volume 3.4 8.5 8.0 8.0 8.0 8.0 8.0 8.0 8.0 8.0 8.0 8.0 8.5 8.0
Change in Volume 10.0 10.0 10.0 10.0 10.0 10.0 10.05 10.0 10.0 10.4 10.15 10.1 10.0 10.0Change of Mass 9.933 9.957 9.981 9.976 9.985 9.995 10.040 9.963 9.983 10.381 10.139 10.091 9.992 10.007
Change in Volume 10.0 10.0 10.0 10.0 10.1 10.0 10.05 10.0 10.0 10.0 10.0 10.0 10.0 10.0Change of Mass 9.944 9.976 9.972 9.971 10.083 9.984 10.037 9.997 9.992 9.998 9.991 9.999 10.001 9.992
Change in Volume 9.5 10.0 10.0 10.0 9.9 10.05 10.0 10.05 10.0 10.0 10.2 10.0 10.0 10.0Change of Mass 9.443 9.977 9.959 9.980 9.871 10.018 9.973 10.045 9.985 9.995 10.198 10.001 10.003 10.020
Figure 6 – Sample from glucose tank under microscope. 100x Magnification.
Figure 7 – Sample from fructose tank under microscope. 100x Magnification.
Data Processing and Presentation
The oxidation mechanism of the biological organic removal from the solution of
mixed substrates is complex, and is generally described as a sequence of three
processes, contact of cell and substrate, transport of substrate into cell and
intermediate metabolism of the substrate.19 This mechanism is built upon the micro-
organism’s oxidizing enzyme system. The transportation into the cell requires the
substrate to be simple enough to pass through the plasma membrane, which means
complex molecules need to be broken down by extracellular enzymes. When the
substrates have entered the cell, the oxidation reactions start.
19 Eckenfelder Jr., Wesley, 1980:270

16
The find the kinetics of organic removal in an activated sludge system one can use
Monod’s equation, which can be defined for the kinetics of single substrate removal
(Equation 1): Equation 1 – Monod’s Equation
S
Sµ = µK S+
µ = Specific growth rate of organisms (1/hr)
µ = Maximum growth rate of organisms (1/hr)
SK = Monod’s Constant. KS is defined as the substrate concentration when the rate is
one half of the maximum rate. (g/L)
S = Substrate concentration (g/L)
a = Biomass yield coefficient (g/g)
vX = Biomass Concentration (g/L)
t = Time (hr)
This equation can be manipulated and presented in the following form when taking
into account the change of substrate concentration:
By entering values into the different variables of the equation I try to estimate the
growth rate of the two systems. So and Se will be the initial and final substrate
concentrations respectively. To find the change of substrate concentration (i.e. glucose and fructose concentration)
I needed to compare the densities of the samples with the standard samples created, to
try to obtain the approximate substrate concentration at the different times after
solving, so that the change of concentration could be found. The densities were found
by dividing the change in mass with the change in volume during titration, with the
processed data of samples S1-S4 presented in Figures 8-17.20
20 Test 1-3 being the samples taken during titration, and Average being the average of the samples.
0 e e 0 e s e
v s e v e
S -S S (S -S ) (K +S )µ= µ = aX t a K +S X t S
⇒

17
F ig ure 8 - D ensit ies o f S1 ( Init ially 0 .8 3 g / l) - F ruct o se - ( D ensit y +/ - 0 .0 0 5 g / ml)
0.9657
0.9818
0.9994
0.9933
1.0035
0.9980 0.9979
1.0042
0.9999
0.9968
0.9897 0.9899
0.9986 0.9981
0.95
0.96
0.97
0.98
0.99
1
1.01
Standard Sample Directly After S.A. 1 Hour After S.A. 10 Hours After S.A.
Den
sity
of t
he s
ampl
e (g
/ml)
Test 1
Test 2
Test 3
Aver age
Fig ure 10 - D ensit ies o f S2 ( Init ial ly 1.6 7 g / l) - F ruct o se - ( D ensit y +/ - 0 .0 0 5 g / ml)
0.9949
1.00140.9998
1.0053
0.9999
0.9960
1.00051.0034
1.0044 1.0049
0.9994
1.0043
0.99981.0007 0.9999
1.0043
0.95
0.96
0.97
0.98
0.99
1
1.01
Standard Sample Directly After S.A. 1 Hour After S.A. 10 Hours After S.A.
Den
sity
of t
he s
ampl
e (g
/ml)
Test 1
Test 2
Test 3
Aver age
Fi gur e 11 - D e nsi t i e s of S 2 ( I n i t i a l l y 1. 6 7 g/ l ) - Gl uc ose - ( D e nsi t y + / - 0 . 0 0 5 g/ ml )
0.9932
0.9985
0.9863
0.9896
0.9996
0.9957
1.00651.0079
1.0036 1.0028
0.99981.0020
0.9952
0.9996
1.0030 1.0032
0.95
0.96
0.97
0.98
0.99
1
1.01
Standard Sample Directly After S.A. 1 Hour After S.A. 10 Hours After S.A.
Den
sity
of t
he s
ampl
e (g
/ml)
Test 1
Test 2
Test 3
Aver age

18
F igure 12 - D ensit ies o f S3 ( Init ial ly 2 .5 g / l) - F ruct ose - ( D ensit y +/ - 0 .0 0 5 g / ml)
1.0002
0.99630.9980
1.0037
1.0067
1.0032
1.0061
1.0030
1.0075 1.00681.00551.0048
1.00211.0032
1.00501.0082
0.95
0.96
0.97
0.98
0.99
1
1.01
Standard Sample Directly After S.A. 1 Hour After S.A. 10 Hours After S.A.
Den
sity
of t
he s
ampl
e (g
/ml)
Test 1
Test 2
Test 3
Average
F ig ure 13 - D ensit ies o f S3 ( Init ial ly 2 .5 g / l ) - Gluco se - ( D ensit y +/ - 0 .0 0 5 g / ml)
0.99980.9970
1.0030
0.9944
1.00211.0037
1.0004 0.9996
1.00701.0057
1.0040
1.0000
1.0030 1.0021 1.0025
0.9980
0.95
0.96
0.97
0.98
0.99
1
1.01
Standard Sample Directly After S.A. 1 Hour After S.A. 10 Hours After S.A.
Den
sity
of t
he s
ampl
e (g
/ml)
Test 1
Test 2
Test 3
Aver age
F ig ure 14 - D ensit ies o f S4 ( Init ial ly 2 .0 8 g / l ) - F ruct o se - ( D ensit y +/ - 0 .0 0 5 g / ml)
1.01071.0126 1.0118
1.01031.01041.0119 1.0112 1.01021.0109
1.0130 1.01271.01101.0107
1.0125 1.01191.0105
0.95
0.96
0.97
0.98
0.99
1
1.01
1.02
St andard Sample Direct ly Af t er S.A. 1 Hour Af t er S.A. 10 Hours Af t er S.A.
Den
sity
of t
he s
ampl
e (g
/ml)
Test 1
Test 2
Test 3
Aver age

19
F ig ure 15 - D ensit ies o f S4 ( Init ially 2 .0 8 g / l) - Glucose - ( D ensit y +/ - 0 .0 0 5 g / ml)
1.0092
1.01351.0109
1.00981.0109
1.0122 1.0116 1.01101.01161.0136 1.0124
1.00901.0106
1.01311.0117
1.0099
0.95
0.96
0.97
0.98
0.99
1
1.01
1.02
St andard Sample Direct ly Af t er S.A. 1 Hour Af t er S.A. 10 Hours Af t er S.A.
Den
sity
of t
he s
ampl
e (g
/ml)
Test 1
Test 2
Test 3
Aver age
Figure 16 - Densities of aqueous solutions of Fructose at different concentrations - (Density +/- 0.005 g/ml)
0.994
0.9960.996
0.996
0.997 0.997
0.9980.998 0.997
0.999 0.999
0.9980.996
0.998
0.999
1.0000.999
1.000
0.999
1.0011.001
0.999
1.000
1.000
0.998 0.9980.998 0.998
0.999 0.999 0.999 0.999
0.993
0.999
0.994
1.002
0.999
0.994
0.995
0.997
0.998
1.000
0.992
0.993
0.994
0.995
0.996
0.997
0.998
0.999
1
1.001
1.002
1.003
0 0.1 0.2 0.3 0.4 0.5 0.6 0.7 0.8 0.9 1 1.1 1.2 1.3 1.4 1.5 1.6 1.7 1.8 1.9 2 2.1 2.2 2.3 2.4 2.5Mass of fructose solved per liter of solution (g/l)
Den
sity
(g/m
l)
Minimum Density
Maximum DensityAverage Density
Figure 17 - Densities of aqueous solutions of Glucose at different concentrations -(Density +/- 0.005 g/ml)
0.996 0.996
0.997 0.9970.997
0.997
0.996
0.998 0.998
0.9990.999 0.999
0.9980.998 0.998
0.999
1.0000.999
1.000
0.999
1.000 1.0001.000 1.000
0.9980.998 0.998 0.999
0.9990.999 0.999
1.0000.999
0.993
1.002
0.994
1.001
0.998
0.9970.997
0.994
1.000
0.992
0.993
0.994
0.995
0.996
0.997
0.998
0.999
1
1.001
1.002
1.003
0 0.1 0.2 0.3 0.4 0.5 0.6 0.7 0.8 0.9 1 1.1 1.2 1.3 1.4 1.5 1.6 1.7 1.8 1.9 2 2.1 2.2 2.3 2.4 2.5
M a ss of gl uc ose sol v e d pe r l i t e r of sol ut i on ( g/ l )
Minimum Density
Maximum Density
Average Density

20
Table 6 - The Approximate Sugar Contents of Sample S4 (Initially 2.08 g/l) (Density +/- 0.005 g/ml)98.7% of Average Density of Fructose (g/ml) Sugar Concentration (g/l)
S4 - Standard Sample 0.9975 0.2S4 - Directly After S.A. 0.9993 2.0S4 - 1 Hour After S.A. 0.9987 0.8S4 - 10 Hours After S.A. 0.9974 0.2
98.7% of Average Density of Glucose (g/ml) Sugar Concentration (g/l)S4 - Standard Sample 0.9974 0.3S4 - Directly After S.A. 0.9999 2.0S4 - 1 Hour After S.A. 0.9985 0.7S4 - 10 Hours After S.A. 0.9968 0.1
As S1-3 show so imprecise results, and partly unrealistic results (i.e. the sugar
contents is higher after 10 hours after solving than directly after solving (S3-
Fructose)), I’ve decided to only use the data and results derived from S4 in my
calculations, even though I won’t be able to compare results and thus get the
preciseness of any results achieved. When measuring the density of the samples from
the process, one must take into consideration the fact that though sedimentation and
careful removal of water from the tanks, the water was never sludge-free, but there
was approximately an equal amount of sludge in every sample. Consequently every
sample in S4 will have a density higher than that of only tap water with sugar, and I
assumed that 1.3%21 of the mass was sludge. I then compared Figures 14-15 with
Figures 16-17, and came to the results displayed in Table 6.
These values of the sugar concentration can then be inserted into Monod’s equation,
together with the estimated22 data found in Table 7, to calculate the Maximum Growth
Rate of the system (Table 8).
21 This value makes the mass of sugar initially solved into the wastewater correspond to the mass of the wastewater obtained through the density measurements from the sample ‘Directly after S.A.’ 22 The chosen values are both realistic and give precise results for the calculations.
Table 7 – Estimated Data for variables and
constants of Monod’s equation.
Value
Xv (g/L) 3
a (g/g) 0.9
Ks (g/L) 4

21
Figure 18 - A Graph Mapping the Specific Growth Rates of Fructose and Glucose at Different Substrate Concentrations
0
0.2
0.4
0.6
0.8
1
1.2
1.4
1.6
1.8
2
0 1 2 3 4 5 6 7 8 9 10 11 12
Substrate Concentration (g/L)
Spec
ific
Gro
wth
rate
(1/h
r)
Specific Growth Rate of Activated Sludge given Fructose as BOD
Specific Growth Rate of Activated Sludge given Glucose as BOD
As the average µ ’s differ, the growth rate of the sludge is different whether fructose
or glucose is given to it as BOD, and as the µ for glucose is higher, glucose increases
the growth rate of the activated sludge more (Figure 18)24. This is then supported by
that the amount of sludge in the glucose tank was greater than the amount of sludge in
the fructose tank after the investigation were done, and initially they had been fairly
equal.
23 µ1 corresponds to 1 hour after S.A., µ2 corresponds to 10 hours after S.A. 24 A graph mapping Equation 1 using the calculated growth rate values.
Table 8 – Calculations of the growth rate of the activated sludge in the two tanks.23
Fructose Tank:
0 e s e
v e
(S -S ) (K +S )µ = aX t S
µ1 = (2.0 0.8) (4 0.8)0.93 1 0.8− +⋅
= 2.16 hr-1
µ2 = (2.0 0.2) (4 0.2)0.93 10 0.2− +⋅
= 1.13 hr-1
Average 2.16+1.13µ = 1.702
= hr-1
Glucose Tank:
0 e s e
v e
(S -S ) (K +S )µ = aX t S
µ1 = (2.0 0.7) (4 0.7)0.93 1 0.7− +⋅
= 2.62 hr-1
µ2 = (2.0 0.1) (4 0.1)0.93 10 0.1− +⋅
= 2.34 hr-1
Average 2.62+2.34µ = 2.482
= hr-1

22
Conclusion and Evaluation
I came to the conclusion that the growth rate of activated sludge in an activated sludge
process differs whether glucose or fructose is given to it as BOD, and that glucose
will increase the growth rate more. The final values obtained for the growth rate in the
fructose tank was 1.70 hr-1, and for the glucose tank 2.48 hr-1. Hence my hypothesis
was proven wrong, which could be explained by the fact that even though the fructose
pathway has less ‘steps’, the ‘steps’ might have higher energy requirements, thus
making the glucose pathway more efficient. As both sugars are so similar in structure,
they will also affect the growth rate in a similar way, other than if e.g. glucose and a
non-sugar carbohydrate were studied.
Errors and Suggestions of Improvement
The greatest error in this investigation was the inaccurate method of determining the
sugar concentration of the wastewater, making it difficult to determine an accurate
growth rate of the activated sludge. This included the problem of that the samples
from the aeration tanks contained more particles and sludge than tap water, thus the
densities weren’t directly comparable, and assumptions had to be made. To improve
this I could have used a better method of analysing the sugar concentration of a
solution, which can include chemical sugar analysis or spectroscopy and when
measuring the densities of water at different substrate concentrations, I could have
used the same muddy water that started the process.
Another error is the fact that the aeration tanks did not receive equal amounts of
oxygen, as the air cables clogged up, giving slightly different air amounts to both
tanks. This could be improved by using two identical aquarium pumps, as well as
changing cables daily, to ensure more equal aeration.
During sample-taking several problems arose, firstly when water was removed during
sample-taking small amounts of sludge were removed, and thus I could not ensure
constant sludge amounts, which I could have improved by filtering the water when
taking the sample to remove as much sludge as possible, to ensure as constant sludge

23
amount in the tanks as possible. Secondly as the samples were taken and frozen, the
freezing wasn’t instant, so oxidation of the sugars can have continued after the sample
was taken, which could have been improved by carrying out the density measurement
directly after the samples were taken.
During the density measurement the systematic error in the burette arose, followed by
the fact that I hadn’t taken enough samples. This could have been improved by
repeating S1-3 with a new burette, and also by taking more samples at different
substrate concentrations, giving more results, and hence a more accurate answer.
The tanks can have initially contained slightly different amounts of sludge, which
affects the amount of sugar oxidized, and thus the growth rate. Even though the
sludge was divided quite equally by volume, doesn’t mean that it contained equal
amounts of living organisms. This error is difficult to improve, but by repeating the
method but giving the same sugar to both tanks I could use Monod’s equation and my
calculated growth rate to calculate the biomass of both tanks.
Finally I made assumptions of the values of the different constants and variables in
Monod’s equation, as well assuming them being equal in both tanks, which affects the
growth rate calculated. This could have been improved by experimentally determining
the different values.

24
Bibliography
Literature:
Andersson, B., Bengtsson, M., Elmqvist, T., Nordell, O., Westin, L., 1979, Knuffa
För Limnologi, Gothenburg: Fältbiologerna
Eckenfelder Jr., W. Wesley, 1980, Principles Of Water Quality Management, Boston:
CBI Publishing Company, Inc.
Järnefelt, Naulapää and Tikkanen, 1976, ’Planktonopas’, Suomen Kalastusyhdistys
n:o 34, Helsinki Univeristy
Electronic:
Jurtshuk Jr., Peter, Medmicro Chapter 4, [Online], [Accessed on 07.09.2005],
available from: <URL: http://gsbs.utmb.edu/microbook/ch004.htm>
King, Michael W., Glycolysis, [Online], [Accessed on 07.09.2005], available from:
<URL: http://web.indstate.edu/thcme/mwking/glycolysis.html>
King, Michael W., Non-Glucose Carbons in Glycolysis, [Online], [Accessed on
07.09.2005], available from: <URL: http://web.indstate.edu/thcme/mwking/non-
glucose-sugar-metabolism.html>
UCLA College, Activated Sludge, [Online], [Accessed on 07.09.2005], available
from: <URL:
http://www.college.ucla.edu/webproject/micro7/studentprojects7/Rader/asludge2.htm
>


![[Sucrose][Fructose] [H3P04= · quired fructose molecule could be produced from a second molecule of G-1-P by way of glucose-6-phos-phate (G-6-P) and fructose-6-phosphate (F-6-P) as](https://static.fdocuments.us/doc/165x107/5ec3bc19478bbc53f3182a8b/sucrosefructose-h3p04-quired-fructose-molecule-could-be-produced-from-a-second.jpg)