A COMPARISON OF THE CORROSION PRODUCTS AND MECHANISMS OF VARIOUS FORMS
165
A COMPARISON OF THE CORROSION PRODUCTS AND MECHANISMS OF VARIOUS FORMS OF DEPOSIT-INDUCED CORROSION AT 700 o C by Bradley Scott Lutz B.S. Materials Science and Engineering, Purdue University, 2009 Submitted to the Graduate Faculty of The Swanson School of Engineering in partial fulfillment of the requirements for the degree of Master of Science University of Pittsburgh 2012
Transcript of A COMPARISON OF THE CORROSION PRODUCTS AND MECHANISMS OF VARIOUS FORMS

A COMPARISON OF THE CORROSION PRODUCTS AND MECHANISMS OF
VARIOUS FORMS OF DEPOSIT-INDUCED CORROSION AT 700oC
by
Bradley Scott Lutz
B.S. Materials Science and Engineering, Purdue University, 2009
Submitted to the Graduate Faculty of
The Swanson School of Engineering in partial fulfillment
of the requirements for the degree of
Master of Science
University of Pittsburgh
2012

ii
UNIVERSITY OF PITTSBURGH
SWANSON SCHOOL OF ENGINEERING
This thesis was presented
by
Bradley Scott Lutz
It was defended on
September 12, 2012
and approved by
Brian Gleeson, Ph.D., Professor, Department of Mechanical Engineering and Materials
Science
Jung-Kun Lee, Ph.D., Assistant Professor, Department of Mechanical Engineering and
Materials Science
Thesis Co-Advisor: Frederick S. Pettit, Ph.D., Professor Emeritus, Department of Mechanical
Engineering and Materials Science
Thesis Co-Advisor: Gerald H. Meier, Ph.D., Professor, Department of Mechanical
Engineering and Materials Science

iii
Tests were performed on selected steel and Ni-based alloys in simulated fireside corrosion
conditions with synthetic coal ash deposits. The tests provide fireside corrosion information as
well as insights on corrosion mechanisms for guiding materials development. General
mechanisms for the different types of hot corrosion caused by Na2SO4 deposits were inferred;
although, in some cases, specifics were unclear. Tests were also conducted on MCrAlY alloys
and Ni-based disk alloys under simulated hot corrosion conditions at 700oC.
The experimental conditions simulated fireside corrosion by varying deposit
compositions, temperatures, and gas atmospheres until the most severe corrosion environment
was found. This was determined to be at 700oC with a deposit consisting of
K2SO4:Na2SO4:Fe2O3 in a 1.5:1.5:1.0 molar ratio in a gas atmosphere containing oxygen with
1000ppm SO2. Once this was determined, the effects of alloy composition on the resistance to
corrosion were obtained, and a mechanism for the corrosion was deduced. An SO2 threshold
value in the gas atmosphere for severe corrosion to occur was also observed. Each of the alloys
suffered corrosion in the form of pits similar to those found during Type II hot corrosion.
A variety of disk alloys typical of those used in gas turbine engines were exposed to
aggressive corrosion conditions. The exposure conditions at 700oC included air oxidation,
oxidation with Na2SO4 salt deposits in air, and O2 + 1000ppm SO2. The Mo-containing alloys
suffered degradation with the salt deposits in air, without the presence of SO2. The attack was
A COMPARISON OF THE CORROSION PRODUCTS AND MECHANISMS OF
VARIOUS FORMS OF DEPOSIT-INDUCED CORROSION AT 700oC
Bradley Scott Lutz, M.S.
University of Pittsburgh, 2012

iv
similar to alloy-induced acidic fluxing usually observed around 900oC. Each of the alloys was
significantly degraded under the Type II hot corrosion conditions, with the Mo-containing alloys
experiencing more corrosion than the other alloys.
The corrosion products and mechanisms for the various forms of corrosion were
compared. Fireside corrosion was found to be very similar to Type II hot corrosion. The Mo-
containing disk alloys which were exposed in air with Na2SO4 salt deposits were found to
undergo alloy-induced acidic fluxing even at 700oC. The corrosion of the disk alloys under Type
II hot corrosion conditions was found to be similar to Type II hot corrosion of NiCrAlY.

v
TABLE OF CONTENTS
ACKNOWLEDGEMENTS ...................................................................................................... XV
1.0 INTRODUCTION ........................................................................................................ 1
2.0 BACKGROUND .......................................................................................................... 5
2.1 FORMATION OF DEPOSITS ON BOILER TUBES ..................................... 5
2.2 FUEL ..................................................................................................................... 8
2.2.1 Coal ................................................................................................................... 9
2.2.2 Other Types of Fuels ..................................................................................... 14
2.3 FIRESIDE CORROSION ................................................................................. 16
2.3.1 Sulfur and Sulfates ........................................................................................ 17
2.3.1.1 Pyrosulfates.......................................................................................... 22
2.3.1.2 Alkali Iron Trisulfates ........................................................................ 24
2.3.2 Mechanism of Corrosion ............................................................................... 25
2.3.2.1 Gas-Phase Oxidation........................................................................... 26
2.3.2.2 Liquid-Phase Corrosion ..................................................................... 29
2.3.3 Alloys For Use in Boilers and Gas Turbine Hardware .............................. 38
2.4 SODIUM SULFATE-INDUCED HOT CORROSION .................................. 44
2.4.1 Stages of Corrosion ........................................................................................ 45
2.4.1.1 Initiation Stage .................................................................................... 47

vi
2.4.1.2 Propagation Stage ............................................................................... 50
2.4.2 Type I Hot Corrosion .................................................................................... 57
2.4.2.1 Basic Fluxing ....................................................................................... 57
2.4.2.2 Alloy-Induced Acidic Fluxing ............................................................ 64
2.4.3 Type II Hot Corrosion ................................................................................... 68
2.4.3.1 Gas-Phase Induced Acidic Fluxing .................................................... 68
2.4.4 Disk Corrosion ............................................................................................... 76
3.0 RESEARCH OBJECTIVES ..................................................................................... 78
4.0 EXPERIMENTAL PROCEDURE ........................................................................... 80
4.1 MATERIALS PREPARATION ....................................................................... 80
4.2 FIRESIDE CORROSION TESTS ................................................................... 82
4.3 TYPE II HOT CORROSION TESTS.............................................................. 85
4.4 ANALYTICAL PROCEDURE ........................................................................ 86
5.0 RESULTS AND DISCUSSION ................................................................................ 88
5.1 FIRESIDE CORROSION ................................................................................. 88
5.1.1 Initial Tests: Finding the right corrosion environment ............................. 88
5.1.1.1 Slurry Coating Deposition Tests ........................................................ 88
5.1.1.2 Powder-Crucible Deposition Tests .................................................... 90
5.1.2 FeNiCr .......................................................................................................... 103
5.1.3 T92................................................................................................................. 106
5.1.4 Ni-Cr ............................................................................................................. 109
5.1.5 IN-617 ........................................................................................................... 114
5.1.6 NiCrAl........................................................................................................... 117

vii
5.1.7 NiCrAlMo ..................................................................................................... 119
5.2 TYPE II HOT CORROSION ......................................................................... 121
5.3 TYPE II HOT CORROSION OF DISK ALLOYS ...................................... 125
5.3.1 Oxidation of Alloys in Air ........................................................................... 125
5.3.2 Oxidation of Alloys in Air with Na2SO4 Deposit ....................................... 127
5.3.3 Type II Hot Corrosion of Disk Alloys ........................................................ 129
5.4 COMPARISON OF THE CORROSION MICROSTRUCTURES AND
MECHANSIMS .................................................................................................... 132
5.4.1 Fireside Corrosion and Type II Hot Corrosion ........................................ 133
5.4.2 Corrosion of Mo-Containing Disk Alloys in Air and Alloy-Induced Acidic
Fluxing Type I Hot Corrosion ..................................................................... 137
5.4.3 Corrosion of Disk Alloys in SO2 and Type II Hot Corrosion .................. 140
5.5 CONCLUSIONS .............................................................................................. 142
BIBLIOGRAPHY ..................................................................................................................... 146

viii
LIST OF TABLES
Table 1: Elemental Analysis of Major Fuel (wt%) ...................................................................... 10
Table 2: Occurance of Minerals in Coal ....................................................................................... 11
Table 3: Reactions in the Oxidation of Sulfur .............................................................................. 19
Table 4: Melting Point of Complex Sulfates ................................................................................ 24
Table 5: Nominal Alloy Compositions ......................................................................................... 80
Table 6: Equilibrium SO3 Partial Pressures at Experimental Temperatures and Gas Atmospheres
........................................................................................................................................... 84
Table 7: Comparison of the Characteristics, Corrosion Products, and Mechanisms for Each Type
of Corrosion Tested......................................................................................................... 133

ix
LIST OF FIGURES
Figure 1: Schematic of oxy-fuel combustion .................................................................................. 2
Figure 2: Rate of Change of Heat Flux with Accumulation of Slag ............................................... 6
Figure 3: Deposits and Corrosion Area for Typical Reheater Tube ............................................... 8
Figure 4: Calculated Flue Gas Composition Upon Coal Combustion ............................................ 9
Figure 5: Mineral Matter Transformation Mechanism ................................................................. 13
Figure 6: Calculated Molar Quantity of Pure Compounds of Condensed Phases in Equilibrium
with the Flue Gas upon Combustion of 100g of the Coal Shown in Table 1 ................... 14
Figure 7. Fireside corrosion regimes in coal-fired boilers ............................................................ 17
Figure 8: Formation of SO3 in Thin Stabilized Flame of H2S-O2-N2 .......................................... 20
Figure 9: Melting Points in the System Na2SO4-SO3 and K2SO4-SO3 ......................................... 23
Figure 10: The Iron-Oxygen Phase Diagram ............................................................................... 27
Figure 11: The General Temperature Distribution Through a Superheater Tube, the Oxide, and
the Deposit ........................................................................................................................ 30
Figure 12: Mechanism of Fireside Corrosion of Steel Surfaces by Removal of Oxide Film to
Form K3Fe(SO4)3 .............................................................................................................. 32
Figure 13: Coal-ash Corrosion Cycle ........................................................................................... 34
Figure 14: Oxidatio Kinetics of Fe-10Al Alloy exposed to O2-0.5% (SO2+SO3) at 650oC: (a)
Na2SO4-K2SO4, (b) Na2SO4 alone, and (c) K2SO4 alone .................................................. 36

x
Figure 15: SO3 Levels Required to Stabilize Eutectic Melts: (a) Na2SO4-iron trisulfates and (b)
K2SO4-iron trisulfates ....................................................................................................... 37
Figure 16: Evolution of Ferritic Steels for Boilers ....................................................................... 39
Figure 17: Allowable Stress for Various Classes of Alloys ......................................................... 41
Figure 18: Isothermal Mass Change versus time for IN-738. The data consists of an initiation
stage and a propagation stage with large weight changes (dashed line gives arbitrary
end of initiation stage)....................................................................................................... 46
Figure 19: Thermodynamic Stability Diagram for the Na-O-S system at Constant Temperature 48
Figure 20: Isothermal Stability Diagram of the Cr-O-S System Superimposed onto the Na2SO4
Portion of the Na-S-O Stability Diagram for T=1200K ................................................... 52
Figure 21: Measured Oxide Solubilities in Na2SO4 at 927oC and 1 atm O2 ................................ 53
Figure 22: Conditions in the Na2SO4 Salt the Satisfy the Rapp-Goto Criterion .......................... 56
Figure 23: Phase Stability Diagram for the Na-Ni-S-O System at 1000oC ................................. 59
Figure 24: Model for Na2SO4-induced Accelerated Oxidation of Nickel .................................... 62
Figure 25: Comparison of Isothermal Hot Corrosion of Na2SO4-Coated Ni-CrAl and Ni-Cr-Al-
Mo ..................................................................................................................................... 67
Figure 26: The CoSO4-Na2SO4 Phase Diagram ........................................................................... 69
Figure 27: The SO3 Partial Pressure Required to Form Various Species ..................................... 71
Figure 28: Schematic of Horizontal Tube Furnace Apparatus for Fireside Corrosion Tests ....... 83
Figure 29: Modified Quartz Rod for Crucible Fireside Corrosion Tests ...................................... 85
Figure 30: Fireside Corrosion at 650oC with Deposit D slurry coated in O2 + 100ppm SO2 for
100hrs for (a.) FeNiCr, (b.) IN-617, (c.) Ni-Cr, (d.) T92, and (e.) NiCrAl ...................... 89

xi
Figure 31: Fireside corrosion at 700oC with Deposit D slurry coated in O2 + 100ppm SO2 for
100hrs of (a.) FeNiCr, (b.) IN-617, (c.) Ni-22Cr, (d.) T92, and (e.) NiCrAl.................... 90
Figure 32: Fireside corrosion of selected alloys at 650oC with Deposit D powder in a crucible in
O2 + 100ppm SO2 for 160hrs ............................................................................................ 91
Figure 33: Fireside Corrosion of Ni-22Cr at 650oC with Deposit D powder in a crucible in O2
+100ppm SO2 for 160 hours ............................................................................................. 92
Figure 34: Fireside Corrosion of (a.) Ni-22Cr and (b.) T92 at 650oC with the standard corrosion
mix powder in a crucible in O2 + 100ppm SO2 for 100hrs ............................................... 93
Figure 35: Fireside Corrosion of FeNiCr at 650oC with the standard corrosion mix powder in a
crucible in O2 + 100ppm SO2 for 160 hours ..................................................................... 94
Figure 36: Fireside Corrosion of FeNiCr at 700oC with the standard corrosion mix deposit in a
crucible in O2 + 100ppm SO2 for 160 hours in 20 hour cycles ........................................ 95
Figure 37: Fireside Corrosion of FeNiCr at 700oC in O2 + 1000ppm SO2 with the standard
corrosion mix powder in a crucible for 160 hours isothermally ....................................... 96
Figure 38: BSE surface SEM images of Fireside Corrosion of FeNiCr at 700oC in O2 + 1000ppm
SO2 with the standard corrosion mix powder in a crucible for 160 hours isothermally ... 97
Figure 39: BSE cross-sectional SEM images of Fireside Corrosion of FeNiCr at 700oC in O2 +
1000ppm SO2 with the standard corrosion mix powder in a crucible for 160 hours
crucible for 160 hours in O2 + 1000ppm SO2 ................................................................... 99
Figure 41: Oxidation of FeNiCr at 650oC in O2 + 1000ppm SO2 with no deposit for 160 hours
......................................................................................................................................... 100
Figure 40: Fireside Corrosion of FeNiCrAl at 650oC with the standard corrosion mix powder in a
isothermally ................................................................................................................................. 98

xii
Figure 42: Fireside Corrosion of T92 at 700oC with the standard corrosion mix powder in a
crucible for 160 hours in 20 hour cycles in O2 + 1000ppm SO2 .................................... 101
Figure 43: Fireside Corrosion of NiCr at 700oC with the standard corrosion mix powder in a
crucible for 160 hours in 20 hour cycles in O2 + 1000ppm SO2 .................................... 101
Figure 44: Fireside Corrosion of FeNiCr at 700oC with the standard corrosion mix powder in a
crucible for 160 hours in O2 + 100ppm SO2 ................................................................... 103
Figure 45: Fireside Corrosion of FeNiCr at 700oC with the standard corrosion mix powder in a
crucible for 160 hours in O2 + 1000ppm SO2 ................................................................. 103
Figure 46: Fireside Corrosion of FeNiCr at 700oC with the standard corrosion mix powder in a
c rucible for 160 hours in O2 + 1000ppm SO2 ................................................................... 104
Figure 47: Fireside Corrosion of T92 at 700oC with the standard corrosion mix powder in a
crucible for 160 hours in O2 + 100ppm SO2 ................................................................... 107
Figure 48: Fireside corrosion of T92 at 700oC with the standard corrosion mix powder in a
crucible for 160 hours in O2 + 1000ppm SO2 ................................................................. 107
Figure 49: Fireside Corrosion of T92 at 700oC with the standard corrosion mix powder in a
crucible for 160 hours in O2 + 1000ppm SO2 ................................................................. 108
Figure 50: Fireside Corrosion of Ni-22Cr at 700oC with the standard corrosion mix powder in a
crucible for 160 hours in O2 + 100ppm SO2 ................................................................... 110
Figure 51: Fireside Corrosion of Ni-Cr at 700oC with the standard corrosion mix powder in a
crucible for 160 hours in O2 + 1000ppm SO2 (a.) before the platinum catalyst was moved
next to the hot zone and (b.) after the platinum catalyst was moved next to the hot zone ......... 110
Figure 52: Fireside Corrosion of Ni-22Cr at 700oC with the standard corrosion mix powder in a
crucible for 160 hours in O2 + 1000ppm SO2 ................................................................. 111

xiii
Figure 53: Fireside Corrosion of Ni-22Cr at 700oC with the standard corrosion mix powder in a
crucible for 160 hours in O2 + 1000ppm SO2 ................................................................. 112
Figure 54: Fireside Corrosion of IN-617 at 700oC with the standard corrosion mix powder in a
crucible for 160 hours in O2 + 100ppm SO2 ................................................................... 115
Figure 55: Fireside corrosion of IN-617 at 700oC with the standard corrosion mix powder in a
crucible for 160 hours in O2 + 1000ppm SO2 ................................................................. 115
Figure 56: Fireside corrosion of IN-617 at 700oC with the standard corrosion mix powder in a
crucible for 160 hours in O2 + 1000ppm SO2 ................................................................. 116
Figure 57: Fireside Corrosion of NiCrAl at 700oC with the standard corrosion mix powder in a
crucible for 160 hours in O2 + 100ppm SO2 ................................................................... 117
Figure 58: Fireside corrosion of NiCrAl at 700oC with the standard corrosion mix powder in a
crucible for 160 hours in O2 + 1000ppm SO2 ................................................................. 117
Figure 59: Fireside corrosion of NiCrAl at 700oC with the standard corrosion mix powder in a
crucible for 160 hours in O2 + 1000ppm SO2 ................................................................. 119
Figure 60: Fireside corrosion of NiCrAlMo at 700oC with the standard corrosion mix powder in
a crucible for 160 hours in O2 + 100ppm SO2 ................................................................ 119
Figure 61: Fireside Corrosion of NiCrAlMo at 700oC with the standard corrosion mix powder in
a crucible for 160 hours in O2 + 1000ppm SO2 .............................................................. 120
Figure 62: Fireside corrosion of NiCrAlMo at 700oC with the standard corrosion mix powder in
a crucible for 160 hours in O2 + 1000ppm SO2 .............................................................. 121
Figure 63: Type II hot corrosion microstructures: (a.-b.) NiCrAlY (c.-d.) CoCrAlY [74] ........ 122
Figure 64: Type II hot corrosion microstructure of NiCrAlY demonstrating interphase attack[74]
......................................................................................................................................... 123

xiv
Figure 65: NiSO4-Na2SO4 Phase Diagram ................................................................................. 125
Figure 66: Cross-sections of selected disk alloys after oxidation in air ..................................... 126
Figure 67: Oxidation of selected disk alloys in air with Na2SO4 deposit at 700oC .................... 127
Figure 68: Oxidation of Mo-containing disk alloys in air with Na2SO4 deposit at 650oC ......... 129
Figure 69: Type II Hot Corrosion of Disk Alloys at 700oC in O2 + 1000ppm SO2 ................... 130
Figure 70: Comparison of Type II hot corrosion of NiCrAlY to Fireside Corrosion of NiCrAlMo
......................................................................................................................................... 135
Figure 71: Comparison of corrosion of NiCrAlMo with a Na2SO4 deposit at 700oC in air to Type
I hot corrosion [66] ......................................................................................................... 138

xv
ACKNOWLEDGEMENTS
I would like to thank my research advisors Professors Gerald H. Meier and Frederick S.
Pettit for the guidance and wisdom given to me not only on the work for this thesis but in my all
of my academic and research efforts. They create a work atmosphere that is both pleasant and
exciting to work in. I also owe a lot of gratitude to my colleagues Michael Task, Michael
Helminiak, Meltem Yanar, Ed Magee, Keeyoung Jung, and Nan Mu for their experience and
knowledge given to me in working in the laboratory. Without them this would not have been
possible. I would also like to thank my committee members, Professors Brian Gleeson and J.K.
Lee for sharing their knowledge and expertise in the classroom and here on this committee.
This project was funded by the Office of Naval Research under contract number N00014-
10-1-0661 and by the National Energy Technology Laboratory under URS Corps. Task Release
100.

1
1.0 INTRODUCTION
The growing population requires increasing amounts of electricity from sources that will have a
reduced environmental impact. The worldwide energy demand will increase by approximately
40% by 2030, and coal combustion is believed to account for 30% of the future worldwide
energy production.[1] Coal is plentiful and available at low cost, but traditional methods of coal
combustion lead to high pollutant and CO2 emissions. Global warming is becoming a bigger
problem every day with the emission of greenhouse gasses, and therefore power plants in the
United States are under increasing pressure to improve thermal efficiency in order to provide
abundant and affordable electricity while reducing gas emissions. Advanced coal combustion
designs will provide this. Older power plants from the 70’s and 80’s need to be either replaced
with the new advanced combustion technology power plants, or with their retrofit. Some of the
advanced combustion technologies include using renewable fuels, such as biomass, and carbon
capture storage (CCS), such as oxy-fuel combustion. Part of the research performed for this
thesis was for materials development for superheater and reheater tubes for oxy-fuel combustion
systems.
Oxy-fuel firing is one of three ways in which CCS can be accomplished. The other two
ways are post-combustion capture, where the CO2 is removed from the flue gas after combustion,
and pre-combustion capture, where the CO2 is removed from the fuel before combustion. Oxy-
fuel firing is carrying out the combustion in an environment consisting of recirculated flue gases

2
containing primarily CO2, steam and pure oxygen instead of air in order to create a flue gas with
minimal amounts of N2, but still excess oxygen. A schematic of the oxy-fuel process is shown
below in Figure 1.
Figure 1: Schematic of oxy-fuel combustion
Oxy-fuel combustion produces flue gases containing 60%CO2-30%H2O-4%O2-5%N2, whereas
traditional air-fired combustion produces flue gases containing 74%N2-12%CO2-9%H2O-
4%O2.[2] The flue gases in oxy-fuel systems are able to be recycled through the fuel burners
leading to decreased CO2 emissions. However, with the reduced amounts of nitrogen, the
products of the oxy-fuel combustion process have increased amounts of CO2, steam and
corrosive gases, such as SO2 and HCl that will cause significant corrosion in superheater and
reheater tubes when compared to air-fired combustion. Burning biomass as fuel or oxy-fuel
combustion will increase corrosion due to increased corrosive gas products and ash deposits
from the coal/biomass. SO2 in the flue gas and ash deposits from the fuel cause severe corrosion
in the superheater and reheater tubes of coal fired boilers where the temperature is the highest.
This form of corrosion is called fireside corrosion, and is caused by the formation of liquid
deposits on the surface of superheater and reheater tubes. Because the oxy-fuel combustion

3
system operates in two parts, the plant efficiency decreases. One way to overcome the efficiency
loss of using oxy-fuel combustion is to increase the steam temperatures and pressures to ultra-
supercritical conditions.
The efficiency of a coal-fired power plant is related to the steam temperature and
pressure. This is the Carnot efficiency. A higher efficiency requires higher temperatures and
materials that can withstand the higher temperatures than current coal-fired power plants. Ultra-
supercritical steam conditions are the result of increasing temperature and pressure. The critical
point for the water/steam system is 22.1MPa at 374oC. Operating at higher temperatures and
pressures produces supercritical and even higher produces ultra-supercritical steam conditions.
At these high temperatures and pressures, water does not form a two-phase steam/water mixture
during boiling. The system forms a single phase going from water directly into steam.[3] The
goal is to move from supercritical conditions of 16.5-24MPa and 540oC to ultra-supercritical
conditions of 35MPa and 760oC. The higher steam temperatures and pressures will significantly
increase efficiency while decreasing fuel usage and CO2 emissions. Compared to normal
pulverized coal (PC) power plants which operate at 35% efficiency, ultra-supercritical steam
conditions can potentially increase efficiency to more than 47%, while reducing carbon dioxide
emissions by 30%.[4] The current materials used in supercritical conditions do not have the high
temperature strength and corrosion resistance to be operated in ultra-supercritical conditions.
The technology needed to reach the ultra-supercritical goals is developing stronger and corrosion
resistant high temperature materials.
Advanced gas turbine engines are also being developed in order to decrease gas
emissions and reduce fuel consumption. In other words, the efficiency of the engine must
increase. This can be done by increasing the temperature and pressure of the combustion process

4
or developing improvements in component cooling technologies. Gas turbine engines, especially
those used for marine propulsion or in coastal areas also undergo severe corrosion caused by
Na2SO4 salt deposits on the surface of turbine hardware. When the conditions are such that the
deposited salts become molten, as in fireside corrosion, severe degradation of the turbine
hardware can occur. Increasing the temperature and pressure can cause the corrosion to be more
severe.
The research presented here is focused on providing high temperature fireside corrosion
information as well as indicating a corrosion mechanism to aid in materials development for oxy-
fuel combustion systems. The identified corrosion mechanism for fireside corrosion will be
compared to the mechanism of type II hot corrosion for turbine engines and the corrosion of
rotor disk alloys, so that a better understanding of the corrosion processes for these varying types
of attack can be obtained.
5
2.0 BACKGROUND
2.1 FORMATION OF DEPOSITS ON BOILER TUBES
Corrosion of the wall tubes of coal-fired boilers is caused by ash deposits that form a slag layer
with high alkali and SO3 contents and high solubility in water. The ash deposits on wall tubes
prevent heat transfer, and lead to corrosion of the tube. Reid and Cohen[5] examined the
influence of slag thickness on wall tubes. They showed that there is a stationary layer of slag
next to the tube and a moving layer of slag at higher temperature. These layers are based on the
temperature and composition of the slag. The more fluid a slag layer is, the more heat it will
conduct to the tubes. The heat transfer through the slag increases linearly with slag surface
temperature. The heat flux will vary around the tube, and it will be the smallest where the
deposit is the thickest. Ely and Schueler[6] examined the influence of slag thickness on the heat
transfer through the wall tubes. The heat flux was found to decrease as the slag becomes thicker
with increasing time, this can be seen below in Figure 2.

6
Figure 2: Rate of change of heat flux with accumulation of slag
The corrosion of superheater tubes from ash deposits is dependent on the operating steam
temperatures. The steam temperature in boilers is increasing for increased efficiency in power
production, but corrosion becomes a great problem at higher temperatures. The corrosion
kinetics follow a bell-shaped curve with the largest amount of corrosion occurring in a
temperature range of 650-750oC. In this temperature range, the deposits become molten and
corrode the metal. At lower temperatures, the deposits are solid and for the most part are not
reactive. At higher temperatures, the deposits will become molten, however there is not enough
SO3 produced to cause the formation of highly corrosive alkali iron trisulfates. This will be
explained in later sections. Trisulfates decompose in the absence of sufficient SO3. At these
high temperatures, a slag of alkali sulfates will form, which can still cause corrosion of the boiler
hardware.
The build-up of ash deposit on boiler tubes was examined by Bishop[7]. He proposed the
following possible causes of deposit build-up[3]:
Alkali metal salts in the vapor phase condense on the tubes to form a sticky layer, which
collects impacting particles of fly ash.

7
The initial deposit consists of fly ash; the insulating effect of this ash results in the outer
layers of the deposit becoming hotter than the inside, and this temperature gradient allows
partial decomposition of sulfates in the hotter parts, with the SO3 so formed diffusing
toward the cooler surface. An inner dense alkali sulfate-rich layer forms.
Alkali metal or alkaline-earth oxides are deposited on the surface, and are then converted
to low-melting point sulfates and pyrosulfates by reaction with SO3 in the bulk gas phase.
Alkali chloride vapors from high-chlorine coals condense on the tubes and are converted
to sulfates.
Silicon compounds are evolved as vapors from silicate materials during combustion, and
are then deposited as fine aerosol particles on the surface and are rapidly oxidized to
silica.
Molten ash particles in the hot gas stream impact on the cold metal surface and freeze in
place.
Generally, a white deposit will form first on the surface of the tube. This is mostly sodium
sulfate. An ash deposit then forms. The deposit on a corroding tube is shown below in Figure
3.[3] The amount of corrosion will be determined by the SO3 partial pressure near the alkali
sulfates and the temperature.

8
Figure 3: Deposits and corrosion area for typical reheater tube
2.2 FUEL
There are many different kinds of fuels that can be used in power generation systems. These
fuels can be compared based on fuel storage, preparation and handling, combustions behavior,
and fuel compositions that can cause corrosion issues. The types of fuels can range from solid
fuels such as coal, biomass, and waste to gaseous fuels. Co-firing of different types of fuel is
also possible.[8] The current research was focused on the deposits and corrosion caused from
coal-fired boilers and power systems as well as gas turbine engines. Other types of fuels can
lead to corrosion from different deposits and mechanisms.

9
2.2.1 Coal
When coal is burned, coal ash is put into the gas stream, and it becomes a major part of the
deposits on superheater tubes. The typical composition of the flue gas in burning coal at
temperatures between 400-1200oC is shown below in Figure 4[9]. The big difference in flue gas
composition between coal and other types of fuels is the SO2/SO3 content, which is increased due
to higher amounts of sulfur in coal. SO2 is dominant at temperatures greater than 700oC, while
SO3 becomes dominant at lower temperatures.
Figure 4: Calculated flue gas composition upon coal combustion
Differences in fuel composition can affect the formation of deposits on the superheater tubes.
Table 1[9] below shows a typical elemental composition of coal compared with other kinds of
fuels used in power generation systems.
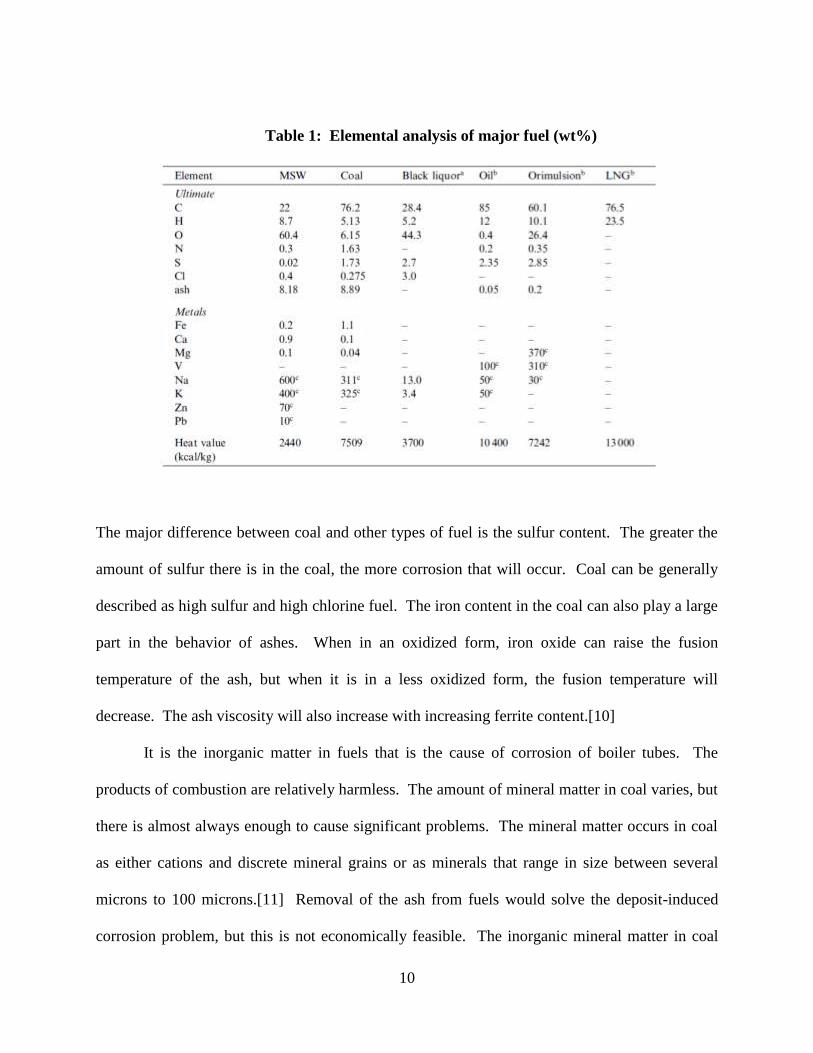
10
Table 1: Elemental analysis of major fuel (wt%)
The major difference between coal and other types of fuel is the sulfur content. The greater the
amount of sulfur there is in the coal, the more corrosion that will occur. Coal can be generally
described as high sulfur and high chlorine fuel. The iron content in the coal can also play a large
part in the behavior of ashes. When in an oxidized form, iron oxide can raise the fusion
temperature of the ash, but when it is in a less oxidized form, the fusion temperature will
decrease. The ash viscosity will also increase with increasing ferrite content.[10]
It is the inorganic matter in fuels that is the cause of corrosion of boiler tubes. The
products of combustion are relatively harmless. The amount of mineral matter in coal varies, but
there is almost always enough to cause significant problems. The mineral matter occurs in coal
as either cations and discrete mineral grains or as minerals that range in size between several
microns to 100 microns.[11] Removal of the ash from fuels would solve the deposit-induced
corrosion problem, but this is not economically feasible. The inorganic mineral matter in coal

11
can be categorized as inherent mineral matter or extraneous mineral matter. Inherent mineral
matter is inorganic materials that were part of the original plant substances that turned into coal.
Some examples of this type of mineral matter are iron, magnesium, calcium, phosphorous,
potassium, and sulfur. Inherent mineral matter constitutes very little of the inorganic matter in
the ash in coals. Extraneous mineral matter is inorganic materials that were added to the original
substances during the process of becoming coal. This is the predominant contributor to the
inorganic matter in the ash in coals. Extraneous mineral matter is roughly 4-7 microns in
size.[12] Table 2[13] lists the common minerals found in coal in order of their abundance.[14]
The main metallic elements are aluminum, iron, calcium, magnesium, titanium, sodium, and
potassium. There are four main groups that all the minerals can be grouped into. These are clay
minerals, sulfates and sulfides, carbonates, and quartz.[15]
Table 2: Occurance of minerals in coal

12
The deposits on superheater parts can be classified into three types: sintered and fused, alkali
matrix, and phosphatic. Sintered and fused deposits are coal ash particles consisting of silicates,
alumina, iron oxide, lime, magnesia, and alkalis that are carried by the flue gas and deposited on
the surface of boiler tubes. Alkali matrix deposits contain large amounts of alkali sulfates.
Phosphatic deposits rarely occur in coal-fired boilers. The average ash from coal contains 55-
60%SiO2, 20-30%Al2O3, 10-15%Fe2O3, about 1% TiO2, P2O5, CaO, and MgO each, and SO3 and
the alkalis about 1%.[10] The most troublesome deposit is sintered deposits of fly ash. Fly ash
can form thick layers on superheater and reheater materials and can reduce heat transfer to the
tube, plug gas passages, and provide the environment in which complex sulfates form causing
corrosion. The sintered deposits will form a layered structure, which is enhanced by the porosity
of the sintered deposit and the temperature gradient.[10] The sintering characteristics of coal ash
are very unpredictable, and are not well understood. The effect of the fly ash deposit particle
size is very important. Smith[16] showed that the sintering temperature decreased as the particle
size decreased.
The inorganic mineral matter in coals turns to ash or slag when heated. The mechanism of
the process of transformation of mineral matter into ash in coal combustion chambers is shown
below in Figure 5[12]. It is a very complicated process, because it is determined by the
composition of the original mineral matter, its size and distribution within the coal, the heating
rate, the mixing of the inorganic matter during combustion, the maximum temperature reached,
time, and turbulence in the gas stream.

13
Figure 5: Mineral matter transformation mechanism
An example of some of the many reactions that occur is when sulfides, kyanites, and marcasite
begin to decompose at 300oC. Under oxidizing conditions, the evolved sulfur is burnt to SO2,
while some may be emitted as H2S in the flue gas. In an oxidizing atmosphere, magnesium and
calcium oxides will react with SO2 to form sulfates, which do not decompose until 1000oC.[10]
The sulfur in coal is stabilized by the formation of these calcium and magnesium sulfates, while
the remaining sulfur will be oxidized to SO2/SO3. Even though coal may have large amounts of
chlorine, NaCl and KCl salts are not able to deposit on the surface. This is because there are
high amounts of SO2/SO3 in the flue gas, so the chlorides react with SO2, O2, and H2O to form
sodium and potassium sulfates according to the following reactions[9],
2NaCl(s) + SO2(g) + ½ O2(g) + H2O(g) = Na2SO4(s) + 2HCl(g) (1)
2KCl(s) + SO2(g) + ½ O2(g) + H2O(g) = K2SO4(s) + 2HCl(g) (2)
Figure 6[9] below shows the condensed compounds in equilibrium with the flue gas that form
when coal is heated. Na2SO4 and K2SO4 become thermodynamically stable at temperatures

14
below 900oC and 800
oC respectively. Na2SO4 and K2SO4 are vapor condensed from the
surrounding flue gas. The corrosion of boiler tubes is from liquid phase alkali iron trisulfates.
These can only form from Na2SO4, K2SO4 and Fe2O3.[9]
Figure 6: Calculated molar quantity of pure compounds of condensed phases in
equilibrium with the flue gas upon combustion of 100g of the coal shown in table 1
2.2.2 Other Types of Fuels
Biomass consists of forestry and agricultural residues. The use of biomass in the power
generation industry usually means wood, energy crops, or straw. Biomass is a renewable energy
form, and it currently provides about 70% of the renewable energy sources worldwide.[2]
Different types of biomass will have different compositions, properties, and costs when used as
fuels. The timing of harvesting biomass can have an effect on its composition, but faster
growing biomass will tend to have higher contents of chlorine and potassium as compared to

15
slower growing biomass. In general, biomass will have lower levels of sulfur when compared
with coal. The corrosion causing deposit when burning biomass is alkali chloride salts, which
can be even more damaging to the metal tubes. Burning biomass alone as a fuel has shown to
have issues with fouling, deposition, and corrosion, but co-firing a small amount of biomass with
coal will reduce SO2 levels formed from combustion.[8]
Waste fuels are very inhomogeneous, and there are many different kinds of waste
including sewage sludge, municipal solid waste, and refuse derived fuels. Waste generally has
lower amounts of sulfur than coal but larger amounts of chlorine, therefore waste fuels can be
considered high chlorine low sulfur fuels.[9] The corrosion causing deposits of waste fuels are
also alkali chlorides. Co-firing of biomass or waste along with coal produces reduced amount of
SO2 in the combustion gas, along with higher steam temperatures which lead to higher efficiency
and more electrical energy produced. Using 5% biomass in a 500 MWe coal power plant
produces 25 MWe, while the same amount of biomass in a biomass only power plant produces
21MWe. Co-firing of biomass and coal also helps in reducing CO2 emissions. It is also
relatively easy to convert a coal-fired power plant into a co-fired plant with minor modifications.
This is relatively inexpensive, and is much less expensive than building a new biomass only
power plant. The allowable amount of biomass mixed with coal has not been determined, but
some reports have shown that 20% biomass can be mixed with coal without having severe
corrosion issues.[2] Oxy-fuel firing technologies use fossil fuels to produce a flue gas stream
composed of CO2 and H2O. The flue gasses in this system need to be recycled. The flue gas
stream does produce CO2, steam, SOx, and HCl levels that are significantly higher than coal
systems, which can lead to increased corrosion. Deposits can also form on the heat exchanger
systems.[8]

16
2.3 FIRESIDE CORROSION
Corrosion from combustion gases can occur in many ways in boilers and gas turbines. Fireside
corrosion occurs by gas phase oxidation along with melted deposits that produce liquid-phase
corrosion. Fireside corrosion can result in general mass loss or by the formation of cracks that
then allow failure by mechanical mechanisms such as fatigue.[2] The temperature range of
interest for boilers and gas turbines is between 650-750oC. Corrosion can be decreased by using
materials with good oxidation resistance at the temperature range of interest. Gas phase
oxidation is not typically a problem as long as alloys are chosen that have adequate oxidation and
spallation resistance. Liquid-phase corrosion results in rapid attack even on stainless steels.
Alloys with high chromium contents above 22wt% show corrosion resistance. Chromium is the
most beneficial alloying element for corrosion resistance. Fireside corrosion is an accelerated
form of corrosion induced from the melting of impurities in coal such as potassium, sodium,
sulfur, and chlorine. The temperature range of interest and the deposits will determine what type
of corrosion will occur. The temperature regimes and corrosion materials are shown below in
Figure 7.[17] At the temperature range of interest, alkali iron trisulfates are the main contributor
to fireside corrosion. The formation of liquid alkali iron trisulfates on the surface of boiler tubes
beneath an ash deposit will cause significant corrosion. Alkali sulfate and alkali chloride
deposits will lead to rapid metal wastage especially when high sulfur coals are burned. The
amount of corrosion will increase with increasing concentrations of SO2 and alkali sulfates. The
temperature that corresponds to the maximum metal loss follows a bell curve with a maximum
between 650-750oC. The curve can be shifted based on alloy composition, SO2 level and alkali

17
content. Alloys with lower corrosion resistance will usually have larger metal loss at lower
temperatures than those with high corrosion resistance. Pitting is the main result of fireside
corrosion.[4,17-18]
Figure 7. Fireside corrosion regimes in coal-fired boilers
2.3.1 Sulfur and Sulfates
There are four main elements in fuels that are the major causes of corrosion. These are sulfur,
vanadium, and the alkalis sodium and potassium. Sulfur is the most serious of these four.
Vanadium occurs only in fuel oils. Sodium and potassium are present in coal, while sulfur is
present in coal and fuel oils. The compounds of sulfur with iron, oxygen, and the alkalis cause
the most corrosion and accumulation of deposits. Sulfur can cause high temperature corrosion
from complex sulfates, or it can cause low temperature corrosion by SO3 reacting with deposits
on the surface of metals (acidic fluxing).[19-20]

18
The amount of sulfur in coals can vary. The normal variation is 1-4%. Sulfur occurs in
coal in three forms: pyrites (FeS2), organic sulfur in the coal itself, and sulfates. Pyritic sulfur is
found in all coals, most likely as bands in the coal bed. Pyrites make up about half of the sulfur
found in coals, and an effective way of removing it from the coal has not been found without
suffering significant coal losses or significant costs. Organic sulfur is part of the complex
mixture of molecules that make up coal, along with carbon, hydrogen, oxygen and nitrogen.
Organic sulfur is uniformly distributed within the coal. After pyrites, half of the remaining
sulfur in coal is organic sulfur. Organic sulfur can only be removed by combustion. Sulfate
occurs as iron sulfate, but the amount of sulfate sulfur is so low that it plays little role in the
many problems that sulfur can cause. The sulfur content in fuel oils depends on where the
original crude oil came from, and this varies from place to place all around the world. Most fuel
oils in the United States contain less than 2% sulfur.[14]
Sulfur is highly reactive, especially with oxygen. SO2 and SO3 are in the products of
combustion where they react to form sulfites, sulfates, and more complex trisulfates that cause
corrosion. The total reaction for the formation of SO2 is given by[10],
H2S + 3/2O2 = H2O + SO2 (3)
The reaction of sulfur and oxygen occurs in many steps, and many of the intermediate steps in
the oxidation of sulfur are unstable and do not last very long, but they all may influence the
amount of reactants formed and the rate of reaction. A list of the reactions involved with the
oxidation of sulfur is given below in Table 3[21].

19
Table 3: Reactions in the oxidation of sulfur
It does not matter what form of sulfur is present in the fuel, combustion will convert it into SO2.
The primary formation of SO2 is by the oxidation of SO. The oxidation of pyrites can also form
SO2. Levy and Merryman [21] studied the formation of sulfur dioxide in combustion reactions
in H2S flames, and determined that the oxidation of SO is the major cause of SO2 formation.
Sulfur trioxide in boiler furnaces and gas turbines can come from reactions within the
flames, oxidation of SO2, and dissociation of complex sulfates. As was mentioned earlier, the
sulfate content in fuels is so small, that it cannot contribute significant amount of SO3 to the flue
gas. The main source of SO3 in the flue gas is by the oxidation of SO2. The amount of SO2 will
determine the amount of SO3 that can form. In boiler furnaces, roughly 1% of the SO2 is
converted to SO3. There are two reactions that can produce SO3.[14]
SO2 + ½ O2 = SO3 (4)
SO2 + O = SO3 (5)

20
The oxidation of SO2 with molecular oxygen only occurs in the presence of a catalyst. Dooley
and Whittingham[22] found that the production of SO3 occurs by the reaction of SO2 with
oxygen atoms, because there is a large concentration of atomic oxygen present in the combustion
flames. Levy and Merryman [21] confirmed this by studying the microstructure of H2S flames.
The maximum amount of SO3 created was found about one flame thickness downstream of the
flame, and remained constant even at further distances from the flame. This can be seen in
Figure 8[23] below. This proves that reaction 4 above is not responsible for the formation of
SO3, because large amounts of O2 and SO2 are present downstream of the flame, but the SO3
level reaches a maximum and then remains constant. If reaction 4 were responsible, the SO3
content would continue to rise.
Figure 8: Formation of SO3 in thin stabilized flame of H2S-O2-N2
Levy and Merryman[21] also calculated the rate constants for the formation of SO3 from two
flames, and found that the same amount of SO3 was created as in boiler furnaces. This shows
21
that the conditions in a boiler furnace or gas turbine will not affect flame-produced SO3. The
amount of SO3 that can be formed from SO2 depends on the temperature and the amount of the
material exposed to the temperature. Lower temperatures will produce higher levels of SO3. At
temperatures 426oC and below, SO3 will dominate the gas, but at temperatures 1093
oC and
above, SO2 will be the major component in the gas.[10] The partial pressure of oxygen will
affect the equilibrium values of SO3. The more oxygen there is in the system, the higher amount
of SO3 that can be created, but even very small amounts of oxygen are capable of oxidizing SO2
to SO3 in equilibrium. It is unusual for equilibrium to actually be reached in actual boiler
furnaces however. The reason is because the reactions do not have enough time to occur. The
flue gas is cooled too quickly for equilibrium to be obtained.[14] When equilibrium levels of
SO3 are approached, there is usually a catalyst involved. There can be homogeneous and
heterogeneous catalysts. In boiler furnaces and gas turbines, homogeneous catalysis is not a
significant factor in the formation of SO3. Platinum is a heterogeneous catalyst that can
accelerate the oxidation of SO2 by O2. Vanadium and iron oxides, specifically Fe2O3, are also
good catalysts and are less expensive. Harlow[24] was the first to find that Fe2O3 could be used
as a catalyst for the oxidation of SO2 by O2. He found that the maximum amount of SO3 formed
was in a specific temperature range (bell shaped curve), and the amount formed was not only
dependent on the temperature, but also the amount of surface exposed.
Deposits of K2SO4, Na2SO4, and Fe2O3 in a 1.5:1.5:1.0 molar ratio exposed at 1100F
(593oC) produced alkali iron trisulfates. This deposit mixture is known from Cain and
Nelson[25] as the “standard corrosion mix”. Since 250ppm SO3 is necessary to produce
trisulfates at this temperature[26], catalysis must be responsible, because there was no SO3 in the
flue gas. Fe2O3 has been shown to be an excellent surface catalyst. Tests from Levy and

22
Merryman[27] have shown that any ferritic alloy with Fe2O3 on the surface will aide in the
oxidation of SO2, while Fe3O4 is an ineffective catalyst. A catalyst can be deactivated with
additives from Group VA and Group VIA on the periodic table, specifically antimony or arsenic.
Arsenic will deactivate platinum, so that it can no longer oxidize SO2 to SO3. Small amounts of
Sb2O3 were shown to drastically decrease the formation of SO3 in the standard corrosion
mix.[14] The deactivating materials are highly toxic substances however, and having these
materials in the flue gas would not be tolerated.
2.3.1.1 Pyrosulfates
Low-melting substances forming liquid films on the surfaces of boiler and gas turbine
materials cause corrosion, and sulfates are the main cause of this. Alkali pyrosulfates such as
K2SO7 and Na2SO7 were thought to be one of the main sulfates that cause corrosion. These
substances have low melting points of 754oF (401
oC) for Na2SO7 and 570
oF (299
o) for K2SO7
and high chemical activity. Studies by Reid showed that the level of SO3 necessary to form the
alkali pyrosulfates is not reached at the temperatures used in boilers and gas turbines.[14] Coats,
Dear, and Penfold [28] examined the partial pressure of SO3 with the temperature of alkali
pyrosulfates. They found that the amount of SO3 needed to produce pyrosulfates at the operating
temperatures of boilers was higher than what is possible to be formed. At lower temperatures,
the SO3 content is high enough to produce pyrosulfates. This can be seen in Figure 9 below[28].
If the temperature is low and the SO3 content is high enough, corrosion from pyrosulfates can
occur.

23
Figure 9: Melting points in the system Na2SO4-SO3 and K2SO4-SO3
The high concentrations of SO3 needed come from the catalytic oxidation of SO2 on the surfaces,
which can create much higher SO3 content than the bulk gas. The mechanism involves the
formation of alkalis on the surface followed by a conversion to K2SO7 and Na2SO7 by the
reaction of sulfates with SO3 and their reaction of oxides grown on the surface. This is shown by
the following reactions[10],
3Na2SO7 + Fe2O3 = 3Na2SO4 + Fe2(SO4)3 (6)
4Na2SO7 + Fe3O4 = 4Na2SO4 + Fe2(SO4)3 (7)
Further oxidation then occurs to replace the oxide scale leading to metal loss according to the
reaction[10],
3Fe + 3O2 = Fe3O4 (10)

24
2.3.1.2 Alkali Iron Trisulfates
Most of the alloys used as boiler tubes are iron-based alloys, and the mobility of iron
from the metal substrate to the oxide/gas interface is fairly rapid, therefore considerable research
has been done on the formation of alkali iron trisulfates and their role in the corrosion of boiler
tubes.[17] Alkali iron trisulfates are the most probable cause of liquid phase corrosion, because
their melting points are in the range of superheater metal temperatures, they have been found in
the areas where corrosion has occurred, and they are highly reactive materials. The melting
points of some alkali iron trisulfates are shown below in Table 4[25].
Table 4: Melting point of complex sulfates
a In high SO3 atmosphere
Alkali iron trisulfates can form from reactions with iron oxides and SO3 in the gas, leading to
further iron oxidation and metal loss[10],
3K2SO4 + Fe2O3 + 3SO3 = 2K3Fe(SO4)3 (9)
4Fe + 3O2 = 2Fe2O3 (10)
The iron oxides in these reactions can come from the oxide scale grown on the metal surface or
from the ash deposits formed on the surface. Na3Fe(SO4)3 forms from a similar reaction, and
these reactions become the basis for determining the standard corrosion mix.[14] At 1100oF

25
(593oC), alkali iron trisulfates formed when the SO3 level was above 250ppm. The amount of
SO3 present in the flue gas is a major factor on the formation of alkali iron trisulfates.[26] The
trisulfates will decompose when heated in non-SO3 atmospheres. The maximum amount of
corrosion was found when deposits contain as much potassium as sodium in a molar ratio at high
temperatures. The ratio changes with temperature, and this shows that the rate of corrosion is
dependent on the melting point. Large amounts of clay minerals such as kaolinite
(Al2O3·2SiO2·2H2O) will dilute the sodium and potassium in the deposit and result in less
corrosion.[2] The reaction of SO3 directly with the superheater metal surfaces is not a significant
source for corrosion.[14]
2.3.2 Mechanism of Corrosion
Metal loss in boilers and gas turbines can occur by gas-phase oxidation, by removal of the
protective scale on metals through chemical reaction with a deposit, or by direct attack of the
metal surface. It is not certain which of these processes is the cause of fireside corrosion, but it
is known that a liquid-phase deposit is needed for corrosion to occur at a significant rate. It may
also be a case of many of these processes acting simultaneously. The formation of molten alkali
iron trisulfates on superheater and reheater tube surfaces is the main cause of fireside corrosion.
The corrosion of boiler metals is hard to replicate in a laboratory, because there are variations in
the fuel and the environment is constantly changing. Some of the non-replicable environmental
problems are that the actual composition of deposits formed on tubes is more complex than
simulated deposits, the SO3 content is variable, large temperature gradients occur, the ash and
flue gas move at varying velocities, the composition of deposits will change with time, and fly-
ash erosion can remove oxide scales exposing base metal.[29]

26
2.3.2.1 Gas-Phase Oxidation
Exposure of metal surfaces to the hot flue gas atmosphere creates an oxide film on the
surface. The alloys used for boiler tubes are typically stainless steels that form a protective and
adherent oxide scale on the surface. The oxidation of metals produces scales that can grow at
linear, parabolic, logarithmic, or cubic rates. The rate is determined by the diffusion of
components through the oxide layer and the reactions at the metal/oxide and oxide/gas interfaces.
The parabolic rate law is the most common, and the one that describes the growth rate of oxide
scales for alloys used in boilers and gas turbines. The parabolic rate law is given by the equation
shown below[30],
x = 2(kt)1/2
(11)
where x is the oxide thickness, k is the rate constant, and t is time. Following this equation, the
rate at which the oxide scale grows will decrease with time until it reaches a rate that is so small
that it can be ignored. If the scale becomes too thick and breaks off, the metal will oxidize
further at a high rate producing more metal loss. Most boiler metals are steels, and are therefore
made out of iron. Unalloyed iron forms a multi-layered, fast-growing, non-protective scale that
is dependent on the oxidation temperature. This can be seen from the iron-oxygen phase
diagram shown below in Figure 10[30].

27
Figure 10: The iron-oxygen phase diagram
At temperatures above 570oC, iron will form an oxide scale consisting of FeO, Fe3O4,
and Fe2O3 in order from the metal surface and in order of scale thickness. The relative
thicknesses of the layers are given by the ratio, FeO:Fe3O4:Fe2O3 roughly 95:4:1.[30] FeO does
not form below this temperature. Most metals used for boiler or gas turbine hardware are
stainless steels or nickel based alloys. These alloys usually have significant amounts of
chromium in them in order to slowly grow a protective layer of chromium oxide (Cr2O3) on the
surface. This is known as selective oxidation. There is a critical amount of chromium needed in
an alloy in order to form this external protective scale. If the critical amount of chromium is not
met, then a non-protective internal oxide scale will form. The critical amount for the transition
from internal to external oxidation can be determined from equation 12 given below[30], where
NoCr is the critical amount of chromium needed to form protective oxide layer, ν is the
stoichiometric constant, g* is a material constant, NO
(s) is the oxygen solubility in the metal, DO is

28
the oxygen diffusion coefficient through the metal, Vm is the volume of the metal, DCr is the
chromium diffusion coefficient through the metal, and Vox is the volume of oxide.
(12)
The amount of chromium needed can be influenced by all of the parameters in the equation given
above. Conditions that decrease the inward flux of oxygen, such as lowering the partial pressure
of oxygen, or conditions that increase the outward flux of chromium, such as cold working the
alloy, will decrease the amount of chromium needed in order to produce an external protective
scale. There is also a critical amount of chromium needed in order to maintain the external
protective oxide scale. This is given by the equation shown below[30], where kp is the reaction
rate constant.
(13)
Most stainless steels used in high temperature applications are designed with chromium
contents in excess of 20% in order to meet these requirements. Even with high chromium levels,
iron ions will eventually diffuse through the chromia scale and a non-protective iron oxide layer
will form. Austenitic stainless steels also contain large amounts of Ni, because Ni is an
austenitic stabilizer, which are highly corrosion resistant materials. Nickel also enhances
ductility and hardness. Pure nickel forms only one oxide scale, and that is NiO. This grows by
the outward migration of cations and electrons, and it follows the parabolic rate law. The NiO
scale is a slightly more protective scale and grows at a slower rate than pure iron, but it still
requires selective oxidation at high temperatures for protection. Like the stainless steel alloys,
the nickel based alloys used at high temperatures contain significant amounts of chromium in
order to form the slowly growing external protective Cr2O3 scale. In any metal alloy that forms a

29
protective oxide layer on the surface, transient oxides of the base element can form before the
protective oxide layer. This can increase the amount of alloying element such as chromium
needed to form the protective external scale. The extent of the transient oxides is decreased by
the factors that promote selective oxidation, such as higher chromium contents, reduced oxygen
pressures, and cold working. Any rupture of the protective chromia scale will expose a lower
chromium content alloy and return it to its transient state, causing more metal loss.[30]
Typically gas-phase oxidation in boiler atmospheres does not lead to significant metal loss in
boiler tubes and gas turbine hardware unless chlorides or low-melting oxides remove the usually
protective oxide scales.
2.3.2.2 Liquid-Phase Corrosion
The presence of liquid is usually necessary in order for significant corrosion to occur.
This is because chemical reactions are faster whenever liquids are present, liquids more
effectively insulate the alloy from the gas, and because liquids provide an electrolyte for
electrochemical attack. Different areas of the metal will act as cathodes and anodes. With a
highly ionized melt, electrons will transfer from anode to cathode, so that anodic iron will
oxidize.[14] The oxidation rate depends on the concentration of dissolved metal, the amount of
oxygen and sulfur oxides in the melt, and the presence of other substances. A voltametric
analysis of molten alkali sulfates showed that the degree of corrosion of iron will depend on the
amount of SO3 in the molten sulfate on the surface of the metal.[31] The rate of dissociation of
the sulfate ions will determine the rate of corrosion. The SO3 concentration in the molten sulfate
is the equilibrium concentration at that temperature, and deposits of varying thickness will cause
different SO3 concentrations at the metal surface, setting up a corrosion potential gradient.

30
Figure 11[3] below, shows the temperature distribution through a superheater tube under typical
operating conditions.
Figure 11: The general temperature distribution through a superheater tube, the
oxide, and the deposit
The heat flux will be the least in the areas where the ash is the thickest, and there will be the least
amount of metal loss where the deposit is the thickest, directly in front of the flue gas stream.
Metal wastage is the largest at the edges of the deposit at the “five o’clock and seven o’clock
positions”, where the temperature gradient is the largest. As mentioned before, if the
temperature is low and there are high amounts of SO3, then pyrosulfates can cause corrosion.
The temperature regimes in the present study were not in this range. The corrosion being
analyzed was in the temperature range where alkali iron trisulfate is the main cause.
Alkali iron trisulfates such as Na3Fe(SO4)3 and K3Fe(SO4)3 are the main causes of
corrosion in superheater and reheater tubes in boilers, and they have always been found in the
areas where corrosion is occurring. It has been determined that metal wastage can occur due to
the chemical reaction of iron oxide scales with alkali sulfates in the flame in the presence of
31
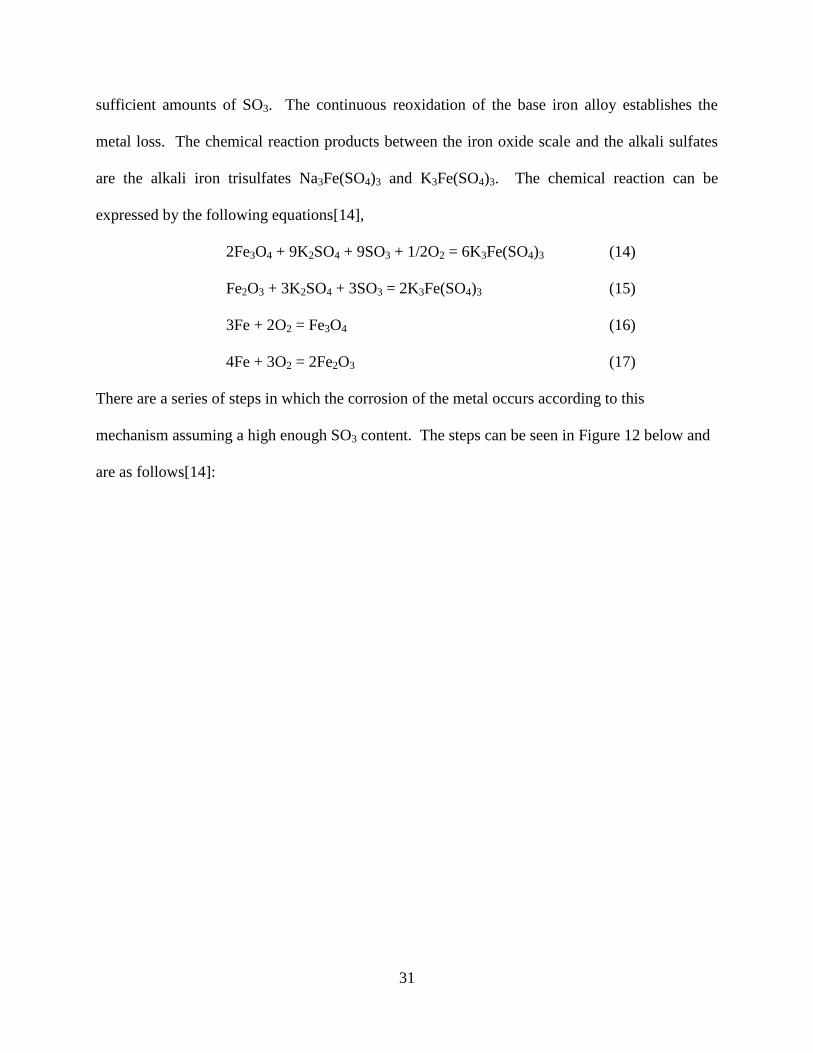
sufficient amounts of SO3. The continuous reoxidation of the base iron alloy establishes the
metal loss. The chemical reaction products between the iron oxide scale and the alkali sulfates
are the alkali iron trisulfates Na3Fe(SO4)3 and K3Fe(SO4)3. The chemical reaction can be
expressed by the following equations[14],
2Fe3O4 + 9K2SO4 + 9SO3 + 1/2O2 = 6K3Fe(SO4)3 (14)
Fe2O3 + 3K2SO4 + 3SO3 = 2K3Fe(SO4)3 (15)
3Fe + 2O2 = Fe3O4 (16)
4Fe + 3O2 = 2Fe2O3 (17)
There are a series of steps in which the corrosion of the metal occurs according to this
mechanism assuming a high enough SO3 content. The steps can be seen in Figure 12 below and
are as follows[14]:

32
Figure 12: Mechanism of fireside corrosion of steel surfaces by removal of oxide
film to form K3Fe(SO4)3
A. An iron oxide scale grows on the surface of the metal tube.
B. Alkali sulfates such as K2SO4 that form from alkalis in the coal and the fuel ash
and sulfur oxides in the atmosphere are deposited on the oxide scale.
C. The outer surface of the alkali sulfate layer becomes sticky due to an increasing
temperature gradient, and this causes particles of fly ash to become captured on
the surface. The temperature in the captured fly ash increases to the point that
SO3 is released by thermal dissociation of the sulfur compounds in the ash. The
released SO3 migrates towards the cooler base metal surface, and a layer of slag
forms on the outer surface.

33
D. More ash is collected reaching a steady-state thickness. The temperature
decreases in the alkali sulfate layer, which causes a reaction with the oxide scale
and SO3 occurs to form alkali iron trisulfates. This removes the oxide scale,
which causes the base metal to reoxidize further causing metal wastage.
E. Deslagging then occurs exposing the alkali iron trisulfate layer to temperatures
high enough to dissociate it releasing SO3. Part of this released SO3 moves
toward the cooler part of the deposit, where it reacts with K2SO4 present and the
oxide scale to form more alkali iron trisulfates. This leads to further oxidation of
the scale and more metal loss.
This cycle can repeat indefinitely because there is no loss of alkalis except for the small amount
lost due to deslagging. More alkalis can also be deposited from the flue gas after each
deslagging event. The high SO3 content needed for this reaction can come from the gas
atmosphere and the catalytic oxidation of SO2 with Fe2O3 as discussed earlier. The adherence of
the ash deposits on the oxide scale is dependent on the characteristics of the oxide and the
deposit. Because there is not a large difference in thermal expansion coefficients, the deposits on
steel boiler tubes are very adherent and can become very difficult to remove. The deposits have
been shown to peel off easily from austenitic stainless steels when cooled.[10] K3Cr(SO4)3 has
not been found in deposits, and so that shows that chromium oxide will resist corrosion from this
mechanism, which explains why high chromium content alloys are more resistant to fireside
corrosion. Calcium and magnesium in coal ash will inhibit the formation of alkali iron
trisulfates, because they will preferentially form relatively harmless K2SO4·2CaSO4.
Cain and Nelson[32] came up with a corrosion mechanism in which the alkali iron
trisulfates are formed within the ash deposit. They showed that the “standard corrosion mix”

34
mentioned previously subjected to the flue gas of 3.6%O2 and 0.25%SO2 produced molten alkali
iron trisulfates. The trisulfates formed in fireside ash deposits by the reaction of Fe2O3 in the ash
with alkali sulfates and SO3, and they traveled through the ash deposit to the metal tube surface
by means of a thermal gradient in the deposit. The molten trisulfates react with the base tube
metal according to the reaction,
9Fe + 2K3Fe(SO4)3 = 4Fe2O3 + 3FeS +3K2SO4 (18)
A sulfide scale is formed in this reaction. Sulfides are not frequently found in the corrosion
regions where trisulfides are present, so this corrosion mechanism must remove the results of
sulfide penetration. This mechanism is shown below in Figure 13[32].
Figure 13: Coal-ash corrosion cycle
This mechanism proposes that only iron and oxygen are consumed and that Fe3O4 is the only
product. Alkali sulfates and FeS are recycled by the FeS reoxidizing to SO2 which then oxidizes
further to SO3, which then again reacts with Fe3O4 and alkali sulfates to produce more alkali iron
trisulfates, which repeats the cycle. The only problem with this corrosion mechanism is that the
metal loss occurs only by direct attack of the base tube metal by the alkali iron trisulfates. The
35
base tube metal will most likely form an iron oxide layer on the surface at the temperatures of
interest, so that the exposed surface of the tube is iron oxides. Cracks in the oxide layer on the
tube would expose base metal, and the proposed mechanism by Cain and Nelson could then
occur, but the amount of metal loss this way would be small. Diffusion of the liquid through the
oxide scale would also be limited. Erosion from ash particles flying at a high velocity can
remove the protective oxide scale and accelerate corrosion from the mechanism by Cain and
Nelson. The formation of alkali iron trisulfates as proposed by Corey and Reid is the most likely
corrosion mechanism, although both may occur, the one proposed by Corey and Reid is the
dominant one.[14]
Corey et.al.[33] showed that sulfides could also be present from unburned pyrites in the
coal. The mechanism for large amounts of FeS in the regions of heavy corrosion is as
follows[14],
A. Alkalis from the fuel are deposited on the oxide scale surface as alkali sulfates.
B. Unburned coal particles and pyrites become adherent to the tube surface and form a
thick deposit layer.
C. The pyrites oxidize to FeS and Fe3O4, with evolved sulfur forming SO2 and SO3 in the
deposit.
D. The sulfur oxides form small quantities of alkali iron trisulfates leading to a loss of
some metal.
In places where combustion is complete and there is no unburned fuel or pyrites able to reach the
surface of the metal tube, this mechanism is unlikely when compared to the trisulfates.
Shi et al.[34] studied the effects of different deposits on the rate of fireside corrosion of
Fe-Al alloys. They found that for a Fe-10%Al alloy, the corrosion rate for a K2SO4 + Na2SO4

36
deposit was twice as high as for deposits of just K2SO4 or Na2SO4 alone. The corrosion rate was
at a maximum at 650oC, and it increased with increasing SO2 and SO3 in the atmosphere and
decreased with increasing aluminum content. This is similar to deposits of Na2SO4 alone. The
corrosion kinetics curves for the deposits of K2SO4 + Na2SO4 and for Na2SO4 both show a linear
segment, but the curve for K2SO4 + Na2SO4 became linear much earlier and was linear for a
longer time. This can be seen in Figure 14[34] below.
Figure 14: Oxidation kinetics of Fe-10Al Alloy exposed to O2-0.5% (SO2+SO3) at 650oC: (a)
Na2SO4-K2SO4, (b) Na2SO4 alone, and (c) K2SO4 alone
The addition of K2SO4 to the deposit does not change the corrosion mechanism, but it does
significantly increase the corrosion rate. Sulfation tests also showed that the critical amount of
SO3 needed to cause the eutectic to melt is dependent on the temperature and decreases by more
than an order of magnitude when K2SO4 is added to the deposit. This can be seen in Figure
15[34] below.

37
Figure 15: SO3 levels required to stabilize eutectic melts: (a) Na2SO4-iron trisulfates
and (b) K2SO4-iron trisulfates
The time at which the eutectic melts correlates to the start of the linear portion of the corrosion
kinetics curve. The eutectic is melting earlier when K2SO4 is added to the deposit. The
accelerated corrosion was found to occur not because of the formation of complex sulfates or the
sulfation of Fe2O3, but because of the earlier formation of the eutectic melt.
Other fuels containing high amounts of vanadium or chlorine may also cause significant
corrosion. Vanadium forms many low-melting compounds with sodium that become molten at
the temperatures used in boiler superheaters and gas turbine blades. The corrosion caused by
vanadium can come from a number of different mechanisms, but it is generally agreed that
vanadium in the presence of oxygen and sulfur can cause significant metal wastage. Chlorine
contributes to corrosion at high temperatures through either the formation of volatile chlorides or
complex sulfates. Corrosion will occur when high amounts of chlorine are available, but it also
occurs when there is no chlorine. It can be said that chlorine is a contributor to fireside
corrosion, but it is not a major factor.[14]
38
2.3.3 Alloys for Use in Boilers and Gas Turbine Hardware
The main components in advanced combustion technologies that require high performance are
high pressure steam piping and headers, superheater tubing, and waterwall tubing. With the
advancement of new combustion technologies, higher thermal efficiency is needed, and so
materials must be able to have high strength at increasing temperatures. Part of the research that
was conducted for this thesis was for superheater tubing components for oxy-fuel combustion.
These components must have high creep strength, thermal fatigue strength, weldability,
resistance to fireside corrosion, and resistance to steam side oxidation and spallation.
Martensitic or ferritic stainless steels would be beneficial from thermal fatigue strength and cost
perspectives. However, the strongest of these materials can really only be used at temperatures
as high as 620oC, and even lower temperatures when fireside corrosion is being considered.
Poor resistance to steam side oxidation and spallation can cause severe problems such as a loss
of cross-section and an increase in temperature due to a decrease in heat transfer that can lead to
premature creep failure.[35] Fireside corrosion of superheater tubes by liquid alkali iron
trisulfates causes severe problems. High strength ferritic stainless steels such as T91 are
frequently used in these applications. The standard metal alloys are T-22 for lower temperatures
and SS304 or SS347 austenitic stainless steels for higher temperatures. At increased
temperatures, stronger and more advanced austenitic stainless steels or nickel based alloys will
be needed.[35] Alloys that have inferior corrosion resistance will have significant metal wastage
at lower temperatures than those with greater corrosion resistance. For advanced ultra-super-
critical combustors, only advanced austenitic stainless steels or nickel based superalloys will be
able to be used, but the high price of nickel based alloys places most emphasis on advanced
austenitic stainless steel development.

39
Figure 16: Evolution of ferritic steels for boilers
The evolution of ferritic stainless steel development is shown above in Figure 16[35].
The evolution includes additions of Mo, V, and Nb to simple 9-12%Cr alloys in the 1960’s and
1970’s, with optimization of these alloying additions coming in the 1970’s and 1980’s, followed
by additions of Mo and W in the 1990’s. Tungsten, molybdenum, and cobalt are solid solution
strengtheners. Niobium and vanadium are precipitation strengtheners forming very fine coherent
precipitates in the ferrite matrix. Chromium adds solid solution strength as well as oxidation and
corrosion resistance. Nickel improves toughness, but decreases the creep strength of the alloy.
Carbon is added to form fine precipitation strengthening carbides, but it must be kept relatively
low for weldability considerations. Cobalt is also an austenitic stabilizer, promotes the
nucleation of secondary carbides on tempering, and slows the coarsening of carbides. Ferritic
stainless steels are mainly developed for use in thick section pipes and headers.[35]

40
Austenitic stainless steels are used for higher temperature applications because of their
increased corrosion resistance due to increased chromium and nickel additions. Development of
alloy additions to typical 18Cr-8Ni austenitic stainless steels and on very oxidation resistant 20-
25Cr stainless steels is focused on improving the creep strength. Austenitic stainless steels are
used in superheater tubing where fireside corrosion resistance and creep strength are important.
They can be placed into four categories based on their chromium contents. These are 15%Cr,
18%Cr, 20-25%Cr, and >25%Cr. The standard alloy has 18Cr-8Ni, but increasing alloy
development has led to the formation of 25Cr-20Ni stainless steels, which are much more
corrosion resistant. The development of these alloys involves the additions of Ti, Nb, and Mo to
stabilize the stainless steels. Ti, Nb, and Mo preferentially form carbides at the grain boundaries
instead of chromium carbides that deplete the grain boundaries of chromium causing decreased
corrosion resistance. Reducing the amount of Ti, Nb, and Mo, while adding C promotes creep
strength while decreasing corrosion resistance. A balance between the two must be met. Cu
additions will add precipitation strengthening, and small additions of N and W add solid solution
strengthening.[35] Three advanced austenitic stainless steels that have been developed for ultra-
super-critical conditions are TP347H, Super304H, and HR3C. These alloys have alloying
additions Nb, Ti, Mo, Cu, N, and C for the reasons listed above. Chi et al. studied the
microstructures and high temperature creep properties of these alloys.[36]

41
Figure 17[35] below shows a plot of the allowable stress versus temperature, comparing
the high temperature capabilities of certain classes of alloys.
Figure 17: Allowable stress for various classes of alloys
The nickel based alloys are superior to the austenitic stainless steels, which are superior to the
ferritic stainless steels. From a creep perspective, ferritic stainless steels are useful up to about
620oC. Austenitic stainless steels are useful up to about 675
oC, and higher temperatures require
nickel based alloys. Viswanathan et al.[35] studied various ferritic stainless steels, austenitic
stainless steels, and nickel based alloys in steam oxidation and fireside corrosion tests. The
steam side oxidation tests were conducted at 650oC and 800
oC. The austenitic stainless steels
and nickel based alloys fared better than the ferritic stainless steels and showed no spallation at
650oC. An adherent protective chromium oxide scale formed over the alloys. The tests
conducted at 800oC showed that regardless of the type of alloy, if it had over 10%Cr, then the
oxidation resistance was roughly the same. Some of the ferritic alloys fared as well as the
austenitic and nickel based alloys. All of the metals showed worse corrosion resistance at 800oC
than at 650oC. The fireside corrosion tests were performed with three different types of coals,

42
Eastern, Midwestern, and Western. Eastern and Midwestern coals typically have more sulfur,
and are therefore more corrosive. The alloys tested with Eastern and Midwestern coals had more
metal wastage than those tested with Western coals. The corrosion resistance increased with
increasing chromium content. At 650oC, the attack was more surface oriented, while at 800
oC
the attack was more subsurface oriented. Molybdenum containing alloys suffered more
corrosion than non-molybdenum containing alloys. Latham, Flatley, and Morris[37] studied the
corrosion rates of some typical stainless steel alloys that could be used in coal-fired boilers. The
variation in the corrosion resistance between the different alloys tested was not great, but they
found that if a standard austenitic stainless steel is to be used, then additions of at least 25%Cr
gives increased corrosion resistance, 1%Nb decreases intergranular penetration, and 1%Si is also
beneficial. Stein-Brzozowska et al.[1] performed fireside corrosion tests on three austenitic
alloys with varying chromium contents (18-25%) at 650oC in typical air fired and oxy-fuel
combustion atmospheres. The oxy-fired combustion tests produced more corrosion of the metal
alloys than the air fired tests, probably due to the increased SO2 partial pressures that result from
oxy-firing. A uniform and protective chromium oxide scale is able to be formed with increasing
chromium content in the alloy.
Natesan et al.[17] also performed fireside corrosion tests on some model and commercial
stainless steels and nickel based alloys. The iron-based alloys had chromium contents in the
range of 18-25%Cr, along with additions of Nb, Mo, V, N, Ti, and Ta to improve creep strength.
The nickel based alloys had chromium contents in the range of 21-28%Cr, increased Mo
contents, and additions of Al and Si. The tests were conducted with synthetic ash with varying
amounts of Al2O3, SiO2, Fe2O3, Na2SO4, NaCl, and K2SO4 at temperatures ranging from 650oC-
800oC in an atmosphere containing 1%SO2. The corrosion rates for the iron-based alloys tested

43
showed a bell-shaped curve with a maximum at 725oC. The addition of NaCl to the deposit
increased the corrosion rate for iron-based alloys. The NaCl will attack the precipitated carbides
there to strengthen the alloy, and it will also form volatile chlorides that cause a non-protective
porous scale. The corrosion of the nickel based alloys was more local and in the form of deep
pits. The nickel based alloys did have lower corrosion rates than the iron-based alloys,
especially with the deposit that included NaCl. This is because the vapor pressure of NiCl2 is
much lower than for the chlorides formed with the iron-based alloys. Cross-sectional images
show that the attack looks to be from a low temperature hot corrosion mechanism caused by
liquid eutectic alkali iron trisulfates.
Simms et al.[2] performed fireside corrosion tests comparing air and oxy-firing for a co-
fired biomass boiler on typical ferritic and austenitic stainless steels as well as some nickel-based
alloys. The synthetic deposits used on the alloys had varying amounts of Al2O3, SiO2, Fe2O3,
Na2SO4, and K2SO4, with the most corrosive being a stoichiometric mix of Na2SO4, K2SO4, and
Fe2O3. The other oxides dilute the effects of the sulfates. In the absence of any deposit, the oxy-
fired specimens had more corrosion than the air-fired. This is most likely due to the increase in
CO2, H2O, and SO2 in the oxy-fired atmosphere. The lower chromium content ferritic stainless
steels such as T92 suffered the most corrosion. The alloys tested with higher chromium contents
performed the best and had the smallest oxide scales grown on the surface. This includes nickel
and iron-based alloys. The alloys had more corrosion in the oxy-fired tests than in the air-fired
tests, most likely due to the increased amounts of steam, CO2, and SO2. Cross-sections of the
stainless steels showed that there was internal molten deposit penetration of the scales, as sulfur
and potassium were found to have penetrated deep into the scale.

44
Foster Wheeler Corporation[4,18,29] has also conducted fireside corrosion tests on high
strength ferritic and advanced austenitic stainless steels as well as some nickel-based alloys. The
evaluation of the alloys in fireside corrosion tests was done in three steps. Laboratory tests with
different alloys, temperatures, deposits, and gas atmospheres were conducted to screen for the
highest performing alloys. These alloys were then made into corrosion probes that were tested in
the superheater and reheater sections of actual coal fired boilers. The third process was testing
the best alloys under pressure in actual boiler operating conditions. They found that alloys with
higher chromium contents, specifically those with greater that 25%Cr had adequate corrosion
resistance. Alloys with high molybdenum contents had more corrosion than those without
molybdenum. Tantalum, aluminum and silicon were beneficial. The tests performed in eastern
coals, which contain higher amounts of sulfur, exhibited the typical attack from liquid alkali iron
trisulfates, while the tests conducted in the western coals, exhibited atypical corrosion due to
sulfidation from the presence of calcium sulfides in the coal. There was significantly more
corrosion from the alloys tested in the Eastern and Midwestern coals, than from the western
coals.
2.4 SODIUM SULFATE-INDUCED HOT CORROSION
Alloys used in the combustion process of gas turbine engines, especially those used in marine
applications, can undergo an aggressive form of corrosion associated with the formation of a salt
deposit, which is usually sodium sulfate, on the surface of the metal or thermally grown oxide.
This type of corrosion is called hot corrosion. The Na2SO4 deposits on the gas turbine hardware
can be directly deposited from ingested sea salt, or they can be condensed from a vapor

45
phase.[38] Vapor phase condensation occurs when the common fuel impurity, sulfur, is oxidized
to form SO2 and/or SO3 in the combustion section of the engine. These gases then react with
oxygen and NaCl vapor. If the surface of the turbine hardware is below the dew point of
Na2SO4, then a condensed salt deposit will form. Bornstein and Allen[39] investigated the
mechanism of salt deposition on the surface of turbine hardware, and determined that the direct
impact of ingested sea salt particles on the turbine hardware is likely to be the main deposition
mechanism. The amount of hot corrosion caused is determined by the composition and amount
of Na2SO4 deposit, gas atmosphere, temperature, cycling, erosion, and alloy composition.[30]
Once a deposit has been formed on the surface of combustion hardware, the amount of corrosion
will depend significantly on whether or not the deposit melts. If the temperature of the
combustion environment is above the melting point of Na2SO4 (Tm = 884oC)[40], the corrosion is
called type I hot corrosion or high temperature hot corrosion. Below the melting point of
Na2SO4, the salt deposit can become molten because of a reaction between the combustion gas
and the oxide scale grown on the alloy. This type of corrosion is called type II hot corrosion or
low temperature corrosion. In the research presented, these two types of hot corrosion will be
compared to the corrosion mechanisms of fireside corrosion as well as corrosion of disk alloys.
They will be discussed in the sections to follow.
2.4.1 Stages of Corrosion
Hot corrosion occurs in two stages. There is an initiation stage, in which the rate of corrosion is
slow and resembles that of oxidation without a deposit, and there is a propagation stage in which
rapid and possibly catastrophic corrosion occurs.[30] The stages are demonstrated in Figure

46
18[30] below, which is a plot of weight change per area versus time for IN-738 exposed to Type
I hot corrosion conditions with 1 mg/cm2 sodium sulfate deposit.
Figure 18: Isothermal mass change versus time for IN-738. The data consists of an
initiation stage and a propagation stage with large weight changes (dashed line gives
arbitrary end of initiation stage).
Examining the plot in Figure 18, the two distinct stages of corrosion can be seen. During the
initiation stage, the weight change is very small, showing that there is little or no severe
corrosion occurring. The propagation stage occurs when the weight gains start to become large
due to rapid oxidation, and this signifies the occurrence of significant corrosion. The initiation
stage of an alloy is very important. Corrosion resistant alloys are able to increase the initiation
stage of corrosion, so that the alloy may be used for longer periods of time before failing. The
length of the initiation stage can vary from seconds to hundreds of hours, and it is determined by
the alloy and the combustion environment.

47
2.4.1.1 Initiation Stage
During the initiation stage of hot corrosion, the alloy undergoes a process similar to
simple oxidation. The metal will oxidize and the gaseous species, typically oxygen will be
reduced to form an external oxide scale. The difference between the initiation stage and simple
oxidation is that during the initiation stage of hot corrosion, the reducing species comes from the
salt deposit, and the alloy or oxide scale is being altered so that it is more susceptible to rapid
degradation. The oxide scale/salt interaction can lead to extremely corrosive conditions as the
salt becomes basic or acidic. At the end of the initiation stage, the salt deposit becomes
sufficiently basic or acidic in order to cause rapid degradation, and the propagation stage begins.
In many cases, the end of the initiation stage occurs when the deposit becomes liquid and
penetrates the oxide scale and spreads along the alloy/scale interface. The presence of the liquid
deposit in this region where the oxygen activity is low and the element producing the protective
alloy is depleted produces severe corrosion and starts the propagation stage.[30]

48
Figure 19: Thermodynamic stability diagram for the Na-O-S system at constant
temperature
A phase stability diagram for the Na-S-O system is shown in Figure 19[30] above. The
initially deposited salt is in the Na2SO4 phase field and is defined by the two axis logpo2 and –
logaNa2O. The diagram shows the compositional changes that can happen to the initial salt
deposit during the initiation stage of hot corrosion. The salt may become more basic (higher
Na2O) or more acidic (lower Na2O) when interacting with the base alloy and its oxides. Giggins
and Pettit[41] outlined some of the factors that affect the reactions that occur during the initiation
stage as well as its duration. These are summarized below.
Alloy Composition: The initiation stage is longer for Co-based alloys than Ni-based alloys under
Type I hot corrosion conditions. The reverse is true under Type II hot corrosion. Increased
aluminum contents in Ni-Cr and Co-Cr alloys increases the initiation stage of hot corrosion. The
addition of more aluminum produces a protective Al2O3 scale that is able to be retained for

49
longer times. Increasing the chromium content in alloys is also beneficial, and is the main
element added for corrosion resistance. Larger chromium contents enable a protective Cr2O3
scale to be formed and be maintained for longer periods of time.
Alloy Fabrication: The hot corrosion of alloys can be influenced by the fabrication condition.
As-cast alloys can be more susceptible to corrosion than a vapor deposited alloy, because of
compositional inhomogeneity. The corrosion will initiate in areas that may be depleted in
chromium or aluminum due to the inhomogeneous as-cast nature.
Gas Composition: The gas composition can have a significant influence on the initiation of hot
corrosion. This is especially true for low temperature Type II hot corrosion, where corrosion
occurs at temperatures below the melting point of Na2SO4. At these temperatures, the amount of
SO3 in the gas influences the duration of the initiation stage, and the amount of corrosion that
will occur. In an atmosphere of just oxygen at 700oC, the initiation stage can go on indefinitely,
because the presence of SO3 is required for Type II hot corrosion. This will be discussed in more
detail in the later section entitled Type II hot corrosion.
Salt Characteristics: The composition of the salt deposit can have an effect on the hot corrosion
of the alloy. For hot corrosion, salt deposits with NaCl mixed with Na2SO4 can have a different
effect than pure Na2SO4 deposits. The composition of the deposits in fireside corrosion also has
a significant effect on the amount of corrosion that occurs. This will be explained in later
sections.
The amount of salt that is deposited will also affect the corrosion of the alloy. The
amount of salt on the alloy is important, because some modes of corrosion are not self-
sustaining, and the more salt that there is to consume and cause corrosion, the more corrosion
will occur. Some alloys need the right composition of salt in order to induce attack. The amount

50
of salt may influence that amount of time for the deposit to react with the alloy to create the right
composition needed to initiate attack. There may also be a limiting deposit thickness. For some
propagation modes a thin deposit is more corrosive, while for others a thick deposit may be more
corrosive. The amount of corrosion of Ni-based alloys under Type I and Type II hot corrosion
conditions was found to be significantly less when the metal was submerged in salt compared to
when there was a deposit of 1-8mg/cm2.[42] This can be compared to fireside corrosion, in
which there is the least amount of metal wastage where the deposit is thickest, as was explained
earlier.
Temperature: It is generally accepted that a molten salt deposit is needed for hot corrosion. At
higher temperatures above the melting point of Na2SO4, where Type I hot corrosion occurs, the
deposit melts and significant corrosion occurs, however the initiation stage may be shorter at
900oC than at 1000
oC. The attack can be less severe as the temperature increases because less
salt can be deposited on the alloy as the temperature increases. For Type II hot corrosion, the
salt deposit becomes liquid at lower temperatures, around 700oC, in the presence of SO3 gas. At
higher temperatures, there are insufficient amounts of SO3 in the gas to cause a liquid deposit.
The deposit will remain solid, and less corrosion will occur. This will be explained in later
sections.
2.4.1.2 Propagation Stage
Once the initiation stage has occurred and the alloy or oxide scale has been altered, the
propagation stage occurs and the alloy becomes seriously degraded. There are three main types
of propagation stages that can occur. These include alloy-induced acidic fluxing, basic fluxing,
and gas phase-induced acidic fluxing. The first two listed here occur at high temperatures (above
900oC) and are therefore categorized as Type I hot corrosion. The third kind of propagation

51
mechanism, gas phase-induced acidic fluxing, occurs at lower temperatures (650-750oC) and is
categorized as Type II hot corrosion. The type of propagation stage that occurs is dependent on
what happens to the alloy and the oxide during the initiation stage, and it is therefore dependent
on all of the variables listed in the previous initiation stage section. There are similarities and
differences between the different propagation mechanisms, and therefore it might not be
appropriate to label the corrosion of an alloy as one specific type of corrosion. There are some
gray areas regarding which type of corrosion is occurring. The corrosion mechanisms for Type
II hot corrosion, fireside corrosion and corrosion of some disk alloys will be compared in this
thesis. It will be discussed later, but even though the tests were done at 700oC, some of the
corrosion mechanisms of the alloys tested were similar to Type I alloy-induced acidic fluxing.
The salt that is the cause of hot corrosion attack is typically Na2SO4. It is an oxyanion
salt that exhibits an acid-base relationship with SO3(g) being the acidic component and Na2O(s)
being the basic component. The composition of the Na2SO4 melt at a fixed temperature can
therefore be described by the oxygen partial pressure and the activity of Na2O in the melt, aNa2O,
or the SO3 partial pressure, because it is related to the activity of Na2O by equation 19 shown
below.[43]
Na2SO4 = SO3 + Na2O (19)
The product of aNa2O·pSO3 is equal to an equilibrium constant K at a fixed temperature. This
relationship is used to determine the acidity or basicity of Na2SO4, which was demonstrated in
Figure 19. Thermodynamic stability diagrams are able to show the phases that can be stable
during hot corrosion. These diagrams have axes of logpo2 and –logaNa2O, and the

52
thermodynamically stable phase under the given conditions is shown. An example of this is
shown in the diagram given below in Figure 20[44], which is the Cr-S-O system at T = 1200K
superimposed on the Na-S-O stability diagram.
Figure 20: Isothermal stability diagram of the Cr-O-S System superimposed onto
the Na2SO4 portion of the Na-S-O stability diagram for T=1200K
From the diagram in Figure 20, we are able to determine if a protective Cr2O3 scale will
be able to grow or will dissolve in the presence of the salt deposit, and if it does dissolve, what
solutes will be able to form. In this diagram, we are able to see that the Cr2O3 scale will dissolve
into basic solutes of Na2CrO4 or NaCrO2 or in acidic conditions, the acidic solutes of CrS and
Cr2(SO4)3. Thermodynamic stability diagrams for other oxide scales were completed by Rapp
and coworkers as well as Deanhardt and Stern and can be seen in references [44-48]. They also
produced solubility curves for a number of oxides in Na2SO4 as a function of the activity of

53
Na2O in the melt. This was done by using high temperature reference electrodes at pO2 = 1atm
and T = 1200K. Some of the typical solubility curves of a number of the oxides are shown
below in Figure 21[44].
Figure 21: Measured oxide solubilities in Na2SO4 at 927oC and 1 atm O2
The solubility minima of these oxides occurs over six orders of magnitude, which show that the
salt chemistry is extremely important on the amount of hot corrosion.
As was mentioned earlier, the solubility plots shown in Figure 21 are for a constant pO2 =
1 atm, but some of the oxides will be dependent on the oxygen partial pressure. This can be seen
from the basic dissolution reaction of Cr2O3 in Na2SO4 shown in equation 20 below.
Cr2O3 + 2Na2O + 3/2 O2 = 2Na2CrO4 (20)

54
The Cr ion is oxidized from a Cr3+
ion to a Cr6+
ion during the dissolution, and so the solubility
of Cr2O3 will increase as a function of pO2. Alumina does not have this effect. This can be seen
from the dissolution reaction shown in equation 21 below.
Al2O3 + Na2O = 2NaAlO2 (21)
There is no change in valence of the Al3+
ion during the dissolution, and the solubility of Al2O3
in Na2SO4 is therefore independent of oxygen partial pressure. Rapp and Otsuka[49] explained
this as the reason that higher chromium contents in alloys produces better hot corrosion
resistance. The dependencies of oxide solubility on the oxygen partial pressure for chromia and
iron oxides have been measured by Rapp and Zhang[50-51] and they were in good agreement
with thermodynamic predictions.
The thermodynamic calculations based on the basic and acidic dissolution reactions are
able to determine the shapes of the solubility curves. The oxide will dissolve by either accepting
oxide ions (basic) or donating oxide ions (acidic). The slope of the curve is able to be
determined by using the basic and acidic dissolution reaction equations, which are shown for
NiO in equations 22 and 23 respectively below.
NiO + Na2O + ½ O2 = 2NaNiO2 (22)
NiO + Na2SO4 = NiSO4 + Na2O (23)
Assuming that NiO has unit activity, the equilibrium constant for the basic dissolution reaction
can be given by equation 24 below.
(24)
Taking the logarithm of both sides of the equation, solving for aNa2O, and then differentiating
with respect to –log(aNa2O) yields the slope of the left side of the solubility curve, which
corresponds to basic dissolution. This is shown in equation 25 below.

55
(25)
The same can be done with the acidic dissolution reaction equation. This is shown in equations
26 and 27 below. This reveals a slope of 1 for the right side of the solubility curve, or the side
pertaining to acidic dissolution.
(26)
(27)
The minimum in the solubility curve is the point in which the acid and basic dissolution curves
intersect. Rapp and Goto[52] have proposed a criterion for which the continued self-sustaining
hot corrosion attack can occur. This is known as the Rapp-Goto Criterion, and it is given by
equation 28 shown below, where Coxide is the solubility of the protective oxide and x is the
distance into the molten salt deposit from the oxide/salt interface.
(28)
When the solubility gradient is positive, the salt can become too saturated with oxide and a
protective scale is able to form over the metal surface. A negative solubility gradient in the
oxide solubility at the oxide/scale interface results in dissolution of the protective oxide scale and
a reprecipitation of the oxide as discontinuous non-protective particles in regions of the molten
salt deposit where the solubility is much lower.
x=o < 0

56
Figure 22[52] shows a schematic of the conditions in the salt that satisfy the Rapp-Goto
Criterion and produce hot corrosion of a material with a surface oxide.
Figure 22: Conditions in the Na2SO4 salt the satisfy the Rapp-Goto Criterion
Figure 22 is plotted for a constant oxygen partial pressure. Three situations labeled A, B, and C
are given in which solubility gradients are established so that hot corrosion can occur. The
dashed lines labeled I are for the locations of the oxide/salt interface, and the dashed lines
labeled II are for the locations of the salt/gas interface. Whether the dissolution is basic or
acidic, the oxide solubility must be higher at interface I than at interface II, which are cases A
and C. Continued oxide dissolution occurs for case B if the locations of the interfaces lie on
either side of the solubility minimum. A general description of Na2SO4-induced hot corrosion

57
has been given. In the following sections the propagation or hot corrosion mechanisms for alloy-
induced acidic fluxing, basic fluxing, and gas phase-induced acidic fluxing will be described in
more detail.
2.4.2 Type I Hot Corrosion
As was mentioned earlier, Type I hot corrosion occurs at high temperatures of approximately
900-1000oC. There are two propagation modes for this type of hot corrosion. These occur when
there is dissolution of the protective oxide from a highly basic molten salt deposit where aNa2O is
high, and when there is dissolution of the protective oxide from a highly acidic molten salt
deposit where pSO3 is high. These are called basic fluxing and alloy-induced acidic fluxing
respectively. These two forms of Type I hot corrosion occur due to interactions between the salt
deposit and the underlying surface. A description of the corrosion mechanisms for these two
forms of Type I hot corrosion will now be discussed in more detail. Although the tests
conducted were not at Type I hot corrosion temperatures, a description of basic fluxing and
alloy-induced acidic fluxing will still be given. Some of the alloys tested did observe
characteristics of alloy-induced acidic fluxing even at low Type II hot corrosion temperatures.
2.4.2.1 Basic Fluxing
When hot corrosion first became a problem for alloys used in the hot turbine section of
gas turbine engines, it was concluded that the presence of molten Na2SO4 deposits was the cause.
There were many different mechanisms proposed for this accelerated attack. The currently
accepted mechanism for basic fluxing was first proposed by Bornstein and DeCrescente.[53]
They investigated the oxidation of three superalloys: B-1900, U-700, and Waspaloy. The first

58
two are alumina formers, and Waspaloy is a chromia former. Their tests were conducted at
900oC with and without deposits of Na2SO4 and NaNO3, so that the effect of the deposit could be
determined. They also performed tests in which the alloys were impregnated with sulfur before
being oxidized with and without NaNO3 deposits, so that the effect of sulfur could be
determined. Both deposits, Na2SO4 and NaNO3, showed the same amount of degradation. The
alumina forming alloys oxidized much more than the chromia forming Waspaloy. Sulfides were
present when the Na2SO4 deposit was used, but not when the NaNO3 deposit was used. The
microstructures of all of the alloys in which salt deposit induced corrosion occurred had a porous
non-protective oxide scale and a depletion zone beneath the scale. There was no accelerated
oxidation with the sulfur impregnation tests with or without deposits. From these results, they
determined that the oxidation of sulfides is not the cause of accelerated oxidation during Type I
hot corrosion. They proposed that it is an interaction between Na2O in the salt and the alloy
substrate which causes the dissolution of the protective oxide scale and causes rapid oxidation.
When Na2SO4 is used as the salt deposit, chromium rich sulfides form in the substrate, which
removes sulfur from the salt and produces Na2O ions in the melt. The accumulated Na2O ions
react with the substrate somehow, which results in rapid oxidation.
Goebel and Pettit[20] conducted tests on Ni providing further proof for this proposed
mechanism. They confirmed that Bornstein and DeCrescenti’s observation that a condensed
Na2SO4 deposit is needed in order for corrosion to occur. A vapor phase salt deposit will not
cause corrosion. The condensed Na2SO4 is the same as the vapor phase, which means that a
compositional gradient is established across the salt layer on the surface of the Ni. This
concentration gradient is unable to form when the salt is in a gaseous state because of rapid
transport rates. Tests were performed on pure nickel specimens in air at 1000oC with and

59
without a Na2SO4 deposit. The salt deposit accelerates the oxidation of nickel during the early
stages of oxidation, but it is not a self-sustaining attack because it returned to parabolic growth
kinetics. The amount of attack does increase as the amount of Na2SO4 salt deposit increases.
The uncoated Ni specimen showed a protective NiO scale, while the specimen with the salt
deposit showed a very porous non-protective NiO scale with some nickel sulfides, which are
liquid at 1000oC, at the oxide/metal interface. These tests led the authors to produce a
mechanism for the corrosion process at 1000oC.
A thermodynamic approach was taken in order to come up with this mechanism. A phase
stability diagram for the Na-Ni-S-O system was calculated and is shown below in Figure 22.[20]
Figure 23: Phase stability diagram for the Na-Ni-S-O system at 1000oC
The diagram shows that when Na2SO4 comes in contact with Ni, NiO will form. The oxygen is
supplied from the Na2SO4 deposit or from the dissociation of SO42-
ions. Oxygen will not be
able to be transported through the salt from the gas atmosphere faster than it is being consumed

60
to form the NiO layer. This creates a positive oxygen activity gradient at the NiO/Na2SO4
interface across the molten salt deposit. Rapp[54] showed that the oxygen solubility in Na2SO4
is low, and that the soluble oxidant in hot corrosion is SO3 in the molten salt. As the oxygen
activity decreases along the gradient, the sulfur activity increases according to the equilibrium
from the reaction shown in equation 29 below.
½ S2 + 3/2 O2 = SO3 (29)
In the presence of two oxidants, namely O2 and S2, phase stability on the metal surface will be
dependent on the ratio of pO2/pS2 given by the reaction shown below in equation 30.
NiO + S2 = NiS + ½ O2 (30)
At the surface of the NiO scale, NiS will be unstable, because very little oxygen will be removed
from the molten salt at this location. If the sulfur activity is high enough and the sulfur can
diffuse through the oxide scale to the metal/oxide interface, a region where the oxygen activity is
even lower than in the Na2SO4 melt, then a NiS layer will form below the NiO oxide scale.[55]
This is what was observed.
As more sulfur is removed from the melt to form NiS at the substrate surface, oxide ions
are produced in the melt according to the following reaction.
SO42-
= O2-
+ ½ S2 + 3/2 O2 (31)
The sulfur removal causes an increase of the oxide ion activity at the scale/salt interface, which
is given by the following reaction.
Na2SO4 + 3Ni = 3NiO + Na2O ½ S2 (32)
If the oxide ion activity of the Na2SO4 melt reaches high enough values, then a reaction can
occur given in equation 33, where NiO reacts with oxide ions in the melt to form nickelate ions,
NiO2-
, which are soluble in Na2SO4.

61
NiO + Na2O = Na2NiO2 (33)
There is a high oxide ion activity near the oxide/salt interface, and therefore as the nickelate ions
form and diffuse into the salt, they encounter regions of lower oxide activity and they precipitate
out as porous non-protective NiO oxide particles in the reverse reaction of equation 33. This is
the cause of the porous NiO scale encountered in the researcher’s experiments. As was
mentioned before, the accelerated oxidation described is not self-sustaining and the reaction will
eventually proceed to normal parabolic growth kinetics. This occurs because eventually the
oxygen activity will reach a steady-state value, and the production of oxide ions reduces the
sulfur activity in the melt, which causes NiS to no longer be able to be formed and the oxide ion
concentration will be stabilized at a high value. When this occurs, a continuous protective NiO
scale will form below the porous outer scale, and the accelerated oxidation will stop.[20] A
schematic of the basic fluxing mechanism just described is shown below in Figure 24[20].

62
Figure 24: Model for Na2SO4-induced accelerated oxidation of nickel
This mechanism can be validated by the Rapp-Goto criterion. When accelerated
oxidation is occurring, the oxide ion activity is much higher at the oxide/salt interface than it is
further out into the molten salt. According to the Rapp-Goto criterion, this is the same as saying
that the NiO solubility is greater at the oxide/salt interface than it is further out into the salt,
which is a negative solubility gradient. According to equation 28, accelerated oxidation should
occur until the oxide ion activity becomes stabile and NiS is no longer able to form, the NiO
solubility gradient flattens out, and the Rapp-Goto criterion is no longer applicable and normal
parabolic growth kinetics occur.
Goebel and Pettit performed further tests in Type I conditions with nickel-based
alloys.[56] They tested pure Cr, Ni-Cr, Ni-Al, and some chromia and alumina forming alloys.
The tests were conducted at 1000oC in pure oxygen after presulfidizing in an H2/H2S

63
environment in order to determine the effect of sulfur on the oxidation behavior of the alloys.
The presulfidation treatment did not affect the oxidation behavior of the pure Cr. A Cr2O3 scale
grew over a layer of CrS. Presulfidation did increase the oxidation rate of the Ni-Cr alloys if NiS
formed, because NiS is molten at the temperature tested. NiS is able to go through the protective
Cr2O3 scale creating rapid diffusion paths for oxygen, leading to increased oxidation. The Ni-Al
alloys oxidized significantly if the Al activity was sufficient enough to form Al2S3. If the Al
activity is not sufficiently high enough to form Al2S3, then NiS formed and Al was selectively
oxidized to form Al2O3. The chromia-forming alloys performed similarly to the Ni-Cr alloys,
while the alumina-forming alloys performed like the Ni-Al alloys that do not form Al2S3. This
shows that the basic fluxing mechanism described earlier is only valid for chromia forming
alloys and Ni-Al alloys with high Al activities.
As was explained earlier, Bornstein and DeCrescente performed tests on some nickel-
based superalloys and some Ni-Cr alloys.[57] There was a lack of corrosion of the Ni-Cr alloys,
which showed that Cr is beneficial for hot corrosion resistance. This is due to the formation and
dissolution of Cr2O3, which lowers the important oxide ion levels at the oxide/scale interface
according to the reaction given in equation 34 below.
Cr2O3 + 2Na2O + 3/2 O2 = 2Na2CrO4 (34)
Goebel and Pettit also studied the oxidation of some commercial and model nickel-based
alloys containing various amounts of Cr, Al, Mo, W, and V in order to determine the effects of
alloy composition on the basic fluxing corrosion mechanism.[19] It was concluded that a second
form of Type I hot corrosion occurs with Mo, W, or V containing alloys that leads to
catastrophic oxidation. This type of hot corrosion is alloy-induced acidic fluxing, and will be
discussed in more detail in the following section.

64
The basic fluxing mechanism has been described in detail, and there are a few distinct
features. Metal sulfides are usually found in the alloy substrate because sulfur is removed from
the Na2SO4 melt. The amount of attack depends on the production of oxide ions in the melt.
The oxide ion concentration eventually reaches a steady-state value, greater than the initial
Na2SO4 deposit, and the melt becomes supersaturated with oxides that reprecipitated out during
the basic fluxing process. Therefore, the attack is not self-sustaining. This type of attack only
occurs at high temperatures (900-1000oC) and in gas atmospheres that do not contain large
amounts of acidic SO3.[30]
2.4.2.2 Alloy-Induced Acidic Fluxing
The second propagation mechanism for Type I hot corrosion is alloy-induced acidic
fluxing. It was shown that the basic fluxing mechanism in Type I hot corrosion is not self-
sustaining. The oxide solubility plots given earlier show that a protective oxide scale can also be
dissolved due to melts with low aNa2O (acidic melts). The Na2SO4 deposit can become acidic due
to SO3 in the gas atmosphere, or by the dissolution of transient Mo, W, or V oxides that are
added to superalloys for solid solution strengthening. Alloy-induced acidic fluxing is due to the
latter and will be discussed here in more detail.
Bornstein et al.[58] studied the effects of various elemental additions to nickel-based
alloys on the Na2SO4-induced hot corrosion at temperatures between 800-1000oC. The oxidation
rates of alumina forming alloys were significantly accelerated when there were additions of Mo
or V in the alloys or when Na2SO4 was deposited with MoO3 or V2O5. The first explanation for
this phenomenon was that these acidic oxides react with oxide ions releasing SO2 such as the
reaction given below in equation 32.
V2O5 + Na2SO4 = 2NaVO3 + SO2 + ½ O2 (35)

65
The released SO2 would then dissolve the protective Al2O3 scale with the reaction shown below
in equation 36.
Al2O3 + 3SO2 + 3/2 O2 = Al2(SO4)3 (36)
In order for this to occur however, significant amounts of SO2 would have to be released in order
for equation 36 to happen. The reaction in equation 35 would have to be extremely rapid, and
this was not observed by the authors. They then concluded that the attack was due to the fact
that the acidic transient MoO3 and V2O5 oxides are molten at the temperatures tested. The
molten oxides go through the Al2O3 scale, which causes rapid degradation of the substrate.
Tungsten did not produce the same corrosion because its oxide is not molten at the temperatures
of interest.
As was mentioned in the previous section, Goebel and Pettit[19] studied the oxidation of
some commercial and model nickel-based alloys with different element additions in order to
determine their effect on Na2SO4-induced hot corrosion. They oxidized Ni-Al Ni-Cr-Al alloys
with additions of Mo, W, and V at 1000oC in air with Na2SO4 deposits. All of the alloys tested
were catastrophically degraded. The refractory element additions were found to be concentrated
at the alloy/scale interface, and the attack was initiated with these phases. The authors also
performed tests in which oxides of Mo, W, V, and Cr were mixed with Na2SO4 in an alumina
crucible and heated to 1000oC. The crucibles with WO3, MoO3, and V2O5 all lost weight and
traces of Al were found in the salt after the test. This did not occur with the Cr2O3. The
refractory oxides lower the oxide ion activity significantly so that the reaction in equation 36 can
occur. Cr2O3 reacts with the oxide ions to a much lesser extent. Based on these tests the authors
came up with a corrosion mechanism for refractory element-containing alumina forming nickel-
based alloys.

66
During the first stages of oxidation, transient MoO3 and NiO oxides as well as Al2O3
form at the alloy surface. MoO3 reacts with the oxide ions in the Na2SO4 salt deposit to decrease
the oxide ion activity of the melt, which prevents the basic fluxing mechanism from occurring.
This reaction is shown below in equation 37.
MoO3 + O2-
= MoO42-
(37)
MoO3 will decrease the oxide ion activity of Na2SO4 to levels where equation 36 and acidic
fluxing of the protective Al2O3 scale can occur. The attack initiates near Mo-rich particles
because the activity of MoO3 in the Na2SO4 is highest in these areas. The fluxing of the Al2O3
scale causes Al3+
and MoO42-
ions to diffuse through the salt where Al2O3 is reprecipitated out as
a porous non-protective scale, and the MoO3 evaporates. This form of attack is self-sustaining
unlike the basic fluxing mechanism, because MoO3 is able to continue to form at the alloy/salt
interface and evaporate at the salt/gas interface. Figure 25[30] below shows the weight change
versus time plot for hot corrosion in air of Ni-8%Cr-6%Al and Ni-8%Cr-6%Al-6%Mo.

67
Figure 25: Comparison of isothermal hot corrosion of Na2SO4-coated Ni-CrAl and
Ni-Cr-Al-Mo
The Ni-Cr-Al alloy undergoes basic fluxing that is not self-sustaining, while the Mo-containing
alloy undergoes basic fluxing that turns into self-sustaining acidic fluxing. A negative solubility
gradient is maintained in the salt at the salt/alloy interface, which maintains the Rapp-Goto
criterion.
The alloy-induced acidic fluxing mechanism described above was for Type I conditions
at high temperatures of 900-1000oC. This mechanism will be compared to the mechanisms of
the research performed for this thesis at 700oC. The Mo containing disk alloys tested with
Na2SO4 deposits at these low temperatures show characteristics of alloy-induced acidic fluxing,
meaning there may be some gray areas for the characteristics of the different types of hot
corrosion. This will be explained in more detail in the results and discussion sections.

68
2.4.3 Type II Hot Corrosion
Previous sections have described the hot corrosion mechanisms at high temperatures of around
(900-1000oC). It is also possible to have hot corrosion at lower temperatures between 650-
750oC, and the attack can be greater at these lower temperatures. Na2SO4 has a melting point of
884oC, so it does not form a molten salt and remains solid at these temperatures. In order for
severe degradation to occur, the salt must become liquid, and so severe corrosion would not be
expected at these temperatures, but severe corrosion occurs in turbine blades and the hot sections
of boiler hardware at these low temperatures all the time. This type of low temperature corrosion
is called Type II hot corrosion. Type II hot corrosion is not well understood, but the accelerated
corrosion is generally believed to be caused by the formation of a Na2SO4-MSO4 eutectic melt
that has a melting point well below that of Na2SO4.[56] It is also known that a partial pressure of
SO3 of about 10-5
is required for this melt to form.[60] This amount of SO3 in the gas
atmosphere is not uncommon in industrial gas turbines or superheater tubing for boilers.
CoCrAlY coatings are more susceptible than NiCrAlY coatings and Ni-based alloys to this form
of corrosion, and so the bulk amount of research has been conducted with Co-based metals.
2.4.3.1 Gas-Phase Induced Acidic Fluxing
The corrosion mechanism for low temperature Type II hot corrosion is also an acidic
fluxing mechanism, but this time the Na2SO4 salt deposit becomes acidic due to SO3 in the gas
atmosphere. This is why it is called gas-phase induced acidic fluxing. There has been a great
deal of research on the mechanism of Type II hot corrosion of Co-based materials.[59-62] This
type of attack on CoCrAlY coatings is generally described as very localized pitting attack, with
the pits containing porous unprotective Cr2O3, Al2O3, CoCr2O4, or CoAl2O4 with AlS forming a

69
layer at the base of the pit. Cobalt oxides or cobalt sulfates will form at the corrosion
product/gas interface depending on the partial pressure of SO3 in the gas. Higher SO3 contents
will form cobalt sulfates.[40] Binary Co-Cr alloys have similar morphologies as the CoCrAlY
coatings, but there are only Cr- and Co- rich corrosion products. There is no Al in the alloy.
Also, CrS form a layer at the base of the pit instead of AlS. Binary Co-Al alloys sustained a
more frontal attack, but the distributions of the elements in the corrosion products were similar to
the Co-Cr and CoCrAlY alloys. There were of course only Al- and Co- rich corrosion products
as well.[40]
A liquid deposit is generally required for severe corrosion to occur. For Type I hot
corrosion, this is not a problem, because the operating temperatures are above the melting point
of Na2SO4 (Tm = 884oC). For low temperature Type II hot corrosion, liquid deposits are able to
still form below the melting point of Na2SO4. This can be explained from the CoSO4-Na2SO4
phase diagram shown in Figure 26 below.[63]
Figure 26: The CoSO4-Na2SO4 phase diagram

70
A eutectic liquid can be seen on the diagram at approximately 50% Na2SO4 at 560oC. Therefore,
if sufficient amounts of CoSO4 can form in the Na2SO4 deposit, then a liquid will form in the low
temperature 650-750oC range.
MCrAlY materials oxidized at high temperatures usually will form a slow growing
protective α-Al2O3 scale on its surface. Even though Al2O3 is the oxide that will preferentially
grow on the substrate of these alloys, a small amount of MO (NiO or Co3O4) will grow initially
before the protective Al2O3 scale can, because these oxides grow much faster than Al2O3. This is
known as transient oxidation.[30] A CoCrAlY coating covered with a Na2SO4 deposit will have
transient Co3O4 or CoO, depending on temperature, growing first. The transient cobalt oxides
can then react with SO3 in the gas atmosphere to form the liquid Na2SO4-CoSO4 eutectic melt.
The reactions for this are given in equations 38 and 39 below.[64]
1/3 Co3O4 + SO3 = CoSO4 + 1/6 O2 (38)
CoO + SO3 = CoSO4 (39)
CoSO4 is underlined because it will dissolve in the Na2SO4 at an activity of less than one, and if
there is enough SO3 present in the gas atmosphere to cause the formation of sufficient amounts
of CoSO4, then the liquid eutectic melt can form. The amount of SO3 needed in the gas
atmosphere to cause the formation of the eutectic melt from Co3O4 pO2 = 1atm was calculated by
Shores and Luthra[64] and is shown in the plot in Figure 27 below as a function of temperature.

71
Figure 27: The SO3 partial pressure required to form various species
The Na2SO4-CoSO4 liquid eutectic is stable above the solid line in the plot marked A. The
amount of SO3 present in common gas turbine operating conditions is marked on the plot by the
dashed line area. As can be seen, the liquid eutectic is stable at a wide range of SO3 partial
pressures within the normal gas turbine operating conditions. This plot is for pO2 = 1 atm, and
the curves will change with the oxygen partial pressure as can be seen in the equilibrium reaction
given in equation 38. Even with significant increases in the oxygen partial pressure, curve A in
the plot will only slightly increase, and therefore this plot is still valid for most situations.
Sulfur dioxide and sulfur trioxide both exist in combustion gas atmospheres. The
formation of SO3 comes from the oxidation of SO2, which has been explained earlier. The
reaction is given by equation 4. As was discussed earlier, this reaction is very temperature
dependent with SO2 being favored at high temperatures and SO3 at lower temperatures. Jones
studied the interaction between Co3O4 and SO2/SO3 gas mixtures.[63] He determined that SO3

72
was the gas species responsible for turning Co3O4 into CoSO4 and not SO2. It was also
discovered that Co3O4 is a good catalyst for reaction 4. Even in a gas atmosphere containing
only SO2, significant amounts of eutectic liquid will form due to Co3O4 catalyzing the SO3
reaction.
The corrosion mechanism for low temperature Type II hot corrosion of Co-based alloys
was proposed by Luthra.[64] The SO3 levels needed to form the eutectic liquid on the surface of
the metal and cause corrosion would dissolve the protective Al2O3 and Cr2O3 scales as sulfates
and therefore basic fluxing is not possible. The SO3 is consumed at the oxide/salt interface, and
therefore the SO3 partial pressure is lower here than at the salt/gas interface. The solubility
gradient at the oxide/salt interface would be positive, so acidic fluxing of the Al2O3 or Cr2O3
cannot occur. The fluxing of the protective oxide scale as was described in alloy-induced acidic
fluxing is not applicable here. The transport rates of oxygen, SO2, and SO3 through the liquid
salt were calculated, and it was found that only SO3, which is present as S2O72-
ions, is the
primary oxidant at the oxide/salt interface, and is the reason for the increased oxidation rates.
SO3 becomes part of the salt deposit by the reaction given in equation 40 below.
Na2SO4 + SO3 = Na2S2O7 (40)
Luthra[64] explains that it is then transported to the salt/gas interface by an SO2O72-
/SO42-
exchange reaction given in equation 41 below.
S2O72-
+ SO42-
+ SO42-
= SO42-
+ S2O72-
+ SO42-
(41)
Cobalt oxides are commonly found at the corrosion product/gas interface, therefore they
must transport somehow through the molten salt. Luthra also proposed a mechanism to explain
this.[64] Cobalt is able to exist in a 2+ or 3+ valence state. The outward migration of Co ions
requires the coupled movement of additional ions in order to preserve electrical neutrality. There

73
are three proposed migration possibilities. The first involves the simultaneous outward diffusion
of Co2+
and SO42-
. This requires the activity of CoSO4 be highest at the metal/oxide interface.
At high concentrations of SO3, CoSO4 forms at unit activity at the salt/gas interface, and so the
activity gradient needed for this reaction to occur is not possible, and therefore this migration
mechanism is not possible. The second migration mechanism proposed is the simultaneous
outward diffusion of Co2+
and SO32-
. The partial pressure of oxygen is low, and there should be
a negative SO32-
gradient at the oxide/salt interface. This is shown by the reaction given in
equation 42 below.
Na2SO3 + ½ O2 = Na2SO4 (42)
The calculated maximum flux for this mechanism is much smaller than the observed flux of
cobalt. This confirms that this is not the mechanism for Co migration. The third mechanism for
the migration of Co is a 3Co2+
/2Co3+
exchange reaction. The ratio of Co3+
/Co2+
in the molten
salt is given by the reaction in equation 43.
2CoSO4 + SO3 + ½ O2 = Co2(SO4)3 (43)
The partial pressures of oxygen and SO3 are lower at the oxide/salt interface than at the salt/gas
interface; therefore the Co3+
/Co2+
ratio should be higher at the salt/gas interface. This causes an
outward migration of Co2+
ions that will form Co3O4 or CoSO4 depending on the oxygen and
SO3 partial pressures at the salt/gas interface. Co3+
ions will migrate inward, where they will be
reduced to Co2+
at the oxide/salt interface. This is the correct Co migration mechanism.
Using this Co migration mechanism, a sequence of reactions was developed to describe
the mechanism of gas-phase induced acidic fluxing.[64] A binary Co-Cr alloy was used as the
example material. During the beginning stages of oxidation, transient Co oxides and Cr2O3 will
form. Cr2O3 is more stable than Co3O4, so an alloy containing sufficient amounts of Cr would

74
eventually form a continuous, slowly growing, protective Cr2O3 scale. The dissolution of this
protective scale is the reason for increased corrosion. The transient Co3O4 that initially forms
will react with SO3 in the gas to form CoSO4 which will dissolve in the Na2SO4 salt deposit. If
sufficient SO3 is available, then a liquid Na2SO4-CoSO4 eutectic will form leaving behind a
porous Cr2O3 scale. The reaction can continue with the inward migration of SO3 and the
outward migration of Co2+
as was discussed earlier. The inward migrating SO3 oxidizes the Cr
at the oxide/salt interface releasing SO2, which can penetrate into the alloy and form sulfides.
Sulfide rich bands are commonly found at the base of corrosion pits. The sulfide band that
formed can be further oxidized generating S2, which can penetrate further into the alloy to form
additional sulfides. The sulfide band and the corrosion pit are able to progressively go further
into the alloy substrate. Eventually the maximum CoSO4 activity is reached at the salt/gas
interface and the outward migrating cobalt will form Co3O4. This mechanism can be applied to
Co-Al and CoCrAl alloys. Luthra[64] explained that the mechanism described above is not
likely for Ni-based alloys because nickel does not have any known Ni3+
compounds, even though
Ni3+
is possible.
The mechanism for Ni-based alloys is similar and was described by Chiang et al.[62]. A
binary Ni-Cr alloys is used as an example. Transient NiO grows over a protective Cr2O3 scale on
the surface of the metal and react with SO3 in the gas to form Ni2SO4. This will dissolve in the
Na2SO4 deposit, and if there is sufficient SO3 in the gas atmosphere, a liquid Na2SO4-Ni2SO4
eutectic will form and penetrate the Cr2O3 scale. High pSO2/pS2 values are established at the
alloy/salt interface due to low pO2 in this area. This leads to acidic fluxing of the protective

75
Cr2O3 scale and reprecipitation of a non-protective scale at places of higher pO2. The base metal
dissolves in the salt and diffuses to the salt/gas interface where it precipitates as NiO. The high
pS2 at the alloy/salt interface results in the precipitation of CrS in the alloy.
Low temperature hot corrosion tests were conducted on Ni-Cr, Co-Cr, NiCrAl, and
CoCrAl alloys at temperatures between 700-750oC by Chiang et al.[62] They found that all of
the alloys exhibited the degradation morphology similar to that for Co-Cr and CoCrAl described
earlier. Even the Ni-based alloys observed severe degradation, but higher SO3 pressures were
required for this to occur when compared to Co-based alloys. Chromium sulfides were found at
the base of the pits of the Ni-based alloys, along with NiS in the corrosion product. Aluminum
present in the alloy also seems to result in increased degradation, because the ternary Co-18Cr-
6Al alloy sustained more degradation than the binary Co-20Cr at a given SO3 partial pressure.
With these results, the authors proposed a Type II hot corrosion mechanism. As was discussed
before, a liquid eutectic salt is formed from the reaction of transient NiO or Co3O4 with SO3.
High values of pSO2 and pS2 are established at the oxide/salt interface because of low pO2 in this
region. The acidic fluxing of the protective Al2O3 scale for CoCrAl alloys is given by the
reaction in equation 44 below.
Al2O3 + 3SO2 = Al2(SO3)3 (44)
Aluminum sulfite is dissolved into the molten salt and is then reprecipitated out at porous Al2O3
in the outer region of the molten salt where the SO2 partial pressure is low. Chromium may
undergo a similar reaction, or it may be oxidized in-situ. As was discussed earlier in the
mechanism by Luthra, Co diffuses through the liquid salt and forms Co-oxide at the salt/gas
interface. This mechanism is consistent with the observed preferential attack of the Al-rich β-
phase in the alloy. The mechanism is a bit different for NiCrAl alloys. The important reaction is

76
at the oxide/salt interface in the substrate between Cr, Al, and S forming sulfides. These sulfides
then oxidize and S2 is released which form NiS and dissolve into the molten salt. This allows Ni
to diffuse to the salt/gas interface forming the non-protective NiO.
The morphology and mechanisms of Type II hot corrosion described here and
encountered in the performed research will be compared to the severe pitting attack observed in
fireside corrosion tests. Both of these types of tests were conducted at low temperatures (650-
700oC), with the only difference being the type of deposit and the varying amounts of SO3 in the
gas atmosphere. The results of the fireside corrosion tests and the Type II hot corrosion tests will
also be compared to the Na2SO4 induced corrosion of the so-called disk alloys. Some of these
contain Mo, which might exhibit Type I characteristics even at a low temperature. This will all
be discussed further in the results and discussion sections.
2.4.4 Disk Corrosion
Advanced gas turbine engines are currently being developed for reduced gas emissions and
reduced fuel consumption (higher efficiency). This can be done by increasing the combustion
temperature and pressure or improvements in cooling technologies. Not only will the
temperatures and pressures of the turbine blades be increased, but the temperatures and pressures
surrounding the disk rotors will also increase. Currently high strength nickel alloys are used for
disk rotor hardware because of their high temperature oxidation resistance and strength.
Exposing disk alloys to engine environments for long periods of time will cause severe oxidation
and hot corrosion due to salt deposits as discussed earlier. Increasing the temperature and
pressure will have even greater effects on disk integrity.[65]
77
Encinas-Oropesa et al.[65] studied the oxidation behavior of a new disk alloy, RR1000,
which is a nickel-based superalloy with composition Ni-18.5%Co-15%Cr-5%Mo-3.6%Ti-3%Al-
2%Ta-0.5%Hf and trace other elements. It is important to note the addition of 5%Mo. As has
been discussed previously and will be shown later, the addition of Mo to these alloys can caused
increased degradation even at these low temperatures. Encinas-Oropesa et al. oxidized RR1000
isothermally and cyclically in air at temperatures between 700-800oC. The results showed that a
very thin Cr2O3 oxide scale grew with parabolic kinetics. The thickness of the oxide scales
increased with increasing temperature. There was also some sub-surface damage beneath the
growing oxide scales which contained grain boundary pores and a second phase depletion zone.
The research presented in this thesis compares the low temperature oxidation (700oC) as
well as Na2SO4 induced Type II hot corrosion morphologies and mechanisms of RR1000 as well
as some other model and commercial Ni-based disk alloys. This mechanism will then be
compared to the Type II hot corrosion of selected Ni-based alloys as well as the fireside
corrosion mechanisms. All of these tests were conducted at 700oC, so a clear understanding of
the different corrosion mechanism as a result of salt deposits will be achieved.

78
3.0 RESEARCH OBJECTIVES
The current materials used in the superheater and reheater sections of coal-fired boilers do not
have the high temperature strength and corrosion resistance needed for advanced ultra-
supercritical power plants. In order to increase plant efficiency and reduce CO2 emissions
advanced coal-fired power plants will operate under higher temperatures and pressures and using
oxy-fuel combustion processes. This will cause the plants to be operating in the ultra-
supercritical range of 35MPa and 760oC, and with oxy-firing, a gas atmosphere with increased
SO3 and CO2. Deposits from the coal react with SO3 from the gas atmosphere in this
temperature range to cause severe liquid-phase corrosion. This type of corrosion called fireside
corrosion is not well understood. The first goal of this research was to provide high temperature
fireside corrosion information as well as indicate a corrosion mechanism to aid in materials
development for oxy-fuel combustion systems.
Advanced gas turbine engines are also being developed for higher temperatures in order
to increase efficiency. The mechanisms for the different types of hot corrosion caused by
Na2SO4 deposits have been established. There are some gray areas, however, regarding the
conditions that cause the different types of hot corrosion. The second goal of the performed
research was to compare the conditions and mechanisms for different types of hot corrosion as

79
well as fireside corrosion and corrosion of disk alloys. This will provide more information on
the conditions needed for the different types of corrosion, and may allow different types of
corrosion to be combined into the same category under certain conditions.

80
4.0 EXPERIMENTAL PROCEDURE
4.1 MATERIALS PREPARATION
The compositions of all of the alloys tested are shown below in Table 5.
Table 5: Nominal Alloy Compositions (wt%)
The NiCrAlY, CoCrAlY, NiCrAl, and NiCrAlMo alloys were received as bars that could be cut
into circular specimens. The NiCrAlY and CoCrAlY specimens were cut into coupons
approximately 3mm thick and 18mm in diameter. The NiCrAl specimens were cut into coupons
approximately 1.5mm thick and 18mm in diameter, while the NiCrAlMo specimens were
slightly larger at approximately 1.5mm thick and 19.4mm in diameter. The remaining alloys

81
were cut into rectangular coupon specimens approximately 15mm x 10mm x 2mm. All of the
specimens were polished to a 1200 grit SiC finish and ultrasonically cleaned in isopropanol. The
specimens were then dried and weighed before any deposits were applied or testing was
conducted.
There were two deposits used for the fireside corrosion tests. The deposits were prepared
by thoroughly mixing the individual ingredients. The first deposit had a composition (wt%) of
30%SiO2-30%Al2O3-30%Fe2O3-5%Na2SO4-5%K2SO4. This deposit was called Deposit D and
will be referenced as such for the rest of this thesis. This deposit simulates the ash that can form
in actual boiler systems. The second deposit had a composition of Na2SO4:K2SO4:Fe2O3 in a
1.5:1.5:1.0 molar ratio. This deposit composition was based on the work of Cain and
Nelson[25], and was called the “standard corrosion mix”, and will be called this for the rest of
the thesis as well. The amounts of each component in the standard corrosion mix come from the
stoichiometric values of the alkali iron trisulfates that form and cause corrosion. The standard
corrosion mix is designed to form alkali iron trisulfates in the tested environment. It represents
the most severe deposit that could occur. Several deposition procedures were used in covering
the specimens. Deposit D was first used as a coating. A powder deposit was made into a 2M
slurry in isopropanol (2 moles of powder in one liter of isopropanol). The slurry was
magnetically stirred while resting on a hot plate. While stirring the slurry, the specimens were
dipped into the solution, removed, and dried with a heat gun. This was repeated until 2.75±0.25
mg/cm2 of slurry was coated onto the specimens. The second deposition procedure was simply
keeping Deposit D and the standard corrosion mix in powder form and placing them into

82
alumina crucibles. The specimens were placed into the crucibles so that half of the specimen
was covered in powder and half was not. This was done so that the effect of deposit thickness on
the corrosion of the alloy could be determined.
The Type II hot corrosion tests used a different salt deposit and deposition procedure.
These tests were conducted by Michael Task, and reported in his Masters and Ph.D. theses.[66-
67] His procedure is referenced here, and the results of his work will be referenced in this thesis.
Na2SO4, Na2SO4-NiSO4, or Na2SO4-CoSO4 eutectics were the salt deposit used depending on
whether the NiCrAlY or CoCrAlY alloys were used. The eutectic salt deposits were made by
mixing 80g of Na2SO4 powder per 16oz. of distilled water with NiSO4 powder and CoSO4
powder so that there was 38wt%NiSO4 and 52wt%CoSO4. A 2.75±0.25mg/cm2 deposit was
applied to the surface of the specimens by heating the specimens with a heat gun and spraying
with the prepared eutectic salt solution. The specimens were weighed so that the desired amount
was deposited on the surface. Tests were also conducted under Type II hot corrosion conditions
on some model and commercial disk alloys. These tests used Na2SO4. The salt deposit mixture
was made by mixing 80g of Na2SO4 powder per 16oz. of distilled water. A deposit of
2.75±0.25mg/cm2 was applied to the surface of the specimens in the same manner as the eutectic
salt deposits. The testing conditions were different for the fireside corrosion tests and the Type
II hot corrosion tests, and they will be described in the following respective sections.
4.2 FIRESIDE CORROSION TESTS
The FeNiCr, T92, NiCr, NiCrAl, NiCrAlMo, and IN-617 alloys were selected for fireside
corrosion tests. There were many tests conducted varying different parameters of the conditions

83
in order to find the environment that caused the most severe corrosion. Once the specimens had
been deposited with the salt mixture, they were placed into a horizontal resistance-heated quartz
tube furnace shown schematically in Figure 28.
Figure 28: Schematic of horizontal tube furnace apparatus for fireside corrosion
tests
The specimens could be cycled in and out of the hot zone of the furnace manually by using a
magnet to push a quartz rod that held the specimens. The hot zone was maintained within 3
degrees of the test temperature. The gas atmospheres tested contained oxygen with varying
amounts of SO2. The gas flowed into the tube at a constant flow rate of 15mL/min (0.0125 cm/s)
and passed over a platinum honeycomb catalyst placed in the hot zone of the furnace to establish
the equilibrium pSO3 described earlier and given by the reaction in equation 4. Assuming that
equilibrium is attained, the equilibrium pSO3 values for the temperatures and gas atmospheres
tested are given in Table 6.

84
Table 6: Equilibrium SO3 partial pressures at experimental temperatures and gas
atmospheres
SO3 Partial Pressure O2 + 100ppm SO2 O2 + 1000ppm SO2=
650oC 4.856 × 10
-4 atm 4.856 × 10
-3 atm
700oC 2.524 × 10
-4 atm 2.524 × 10
-3 atm
When exiting the furnace, the gas is bubbled through a Na2CO3 plus water mixture before
entering the fume hood. This removes the SO3 from the gas, which is shown by the reaction in
equation 45.
SO3 + Na2CO3 = Na2SO4 + CO2 (45)
The produced sodium sulfate precipitates out in the bubbler, and the exiting gas is predominantly
carbon dioxide.
As was mentioned before, the test conditions were varied to find the environment that
caused the most corrosion. First, tests were conducted using the slurry deposition method.
Following this, the powder-crucible method explained earlier was predominantly used. For this
method, the quartz rod that was pushed by the magnet to place the samples in the hot zone was
modified so that alumina crucibles could hang below it. This can be seen in the schematic shown
in Figure 29.

85
Figure 29: Modified quartz rod for crucible fireside corrosion tests
Using this method, tests were conducted at 650oC and 700
oC in gas atmospheres containing O2 +
100ppm SO2 and O2 + 1000ppm SO2 with Deposit D and the Standard Corrosion Mix for 100-
160 hours in order to find the most severe environment. In some tests the specimens were cycled
in and out of the hot zone in 20 hour cycles, and others were conducted isothermally. The
platinum catalyst was found to be too far from the hot zone in the initial experiments, and was
moved closer to the samples. After every test was completed, the specimens were
metallographically prepared for examination with lapping oil instead of water in order to
preserve the corrosion products.
4.3 TYPE II HOT CORROSION TESTS
The Type II hot corrosion tests on the NiCrAlY and CoCrAlY alloys were conducted and the
results were written by Michael Task.[66-67] The procedure for the tests was as follows.
Following deposition of the eutectic salt mixture onto the surface of the specimens, Type II hot
corrosion exposures were carried out at 700oC in a horizontal resistance-heated quartz tube
furnace. The set-up is identical to the apparatus shown in Figure 28. As in the fireside corrosion
tests, the specimens were cycled in and out of the furnace manually using the magnet to push the
quartz tube holding the samples into the hot zone. The hot zone was maintained at 700oC ± 3
oC.

86
The gas atmosphere tested contained O2 + 1000ppm SO2. The gas flowed into the quartz tube at
a constant flow rate of 15mL/min (0.0125 cm/s) and over the platinum catalyst as described
previously. Assuming thermodynamic equilibrium caused by the catalyst, the equilibrium pSO3
at 700oC can be seen back in Table 6. Again, after each test, the specimens were
metallographically prepared with water-free solutions.
Tests were also conducted on some model and commercial disk alloys. The alloys that
were selected were NiCrAl, NiCrAlMo, IN-617, IN-738, and RR1000. These alloys were tested
under the Type II hot corrosion conditions described above. The deposit on these samples was
just Na2SO4. A test was also conducted under the same conditions, but with air instead of the
SO2 environment. A baseline test was conducted at 700oC without any salt deposit in air so that
the effect of the deposit on the oxidation of the alloys could be determined. Finally, a test was
conducted on the Mo-containing alloys (NiCrAlMo, IN-617, and RR1000) at 650oC with the salt
deposit in air. This is below the melting point of sodium molybdate. This was done in order to
test whether or not Mo additions to the alloys are causing increased corrosion in the absence of
SO3.
4.4 ANALYTICAL PROCEDURE
Weight change versus time measurements were calculated, but it is difficult to get an accurate
measure of the degradation due to the nature of the deposits, so microstructural characterization
was the main tool used. The surfaces of each of the specimens were viewed under the scanning
electron microscope. The specimens were then metallographically prepared in water-free
lubricants and viewed under the scanning electron microscope again so that cross-sectional

87
images could be taken. Two different SEMs were used. One is a Phillips XL-30 Field Emission
Gun microscope. This microscope is equipped with secondary electron (SE), backscatter electron
(BSE), and X-ray detectors and is thus capable of performing image acquisition and energy
dispersive spectroscopic analysis (EDS). The other is a JEOL JSM-6610LV equipped with SE,
BSE, and EDS. With the images and information gathered, a comparison the different
morphologies and mechanisms of corrosion was then made.

88
5.0 RESULTS AND DISCUSSION
5.1 FIRESIDE CORROSION
5.1.1 Initial Tests: Finding the right corrosion environment
There were many tests conducted at the start of this project in order to identify the right set of
conditions that would cause the most corrosion of the selected alloys in a relatively short amount
of time. There are many variables which can affect the corrosion of the alloys. These include:
temperature, deposit composition, gas atmosphere, duration of test, and cyclic heating. These
different variables were all tested and the combined conditions that caused the most corrosion
were determined. The goal of the tests was to simulate the atmosphere that actually occurs in
coal-fired boilers. The deposits and the gas atmospheres used are much simpler than the actual
conditions, but it is believed that the experimental conditions used for these tests are relevant in
describing the corrosion occurring in coal-fired boilers.
5.1.1.1 Slurry Coating Deposition Tests
The first set of tests was conducted with the Deposit D mixture using the slurry coating
method that was described in the experimental procedure section. It is known that the maximum
amount of corrosion occurs in the 650-750oC temperature range. This is based on previous
studies in which a bell-shaped curve was observed for the corrosion rates, with the most severe

89
corrosion occurring in this temperature range.[4,14,17-18] Fireside corrosion tests were
conducted on duplicate specimens of each of the alloys selected at 650oC and 700
oC for 100
hours isothermally in a gas atmosphere containing O2 + 100ppm SO2 with Deposit D slurry
coated onto the specimen. These tests did not cause any severe corrosion. This can be seen in
the BSE micrographs shown in Figures 30 and 31. EDS analysis showed that a very thin oxide
scale of transient Ni or Fe oxides and protective Cr or Al oxides grew depending on the alloy,
with some remaining deposit covering the scale. The steel alloys had transient Fe-oxides and
chromia scales. IN-617 and Ni-Cr had transient Ni-oxides and chromia scales, while the NiCrAl
alloy had transient NiO as well as Cr and Al oxides.
Figure 30: Fireside corrosion at 650oC with deposit D slurry coated in O2 + 100ppm
SO2 for 100hrs for (a.) FeNiCr, (b.) IN-617, (c.) Ni-Cr, (d.) T92, and (e.) NiCrAl

90
Figure 31: Fireside corrosion at 700oC with deposit D slurry coated in O2 + 100ppm
SO2 for 100hrs of (a.) FeNiCr, (b.) IN-617, (c.) Ni-22Cr, (d.) T92, and (e.) NiCrAl
5.1.1.2 Powder-Crucible Deposition Tests
The test environment was then altered, because there was no significant corrosion
occurring under the previous conditions. The slurry coating method was replaced by the
powder-crucible method explained in the experimental procedure section. This was done so that
the effect of deposit thickness could be analyzed. Tests were conducted for all of the alloys as
before at 650oC in O2 + 100ppm SO2 with Deposit D for 100 hours. This did not produce any
significant corrosion either; however there was differences in the oxides grown based on deposit
thickness. The results can be seen macroscopically in Figure 32 below.

91
Figure 32: Fireside corrosion of selected alloys at 650oC with deposit D powder in a
crucible in O2 + 100ppm SO2 for 160hrs
With the powder-crucible deposition method, the effect of deposit thickness on the corrosion of
the alloys can be seen. There are three main areas of each specimen that could be analyzed.
There is a zone where there is no deposit, where the alloy was only exposed to the gas
atmosphere. There is a zone where the powder starts to cover the specimen. This is equivalent
to a thin deposit. Finally, there is a zone where the specimen is completely covered in deposit
powder, which is equivalent to a thick deposit. With the different salt deposition method, the
alloys grew transient Ni- and Fe- oxides and some protective Cr- and Al oxides depending on the
alloy and on the location on the specimen. EDS analysis showed that in the region where there
was no deposit on the specimen, some transient oxides grew, but there was predominantly a
protective Cr- or Al- oxide scale. Where the deposit was the thickest on the specimen,

92
predominantly transient Fe- or Ni-oxides grew. In the region where there was a thin deposit, a
transition from the protective Cr- or Al-oxides to transient Fe- or Ni-oxides could be seen. An
example of this is shown for the Ni-Cr alloy in the BSE micrographs in Figure 33.
Figure 33: Fireside corrosion of Ni-22Cr at 650oC with deposit D powder in a
crucible in O2 +100ppm SO2 for 160 hours
The early tests so far were only conducted for 100 hours. It is thought that under these
conditions and given a sufficient amount of time, the specimens would become more severely
corroded. The goal was to produce severe corrosion in a short time however; and therefore the
test conditions were changed again. Deposit D was replaced by the more aggressive standard
corrosion mix. It is believed that the large amounts of Al2O3 and SiO2 were diluting the
corrosive alkali sulfates in Deposit D. This is based on the work of Niles and Siegmund [68].
They tested kaolin (Al2O3∙2SiO2) as an additive to deposits because it is effective in reacting
with sodium. The alumina and silica inhibits the corrosion by absorbing the corrosive molten
sulfates. The standard corrosion mix does not have any silica or alumina in it, and it should be a

93
very corrosive deposit. It has the corrosive alkali sulfates K2SO4 and Na2SO4 and catalytic Fe2O3
in a stoichiometric ratio 1.5:1.5:1.0 based on the reaction given in equation 9. A test was
conducted on the T92 and NiCr alloys at 650oC with the standard corrosion mix powder in a
crucible in O2 + 100ppm SO2 for 100 hours. This produced similar results to the specimens
oxidized using Deposit D. BSE cross-sectional images of the deposit zone for the two alloys are
shown in Figure 34.
Figure 34: Fireside corrosion of (a.) Ni-22Cr and (b.) T92 at 650oC with the
standard corrosion mix powder in a crucible in O2 + 100ppm SO2 for 100hrs
Short-term tests were the focus of this work, but it was thought that the length of the test should
be increased slightly in order to cause more significant corrosion, so the duration of the
remaining tests was increased to 160 hours. It was also determined that a single alloy should be
chosen and used for each test until the proper conditions could be found. FeNiCr was the alloy
chosen. A test was conducted on duplicate specimens at 650oC with the standard corrosion mix
in O2 + 100ppm SO2 for 160 hours. This still produced negligible corrosion as can be seen from
the BSE micrograph in Figure 35. EDS analysis showed that a very thin Cr2O3 scale formed
over the alloy in the deposit zone.

94
Figure 35: Fireside corrosion of FeNiCr at 650oC with the standard corrosion mix
powder in a crucible in O2 + 100ppm SO2 for 160 hours
Following this, a test was conducted at 700oC under the same conditions, but the specimens were
cycled in and out of the hot zone of the furnace in 20 hour cycles. It was believed that the higher
temperatures and cycling of the specimens would cause increased corrosion and spallation. This
was however not the case, as the results were very similar to the previous test at 650oC. This can
be seen from the images in Figure 36. A small area in the thick deposit zone near the edge of the
sample did produce a thicker Fe2O3 oxide scale; however there was still negligible corrosion.

95
Figure 36: Fireside corrosion of FeNiCr at 700oC with the standard corrosion mix
deposit in a crucible in O2 + 100ppm SO2 for 160 hours in 20 hour cycles
The most significant change in results came when the SO2 content in the gas atmosphere
was increased. Based on the work of Corey and Reid[26], at least 250ppm of SO3 was needed to
cause corrosion with a deposit of alkali sulfates and iron oxide at 1100oF (593
oC). They found
that at higher SO3 concentrations, the reactivity of the deposits increases rapidly, and that
adequate amounts of SO3 are a major prerequisite for the formation of alkali iron trisulfates and
severe corrosion. The temperatures used in the current work for this thesis were at higher
temperatures. At these higher temperatures, the maximum amount of SO3 that can be formed
decreases and the SO3 pressure required to form sulfates increases. As was mentioned earlier,
SO3 forms from the oxidation of SO2, and catalysts can be used to speed up the reaction. From
the previous tests, at 650-700oC the atmosphere of O2 + 100ppm SO2 (pSO3 = 4.856 × 10
-4atm)
does not have enough SO2 to oxidize and form enough SO3 to cause corrosion. The gas
atmosphere was changed to O2 + 1000ppm SO2, which has a pSO3 = 4.856 ×10⁻³
atm. The

96
increased amount of SO2 along with the catalyst allow for the formation of sufficient amounts of
SO3 to cause corrosion. A test was conducted on duplicate specimens at 700oC with the standard
corrosion mix deposit in a crucible in O2 + 1000ppm SO2 for 160 hours isothermally. These
conditions showed some corrosion of the alloy. This can be seen from the macroscopic images
shown in Figure 37.
Figure 37: Fireside corrosion of FeNiCr at 700oC in O2 + 1000ppm SO2 with the
standard corrosion mix powder in a crucible for 160 hours isothermally
The surfaces of the specimens were viewed under the SEM and analyzed using EDS. In the
region where there was no deposit, spallation of protective chromium oxide occurred revealing
base metal. Severe corrosion of the alloy occurred in the region where the deposit was the
thinnest and near the edges of the specimen and hole in the specimen. In this region, a thick,
porous, non-protective Fe2O3 scale grew with some deposit material covering it and alkali
sulfates in the surrounding area. In the deposit zone where there was no corrosion, transient iron
oxides grew over a protective chromium oxide with some thicker iron oxides starting to form.
This can all be seen below in Figure 38.

97
Figure 38: BSE surface SEM images of fireside corrosion of FeNiCr at 700oC in O2
+ 1000ppm SO2 with the standard corrosion mix powder in a crucible for 160 hours
isothermally
The specimens were metallographically prepared and a cross-section was viewed under the SEM
and microscopic images are presented in Figure 39. The corrosion was in the form of deep pits.
The pitting nature of the corrosion is similar to that which occurs for Type II hot corrosion. This
will be discussed in a later section. The corrosion area has a very thick and porous external
Fe2O3 scale. This turns into an internal oxide scale forming a sulfur-rich pit consisting of mixed
chromium and iron oxides. The chromium and sulfur content increases with depth into the pit
until at the scale/alloy interface the oxygen content drops off and chromium sulfides are present.
This is typical fireside corrosion morphology. The mechanism describing fireside corrosion for
each alloy will be discussed in subsequent sections.

98
Figure 39: BSE cross-sectional SEM images of fireside corrosion of FeNiCr at 700oC
in O2 + 1000ppm SO2 with the standard corrosion mix powder in a crucible for 160 hours
isothermally
With the onset of corrosion occurring after the gas atmosphere was switched from O2 +
100ppm SO2 to O2 + 1000ppm SO2, it appears that there is a threshold level of SO2 needed to
form sufficient amounts of SO3 to cause corrosion of the alloys at 700oC. This confirms
previous research by Corey and Reid[69] explaining that sufficient SO3 content in the gas
atmosphere is a prerequisite for forming alkali iron trisulfates and therefore causing corrosion.
From the research conducted to this point, the threshold level is believed to be between 100-
1000ppm SO2. Based on the success of this test, another one was conducted under the same
conditions, but the specimen was cycled in the hot zone of the furnace in 20 hour cycles. The
results were very similar, but the corrosion area penetrated further into the deposit covered zone.
From these results, it was determined that cycling the specimens causes more severe corrosion.
Following this test, it was concluded that specimens in a gas atmosphere of O2 +
1000ppm SO2 for 160 hours in 20 hour cycles caused the most severe corrosion. The next test
was conducted with this gas atmosphere for 160 hours with the standard corrosion mix but at

99
650oC. The kinetics of fireside corrosion has been found to follow a bell-shaped curve. The
maximum in this curve occurs where sufficient amounts of SO3 are able to form and where the
largest amount of corrosion occurs. Depending on the results of this test, the temperature for the
maximum in the bell-shaped curve can be narrowed down. The results of the test can be seen in
Figure 40 below.
Figure 40: Fireside corrosion of FeNiCrAl at 650oC with the standard corrosion mix
powder in a crucible for 160 hours in O2 + 1000ppm SO2
There is significantly less corrosion than there was at 700oC. This shows that the maximum in
the fireside corrosion bell-shaped curve is greater than 650oC and is most likely near 700
oC. A
test was then conducted under the same conditions, but with no deposit in order to see the effect
of the deposit on the alloy. The results are shown below in Figure 41.

100
Figure 41: Oxidation of FeNiCr at 650oC in O2 + 1000ppm SO2 with no deposit for
160 hours
The entire specimen has severe spallation of the protective chromium oxide scale. This is
identical to the previous tests in the no deposit zone. This shows that this gas atmosphere causes
increased spallation in the absence of a deposit, and that the standard corrosion mix causes
severe corrosion of the alloy.
The test environment that caused the most severe corrosion of the specimens was
determined to be 700oC with the standard corrosion mix powder deposit in a crucible for 160
hours in 20 hours cycles in O2 + 1000ppm SO2. More alloys were then tested under these
conditions so that the corrosion resistance of different alloys could be compared. The results for
T92 and NiCr can be seen in Figures 42 and 43 respectively. Severe corrosion of the alloys
occurred as with the FeNiCr alloy, with T92 suffering the most damage.

101
Figure 42: Fireside corrosion of T92 at 700oC with the standard corrosion mix
powder in a crucible for 160 hours in 20 hour cycles in O2 + 1000ppm SO2
Figure 43: Fireside corrosion of NiCr at 700oC with the standard corrosion mix
powder in a crucible for 160 hours in 20 hour cycles in O2 + 1000ppm SO2
While severe corrosion was occurring, it was discovered that one of the duplicate
specimens tested for each of these tests had been corroding more than the other. The specimen
placed in the second crucible downstream in the gas flow was corroding more than the first. It is
believed that the platinum catalyst was placed too far out of the hot zone to catalyze significant
amounts of SO3. The first crucible was heating up the flowing gas and the Fe2O3 in the deposit
was catalyzing this hot gas enough to cause corrosion of the specimen in the second crucible.
The platinum catalyst was moved further into the furnace right next to the hot zone so that it was
hot enough to catalyze the gas and cause corrosion of the specimens in both crucibles. After the
catalyst was moved, the FeNiCr alloy was retested under the determined most severe corrosion

102
conditions and both specimens corroded significantly. Deposit D was retested under these
conditions as well, and there was still no significant corrosion. This proved that the standard
corrosion mix is the deposit that will cause the most corrosion. All of the alloys were retested at
700oC with the standard corrosion mix powder in a crucible for 160 hours in O2 + 100ppm SO2
and O2 + 1000ppm SO2. The results and an examination of the morphologies and corrosion
mechanisms will be performed for each alloy in the following sections.
Analysis of the initial test results show that the gas composition and equilibration of
sufficient amounts of SO3 is extremely important in causing corrosion. The Pt catalyst has to be
in a hot enough zone to heat up the in-coming O2 + SO2 gas flow so that both specimens have
enough SO3 equilibrated to corrode. There must also be sufficient amounts of SO2 in the gas
atmosphere (100ppm or greater) so that enough SO3 can be created. The analysis of the
corrosion microstructure and mechanism of each of the alloys selected was for the observed
environment that caused the most corrosion. This is at 700oC with the standard corrosion mix
deposit for 160 hours in O2 + 1000ppm SO2 (pSO3 = 4.856 ×10⁻³
atm). The platinum catalyst was
in close proximity of the specimen hot zone so that enough SO3 was getting equilibrated to
corrode both specimens.

103
5.1.2 FeNiCr
The results of the fireside corrosion tests on the FeNiCr alloy in O2 + 100ppm SO2 and O2 +
1000ppm SO2 are shown below in Figures 44 and 45 respectively.
Figure 44: Fireside corrosion of FeNiCr at 700oC with the standard corrosion mix
powder in a crucible for 160 hours in O2 + 100ppm SO2
Figure 45: Fireside corrosion of FeNiCr at 700oC with the standard corrosion mix
powder in a crucible for 160 hours in O2 + 1000ppm SO2
With the catalyst right next to the samples in the hot zone, both specimens corroded
significantly, and there is corrosion even in the O2 + 100ppm SO2 gas atmosphere. The catalyst
being closer to the hot zone is increasing the rate of reaction of the oxidation of SO2 into SO3.

104
This allows more SO3 to be formed, and a lower amount of SO2 is required in the gas
atmosphere. The SO2 threshold for the formation of sufficient amounts of SO3 to cause alkali
iron trisulfates to form must be close to 100ppm. At higher SO2 concentrations, more SO3 can
form and the reactivity of the deposits increases rapidly causing more degradation. This also
proves that the temperature of the catalyst plays a role in the amount of SO3 that can form.
EDS analysis of microscopic images of the specimens showed that in the zone where
there was no deposit and the specimens were exposed only to the gas atmosphere, a thin scale
rich in Fe and Cr oxides grew, but there was spallation in this area as was discussed previously.
It can be seen in Figures 44 and 45 that the entire deposit zone, from the region where the
powder starts to cover the specimen to the region where the specimen is submerged in the
deposit, was severely corroded. The corrosion morphology can be seen in Figure 46.
Figure 46: Fireside corrosion of FeNiCr at 700oC with the standard corrosion mix
powder in a crucible for 160 hours in O2 + 1000ppm SO2

105
Very thick, porous, non-protective, external Fe2O3 scales with some remnant deposit grew over
more dense internal Cr-, S- and Fe- rich oxide scale forming pits that penetrate into the substrate.
The more attack on the metal, the further into the substrate these pits penetrated. The chromium
and sulfur content increases with depth into the pits until a layer of chromium sulfides form with
some internal sulfidation.
The proposed corrosion mechanism for this alloy under these conditions can be described
similarly to the images in Figure 12 and the description given from the work of Reid[14] in
section 2.3.2. A transient iron oxide scale grows on the surface of the metal. The metal is
covered by the standard corrosion mix deposit that consists of the alkali sulfates K2SO4 and
Na2SO4 and iron oxide, Fe2O3. The gas atmosphere of O2 + SO2 flows over the platinum catalyst
next to the hot zone where SO3 is able to be formed. The SO3 migrates through the deposit to the
oxide/deposit interface where it reacts with the Fe2O3 oxide and the alkali sulfates in the deposit
to form liquid alkali iron trisulfates. This consumes the protective iron oxide scale causing the
metal to regrow a scale in the form of the porous non-protective iron oxide causing more metal
wastage. This occurs by the reaction given in equation 18. The alkali iron trisulfates are
consumed in regrowing the porous iron oxide scale. FeS and K2SO4 are also products of this
reaction, and they are able to be recycled by oxidizing the FeS to SO3 which will react with the
K2SO4 and Fe2O3 to form more trisulfates. This cycle repeats indefinitely. The mechanism for
the formation of the porous external Fe2O3 scale and the inward growing corrosion pits can be
described similarly to the Type II hot corrosion mechanism for Co-based alloys described in
Section 2.4.3.1. Inward migrating SO3 can pass through the liquid alkali iron trisulfates via an

106
S2O72-
/SO42-
exchange reaction, where it will react with Cr in the substrate to form the inward
growing Cr2O3 and CrS corrosion pits. The external Fe2O3 scale will simultaneously form via an
3Fe2+
/2Fe3+
exchange reaction similar to that for Co.
5.1.3 T92
The results of the fireside corrosion test with T92 at 700oC with the standard corrosion mix
powder in a crucible for 160 hours in O2 + 100ppm SO2 and O2 + 1000ppm SO2 are shown
below in the macroscopic images in Figures 47 and 48 respectively. There was noticeably more
corrosion of T92 than of FeNiCr. T92 is a boiler steel that is not as corrosion resistant as the
model Fe-12Ni-18Cr austenitic stainless steel. T92 has half of the amount of Cr (9%) and
minimal amounts of Ni compared to the model FeNiCr. It was discussed previously that
increasing chromium contents increases the corrosion resistance of the alloy. Ni also adds
increased corrosion resistance to the FeNiCr alloy. With this information, T92 would not be
expected to perform as well. Significant corrosion occurred even in the lower SO2 atmosphere.
It was determined that the SO2 threshold for the formation of alkali iron trisulfates must be closer
to 100ppm SO2 based on the results of the FeNiCr alloy. Due to the decreased corrosion
resistance of T92, once the alkali iron trisulfates formed, more degradation occurred.
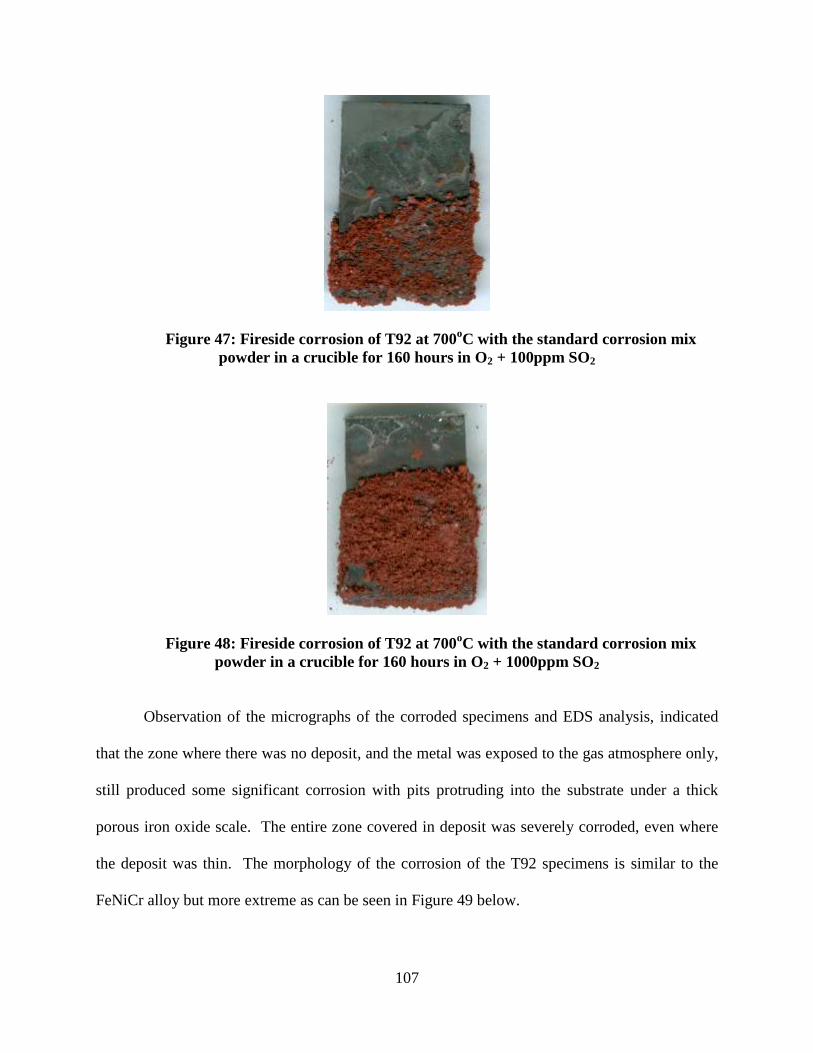
107
Figure 47: Fireside corrosion of T92 at 700oC with the standard corrosion mix
powder in a crucible for 160 hours in O2 + 100ppm SO2
Figure 48: Fireside corrosion of T92 at 700oC with the standard corrosion mix
powder in a crucible for 160 hours in O2 + 1000ppm SO2
Observation of the micrographs of the corroded specimens and EDS analysis, indicated
that the zone where there was no deposit, and the metal was exposed to the gas atmosphere only,
still produced some significant corrosion with pits protruding into the substrate under a thick
porous iron oxide scale. The entire zone covered in deposit was severely corroded, even where
the deposit was thin. The morphology of the corrosion of the T92 specimens is similar to the
FeNiCr alloy but more extreme as can be seen in Figure 49 below.

108
Figure 49: Fireside corrosion of T92 at 700oC with the standard corrosion mix
powder in a crucible for 160 hours in O2 + 1000ppm SO2
The corrosion of T92 is much greater than that of the model FeNiCr alloy. Corrosion pits similar
to those found in the deposit zone of the FeNiCr alloy can be seen in the zone where there is no
deposit. In this zone, where there was no pitting, a thick non-protective iron oxide grew. The
pits were composed of a very porous, non-protective, external iron oxide scale. This turns into
an internal oxide scale that is more Cr and S rich. The chromium and sulfur contents increase
with depth into the pit until, at the base, a layer of chromium sulfides forms. In the deposit zone,
the corrosion is significantly worse. It appears as though such severe pitting occurred that the
pits combined for a more frontal attack on the alloy forming a larger corrosion layer. The
composition of the corrosion products are the same. A rather thick porous iron oxide grows over
a scale with increased chromium and sulfur content, which increases until a chromium sulfide
layer forms. The degradation and attack is much further into the substrate than the FeNiCr alloy,
and therefore the corrosion is much more severe. The mechanism for the corrosion of the T92
alloy is believed to be the same as that for the FeNiCr alloy.

109
5.1.4 Ni-Cr
The results of the fireside corrosion test with Ni-22Cr at 700oC with the standard corrosion mix
powder in a crucible for 160 hours in O2 + 100ppm SO2 and O2 + 1000ppm SO2 are shown
below in Figures 50 and 51 respectively. There was not as much degradation of the Ni-Cr alloy
as there was in the Fe-based alloys. This is as expected. Ni-based alloys have better high
temperature oxidation and corrosion resistance than Fe-based alloys due to their slower oxide
growth rates. This alloy also has a higher chromium content (22%) than the Fe-based alloys
providing it with even more corrosion resistance. There was also not as much corrosion in the
O2 + 100ppm SO2 gas atmosphere. As was mentioned previously, the SO2 threshold level for the
formation of enough SO3 to cause alkali iron trisulfates was determined to be close to 100ppm
SO2 based on the FeNiCr results. This threshold level should not change, but the increased
corrosion resistance of the Ni-based alloys prevents the alkali iron trisulfates from causing severe
degradation that occurred with the steel alloys. Higher SO3 (1000ppm SO2) concentrations
causes the reactivity of the deposits to increase enough so that some degradation occurs. This
was the case for all of the Ni-based alloys tested.

110
Figure 50: Fireside corrosion of Ni-22Cr at 700oC with the standard corrosion mix
powder in a crucible for 160 hours in O2 + 100ppm SO2
Figure 51: Fireside corrosion of Ni-Cr at 700oC with the standard corrosion mix powder in
a crucible for 160 hours in O2 + 1000ppm SO2 (a.) before the platinum catalyst was moved
next to the hot zone and (b.) after the platinum catalyst was moved next to the hot zone
The images shown in Figure 51 are of the specimens tested before and after the platinum
catalyst was moved next to the hot zone. Before the catalyst was moved, corrosion was
occurring in the deposit zone on one of the duplicate specimens only. This was not the case after

111
the catalyst was moved closer to the hot zone. Microscopic analysis showed that in the zone
where there was no deposit and the metal specimen was exposed to the gas atmosphere only, a
protective Cr2O3 scale grew. There was significant corrosion in the areas covered by the deposit
with the most corrosion occurring where the deposit was the thinnest. The corrosion
morphology is shown below in Figure 52.
Figure 52: Fireside Corrosion of Ni-22Cr at 700oC with the standard corrosion mix
powder in a crucible for 160 hours in O2 + 1000ppm SO2
The corrosion is similar in both the specimens before and after the catalyst movement. An
external NiO scale grew over a thin Cr2O3 scale which turned into internal Cr2O3 growth with
significant chromium sulfide formation penetrating into the substrate. The sulfides appear to be
a precursor to further corrosion and pitting into the substrate. The micrographs in Figure 50
show that the pitting and corrosion was not as severe as the Fe-based alloys. As will be seen in a
later section, the appearance of chromium sulfides is common for Ni-based alloys under hot
corrosion conditions.
One of the specimens tested before the catalyst movement did not corrode significantly in
the deposit zone, however it did show severe corrosion in the areas around the edges of the hole
of the specimen and around the top edge. This can be seen in Figure 53.

112
Figure 53: Fireside corrosion of Ni-22Cr at 700oC with the standard corrosion mix
powder in a crucible for 160 hours in O2 + 1000ppm SO2
A very thick external NiO scale grew over an internal Cr- and Ni- rich oxide scale. The sulfur
and chromium content increases with depth into the scale as with the FeNiCr and T92 alloys. At
the metal/oxide interface, chromium sulfides form a layer that would penetrate and cause further
attack with continued exposure to the environment. It is not known why the specimen suffered
so much damage in the non-deposit zone. The edges of a specimen can be expected to corrode
more due to a larger surface area, but not to this extent where there is no deposit.
The mechanism for corrosion under the tested conditions for the nickel-based alloys is
not as clear as the steels. As was stated earlier, the conditions used for these tests are to simulate
the environments that occur in actual coal-fired boilers. Ni-based alloys are not currently used in
coal-fired boiler hardware, however with increasing temperatures and pressures, they may be
needed for their increased corrosion resistance. The standard corrosion mix was determined
from the stoichiometric values of the alkali iron trisulfates. This deposit was used in order to
form these trisulfates on the steel alloys and cause corrosion. This same deposit was used on the
nickel-based alloys, and it did cause corrosion of the specimens. The combination of the Ni-
based alloys with the standard corrosion mix does not as accurately simulate the corrosion that

113
occurs in actual coal-fired boilers as with the steel alloys. The corrosion that is occurring with
these alloys and this deposit under these conditions can possibly be described by the following
mechanisms. The corrosion could be due to the reaction of the SO3 in the gas with the Fe2O3 and
the alkali sulfates in the deposit to form the alkali iron trisulfates, which is what the deposit was
designed to do. In this case, the Fe2O3 comes entirely from the deposit, whereas with steels,
Fe2O3 can come from the thermally grown oxide scale as well. Usually the liquid alkali iron
trisulfates form at the expense of this thermally grown Fe2O3 scale, but with Ni-based alloys, this
is not possible. A NiO scale also will prevent the alkali iron trisulfates from reacting with the
base metal substrate, preventing serious corrosion that occurred with the steel alloys. With the
formation of alkali iron trisulfates on the surface of the specimen, the corrosion mechanism
could follow the mechanism proposed by Cain and Nelson[32] that was mentioned earlier, where
the liquid trisulfates penetrate and reach the base metal surface through cracks or other defects in
the scale. There they would react with the base metal and cause metal wastage in a reaction
similar to that shown in equation 18. With this reaction, sulfides would form which was seen in
the experimental results. The amount of corrosion caused by this mechanism would be less than
for steels, because it requires the alkali iron trisulfates to react with the bare metal surface. There
will be a protective NiO or Cr2O3 scale grown on the specimen surface, so the alkali iron
trisulfates will have to penetrate the scale through cracks or other defects in order to get to the
metal substrate. The amount of attack would be smaller and more localized than the previously
described mechanism of attack for steels in which the trisulfates form on the surface at the
expense of the thermally grown iron oxide scale. This could help explain why this alloy
underwent less corrosion than the steel alloys.

114
The mechanism could also be similar to the corrosion mechanism for Type II hot
corrosion. The mechanism for corrosion of Ni and Co-based alloys under Type II conditions was
explained earlier. There is Na2SO4 in the standard corrosion mix, and along with SO3 in the gas
atmosphere, a eutectic liquid can form and cause corrosion. Although Co-based alloys are more
susceptible to Type II hot corrosion, it can still occur with Ni-based alloys. This will be
discussed in more detail in the Type II hot corrosion section. The appearance of sulfides at the
metal/oxide interface is common for Ni- based alloys that undergo hot corrosion. The fireside
corrosion mechanism for Ni-based alloys could also be a combination of corrosion occurring
from alkali iron trisulfate formation and from Na2SO4-induced hot corrosion. A comparison of
fireside corrosion and Type II hot corrosion of these alloys will be discussed in a future section.
5.1.5 IN-617
The results of the fireside corrosion test on IN-617 at 700oC with the standard corrosion mix
powder in a crucible for 160 hours in O2 + 100 and O2 + 1000ppm SO2 are shown in Figures 54
and 55 respectively.

115
Figure 54: Fireside corrosion of IN-617 at 700oC with the standard corrosion mix
powder in a crucible for 160 hours in O2 + 100ppm SO2
Figure 55: Fireside corrosion of IN-617 at 700oC with the standard corrosion mix
powder in a crucible for 160 hours in O2 + 1000ppm SO2
As was the case with the Ni-22Cr alloy, there was not as much degradation as the Fe-based steel
alloys. The pitting was not as severe. The alloy seems to have performed even better than the
model NiCr alloy. IN-617 is also a Ni-based alloy, so its corrosion resistance should be greater
than that of the steels, as was explained previously. It also has 22%Cr along with other element
additions which give it its good corrosion resistance. The corrosion morphology can be seen in
Figure 56. In the non-deposit zone, an oxide scale grew that consisted of external transient NiO
with some Cr2O3 and internal Cr2O3. Corrosion occurred throughout the deposit zone, but as was

116
the case with the Ni-22Cr alloy, the most severe corrosion seems to have occurred where the
deposit was the thinnest. EDS analysis showed that in the deposit zone, a thicker external NiO
oxide scale grew over an internal Cr2O3 scale with some sulfidation penetrating into the substrate
as with the Ni-22Cr alloy. Nickel-based alloys form inward penetrating sulfides, as will be seen
in the Type II hot corrosion section described later. The sulfide penetration is not as pronounced
as Ni-22Cr, which may be due to the Co addition. As will be seen in a later section, sulfides are
not seen penetrating further into the substrate for Co-based alloys like they are for Ni-based
alloys. The corrosion mechanism for IN-617 is believed to be similar to Ni-Cr.
Figure 56: Fireside corrosion of IN-617 at 700oC with the standard corrosion mix
powder in a crucible for 160 hours in O2 + 1000ppm SO2
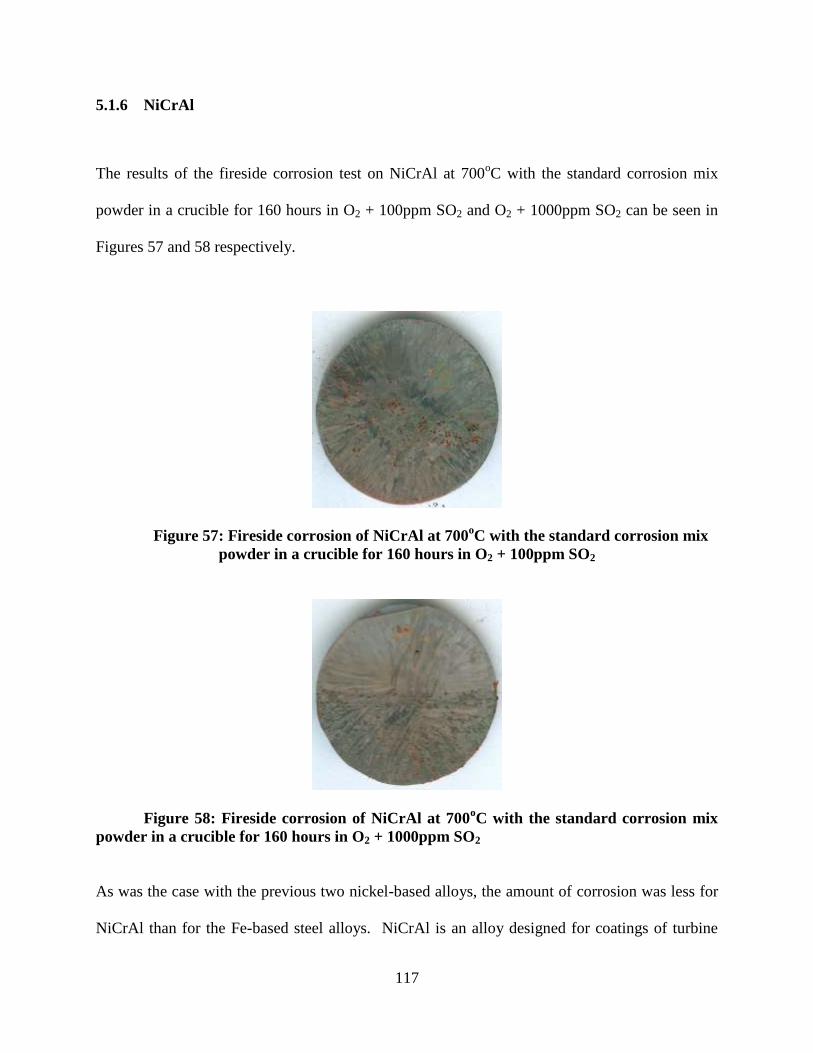
117
5.1.6 NiCrAl
The results of the fireside corrosion test on NiCrAl at 700oC with the standard corrosion mix
powder in a crucible for 160 hours in O2 + 100ppm SO2 and O2 + 1000ppm SO2 can be seen in
Figures 57 and 58 respectively.
Figure 57: Fireside corrosion of NiCrAl at 700oC with the standard corrosion mix
powder in a crucible for 160 hours in O2 + 100ppm SO2
Figure 58: Fireside corrosion of NiCrAl at 700oC with the standard corrosion mix
powder in a crucible for 160 hours in O2 + 1000ppm SO2
As was the case with the previous two nickel-based alloys, the amount of corrosion was less for
NiCrAl than for the Fe-based steel alloys. NiCrAl is an alloy designed for coatings of turbine
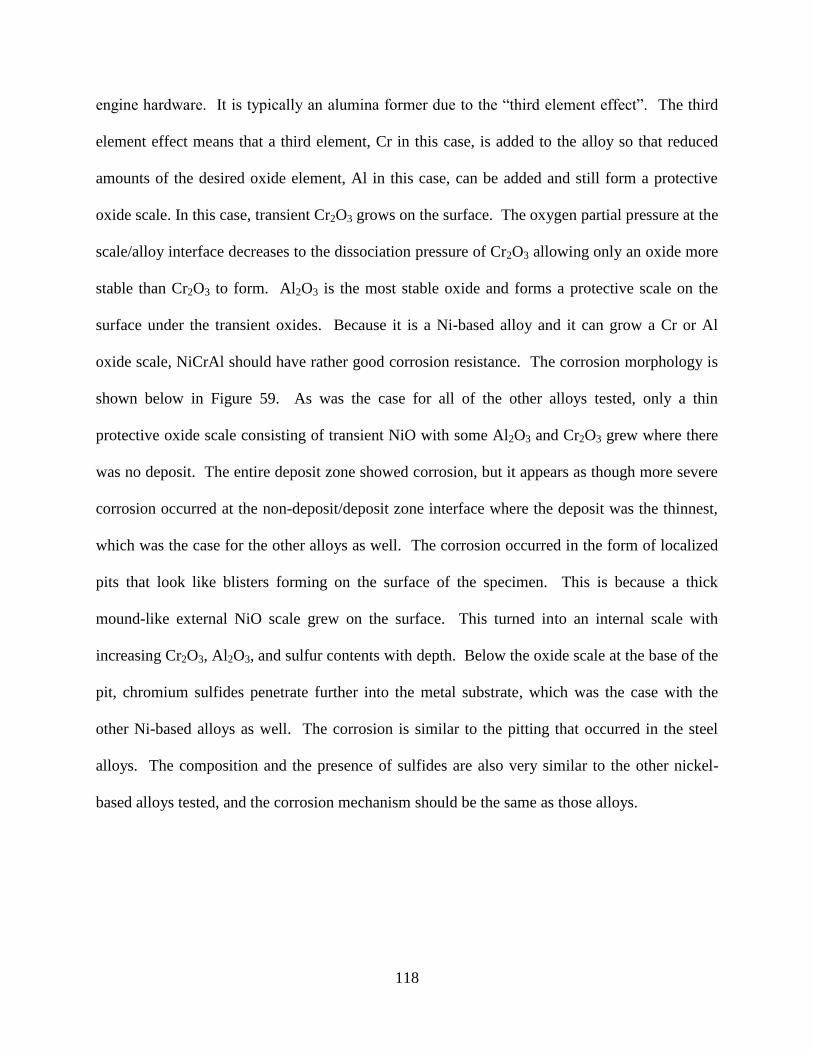
118
engine hardware. It is typically an alumina former due to the “third element effect”. The third
element effect means that a third element, Cr in this case, is added to the alloy so that reduced
amounts of the desired oxide element, Al in this case, can be added and still form a protective
oxide scale. In this case, transient Cr2O3 grows on the surface. The oxygen partial pressure at the
scale/alloy interface decreases to the dissociation pressure of Cr2O3 allowing only an oxide more
stable than Cr2O3 to form. Al2O3 is the most stable oxide and forms a protective scale on the
surface under the transient oxides. Because it is a Ni-based alloy and it can grow a Cr or Al
oxide scale, NiCrAl should have rather good corrosion resistance. The corrosion morphology is
shown below in Figure 59. As was the case for all of the other alloys tested, only a thin
protective oxide scale consisting of transient NiO with some Al2O3 and Cr2O3 grew where there
was no deposit. The entire deposit zone showed corrosion, but it appears as though more severe
corrosion occurred at the non-deposit/deposit zone interface where the deposit was the thinnest,
which was the case for the other alloys as well. The corrosion occurred in the form of localized
pits that look like blisters forming on the surface of the specimen. This is because a thick
mound-like external NiO scale grew on the surface. This turned into an internal scale with
increasing Cr2O3, Al2O3, and sulfur contents with depth. Below the oxide scale at the base of the
pit, chromium sulfides penetrate further into the metal substrate, which was the case with the
other Ni-based alloys as well. The corrosion is similar to the pitting that occurred in the steel
alloys. The composition and the presence of sulfides are also very similar to the other nickel-
based alloys tested, and the corrosion mechanism should be the same as those alloys.

119
Figure 59: Fireside corrosion of NiCrAl at 700oC with the standard corrosion mix
powder in a crucible for 160 hours in O2 + 1000ppm SO2
5.1.7 NiCrAlMo
The results of the fireside corrosion test with NiCrAlMo at 700oC with the standard corrosion
mix powder in a crucible for 160 hours in O2 + 100ppm SO2 and O2 + 1000ppm SO2 can be seen
in Figures 60 and 61 respectively.
Figure 60: Fireside corrosion of NiCrAlMo at 700oC with the standard corrosion
mix powder in a crucible for 160 hours in O2 + 100ppm SO2

120
Figure 61: Fireside corrosion of NiCrAlMo at 700oC with the standard corrosion
mix powder in a crucible for 160 hours in O2 + 1000ppm SO2
This alloy behaved similarly to the NiCrAl alloy and the other nickel-based alloys, in that it did
not corrode as much as the Fe-based steel alloys. The corrosion microstructure is shown below
in Figure 62. In the area where there was no deposit, a thin external NiO scale grew with some
internal Al- and Cr- rich oxides. There were also some chromium sulfides penetrating into the
substrate. The deposit zone corroded in a similar manner as the NiCrAl alloy. There were
localized areas of pitting that could be seen as the dark areas on the macroscopic image in Figure
61. A thick NiO scale grew over pits that were rich in Ni,Cr,Al,S, and O. The sulfur content
increases with depth into the pit until the base is reached where internal chromium sulfides
formed and started to penetrate further into the substrate. The pitting attack is common for all of
the alloys tested, and the appearance of the chromium sulfides is common with the other Ni-
based alloys tested. The corrosion mechanism should be similar to that of the other Ni-based
alloys as well.

121
Figure 62: Fireside corrosion of NiCrAlMo at 700oC with the standard corrosion
mix powder in a crucible for 160 hours in O2 + 1000ppm SO2
5.2 TYPE II HOT CORROSION
The Type II hot corrosion tests that will be described in this section were performed by Michael
Task for his Master’s Thesis at the University of Pittsburgh.[66] The results of this work will be
compared to those for the performed fireside corrosion and disk corrosion tests. For his research,
Michael exposed NiCrAlY and CoCrAlY alloys to the Type II hot corrosion conditions
described previously in the experimental section (pSO3 = 4.856×10⁻³
atm) . These tests were only
conducted for 10 hours. From these tests we can observe typical Type II hot corrosion
microstructure. Cross-sectional images of the corrosion microstructures can be seen in Figure 63
below.[66]
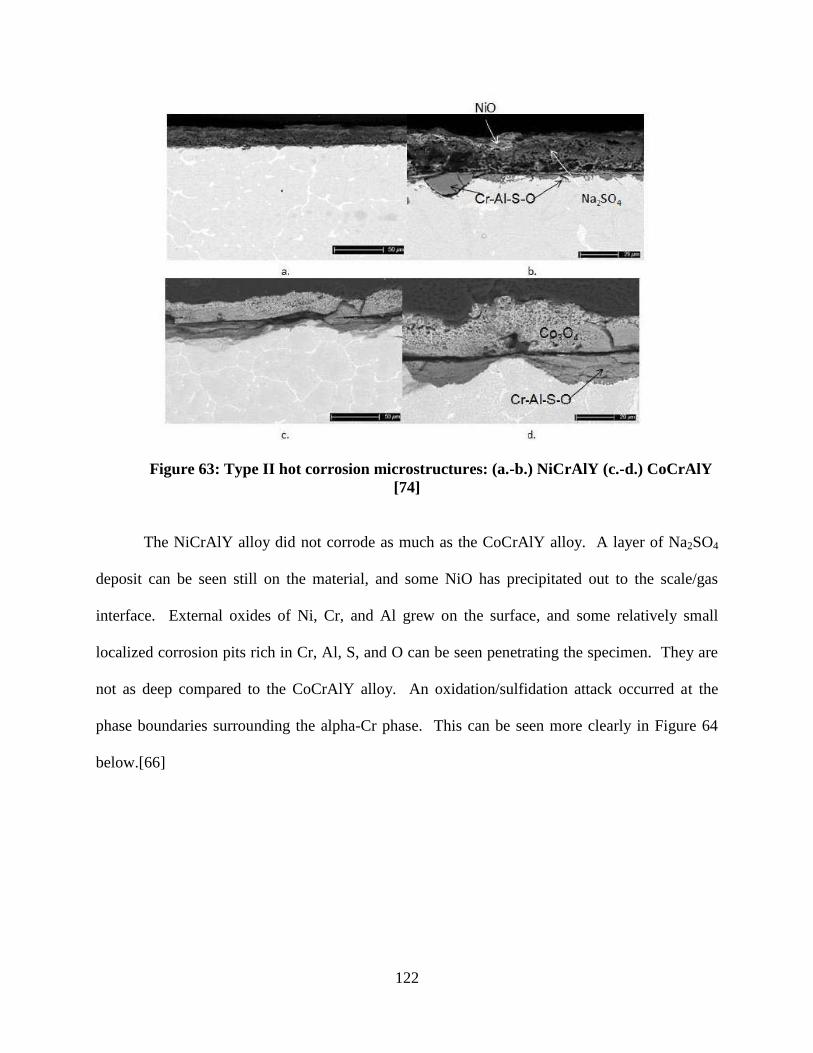
122
Figure 63: Type II hot corrosion microstructures: (a.-b.) NiCrAlY (c.-d.) CoCrAlY
[74]
The NiCrAlY alloy did not corrode as much as the CoCrAlY alloy. A layer of Na2SO4
deposit can be seen still on the material, and some NiO has precipitated out to the scale/gas
interface. External oxides of Ni, Cr, and Al grew on the surface, and some relatively small
localized corrosion pits rich in Cr, Al, S, and O can be seen penetrating the specimen. They are
not as deep compared to the CoCrAlY alloy. An oxidation/sulfidation attack occurred at the
phase boundaries surrounding the alpha-Cr phase. This can be seen more clearly in Figure 64
below.[66]

123
Figure 64: Type II hot corrosion microstructure of NiCrAlY demonstrating
interphase attack[74]
The attack on the CoCrAlY alloy was much more severe and is typical for what has been seen in
the literature for Type II hot corrosion of Co-based alloys.[59-62] There was extensive pitting
rich in Cr, Al, S, and O with a layer rich in Al and S near the base of the pit. A thick Co-rich
oxide layer was found over top of the pits that spalled very easily during cooling. The pitting
attack seen in the images above are typical for that of Type II hot corrosion. The CoCrAlY alloy
specimens corroded similarly to other cobalt based alloys tested under these Type II hot
corrosion conditions in the past. The mechanism described earlier in section 2.4.3 from the work
of Luthra and Chiang[62 and 64] adequately describes what occurred in the current work. The
hot corrosion of metals below the melting point of Na2SO4 is dependent on the formation of a
molten MSO4-Na2SO4 eutectic. This was proven in Michael Task’s PhD thesis. In his PhD
thesis,[67] Michael pre-oxidized specimens and exposed them to the Type II hot corrosion
conditions described earlier (pure Na2SO4 deposit) for 10 hours. This produced negligible
corrosion because insufficient transient oxides grew following the pre-oxidation to cause a liquid
eutectic melt. He had to use deposit mixtures containing Na2SO4-NiSO4 and Na2SO4-CoSO4,
because they are already molten at 700oC and do not need to react with the transient oxides to

124
form the liquid eutectic melt. Tests with the pre-oxidized specimens and the eutectic deposits
produced localized penetration of the pre-formed Al2O3 oxide at Y/Hf rich regions in the scale
and rapid corrosion in those areas. Without pre-oxidation and using the eutectic deposit
produced severe corrosion. It was clear from these results that that pre-oxidation increased
corrosion resistance and that a liquid eutectic deposit is needed for corrosion to occur. Sufficient
transient oxides are needed to produce this.
CoCrAlY has less corrosion resistance to Type II degradation than NiCrAlY due to the
greater stability of CoSO4 than NiSO4. The reaction given in equation 39 can be compared to
that given below in equation 46.
NiO + SO3 = NiSO4 (46)
For the reaction given in equation 39, CoSO4 forms from Co3O4 and ΔG700oC = -59.3 kJ/mol
CoSO4. For the reaction given in equation 46, NiSO4 forms from NiO and ΔG700oC = -52.8
kJ/mol NiSO4. From these values, it can be seen that CoSO4 is more stable and will form at
lower pSO3. The solubility of MSO4 can also be taken into account. Figure 65 shows the binary
diagram for NiSO4-Na2SO4.[30]

125
Figure 65: NiSO4-Na2SO4 phase diagram
At 700oC, Na2SO4 is able to dissolve 22 mol% NiSO4 before a liquid will form. Compare this
with the CoSO4-Na2SO4 phase diagram shown previously in Figure 26. According to this
diagram only 19 mol% CoSO4 can be dissolved before a liquid will form. Co is more stable
when solubility is concerned as well, and therefore it has poorer Type II hot corrosion resistance
than nickel-based alloys.
5.3 TYPE II HOT CORROSION OF DISK ALLOYS
5.3.1 Oxidation of Alloys in Air
Before any tests were conducted on the selected alloys with Na2SO4 deposits, each of the disk
alloys was oxidized in air at 700oC for 100 hours isothermally without no deposit. This was used

126
as a baseline for comparison, so that the effect of the salt deposit could be determined. The
results can be seen in Figure 67 below. Each of the alloys developed an extremely thin
protective oxide as can be seen in the BSE micrographs. IN738 grew a very thin oxide scale
consisting of NiO, Al2O3, and Cr2O3. The white areas in the substrate of the specimen are Laves
phase. IN-617 and RR1000 both grew very thin oxide scales consisting of Cr2O3 and transient
NiO. NiCrAl grew an oxide scale consisting of transient NiO over Al2O3. NiCrAlMo grew
localized mounds of external NiO with internal Al2O3 underneath. It is not known exactly why
there was an increase in oxidation rate for this alloy. The Mo addition could have caused this.
The other Mo-containing alloys (RR1000 and IN-617) contain higher Cr and Al contents, so that
the Mo addition may not have affected them as much. The oxidation microstructures shown in
Figure 67 will be used for comparison with each of the following tests.
Figure 66: Cross-sections of selected disk alloys after oxidation in air

127
5.3.2 Oxidation of Alloys in Air with Na2SO4 Deposit
Each of the alloys selected was then tested at 700oC in air for 100 hours isothermally with the
Na2SO4 deposit. The results can be seen in Figure 68 below. NiCrAl and IN-738 did not
undergo any substantial attack. They grew a very thin oxide scale similar to the previous test
without the deposit. There were some small localized areas of internal oxidation and sulfide
penetration, but not to the extent of the other alloys tested.
Figure 67: Oxidation of selected disk alloys in air with Na2SO4 deposit at 700oC
The Mo-containing alloys (NiCrAlMo, IN-617, and RR1000) produced more degradation.
NiCrAlMo suffered the most corrosion as can be seen in Figure 68. A NiO scale grew on the
outside over the salt deposit. An internal oxide scale grew consisting of NiO, Cr2O3, and Al2O3
with some chromium sulfides penetrating into the substrate. This appearance of internal
chromium sulfides is similar to observations in previous Type II hot corrosion exposures. EDS

128
also indicated some Mo in the corrosion pit at the metal/oxide interface. IN-617 and RR1000
showed similar microstructures, but the degradation was not as severe. A NiO scale traveled
through and formed over the deposit, which covered an internal scale of Cr2O3 and Al2O3.
Traces of Mo could also be seen in the internal oxide scale. These microstructures show that
the NiO is diffusing through the deposit and reforming over top of it and Mo was found at the
scale/alloy interface. This is similar to a microstructure that might occur with alloy induced
acidic fluxing Type I hot corrosion that was described earlier. Given enough time, it is believed
that each of these three Mo-containing alloys would suffer severe degradation, and the
microstructures would look like that of specimen that has undergone alloy-induced acidic
fluxing. The temperatures used here are in the Type II hot corrosion range however. The
presence of Mo is causing these alloys to corrode at 700oC in air even without the presence of
SO3. Transient MoO3 is possibly reacting with the salt to form sodium molybdate, releasing
SO2. This is shown by the reaction given in equation 47.
MoO3 + Na2SO4 = Na2MoO4 + SO2 + ½O2 (47)
The melting point of sodium molybdate is 687oC, so at the temperature tested (700
oC) it becomes
molten. The molten Na2MoO4 would then be able to penetrate the protective oxide scale and
cause corrosion of the alloy substrate. The mechanism is similar to the mechanism for Type I
alloy-induced acidic fluxing described earlier, and a comparison will be discussed in more detail
in section 5.4.2.
To prove that it was the formation of liquid sodium molybdate could be causing the
corrosion of the alloys at 700oC, a test was conducted on the three Mo-containing alloys at
650oC. This is below the melting point of sodium molybdate (687
oC), so a liquid should not
form to cause severe corrosion. This was indeed the case, as can be seen from the results of this

129
test in Figure 69. Each of the alloys grew a thin oxide scale consisting of predominantly Cr2O3
and transient NiO. There were some small localized areas of internal Cr2O3 and Al2O3 growth,
but the fluxing and the corrosion did not occur as at 700oC.
Figure 68: Oxidation of Mo-containing disk alloys in air with Na2SO4 deposit at
650oC
5.3.3 Type II Hot Corrosion of Disk Alloys
The selected disk alloys were tested under the Type II hot corrosion conditions described in the
experimental section (Na2SO4 deposit at 700oC for 100hours isothermally in O2 + 1000ppm
SO2). The results can be seen in Figure 70 below.

130
Figure 69: Type II hot corrosion of disk alloys at 700oC in O2 + 1000ppm SO2
The attack on each of the alloys tested was greater in an SO2 atmosphere than when tested in air
(Fig. 68). As was mentioned previously, SO3 is required to cause the formation of the liquid
eutectic Na2SO4-MSO4 melt to cause Type II hot corrosion, and this appears to be more
corrosive than the degradation caused on the Mo-containing alloys by the formation liquid
Na2MoO4 in air.
The NiCrAl alloy developed a thick NiO scale that grew over top of internal oxide pits
rich in Ni, Al, Cr, O, and S. The sulfur content increases with depth into the pits and chromium
sulfides can be seen penetrating into the substrate. IN-738, NiCrAlMo, IN-617, and RR1000
suffered severe spallation upon cooling of the specimens. EDS analysis showed that where there
was severe spallation, a layer rich in Al, S, and O remained. This is similar to the formation of
the layer rich in Cr and S at the base of the pits found in previous fireside corrosion and Type II
hot corrosion exposures. The spallation on the IN-738 alloy was so severe that no intact oxides
or full corrosion product could be found. Where there was no spallation on the NiCrAlMo alloy,

131
a thick external NiO oxide scale grew with remnant Na2SO4 deposit intermixed into the scale.
This turned into internal pits rich in Al, Cr, S, and O. The base of the pits was identical to the
sulfide layer found where spallation occurred. IN-617 suffered an attack similar to the
NiCrAlMo alloy, but the degradation was greater. Where the oxide had not spalled away, a thick
NiO scale grew with similar circular remnant Na2SO4 deposits intermixed into the scale. This
resulted in deeper internal pits than observed for the other alloys. These were rich in Cr, O, and
S. Some circular Na2SO4 deposit could also be seen in the internal pits as well. At the base of
the pits is a lighter region that contained large amounts of Cr and S. RR1000 also had an attack
similar to IN-617 and NiCrAlMo. External NiO and Co3O4 grew over top of the sodium sulfate
deposit. There were also internal pits rich in Cr2O3 and S. This is similar to what was seen in
the absence of SO2 as was described earlier. The deep pitting attack and the appearance of a
sulfide layer at the base of the pits are similar to what was described for previous fireside
corrosion and Type II hot corrosion tests.
The alloys that did not contain Mo were tested under Type II hot corrosion conditions,
therefore the mechanism for corrosion of these alloys can also be adequately described by the
Type II hot corrosion mechanisms proposed from Luthra[62] and Chiang[64] given in Section
2.4.3. The mechanism of corrosion for the alloys containing Mo can be described by a
combination of the mechanisms given previously for the Mo-containing alloys in air and Type II
hot corrosion. This will be described in section 5.4.3 in more detail, along with a comparison of
the Type II hot corrosion of the disk alloys with that of the NiCrAlY.

132
5.4 COMPARISON OF THE CORROSION MICROSTRUCTURES AND
MECHANSIMS
The mechanisms and characteristic microstructures of some of the various types of corrosion that
can occur in coal-fired power plants and in turbine engine systems have been described in
previous sections. The results of tests exhibiting these types of corrosion have also been
described and compared with those found in the literature. Much of the work that was performed
matched up well with the literature and with what has been seen in previous research. However,
there are similarities between characteristics of different types of corrosion, or an aspect of a type
of corrosion which is occurring in an environment that is not generally considered to be
characteristic for that type. There may be a broader range in which we can define these different
types of corrosion. We may be able to include some forms of corrosion into another. We may
also need to identify new forms of corrosion that can combine characteristics from different
known types. The purpose of the following sections is to compare and contrast the different
types of corrosion tested for this work, and to gain a better understanding of the different
corrosion mechanisms. A table summarizing the comparison of the characteristics, corrosion
products, and mechanisms of each type of corrosion is shown below for reference.

133
Table 7: Comparison of the characteristics, corrosion products, and mechanisms for
each type of corrosion tested at 700oC
5.4.1 Fireside Corrosion and Type II Hot Corrosion
The results of the fireside corrosion tests for six different selected alloys was described in
Sections 5.1.2-5.1.7, and the results from the Type II hot corrosion tests were described in
sections 5.2.1-5.2.2. There were similarities in the results, even though they occur in different
industrial applications. Fireside corrosion occurs in coal-fired power plants, while Type II hot
corrosion usually occurs on gas turbine blade hardware. They both typically occur at
temperatures near 700oC in gas atmospheres that contain sufficient amounts of SO3 to cause
corrosion. The main difference between the two is the type of deposit that is responsible for
causing the liquid-phase corrosion. The deposits that form on the surface of boiler hardware and
cause fireside corrosion are quite complex. They come from ash from burning coal, and can
contain many different components. The main causes of corrosion in these deposits are complex
sodium and potassium sulfates, which react with the gas atmosphere and the thermally grown

134
iron oxide scale to form liquid alkali iron trisulfates. The deposit that was used in the current
research was designed to cause significant corrosion of the alloys tested. This was the standard
corrosion mix which, as was stated earlier, contains K2SO4:Na2SO4:Fe2O3 in a 1.5:1.5:1.0 molar
ratio. The corrosion environment was simulated, but it is believed that the results from these
tests are relevant in describing the coal combustion atmosphere. The deposits that occur in Type
II hot corrosion are also complex. Na2SO4 is the main contributor to corrosion and is the deposit
that was used for this study. Na2SO4 reacts with SO3 in the gas atmosphere and the oxide scale
to form a liquid eutectic melt and causes degradation of the metal.
The typical microstructure of Type II hot corrosion can be seen in Figure 63. These are
the results Michael Task obtained in exposing NiCrAlY and CoCrAlY alloys to Type II hot
corrosion conditions for 10 hours. As was described earlier, the attack occurs in the form of
localized pits. A thick oxide scale consisting of Ni or Co oxides, depending on the alloy formed
over the corrosion pits. These oxide scales spalled easily upon cooling, and are therefore
unprotective. The localized pits were rich in Al, Cr, S, and O and can be seen penetrating into
the specimen. The NiCrAlY alloy produced some oxidation/sulfidation with sulfides penetrating
into the substrate. The CoCrAlY alloy had a layer rich in Al and S at the base of the pits. These
characteristics are similar to what occurred in the fireside corrosion tests.
The materials used in coal-fired power plants are typically steels; however the attack that
occurred was in the form of pits similar to the NiCrAlY and CoCrAlY Type II hot corrosion
tests. The corrosion microstructures for the fireside corrosion tests can be seen in Sections 5.1.2-
5.1.7. The steel alloys produce pits that penetrate deep into the metal substrate. Just as in the
Type II hot corrosion tests, a porous, non-protective scale, in this case consisting of iron oxide,
formed over the pits which were more Cr, S, and O rich. The Cr and S content increased with

135
depth into the pits until a layer which was only rich in Cr and S formed with some internal
sulfidation. This is almost exactly the same as the Type II hot corrosion tests described in the
previous paragraph. The Ni-based alloys used in the fireside corrosion tests behaved somewhat
similarly to the NiCrAlY alloy tested in Type II hot corrosion exposures. This can be seen in the
comparison image in Figure 70 below. The corrosion was greater in the fireside corrosion tests,
but this may be due to a longer duration test. Each produced Ni-rich oxide scale with some Cr-
and Al oxides over top of a pit that was rich in Al, Cr, S, and O. Both also contained some
internal sulfidation. The sulfides that formed in the fireside corrosion tests were more prevalent
than in the Type II hot corrosion tests on NiCrAlY. There were no sulfides observed in the
CoCrAlY alloy.
Figure 70: Comparison of type II hot corrosion of NiCrAlY to fireside corrosion of
NiCrAlMo
Comparing both types of corrosion, it is easy to see that the effects of each on their
respective alloy substrates are very similar. It could be argued that fireside corrosion is just a
more severe form of Type II hot corrosion. Both forms of corrosion occur at the same
temperature (700oC) and in gas atmospheres containing SO3. The main difference between the

136
two is that fireside corrosion has a more complex deposit and occurs typically on steel boiler
tubes rather than Ni-based gas turbine hardware, which causes it to have a slightly different
mechanism than Type II hot corrosion. The corrosion mechanisms for fireside corrosion of steel
alloys and Type II hot corrosion of NiCrAlY and CoCrAlY were described in sections 2.3.2 and
2.4.3, respectively. Although the exact conditions of the two forms of corrosion are different,
they both have the same effect on their respective alloy substrates. The pitting attack and the
corrosion products that occur behave in a similar manner. The deposit that occurs in the fireside
corrosion of steels becomes liquid due to reactions with the deposit and gas atmosphere and
forms at the expense of the thermally grown transient iron oxide. This liquid penetrates to the
substrate disrupting the formation of a protective scale causing corrosion. More of the harmful
SO3 in the gas atmosphere is then able to penetrate further and continue the corrosion pitting
process creating further degradation. The same could be said of that for Type II hot corrosion.
The deposit becomes liquid due to reactions with the deposit and the gas atmosphere and forms
at the expense of the thermally grown transient nickel oxide. The liquid penetrates to the
substrate disrupting the formation of a protective oxide scale and causing corrosion. More of the
harmful SO3 in the gas atmosphere can penetrate further and continue the corrosion process
creating further degradation. In each form of corrosion, the SO3 migration through the liquid
deposit can be described by an S2O72-
/SO42-
exchange reaction. The SO3 can react with Cr or Al
in the metal substrate to form the inward growing corrosion pits rich in Cr2O3 or Al2O3, and CrS.
Meanwhile, the formation of the porous non-protective Fe2O3 scale that occurred for fireside
corrosion could be occurring via a 3Fe2+
/2Fe3+
exchange reaction similar to what occurs in Co
for Type II hot corrosion. Because of the similar effects of the liquid deposit on the metal
substrates, the corrosion products and microstructures are similar. Fireside corrosion of steels

137
appears to be more severe, and this may be due to the fact that the Ni-based alloys used in gas
turbine hardware are typically more corrosion resistant than the steel alloys used in boiler
hardware due to higher chromium contents and slower growing, more protective scales. The
growth rate of NiO is slower than that of Fe-oxides.
The fireside corrosion tests on the Ni-based alloys also showed similar results to the Type
II hot corrosion of the MCrAlY alloys as was described previously. The possible mechanisms
for fireside corrosion of Ni-based alloys were described in section 5.1.4. The mechanism could
be a combination of corrosion due to the formation of liquid alkali iron trisulfates (fireside
corrosion) and corrosion due to the formation of liquid Na2SO4-NiSO4 (Type II hot corrosion).
This is due to the fact that the standard corrosion mix is designed to form liquid alkali iron
trisulfates, but it also has Na2SO4 in the deposit that can form the liquid Na2SO4-NiSO4 eutectic,
and each of these would cause corrosion.
5.4.2 Corrosion of Mo-Containing Disk Alloys in Air and Alloy-Induced Acidic Fluxing
Type I Hot Corrosion
Tests were conducted on Mo-containing disk alloys (NiCrAlMo, IN-617, and RR1000) at 700oC
with a sodium sulfate deposit in air for 100 hours. As was mentioned earlier, the alloys
underwent some degradation even though the gas atmosphere was only air and did not contain
any SO2. The results from this test can be seen in Figure 68. The corrosion microstructures are
somewhat similar to what may be seen for alloy-induced acidic fluxing Type I hot corrosion. A
typical alloy-induced acidic fluxing Type I hot corrosion microstructure at 900oC is shown below
for Ni-8Cr-6Al-6Mo in Figure 71 compared to the results from the current tests.
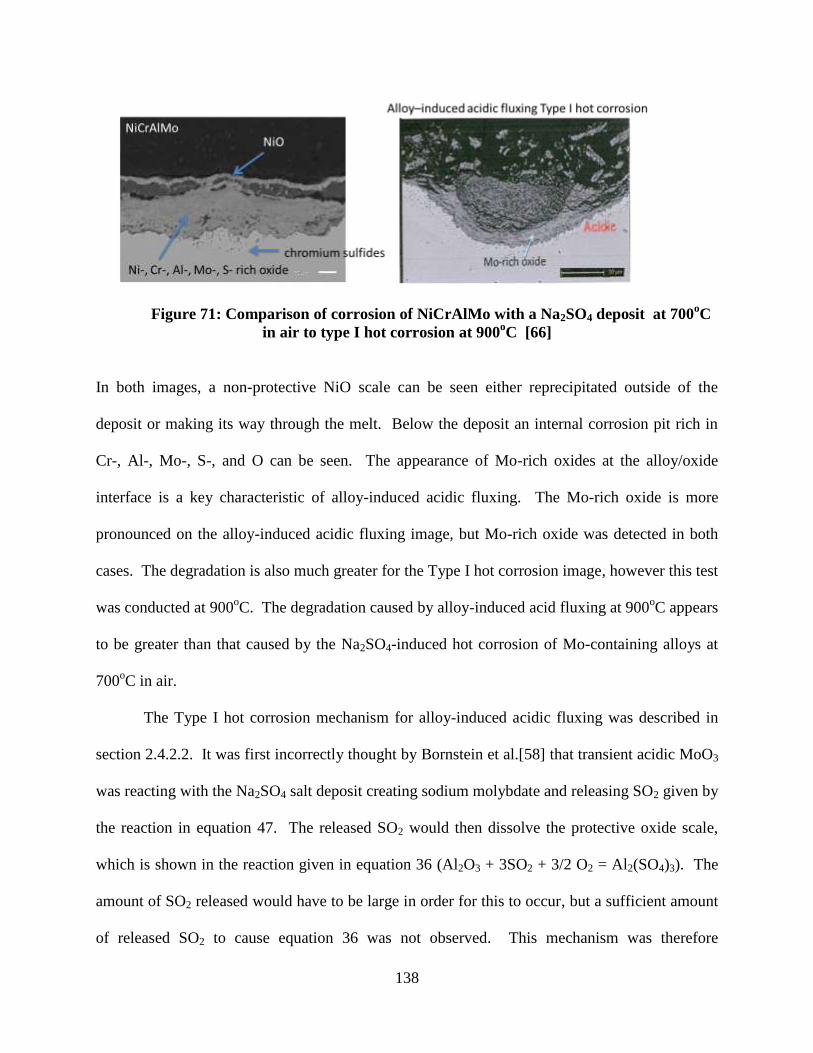
138
Figure 71: Comparison of corrosion of NiCrAlMo with a Na2SO4 deposit at 700oC
in air to type I hot corrosion at 900oC [66]
In both images, a non-protective NiO scale can be seen either reprecipitated outside of the
deposit or making its way through the melt. Below the deposit an internal corrosion pit rich in
Cr-, Al-, Mo-, S-, and O can be seen. The appearance of Mo-rich oxides at the alloy/oxide
interface is a key characteristic of alloy-induced acidic fluxing. The Mo-rich oxide is more
pronounced on the alloy-induced acidic fluxing image, but Mo-rich oxide was detected in both
cases. The degradation is also much greater for the Type I hot corrosion image, however this test
was conducted at 900oC. The degradation caused by alloy-induced acid fluxing at 900
oC appears
to be greater than that caused by the Na2SO4-induced hot corrosion of Mo-containing alloys at
700oC in air.
The Type I hot corrosion mechanism for alloy-induced acidic fluxing was described in
section 2.4.2.2. It was first incorrectly thought by Bornstein et al.[58] that transient acidic MoO3
was reacting with the Na2SO4 salt deposit creating sodium molybdate and releasing SO2 given by
the reaction in equation 47. The released SO2 would then dissolve the protective oxide scale,
which is shown in the reaction given in equation 36 (Al2O3 + 3SO2 + 3/2 O2 = Al2(SO4)3). The
amount of SO2 released would have to be large in order for this to occur, but a sufficient amount
of released SO2 to cause equation 36 was not observed. This mechanism was therefore

139
concluded to be inaccurate. It was determined that at this temperature (900-1000oC), transient
MoO3 becomes molten and is able to penetrate the protective oxide scale causing corrosion of
the alloy substrate. The MoO3 reduces the activity of the oxide ions in the Na2SO4 deposit
enough so that the melt becomes highly acidic at the alloy/salt interface enabling equation 36 to
occur and causing fluxing of the oxide scale. MoO3 is found at the alloy/oxide interface, and the
corrosion is initiated there because these are the regions that are the most acidic and cause a
“negative solubility gradient” satisfying the Rapp-Goto Criterion for self-sustaining hot
corrosion attack. The protective oxide metal ions migrate down the solubility gradient and are
reprecipitated as a porous non-protective scale at the salt/gas interface where the pO2 is higher.
This is the mechanism that adequately describes alloy-induced acidic fluxing.
The mechanism that could be occurring for the Mo-containing disk alloys at 700oC with a
Na2SO4 deposit in air can be described by a combination of the first incorrect mechanism
described in the previous paragraph and the actual mechanism for alloy-induced acidic fluxing at
900oC. Transient MoO3 reacts with the salt deposit to form Na2MoO4 releasing SO2 and oxygen
as shown in the reaction given by equation 47. Sodium molybdate is molten under Type II hot
corrosion temperatures (700o), and is therefore able to penetrate the scale and cause the observed
corrosion of the substrate. As was the case with the molten MoO3 that occurs at 900oC for alloy-
induced acidic fluxing, the formation of molten Na2MoO4 causes the melt to become highly
acidic at the alloy/salt interface establishing a “negative solubility gradient” and enabling
equation 36 to occur, causing fluxing of the oxide scale. The appearance of Mo at the base of the
corrosion pits indicates that the corrosion is initiated at these regions for this type of corrosion as
well. The released SO2 that occurs from the formation of sodium molybdate could be the cause

140
of the formation of internal sulfides that occurred. The tests performed at 650oC, below the
melting point of sodium molybdate, which produced no severe corrosion, prove that Na2MoO4 is
becoming liquid at 700oC and could be causing the observed corrosion.
Both the microstructures and the corrosion mechanisms are very similar for these two
types of corrosion. It appears that Mo-containing Ni-based disk alloys with a Na2SO4 deposit
can undergo alloy-induced acidic fluxing in air even at 700oC. The conditions needed for alloy-
induced acidic fluxing hot corrosion may not be as clearly defined as previously thought. It
appears as though it is possible for it to occur at lower temperatures on Mo-containing alloys
under the right conditions.
5.4.3 Corrosion of Disk Alloys in SO2 and Type II Hot Corrosion
The corrosion of disk alloys under Type II hot corrosion conditions was described in section
5.3.3. The results can be seen in Figure 70. These alloys suffered corrosion similar to that of the
Type II hot corrosion tests on the NiCrAlY alloy in section 5.2.1. The results of those tests can
be seen in Figure 65. The attack on the disk alloys is similar to the test on the NiCrAlY alloy;
however the pitting and the corrosion appear to be much more severe. This may be due to the
difference in the test durations, or depending on the alloy, it may be due to the mechanism of
attack. The disk alloy specimens developed a thick, non-protective NiO external scale with
remnant Na2SO4 mixed into the scale. This turned into internal pits rich in Al, Cr, S, and O,
depending on the alloy, along with a layer rich in S and some internal sulfidation at the base of
the pits. This is similar to what was described for Type II hot corrosion of NiCrAlY, and the
pitting attack is the same as the results found for fireside corrosion of steels, which can be found
in sections 5.1.2 and 5.1.3.

141
The corrosion mechanism for the disk alloys is dependent on the alloy. The disk alloys
that do not contain molybdenum had the same deposit and were tested under the same conditions
as the Type II hot corrosion of NiCrAlY, so it is expected that their corrosion products and attack
would be similar. The mechanism for the corrosion of the non-Mo-containing disk alloys can
therefore be adequately described by the proposed Type II hot corrosion mechanisms described
in section 2.4.3 by Luthra and Chiang et al. [62, 64] The corrosion products are similar and the
mode of attack is the same, therefore the corrosion of disk alloys that do not contain Mo under
Type II hot corrosion conditions can be correctly labeled as Type II hot corrosion.
The disk alloys that contain Mo were more severely attacked than the other disk alloys
and the Type II hot corrosion test on NiCrAlY. They even resembled the pitting attack that
occurred for fireside corrosion. The mechanism of attack for these alloys is more complex. As
was mentioned in the previous section (5.4.2), Mo containing alloys can undergo degradation at
700oC in air without the presence of SO3. This was due to the fact that transient MoO3 reacts
with Na2SO4 to form liquid Na2MoO4, which causes corrosion. The reaction is described by
equation 47. This same type of degradation can occur for the Mo-containing disk alloys in the
O2 + SO2 atmosphere at the start when the pSO3 is low, but when sufficient amounts of SO3 fill
the gas atmosphere, the form of attack changes to that for Type II hot corrosion that was
described in the previous paragraph. The reaction in equation 47 (MoO3 + Na2SO4 = Na2MoO4
+ SO2 + ½O2) will proceed to the right. The SO2 and O2 on the right hand side of the equation
will react to create SO3, and once sufficient SO3 has been formed, the reaction will go the other
way and proceed to the left allowing Type II hot corrosion to occur. The corrosion mechanism
will go from one form to another due to changes in the gas atmosphere. This may be the reason
that these alloys suffered more corrosion than the Type II hot corrosion attack of NiCrAlY and

142
the disk alloys that do not contain Mo. This form of corrosion can be considered a combination
of low temperature alloy-induced acidic fluxing hot corrosion and Type II hot corrosion,
depending on how much SO3 is in the gas atmosphere.
5.5 CONCLUSIONS
Tests were conducted under fireside corrosion conditions varying different test atmosphere
variables on a model austenitic steel alloy in order to determine the environment that causes the
most severe corrosion. Selected steel and Ni-based alloys were then tested under these
determined highly corrosive fireside corrosion conditions. Tests were also conducted on selected
Mo-containing and non-Mo-containing Ni-based disk alloys in air and under Type II hot
corrosion conditions. The effect of alloy composition on the resistance to degradation as well as
the corrosion mechanisms was described. The products and mechanisms of the different types
of corrosion for the various types alloys were compared along with Type II hot corrosion tests on
NiCrAlY and CoCrAlY alloys that were conducted by Michael Task.[66]
The most corrosive fireside corrosion test environment for the FeNiCr alloy was
determined to be at 700oC with the standard corrosion mix powder in crucibles for 160 hours in
20 hour cycles in an O2 + 1000ppm SO2 (pSO3 = 4×10⁻³
atm) gas atmosphere. There is a
determined bell-shaped curve for which the largest amount of degradation under fireside
corrosion conditions will occur. The temperature at which the bell-shaped curve is the highest
and therefore the corrosion is the highest was found not to be at 650oC but closer to 700
oC. It

143
was also determined that there is a threshold level of SO2 in the gas atmosphere needed to
oxidize sufficient amounts of SO3 to allow the formation of alkali iron trisulfates, which can
cause significant corrosion.
Each of the alloys suffered pitting attack. The steel alloys degraded much more severely
than the Ni-based alloys. This is as expected, because the Ni-based alloys are typically more
corrosion resistant than Fe-based alloys due to slower oxide growth rates, and the Ni-based
alloys also had more Cr, which was found to be extremely beneficial for corrosion resistance.
The SO2 threshold level for corrosion was determined to be around 100ppm based on the results
from the steel alloys. The mechanism for fireside corrosion of the steel alloys is similar to that
proposed by Reid[14] described in section 2.3.2.2. The mechanism for fireside corrosion of Ni-
based alloys is more complex. The corrosion may be due to the formation of liquid alkali iron
trisulfates in the deposit from reactions of the gas atmosphere with the deposit, or it may be due
to Na2SO4-induced hot corrosion due to reactions between transient NiO, Na2SO4 in the deposit,
and the gas atmosphere. It may also be a combination of both.
The fireside corrosion tests were compared to the Type II hot corrosion of NiCrAlY and
CoCrAlY tests performed by Michael Task. The degradation was more severe for fireside
corrosion than for Type II hot corrosion of the MCrAlY alloys, but the corrosion products and
the form of attack on the alloys were found to be very similar. The temperature and gas
atmospheres used for both tests were the same, with the only difference coming from the type of
deposit. Fireside corrosion uses a more complex deposit that forms liquid alkali iron trisulfates,
while Type II hot corrosion uses a Na2SO4 deposit that forms liquid Na2SO4-M2SO4. This causes
the exact mechanism of attack to be different, but the effect the deposits have on the alloys is the
same. The liquid melt is formed from reactions with the deposit and the gas atmosphere at the

144
expense of grown transient oxides. SO3 migrating through the liquid melt is then able to cause
severe corrosion in the form of a pitting attack. The porous non-protective iron oxide scale that
forms for fireside corrosion of steels can occur due to an 3Fe2+
/2Fe3+
exchange reaction similar
to that for cobalt for Type II hot corrosion. It was determined that fireside corrosion of steel
alloys is just a more severe form of Type II hot corrosion of MCrAlY alloys.
The Mo-containing Ni-based disk alloys suffered some corrosion in an air atmosphere
even without the presence of SO2, while those that do not contain Mo did not. The attack was
similar to what would be seen for alloy-induced acidic fluxing Type I hot corrosion at 900oC,
with Ni moving through the liquid deposit and forming NiO over top of it and Mo rich layer
found at the base of corrosion pits. It was determined that Mo-containing disk alloys can suffer
Type I alloy-induced acidic fluxing attack at 700oC in air. Transient MoO3 can react with the
Na2SO4 salt deposit to form Na2MoO4 (Tm = 687oC), which is liquid at this temperature. The
liquid sodium molybdate then causes acidic corrosion similar to what would occur for alloy-
induced acidic fluxing at 900oC. The reaction that forms sodium molybdate also releases SO3
which can enhance then acidic fluxing of the protective oxide.
Each of the selected disk alloys was exposed to Type II hot corrosion conditions. The
alloys had severe spallation upon cooling, but where there was not spallation, a pitting attack
similar to what was seen with fireside corrosion and Type II hot corrosion of the MCrAlY alloys
performed by Michael Task occurred. The degradation was more severe than the attack on the
Mo-containing alloys in air. The mechanism for corrosion of the disk alloys was found to be
dependent on alloy composition and gas atmosphere. Because the conditions were exactly the
same, the mechanism for the corrosion of the alloys that do not contain Mo can adequately be
described by the mechanism for Type II hot corrosion of MCrAlY alloys, and they can therefore

145
be categorized as the same thing. The corrosion of the Mo-containing alloys was found to be a
combination of the alloy induced acidic fluxing mechanism described previously with the
mechanism for Type II hot corrosion of MCrAlY alloys. It begins as alloy-induced acidic
fluxing, and once enough SO3 has entered the gas atmosphere, the reaction shifts the other way
and Type II hot corrosion occurs.

146
BIBLIOGRAPHY
1. Stein-Brzozowska, G., Maier, J., Scheffknecht, G., Impact of Oxy-Fuel Combustion on
the Corrosion Behavior of Advanced Austenitic Superheater Materials. Energy Procedia,
2011. 4: p. 2035-2042.
2. Syed, A.U., Simms, N.J., Oakey, J.E., Fireside Corrosion of Superheaters: Effects of air
and oxy-firing of coal and biomass. Fuel, 2011.
3. Stringer, J., Wright, I.G., Current Limitations of High-Temperatures Alloys in Practical
Applications. Oxidation of Metals, 1995. 44: p. 265-308.
4. Gagliano, M.S., Hack, H., Stanko, G., Fireside Corrosion Resistance of Proposed USC
Superheater and Reheater Materials: Laboratory and Field Test Results. Presented at the
33th International Technical Conference on Coal Utilization and Fuel Systems, 2008.
5. Reid, W.T., Cohen, P. Trans. ASME, 1944. 66: p. 685.
6. Ely, F.G., Schueler, L.B., Furn. Perf. Factors Suppl. To Trans. ASME, 1944. 66: p. 23.
7. Bishop, R.J., J. Inst. Fuel, 1968. 41: p. 51-65.
8. Simms, N.J., Kilgallon, P.J., Oakey, J. E., Fireside Issues in Advanced Power Generation
Systems. Energy Materials, 2007. 2: p. 154-160.
9. Otsuka, N., Effects of fuel impurities on fireside corrosion of boiler tubes in advanced
power generating systems – a thermodynamic calculation of deposit chemistry. Corrosion
Science, 2002. 44: p. 265-283.
10. Srivastava, S.C., Godiwalla, K.M., Banerjee, M.K., Fuel Ash Corrosion of Boiler and
Superheater Tubes. Journal of Materials Science, 1997. 32: p. 835-849.
11. Yan, L., Gupta, R.P., Wall, T.F., A Mathematical Model of Ash Formation During
Pulverized Coal Combustion. Fuel, 2002. 81: p. 337-344.
12. Tomeczek, J., Palugniok, H., Kinetics of Mineral Matter Transformation During Coal
Combustion. Fuel, 2002. 81: p. 1251-1258.

147
13. Nelson, H.W. et al., A Review of Available Information on Corrosion and Deposits in
Coal- and Oil-Fired Boilers and Gas Turbines. ASME, 1959. p. 7-12.
14. Reid, W.T., External Corrosion and Deposits Boilers and Gas Turbines. 1971, New
York: American Elsevier Publishing Company, Inc.
15. Gluskoter, H.J., Mineral Matter and Trace Elements in Coal. American Chemical
Society, 1975.
16. Smith, E.J.D., J. Inst. Fuel, 1956. 29: p. 253.
17. Natesan, K., Purohit, A., Rink, D.L., Fireside Corrosion of Alloys for Combustion Plants.
Proc. 16th Annual Conference on Fossil Energy Materials, Baltimore, MD, April 22-24,
2002.
18. Hack, H., Stanko, G., Experimental Results for Fireside Corrosion Resistance of
Advanced Materials in Ultra-Supercritical Coal-Fired Power Plants. Presented at the
32nd International Technical Conference on Coal Utilization & Fuel Systems, 2007.
19. Goebel, J.A., Pettit, F.S., Goward, G.W., Mechanisms for the Hot Corrosion of Nickel-
Base Alloys. Metallurgical Transactions, 1973. 4: p. 261-278.
20. Goebel, J.A., Pettit, F.S., Na2SO4-Induced Accelerated Oxidation (Hot Corrosion) of
Nickel. Metallurgical Transactions, 1970. 1: p. 1943-1955.
21. Levy, A., Merryman, E.L., Reid, W.T., Mechanisms of Formation of Sulfur Oxides in
Combustion. Environmental Science and Technology, 1970. 4: No. 8 p. 653-662.
22. Dooley, A., Whittingham, G., Trans. Faraday Soc., 1942. 42: p.354.
23. Levy, A., Merryman, E.L., Combus. Flame, 1965. 9: p. 229.
24. Harlow, W.F., Causes of High Dewpoint Temperatures in Boiler Flue Gases.
Proceedings of the Institution of Mechanical Engineers, 1944. 151: p. 293.
25. Cain Jr., C., Nelson, W., Trans. ASME, J. Eng. Power, 1967. 83 Series A: p. 468.
26. Corey, R.C., Cross, B.J., Reid, W.T., Trans. ASME, 1945. 67: p. 289.
27. Levy, A., Merryman, E.L., Trans. ASME, J. Eng. Power, 1967. 89 Series A: p. 297.
28. Coats, A.W., Dear, D.J.A., Penfold, D., J. Inst. Fuel, 1968. 41: p. 129.
29. Blough, J.L., Fireside Corrosion Testing of Candidate Superheater Tube Alloys,
Coatings, and Claddings – Phase II Field Testing. Foster Wheeler Topical Report for
Oak Ridge national Laboratory, 1996.

148
30. Birks, N., Meier, G.H., Pettit, F.S., Introduction to the High Temperature
Oxidation of Metals. 2 ed2006, New York: Cambridge University Press.
31. Burrows, B.W., Hills, G.J., J. Inst. Fuel, 1966. 39: p. 168.
32. Cain Jr., C., Nelson, W., Trans. ASME, J. Eng. Power, 1961. 83 Series A: p. 468.
33. Corey, R.C., Grabowski, H.A., Cross, B.J., Trans. ASME, 1949. 71: p. 951.
34. Shi, L., Zhang, Y., Shih, S., The Effect of K2SO4 Additive in Na2SO4 Deposits on Low
Temperature Hot Corrosion of Iron-Aluminum Alloys. Oxidation of Metals, 1992. 33: p.
385-405.
35. Viswanathan, R., Henry, J.F., Tanzosh, J., Stanko, G., Shingledecker, J., Vitalis, B.,
Purgert, R., U.S. Program on Materials Technology for Ultra-Supercritical Coal Power
Plants. Journal of Materials Engineering and Performance, 2005. 14: p. 281-292.
36. Chi, C., Yu, H., Xie, X., Advanced Austenitic Heat-Resistant Steels for Ultra-
Supercritical (USC) Fossil Power Plants. Alloy Steel – Properties and Use. p. 171-200.
37. Latham, E.P., Flatley, T., Morris, C.W., Corrosion Resistant Materials for Coal
Conversion Systems. Applied Science Publishers. London, 1983. p. 137-158.
38. McCreath, C.G., Hot Corrosion Site Environment in Gas Turbines. Mater. Sci.
and Technol., 1987. 3: p. 494-500.
39. Bornstein N.S., A., W.P., The Chemistry of Sulfidation Corrosion-Revisited.
Mater. Sci. Forum, 1997. 127: p. 127-134.
40. Luthra, K.L., Low Temperature Hot Corrosion of Cobalt-Base Alloys: Part I.
Morphology of the Reaction Product. Metallurgical Transactions A, 1982. 13: p. 1843-
1852.
41. Giggins, C.S., Pettit, F.S. , Hot Corrosion Degradation of Metals and Alloys - A
Unified Theory, 1979.
42. Deodeshmukh, V., Gleeson, B. Environmental and Compositional Effects on the
Hot-Corrosion Behavior of Ni-Based Alloys and Coatings. in Corrosion 2008.
New Orleans, LA: NACE International.
43. Inman, D., Wrench, N.S., Corrosion in Fused Salts. Brit. Corros. J., 1966, 1: p. 246-250.
44. Rapp, R.A., Chemistry and Electrochemistry of the Hot Corrosion of Metals. Corrosion,
1986. 42: p. 568-577.
45. Gupta, D.K., Rapp, R.A., The Solubilities of NiO, Co3O4, and Ternary Oxides in
Fused Na2SO4 at 1200°K. J. Electrochem. Soc., 1980. 127: p. 2194-2202.

149
46. Jose, P.D., Gupta, D.K., Rapp, R.A., The Solubility of α-Al2O3 in Fused Na2SO4 at
1200°K. J. Electrochem. Soc., 1985. 132: p. 735-737.
47. Shi, D.Z., Rapp, R.A. , The Solubility of SiO2 in Fused Na2SO4 at 900°C. J.
Electrochem. Soc., 1986. 133: p. 849-580.
48. Deanhardt, M.L., Stern, K.H., Solubility Products of Metal Oxides in Molten Salts
by Coulometric Titration of Oxide Ion Through Zirconia Electrodes. J.
Electrochem. Soc., 1982. 128: p. 2577-2582.
49. Rapp, R.A., Ostuka, N., The Role of Chromium on the Hot Corrosion of Metals. ECS
Transactions, 2009. 16(49): p. 271-282.
50. Zhang, Z.S., Solubilities of Cr2O3 in Fused Na2SO4 at 1200K. J. Electrochem.
Soc., 1986. 133: p. 655-657.
51. Zhang, Z.S., Rapp R.A., Solubility of α-Fe2O3 in Fused Na2SO4 at 1200K. J.
Electrochem. Soc., 1985. 132: p. 734-735.
52. Rapp, R.A., Goto, K.S., The Hot Corrosion of Metals by Molten Salts. The Second
International Symposium on Molten Salts, 1981.
53. Bornstein, N.S., DeCrescente, M.A., The Relationship Between Compounds of Sodium
and Sulfur and Sulfidation. Trans. TMS AIME, 1969. 245: p. 1947-1952.
54. Rapp, R.A., Hot Corrosion of Materials: A Fluxing Mechanism?. Corrosion Science,
2002. 44: p. 209-221.
55. Pettit, F.S., Goebel, J.A., Goward, G.W., Corrosion Sci., 1969. 9: p.903-913.
56. Goebel, J.A., Pettit, F.S., The Influence of Sulfides on the Oxidation Behavior of Nickel-
Base Alloys. Metallurgical Transactions, 1970. 1: p. 3421-3429.
57. Bornstein, N.S., DeCrescente, M.A., The Role of Sodium in the Accelerated Oxidation
Phenomenon Termed Sulfidation. Metallurgical Transactions, 1971. 2: p. 2875-2883.
58. Bornstein, N.S., DeCrescente, M.A., Roth, H.A. Accelerated Corrosion in Gas Turbine
Engines. In Gas Turbine Materials Conference. 1972. Washington, D.C.
59. Wortman, D.J., Fryxell, R.E., Luthra, K.L., Bergman, P.A., Mechanism of Low-
Temperature Hot Corrosion: Burner Rig Studies. Thin Solid Films, 1979. 64: p.
281-288.
60. Luthra, K.L., Shores, D.A., Mechanism of Na2SO4 Induced Corrosion at 600°-
900°C. J. Electrochem. Soc., 1980. 127: p. 2202-2210.
61. Barkalow, R.H., Goward, G.W., Microstructural Features of Low Temperature Hot
Corrosion in Nickel and Cobalt Base MCrAlY Coating Alloys. R.A. Rapp, Editor 1983,
National Society of Corrosion Engineers: Houston. p. 502-506.

150
62. Chiang, K.T., Pettit, F.S., Meier, G.H., Low Temperature Hot Corrosion. R.A. Rapp,
Editor 1983, National Society of Corrosion Engineers: Houston. p. 519-530.
63. Jones, R.L., Cobalt Oxide-SO2/SO3 Reactions in Cobalt-Sodium Mixed Sulfate Formation
and Low Temperature Hot Corrosion. R.A. Rapp, Editor 1983, National Society of
Corrosion Engineers: Houston. p. 513-518.
64. Luthra, K.L., High Temperature Hot Corrosion of Cobalt-Base Alloys: Part II. Reaction
Mechansim. Metallurgical Transactions A, 1982. 13: p. 1853-1864.
65. Encinas-Oropesa, A., Simms, N.J., Nicholls, J.R., Drew, G.L., Leggett, J., Hardy, M.C.,
Evaluation of Oxidation Related Damage Caused to a Gas Turbine Disc Alloy Between
700 and 800oC. Materials At High Temperatures, 2009. 26(3): p. 241-249.
66. Task, M.N., The Effects of Composition and Microstructure on the Reaction Behavior of
MCrAlY Alloys Under A Variety of Aggressive Environmental Conditions. Master’s
Thesis, University of Pittsburgh. November, 2009.
67. Task, M.N., Assessment of the Factors Affecting Protective Alumina Formation Under
Hot Corrosion Conditions. Ph.D. Thesis, University of Pittsburgh. May 2012.
68. Niles, W.D., Siegmund, C.W., The Mechanism of Corrosion by Fuel Impurities,
Butterworths, London, 1963. p. 332-346.
69. Corey, R.C., Cross, B.J., and Reid, W.T., Trans. ASME, 1945. 67: p. 289.


![Corrosion Mechanisms under Organic Coatingspublications.lib.chalmers.se/records/fulltext/148450.pdf · Corrosion Mechanisms under Organic Coatings ... [1,2]. The demands are not only](https://static.fdocuments.us/doc/165x107/5ad567857f8b9aff228d0ae5/corrosion-mechanisms-under-organic-mechanisms-under-organic-coatings-12.jpg)