A Comparison of the Canadian and US Grain Supply … Technical... · A Comparison of the Canadian...
31
A Comparison of the Canadian and US Grain Supply Chains Grain Supply Chain Study: Technical Document Grain Monitoring Program Supplemental Study September 2014
Transcript of A Comparison of the Canadian and US Grain Supply … Technical... · A Comparison of the Canadian...

A Comparison of the
Canadian and US Grain
Supply Chains
Grain Supply Chain Study:
Technical Document
Grain Monitoring Program Supplemental Study
September 2014

2 | Quorum Corporation: A Comparison of the Canadian and US Grain Supply Chains

Quorum Corporation: Grain Supply Chain Study | 3
Foreword
On March 18, 2011 the Government of Canada announced its response to the Rail Freight Service Review that was undertaken in 2008 to address the ongoing issues with rail freight service raised by users of the rail freight supply chain.
In December 2011 Quorum Corporation was contracted by Agriculture and Agri-Food Canada (AAFC) and Transport Canada (TC) as part of its mandate as the Grain Monitor, to undertake a supplemental program study to analyze the grain supply chain.
This document was prepared as part of the technical, analytical and research component of the study and is presented as a supplemental work item for the Grain Monitoring Program.

4 | Quorum Corporation: A Comparison of the Canadian and US Grain Supply Chains

Quorum Corporation: Grain Supply Chain Study | 5
Contents
FOREWORD ........................................................................................................................................................... 3
INTRODUCTION ..................................................................................................................................................... 7
PRODUCTION ........................................................................................................................................................ 9
REGIONAL CROP PRODUCTION ........................................................................................................................................... 10
FACTORS IMPACTING PRODUCTION DECISIONS ...................................................................................................................... 11
Increased Production of Bio‐Fuels .......................................................................................................................... 11
USDA Assistance for Farmers ................................................................................................................................. 12
INFRASTRUCTURE ................................................................................................................................................ 14
PORT INFRASTRUCTURE .................................................................................................................................................... 15
COUNTRY ELEVATOR INFRASTRUCTURE ................................................................................................................................ 17
TRANSPORTATION AND LOGISTICS INFRASTRUCTURE .............................................................................................................. 19
The US Rail System ................................................................................................................................................. 19
The Eastern US Barge and River system ................................................................................................................. 20
Trucking of Grain in the US ..................................................................................................................................... 21
DISPOSITION ....................................................................................................................................................... 21
TRANSPORTATION ............................................................................................................................................... 23
MARKETS ............................................................................................................................................................ 25
THE STAKEHOLDERS, THEIR ROLES AND RELATIONSHIPS ........................................................................................................... 25
Producers ................................................................................................................................................................ 25
Agribusiness Crop Suppliers .................................................................................................................................... 26
Ethanol producers .................................................................................................................................................. 26
Feed Industry .......................................................................................................................................................... 27
Millers and food manufacturers ............................................................................................................................. 27
Grain Cooperatives ................................................................................................................................................. 28
Grain Companies .................................................................................................................................................... 28
SUMMARY OF THE CANADIAN – US SUPPLY CHAINS ............................................................................................ 31

6 | Quorum Corporation: A Comparison of the Canadian and US Grain Supply Chains
Quorum Corporation: Grain Supply Chain Study | 7
Introduction
The following provides an overview of the United States’ grain supply chains including industry
demographics, grain handling infrastructure and transportation and logistics networks and compares them to
the Canadian grain system. We have undertaken bi-lateral consultations with stakeholders in the US and
Canada to garner insight into supply chain practices to understand similarities and differences between the
two systems. The mandate of the project limited the scope of this examination to a comparison of the two
systems and does not include a benchmarking of system performance or an in depth comparison of the two
marketing systems.
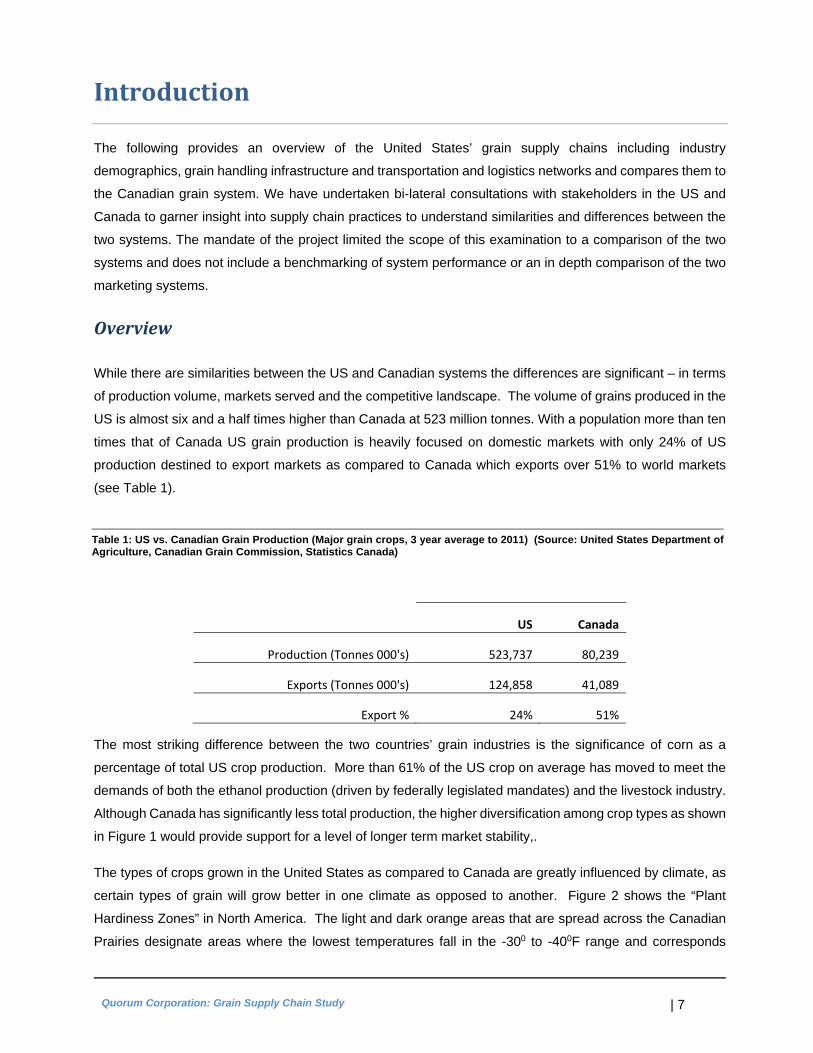
Overview
While there are similarities between the US and Canadian systems the differences are significant – in terms
of production volume, markets served and the competitive landscape. The volume of grains produced in the
US is almost six and a half times higher than Canada at 523 million tonnes. With a population more than ten
times that of Canada US grain production is heavily focused on domestic markets with only 24% of US
production destined to export markets as compared to Canada which exports over 51% to world markets
(see Table 1).
US Canada
Production (Tonnes 000's) 523,737 80,239
Exports (Tonnes 000's) 124,858 41,089
Export % 24% 51%
The most striking difference between the two countries’ grain industries is the significance of corn as a
percentage of total US crop production. More than 61% of the US crop on average has moved to meet the
demands of both the ethanol production (driven by federally legislated mandates) and the livestock industry.
Although Canada has significantly less total production, the higher diversification among crop types as shown
in Figure 1 would provide support for a level of longer term market stability,.
The types of crops grown in the United States as compared to Canada are greatly influenced by climate, as
certain types of grain will grow better in one climate as opposed to another. Figure 2 shows the “Plant
Hardiness Zones” in North America. The light and dark orange areas that are spread across the Canadian
Prairies designate areas where the lowest temperatures fall in the -300 to -400F range and corresponds
Table 1: US vs. Canadian Grain Production (Major grain crops, 3 year average to 2011) (Source: United States Department of Agriculture, Canadian Grain Commission, Statistics Canada)

8 | Quorum Corporation: A Comparison of the Canadian and US Grain Supply Chains
closely with the area that is the most northerly area of farmable land. As one moves south through the central
US states, average temperatures increase as do
normal cropping patterns.
While production volume, export proportion, crop
mix and climate are four of the most
distinguishing factors between the two country’s
grain industries, there are many other
characteristics of these systems including: the
variability of traffic flows, the impact of
government led programs and mandates, the
types and uses of transportation infrastructure,
the use of and destination for the commodities
that are grown, and the level of market
competition that exists in the US market as
opposed to Canada. These issues are explored
in greater detail in the following sections.
0%
10%
20%
30%
40%
50%
60%
70%
80%
90%
100%
Canada US
Wheat / Durum
Corn
Oilseeds
Pulses / Special Crops
Barley
Other Grains
Figure 1: Canadian Grain Production by Commodity Group (Source: United States Department of Agriculture, Canadian Grain Commission, and Statistics Canada)
Figure 2: North American Plant Hardness Zones (Source: United States Department of Agriculture – Agricultural Marketing Service

Quorum Corporation: Grain Supply Chain Study | 9
Production
As noted in Table 1 above, the annual volume of grain produced in the US is some six and half times greater
than Canada at an average of 523.7 million tonnes (MMT). Table 2 below shows that corn, based on the
average of the last three years, is the US’s largest crop at 321 MMT. Next is the oilseeds segment at slightly
more than 136 MMT followed by wheat at 58 million tonnes. Pulses and other grains make up the remaining
8 MMT.
Commodity Group Canada
% of Total Crop
United States
% of Total Crop
Wheat / Durum 26,098 33% 58,280 11%
Barley 9,635 12% 4,089 1%
Corn 17,253 22% 320,877 61%
Oilseeds 17,627 22% 136,469 26%
Pulses / Special Crops 5,496 7% 1,155 0%
Other Grains 4,132 5% 2,866 1%
Grand Total 80,239 523,737
At 61% corn’s share of total US crop
production has risen by more than 20%
since the early 1980s when it
represented only 50% of US production
(see Figure 3). Growth in corn
production has been driven by demand
for the production of ethanol in response
to issues pertaining to increases in bio-
fuels in transportation fuels. In the ten
year period between 2001 and 2011
corn used in ethanol production
increased from 16 million to more 104
million tonnes. The price of corn has
increased more than three fold in the
same period – from less than $2.00 a
1 Source: United States Department of Agriculture, Canadian Grain Commission, Statistics Canada - 3 year average 2009-2011
Table 2: US and Canadian Grain Production (Tonnes)1
30%
40%
50%
60%
70%
80%
90%
100%
‐
100,000
200,000
300,000
400,000
500,000
600,000
Wheat / Durum Barley Corn
Oilseeds Pulses / Special Crops Other Grains
% Corn
Figure 3: Corn as Percent of Total US Production: 1980-2010

10 | Quorum Corporation: A Comparison of the Canadian and US Grain Supply Chains
bushel in 2000 to over $6.00 in January of 2012. In the same period, production yield has increased 15% in
the US – moving from 16 tonnes/ acre in 2000 to 18.4 tonnes/ acre in 2011.
US oilseeds production is comprised mostly of soybeans (over 90 MMT) with the remainder consisting of
canola, peanut and cottonseed. By comparison Canadian oilseed production is dominated by canola which
accounts for 70% of total production of these grains. Wheat is the next most important crop grown in the
United States, about half of which is destined for export. At approximately 25 million tonnes US wheat exports
are equal to total Canadian production.
RegionalCropProduction
The map in Figure 4 summarizes crop production statistics by major grain and USDA region.2 3 As we can
see, with the exception of the Pacific Northwest and the Northwestern states, corn dominates production
across the country. By far the largest grain production region in the US are the North Central states consisting
of Illinois, Indiana, Michigan, Minnesota, Ohio and Wisconsin. The infamous US corn belt reaches from
Illinois in the north, south to Kansas and Northern Texas in the Mid West region. The second largest crop in
2 The regional breakdown used for the presentation is based on the USDA weather districts (as determined by the US Environmental Protection Agency). While there are ten USDA weather regions in use, only nine produce sufficient volumes of grain to be measured
3 Region 1 is the East Central which comprises the US north eastern states of Maine, Rhode Island, Vermont, New Hampshire and Massachusetts
Figure 4: US Crop Production by Grain and USDA Weather Region (Source: USDA Crop Production data, 2009-2011)

Quorum Corporation: Grain Supply Chain Study | 11
these regions is soybeans. In the Northwestern and Pacific Northwest regions, wheat is the main crop,
followed by corn, soybeans and barley.
Not unlike Canada, the regional dispersion of crop types is driven largely by climatic conditions and market
demand that typically drive producers’ seeding decisions. However, in the US, the last 10 years has seen a
distinct rise in the influence of ethanol subsidies and incentives on producer production decisions driven by
the US Government’s desire to increase the production of ethanol in order to reduce its reliance on foreign
oil imports.
The majority of US grain production moves to domestic markets with only approximately 24% of production
exported. The central and eastern growing regions supply much of the domestic requirements, while the
western regions sell a larger proportion of their production into the export marketplace, largely due to their
proximity to port position and the attendent end markets.
FactorsimpactingProductionDecisions
Grain production in the United States is to a much greater degree than Canada influenced by government
policy. This is most evident in the US government’s direct involvement in the ethanol industry and through
farmer assistance programs.
IncreasedProductionofBio‐Fuels
The United States has long sought to
reduce its dependence on foreign oil
supplies. This combined with the strong
political influence of environmental
groups to increase the proportion of bio-
fuels in fuel to promote lower vehicle
emissions has led to legislative initiatives
promoting and mandating the production
of ethanol in the US.
With 57.5% of world production the US is
the world’s largest producer of ethanol.4
This has been accomplished through a
multi-pronged strategy of tax incentives,
tax credits and legislated mandates
4 F.O. Lichts. "Industry Statistics: 2010 World Fuel Ethanol Production". Renewable Fuels Association.
0
20
40
60
80
100
120
140
160
180
Tonnes (m
illions)
Feedgrain Use Fuel Ethanol Use Exports
Figure 5: Corn use in US ethanol production: 1980 - 2011 (Source: U.S. Department of Agriculture, Feed Grain Database)

12 | Quorum Corporation: A Comparison of the Canadian and US Grain Supply Chains
setting the amount of bio-fuels to be blended into transportation fuels. The result has seen a remarkable
increase in the use of corn in the production of ethanol, as can be seen in Figure 5.
The Energy Policy Act of 2005 established the first set of mandated ethanol inclusion targets for gasoline. It
also provided tax benefits (through load guarantees) to companies investing capital in ethanol production.
This was followed by the Energy Independence and Security Act (EISA) in 2007 which set the second round
of targets for bio-fuels blending requirements raising them from 9 billion gallons in 2008 to 36 billion gallons
by 2022. The current goal is to see a 15% bio-fuel blend in all transportation fuels (gasoline and diesel) by
2022.
Domestic fuel and ethanol producers are protected by an import tariff of 54 cents / gallon, sufficient to ensure
that a minimal amount of off shore product can be competitive in the domestic market. Further, prior to the
abolishment of these credits in January of 2012, blenders of transportation fuels received a 45 cent / gallon
tax credit for every gallon that was produced with ethanol content.5 With the removal of the tax credits, the
sole motivating factor for the production of ethanol remains the blending standards as set in the EISA and
renewed each year through a regulatory oversight panel.
USDAAssistanceforFarmers
The United States government provides assistance to farmers through various price guarantee programs.
Marketing Assistance Loans (MALs) and Loan Deficiency Payments (LDPs) were reauthorized in the 2008
Farm Bill.6 Available upon harvest, MALs provide cash to producers when market prices are typically at their
lowest.
MALs are non-recourse loans available for prescribed commodities.7 Loan rates are specified in the law (see
table 3). The MAL allows producers to delay the sale of commodities until more favourable market conditions
or higher prices are available. This also facilitates orderly marketing of commodities throughout the year.
The MAL can be either redeemed by repayment or by delivering the pledged collateral to the Commodity
Credit Corporation (CCC) as payment upon maturity (end of the ninth month following approval of the MAL).8
The producer can repay the loan at the rate established by the CCC for the commodity (essentially a market
price which may vary by county) if that price falls below the level of the loan principal, thereby achieving a
marketing loan gain.
5 A designated small producer could gain another 10 cents/ gallon over and above this amount 6 The 2008 Farm Bill largely continues loan programs that were in place under previous laws. It expired on 30 September 2012 when Congress passed a one year extension to 30 September 2013. Both the Senate and the House of Representatives proposed steep cuts to subsidy levels in their deliberations leading up to the expiry, but were unable to finalize new legislation. Work will continue in 2013 on new legislation by both bodies and reconciliation of legislation will be necessary prior to finalizing a new five year Farm Bill. 7 MALs and LDPs are available for wheat, corn, grain sorghum, barley, oats, upland cotton, extra-long staple cotton, long grain rice, medium grain rice, soybeans, other oilseeds (sunflower seed, rapeseed, canola, safflower, flaxseed, mustard seed, crambe and sesame seed), dry peas, lentils, small chickpeas, large chickpeas, graded wool, non-graded wool, honey and peanuts. Dry peas, lentils and small chickpeas were added to the eligibility list for the 2002 crop. Large chickpeas were added to the eligibility list for the 2009 crop. 8 The Commodity Credit Corporation (CCC) is a government owned corporation established to “stabilize, support, and protect farm income and prices” (CCC Charter Act of 1948).

Quorum Corporation: Grain Supply Chain Study | 13
LDPs provide income support to producers who choose not to receive MALs even though they may be
eligible. They provide direct payments equivalent to the marketing loan gains that could be achieved via an
MAL. The producer receives a payment when the alternative MAL repayment rate for a specific commodity
is below the loan rate for that commodity. The payment is calculated as the established loan rate for the
commodity, less the repayment rate (established by the CCC) multiplied by the eligible quantity. The loan
rate therefore establishes a floor price for producers. The table below outlines a selection of loan rates
established by the 2008 Farm Bill (equivalent metric conversions have been added).
Commodity 2008 Crop Year 2009 Crop Year 2010-2012 Crop Years
Wheat $2.75/bu. ($101/mt) $2.75/bu. ($101/mt) $2.94/bu. ($108/mt)
Corn $1.95/bu. ($77/mt) $1.95/bu. ($77/mt) $1.95/bu. ($77/mt)
Barley $1.85/bu. ($85/mt) $1.85/bu. ($85/mt) $1.95/bu. ($90/mt)
Oats $1.33/bu. ($92/mt) $1.33/bu. ($92/mt) $1.39/bu. ($96/mt)
Soybeans $5.00/bu. ($184/mt) $5.00/bu. ($184/mt) $5.00/bu. ($184/mt)
Other Oilseeds (canola) $9.30/cwt. ($205/mt) $9.30/cwt. ($205/mt) $10.09/cwt. ($222/mt)
Dry Peas $6.22/cwt. ($137/mt) $5.40/cwt. ($119/mt) $5.40/cwt. ($119/mt)
Lentils $11.72/cwt. ($258/mt) $11.28/cwt. ($249/mt) $11.28/cwt. ($249/mt)
Strong commodity prices in recent years have for the most part surpassed the loan rates. Although MALs
continue to provide operating cash for producers, LDPs have been unnecessary. Indications from research
done this far are that the next US Farm Bill, when passed, will include significant cuts to producer assistance
programs. Table 3 shows the relative loan rates currently in effect by commodity type.
While not as robust or far reaching as the US loan assistance programs have been over the years, Canada
does have certain “safety net” programs in place administered at both the Federal and Provincial levels that
are designed to provide assistance during times of hardship for producers (directed primarily at periods of
drastic crop failure). Canada does not have a program that provides direct assistance or support of grain
prices during “low market” periods.
Table 3: Loan rates from 2008 US Farm Bill

14 | Quorum Corporation: A Comparison of the Canadian and US Grain Supply Chains
Infrastructure
The significance of domestic versus export markets in the United States necessitates more grain storage
capacity closer to point of sale for grain companies and dealers to buy, hold and leverage supply and price.
By comparison, with its higher dependence on export movements, the Canadian industry uses more of a
just-in-time approach storage and distribution strategy whereby companies look to source grain at the farm
gate and match it to an export sale.
Consequently the US has sufficient storage between the farm, country network and port terminals to hold
approximately 125% of annual production. (See Table 4 below). Canada has a proportionately lower ratio
with total storage capability when viewed relative to licensed storage. Based on Western Canada capacity,
it is estimated that the system has the capability to store slightly less than one year’s crop.
Licensing standards for country elevators are different between the two countries. In the U.S. licensing is
based on criteria relative to a company’s authorization to administer farm assistance programs including
MALs and LDPs. In Canada licensing applies only to facilities moving western Canadian (regulated) grains9,
and is tied to a company’s grain trading activity and the requirement to ensure the company’s liability to
producers is protected. Table 4 shows the relative storage capacity in the US and Canada in 2011.
On Farm Storage
Off Farm (Country) Port Terminal
Storage Total
Five Yr Avg. Annual Prod.
Licensed Storage
Un-licensed Storage
United States- Grain Storage Capacity(1)
Facilities n/a 2,583 6,316 51 8,950 523.74
Storage (Tonnes, Millions) 354.86 136.78 144.14 7.15 642.93
Canada - Grain Storage Capacity(2)
West Facilities n/a 390 n/a 16 406
Storage (Tonnes, Millions) 49.3 6.68 n/a 2.56 59.04 East
Facilities n/a 11 11
Storage (Tonnes, Millions) Not known n/a n/a 2.07 4.57 Total Canada
Facilities n/a 390 Not known 27 417 124.86
Storage (Tonnes, Millions) Not known 6.68 Not known 4.63 63.61
1- Based on 2011 USDA/ GIPSA Data, 2- Based on CGC Data and Quorum estimates for on-farm storage
9 Canada does not collect information or data on grain storage and warehousing of grain in Eastern Canada with the exception of those facilities operating at a port position. Canada also does not collect information on the amount of on-farm storage. The amount stated above is based on an estimate calculated by Quorum based on the total average annual production and movement.
Table 4: Comparison of U.S. and Canadian Grain Storage Capacity

Quorum Corporation: Grain Supply Chain Study | 15
PortInfrastructure
The U.S. grain industry has 51 port terminals throughout the U.S. west and gulf coast areas and the Columbia
and Mississippi river systems. These facilities are grouped and displayed in Figure 6 below. In each of the
regions, the number of terminals, storage capacity and the hourly throughput (in tonnes) is noted.
Not unlike Canada, most port terminal facilities serve export markets, receiving grain primarily by rail from
country origins (or by barge in the case of the Louisiana Gulf facilities) for furtherance by ocean vessel.
The most direct competition with Canada’s port terminal network exists between the Pacific Northwest (PNW)
terminals and those on Canada’s west coast at Vancouver and Prince Rupert. While capacity and throughput
are similar - Vancouver and Prince Rupert have 7 facilities as compared to the PNW’s 10 with each handling
15-17 MMT annually and having comparable hourly average loading rates - they differ in design and physical
proximity to ocean lanes. Only three of the PNW facilities are located directly on tidewater while the other
seven are located along the Columbia River. Five of the Columbia River facilities are also designed with
railway “loop tracks” which significantly increases their railcar unloading capability.
The majority of grain moving through these facilities flows from US PNW and Northwestern regional shippers.
It should be noted that prior to the change in the Canadian Wheat Board marketing mandate, there was little
movement of Canadian grain into these facilities. Since August 1, 2012 commercial arrangements between
Canadian Pacific and Union Pacific which serves the Columbia River area have provided Canadian shippers
Figure 6: U.S. Port Terminals by Region (Source: US Directory of Export Elevators at Export Port Locations, USDA,GIPSA)
16 | Quorum Corporation: A Comparison of the Canadian and US Grain Supply Chains
with competitive freight rates. If these terminals choose to offer comparable pricing it is likely this routing
option will become a competitive option for shippers of Canadian grain.
The Texas Gulf facilities are all rail served and handle grain traffic flowing from the South Central and Mid
West Regions. These terminals represent the second largest coastal concentration of storage capacity in
the U.S.10 and collectively have the highest loading capability of any regional port grouping in North America.
The Mississippi River terminal network consists of 20 terminals that load barges for movement through the
inland waterway to tidewater. The river barge system runs from Minneapolis, Chicago (starting on the Illinois
River) and Pittsburg (on the Ohio River) in the north through to Baton Rouge. The 12 terminals in the
Louisiana Gulf region are serviced by both barge and rail and serve the central US regions for export grains
while the terminals in the California ports are smaller facilities that cater primarily to niche markets.
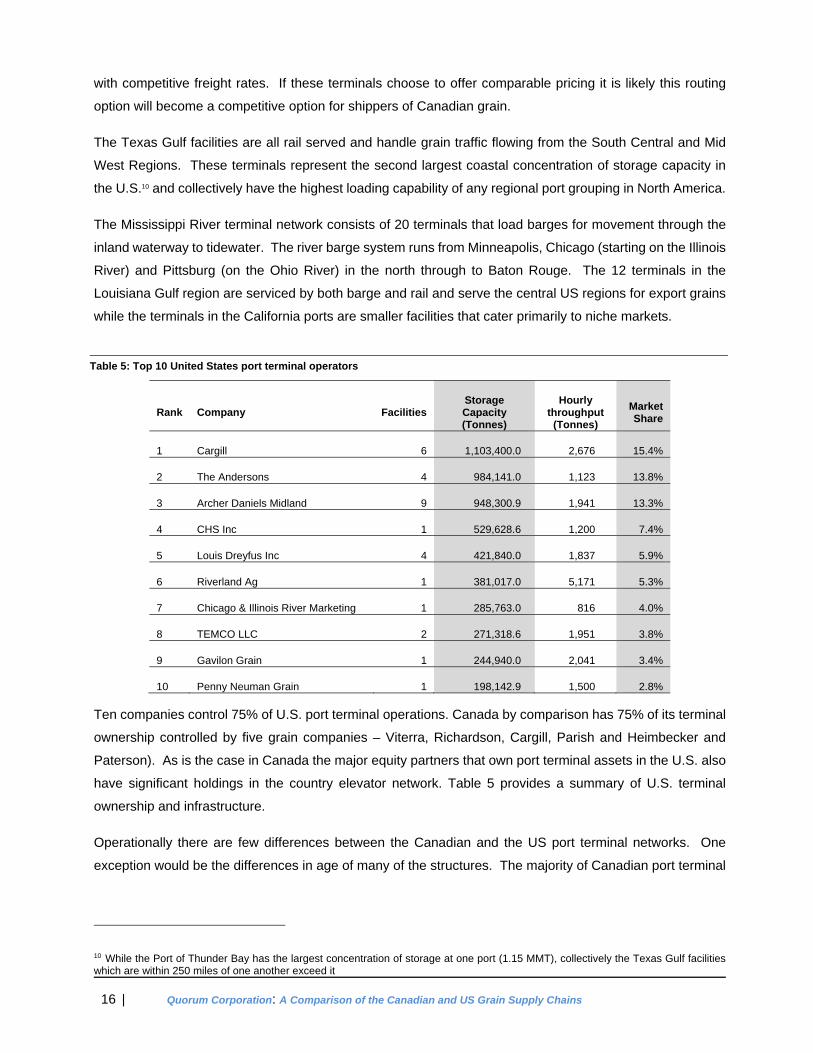
Rank Company Facilities Storage Capacity (Tonnes)
Hourly throughput
(Tonnes)
Market Share
1 Cargill 6 1,103,400.0 2,676 15.4%
2 The Andersons 4 984,141.0 1,123 13.8%
3 Archer Daniels Midland 9 948,300.9 1,941 13.3%
4 CHS Inc 1 529,628.6 1,200 7.4%
5 Louis Dreyfus Inc 4 421,840.0 1,837 5.9%
6 Riverland Ag 1 381,017.0 5,171 5.3%
7 Chicago & Illinois River Marketing 1 285,763.0 816 4.0%
8 TEMCO LLC 2 271,318.6 1,951 3.8%
9 Gavilon Grain 1 244,940.0 2,041 3.4%
10 Penny Neuman Grain 1 198,142.9 1,500 2.8%
Ten companies control 75% of U.S. port terminal operations. Canada by comparison has 75% of its terminal
ownership controlled by five grain companies – Viterra, Richardson, Cargill, Parish and Heimbecker and
Paterson). As is the case in Canada the major equity partners that own port terminal assets in the U.S. also
have significant holdings in the country elevator network. Table 5 provides a summary of U.S. terminal
ownership and infrastructure.
Operationally there are few differences between the Canadian and the US port terminal networks. One
exception would be the differences in age of many of the structures. The majority of Canadian port terminal
10 While the Port of Thunder Bay has the largest concentration of storage at one port (1.15 MMT), collectively the Texas Gulf facilities which are within 250 miles of one another exceed it
Table 5: Top 10 United States port terminal operators

Quorum Corporation: Grain Supply Chain Study | 17
facilities were initially built between 60 and 80 years ago, with only two being built within the last 25 years.
In the US there have been more than 12 terminals constructed in the past 10 years. As noted above, one
significant difference in the new design of a port terminal facility is the increase in the use of railway loop
tracks. Loop tracks allow a full train to be unloaded without breaking apart the train, speeding the process
with the associated efficiency in capacity and asset utilization. In Canada, all port terminal facilities are
designed with either stub end or flow through tangent tracks that require trains to be broken apart and
switched into position. This design, which dates back to the first half of the 20th century, was driven by the
desire of port planners to optimize waterfront acreage at a port and in consideration of railway operational
practices at the time that saw the majority of grain moved to port using manifest trains. Terminals developed
today reflect the increased use of unit train configurations and seek to exploit the efficiencies that practice
offers.
CountryElevatorInfrastructure
There are significant differences in how the country elevator systems in the U.S. and Canada operate and
are regulated. Whereas Canada regulates, licenses and maintains records only for country facilities that
handle western Canadian grains, the U.S. maintains extensive records of all licensed and unlicensed facilities
– known as public warehouses - that receive, forward and/ or process grain, whether that is for domestic or
export use. As such the availability of data on the US network is far more expansive than that available in
Canada.
Figure 7: U.S. Grain Country Licensed Handling and Storage Facilities and Capacity
18 | Quorum Corporation: A Comparison of the Canadian and US Grain Supply Chains
A facility in the US that obtains a Grain Inspection, Packers and Stockyards Administration (GIPSA) license
is entitled to receive and administer grains that are sold under Marketing Assistance Loans (MALs) and Loan
Deficiency Payments (LDPs) (as discussed above). In Western Canada all facilities handling grain must
obtain a license from the Canadian Grain Commission, whereas facilities in Eastern Canada do not.
Figure 7 above illustrates the total number of licensed US country handling facilities and the attendant storage
capacity in each region.
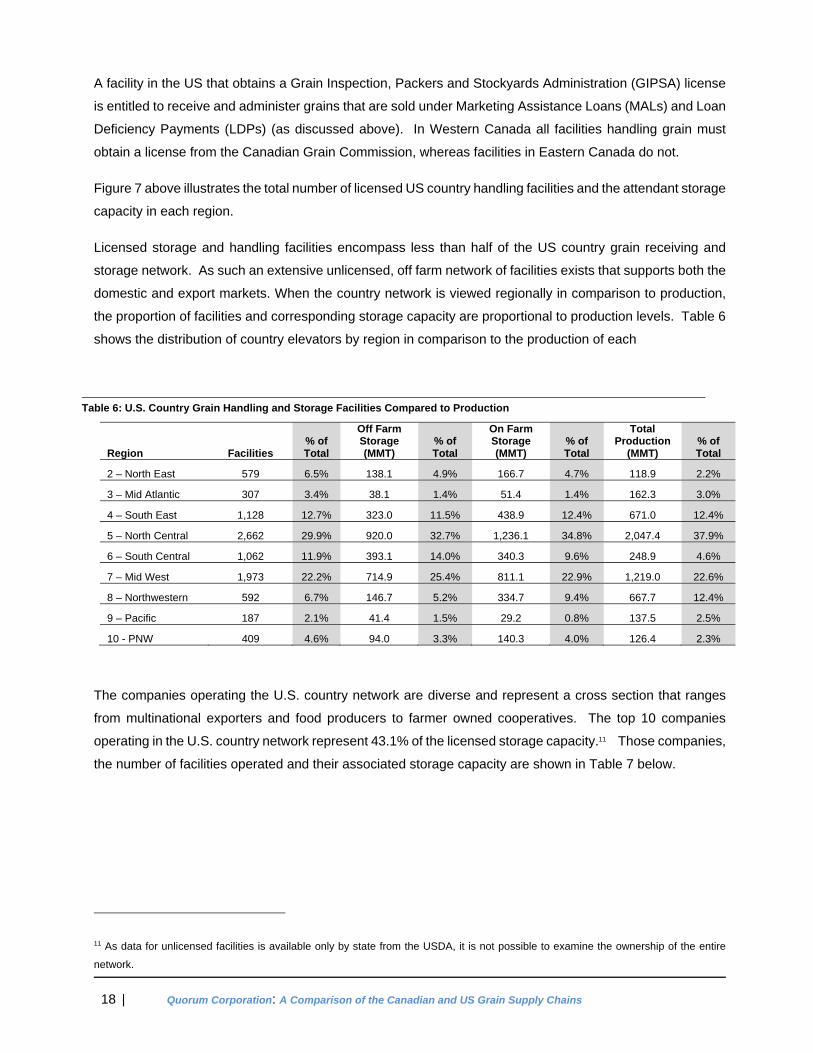
Licensed storage and handling facilities encompass less than half of the US country grain receiving and
storage network. As such an extensive unlicensed, off farm network of facilities exists that supports both the
domestic and export markets. When the country network is viewed regionally in comparison to production,
the proportion of facilities and corresponding storage capacity are proportional to production levels. Table 6
shows the distribution of country elevators by region in comparison to the production of each
Region Facilities % of Total
Off Farm Storage (MMT)
% of Total
On Farm Storage (MMT)
% of Total
Total Production
(MMT) % of Total
2 – North East 579 6.5% 138.1 4.9% 166.7 4.7% 118.9 2.2%
3 – Mid Atlantic 307 3.4% 38.1 1.4% 51.4 1.4% 162.3 3.0%
4 – South East 1,128 12.7% 323.0 11.5% 438.9 12.4% 671.0 12.4%
5 – North Central 2,662 29.9% 920.0 32.7% 1,236.1 34.8% 2,047.4 37.9%
6 – South Central 1,062 11.9% 393.1 14.0% 340.3 9.6% 248.9 4.6%
7 – Mid West 1,973 22.2% 714.9 25.4% 811.1 22.9% 1,219.0 22.6%
8 – Northwestern 592 6.7% 146.7 5.2% 334.7 9.4% 667.7 12.4%
9 – Pacific 187 2.1% 41.4 1.5% 29.2 0.8% 137.5 2.5%
10 - PNW 409 4.6% 94.0 3.3% 140.3 4.0% 126.4 2.3%
The companies operating the U.S. country network are diverse and represent a cross section that ranges
from multinational exporters and food producers to farmer owned cooperatives. The top 10 companies
operating in the U.S. country network represent 43.1% of the licensed storage capacity.11 Those companies,
the number of facilities operated and their associated storage capacity are shown in Table 7 below.
11 As data for unlicensed facilities is available only by state from the USDA, it is not possible to examine the ownership of the entire
network.
Table 6: U.S. Country Grain Handling and Storage Facilities Compared to Production

Quorum Corporation: Grain Supply Chain Study | 19
TransportationandLogisticsInfrastructure
TheUSRailSystem
There are presently about 563 freight railways operating in the United States employing over 160,000 people
and operating over 228,000 kilometers of rail line. Of these, 556 are classified as regional and shortline
railways and account for less than 10% of total railway gross revenues generated by American carriers. More
than 90% of freight revenue is generated by just seven carriers. Included in those seven are CN and CP,
both of whom have extensive operations in the U.S.
Rank Company Facilities
Storage Capacity (Tonnes) Market Share
1 Cargill 124 12,934,029 9.5%
2 Gavilon Grain 116 7,733,800 5.7%
3 Archer Daniels Midland 72 7,561,000 5.5%
4 CHS INC. 234 7,555,686 5.5%
5 Bunge North America 72 6,436,600 4.7%
6 Consolidated Grain & Barge Co. 63 4,499,743 3.3%
7 Farmers Cooperative Co. 59 3,453,800 2.5%
8 Riceland Foods Inc. 31 3,262,857 2.4%
9 Attebury Grain 38 3,054,029 2.2%
10 Perdue Grain & Oilseed 46 2,480,400 1.8%
Table 7: Top 10 Companies Operating Licensed Country Handling Facilities in U.S.
Figure 8: U.S. Railway Network
20 | Quorum Corporation: A Comparison of the Canadian and US Grain Supply Chains
In Figure 8, the North American railway network is shown. The two largest U.S. carriers are Union Pacific
Railroad and BNSF Railway, both which see approximately 20% of their revenues and workload associated
with the movement of agricultural products. Both railways have the largest portion of their networks located
in the central and western portions of the country and with a large proportion of grain either produced or
routed west of the Ohio River, they have naturally become the largest rail service providers to the U.S. grain
industry, with either or both railways having good access to all but a few of the major port terminals.
CN’s network extends south from Winnipeg to Chicago and New Orleans, providing good access for both
Canadian and US Mid Western grain to the Louisiana Gulf port facilities. CP’s U.S. operations are slighly
smaller and benefit from good access into the U.S. mid western states.
TheEasternUSBargeandRiversystem
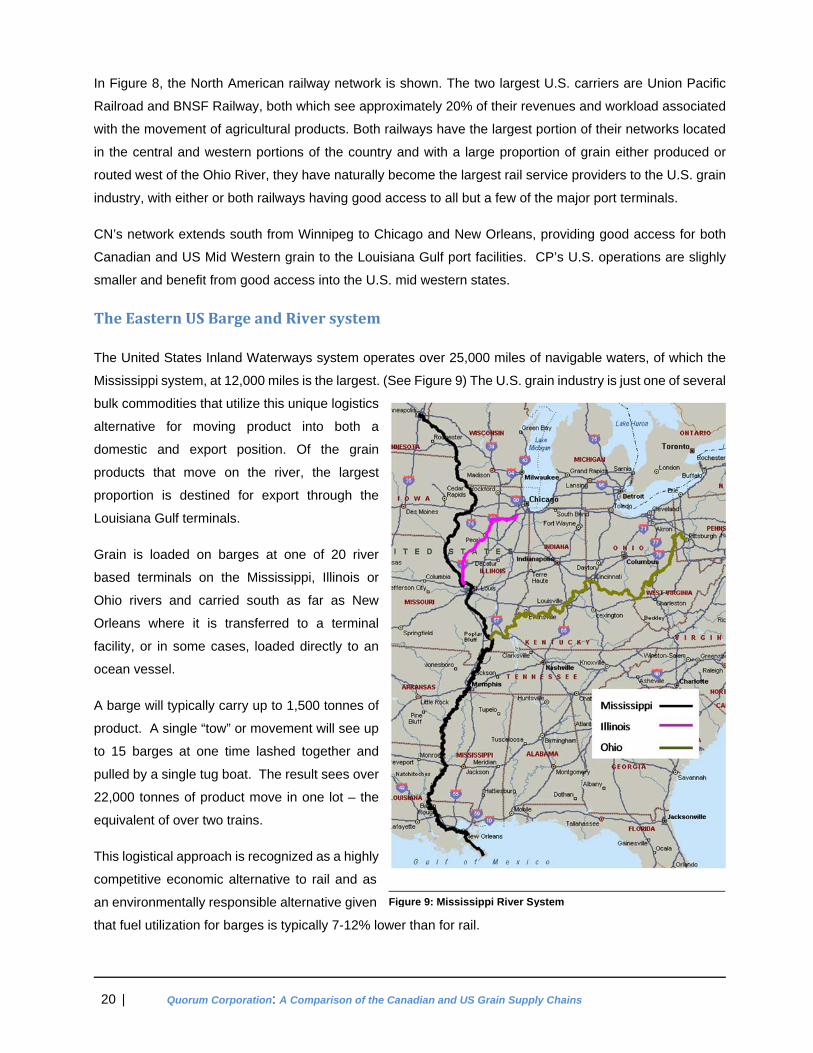
The United States Inland Waterways system operates over 25,000 miles of navigable waters, of which the
Mississippi system, at 12,000 miles is the largest. (See Figure 9) The U.S. grain industry is just one of several
bulk commodities that utilize this unique logistics
alternative for moving product into both a
domestic and export position. Of the grain
products that move on the river, the largest
proportion is destined for export through the
Louisiana Gulf terminals.
Grain is loaded on barges at one of 20 river
based terminals on the Mississippi, Illinois or
Ohio rivers and carried south as far as New
Orleans where it is transferred to a terminal
facility, or in some cases, loaded directly to an
ocean vessel.
A barge will typically carry up to 1,500 tonnes of
product. A single “tow” or movement will see up
to 15 barges at one time lashed together and
pulled by a single tug boat. The result sees over
22,000 tonnes of product move in one lot – the
equivalent of over two trains.
This logistical approach is recognized as a highly
competitive economic alternative to rail and as
an environmentally responsible alternative given
that fuel utilization for barges is typically 7-12% lower than for rail.
Figure 9: Mississippi River System

Quorum Corporation: Grain Supply Chain Study | 21
The Mississippi River system is viewed as a key strategic asset by the U.S. Government and as such is
maintained by the U.S. Army Corp of Engineers. The system has 191 locks, several dams and weirs12 and
requires continuous dredging throughout to ensure that silt and debris normally carried through any river
system is cleared and that adequate water depths are maintained for safe passage of the traffic that moves
on the river. It is estimated that 13% of all U.S. export traffic uses the Mississippi River system to gain access
to tidewater.
TruckingofGrainintheUS
The use of trucks in the movement of grain in the U.S. has become increasingly prevalent in recent years,
particularly in the movement of goods to domestic markets. Similar to the Canadian experience, producers
will use a mix of owned and contracted trucking services to position grain at both the country handling facilities
as well as processors (milling, malt, feed etc.). Increased truck use has likely been influenced by the
increased use of corn in ethanol production. Ethanol facilities will depend on a regular and metered supply
of feedstock and the most effective logistical alternative is by truck from the farm gate.
Disposition
As noted above and shown in Figure 10, 24% of US production moves to export markets as compared to
Canada which exports 51% of its production. In the US, the largest export crop is corn, which on a three
year average basis moves over
55MMT into the export marketplace
(see Table 8). Wheat is their
second largest export at 28 MMT.
Canada’s largest export of course
is wheat and in the case of both
countries, a large quantity of
oilseeds is exported – soybeans in
the case of the US and canola from
Canada.
The US domestic market is
dominated by corn in both the fuel
(24%) and feed and industrial use
(25%) as shown in Table 9. The
US also sees 17% of its production
12 A weir is a barrier across a river, typically smaller than a dam, designed to alter the flow characteristics.
523,737
80,239
124,858
41,089
0
100,000
200,000
300,000
400,000
500,000
600,000
US Canada
Production (Tonnes 000's) Exports (Tonnes 000's)
24%51%
Figure 10: U.S. vs. Canadian Grain Production (Major Grain crops – 3 year average to 2011)

22 | Quorum Corporation: A Comparison of the Canadian and US Grain Supply Chains
move into the human consumption
markets, reflective of the two countries’
difference in population and
demographics. (See Table 9)
Canada
% of Total Prod
United States
% of Total Prod
Human Food
Barley 0.0 0% 3.1 1% Corn 2.3 3% 64.0 12%
Other Grains 0.1 0% 1.1 0% Wheat & Durum 2.8 3% 24.8 5%
Human Food Total 5.2 6% 93.1 17%
Industrial, Feed, Seed, Waste, Dockage
Barley 7.4 9% 1.1 0% Corn (for Fuel) 0% 127.1 24%
Corn (for Feed and Ind) 14.0 17% 137.2 25% Oilseeds 6.5 8% 50.9 9%
Other Grains 2.3 3% 1.7 0% Wheat & Durum 4.5 6% 4.1 1%
Feed, Waste, Dockage Total 34.7 43% 322.1 60%
Commodity Group Canada United States
Corn 998 55,521 Wheat / Durum 17,920 28,383
Barley 985 178
Oilseeds 10,151 39,000 Pulses/ Special Crops 4,458 1,258
Processed and Other Grains 6,577 518
Grand Total 41,089 124,858
Table 8: Grain Exports: U.S. vs. Canada (3 year average 2009-11)
Table 9: Total Domestic Disposition (3 year average 2009-11) (Source: United States Department of Agriculture Foreign Agricultural Service, Statistics Canada)
Quorum Corporation: Grain Supply Chain Study | 23
Transportation
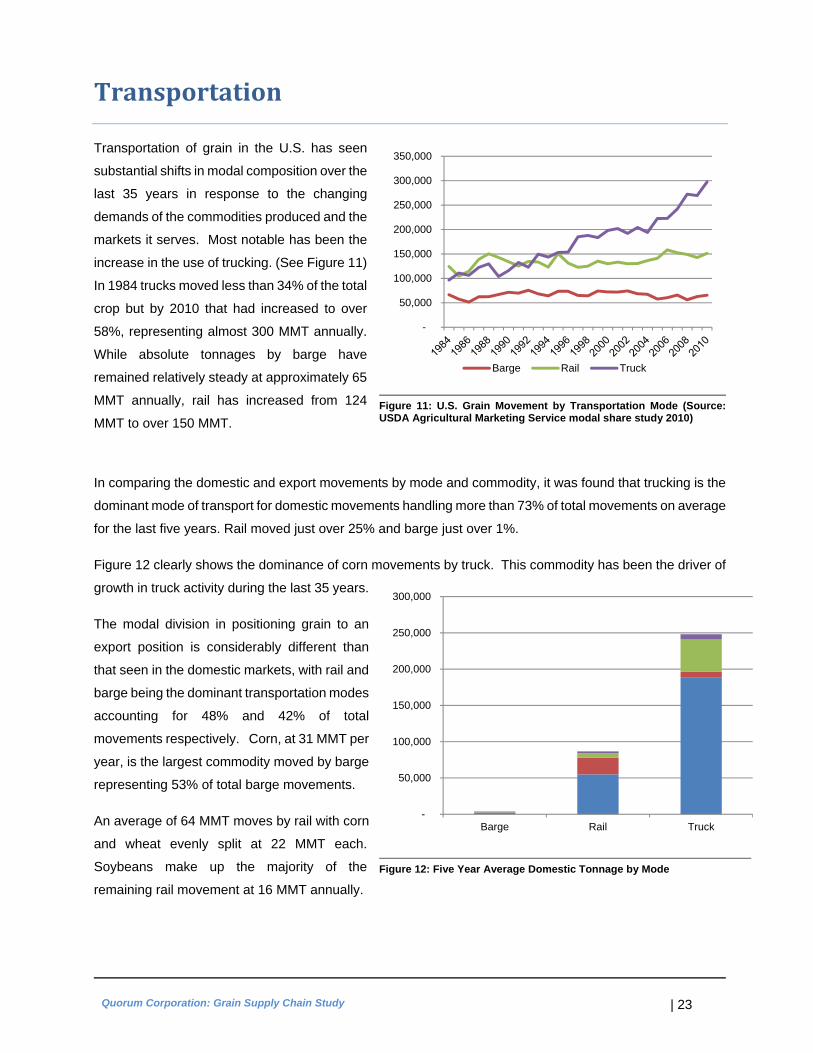
Transportation of grain in the U.S. has seen
substantial shifts in modal composition over the
last 35 years in response to the changing
demands of the commodities produced and the
markets it serves. Most notable has been the
increase in the use of trucking. (See Figure 11)
In 1984 trucks moved less than 34% of the total
crop but by 2010 that had increased to over
58%, representing almost 300 MMT annually.
While absolute tonnages by barge have
remained relatively steady at approximately 65
MMT annually, rail has increased from 124
MMT to over 150 MMT.
In comparing the domestic and export movements by mode and commodity, it was found that trucking is the
dominant mode of transport for domestic movements handling more than 73% of total movements on average
for the last five years. Rail moved just over 25% and barge just over 1%.
Figure 12 clearly shows the dominance of corn movements by truck. This commodity has been the driver of
growth in truck activity during the last 35 years.
The modal division in positioning grain to an
export position is considerably different than
that seen in the domestic markets, with rail and
barge being the dominant transportation modes
accounting for 48% and 42% of total
movements respectively. Corn, at 31 MMT per
year, is the largest commodity moved by barge
representing 53% of total barge movements.
An average of 64 MMT moves by rail with corn
and wheat evenly split at 22 MMT each.
Soybeans make up the majority of the
remaining rail movement at 16 MMT annually.
-
50,000
100,000
150,000
200,000
250,000
300,000
350,000
Barge Rail Truck
-
50,000
100,000
150,000
200,000
250,000
300,000
Barge Rail Truck
Dom Corn Dom Wheat Dom Soybeans Dom Other
Figure 11: U.S. Grain Movement by Transportation Mode (Source: USDA Agricultural Marketing Service modal share study 2010)
Figure 12: Five Year Average Domestic Tonnage by Mode

24 | Quorum Corporation: A Comparison of the Canadian and US Grain Supply Chains
Truck movement represents only 10% of movements to export position largely because of the length of haul,
which makes the rail and barge modes more
economically efficient and therefore
preferential to shippers. (See Figure 13)
Moreover, port facilities are most often
designed with large lot bulk handling in mind.
Truck movement will be confined to short haul
(less than 500 kilometers).
In the western regions, the railways’ shift to an
increased use of unit trains has had an impact
on overall costs and made rail a more popular
option for shippers. This has resulted in a shift
of 5½% in modal share from barge to rail over
the last 30 years.
Railway strategies with respect to railcar
allocation have had minimal impact on the
choices grain shippers make in terms of the markets they target. Despite the railways’ continued seasonal
freight pricing strategies whereby railways may charge higher freight rates during peak shipping periods,
grain companies are quick to point out that these freight differentials pale by comparison to the incremental
margins they can earn by moving grain into certain global markets during peak pricing seasons, such as the
post harvest and late spring timeframes.
Railway bid car programs are used by grain shippers to reserve car supply particularly through peak periods
when pricing opportunities are greatest. While these programs do incent some degree of demand peak
smoothing through the year, railways who have bid car programs in place such as BNSF and Union Pacific
point to the fact that bid car contracts do offer grain companies flexibility in that they can be traded among
shippers. Many grain shippers will enter into a bid car program and contract for a full year, with the intent of
selling a portion of their capacity to other shippers. An example of this would be a situation where a company
looking to move corn or wheat to PNW port terminals from October to April partners with company looking to
move corn into south east ethanol markets or Louisiana Gulf ports from May until September.
Much like shippers in Canada, US rail shippers have recently been lobbying the US Federal Government for
increased shipper protection legislation. Perhaps in response to these shipper initiatives the BNSF has
recently changed its approach to adminstrative and operating penalties by implementing reciprocal penalties
for service failures. In doing so they have put in place systems and processes that track and pay penalties
when they fail to deliver to the standard they have agreed to with the shipper. Other US railways have also
begun to look at similar practices in light of recent discussions by legislators with respect to strengthening
shipper protection laws and regulations in the US.
-
10,000
20,000
30,000
40,000
50,000
60,000
70,000
Barge Rail Truck
Ex Corn Ex Wheat Ex Soybeans Ex Other
Figure 13: Five Year Average Export Tonnage by Mode

Quorum Corporation: Grain Supply Chain Study | 25
Markets
The U.S. grain market should be viewed in terms of corn and then everything else. Driven in part by
legislative actions tied to fuel initiatives and subsidies, corn prodcution in the U.S. is the foundation of the
industry and is therefore the base of the supply chain. The volumes involved go a long way to supporting
the logistics infrastructure and therefore the cost structure of the grain supply chain. In Canada that was the
case with wheat, however in the past 15 to 20 years the system has become less dependent on a single
commodity through diversification. This is happening in the U.S. in some regions, particularly in the North
West and Pacific Northwest where wheat (including durum) and special crops are becoming more
predominant.
The second most important factor with the U.S. grain market is the broad involvement of multi-national
companies who trade in global markets. As over half of port facilities are controlled by multi-nationals (50.5%)
and well over a third of the country elevator space (38.3%), their interests and the global markets they trade
in have an influence on what they are most interested in buying from the U.S. producer. While this will have
a limited impact on how the domestic markets operate, it does have an impact on how export trading is
handled - in particular how and with which countries and buyers the companies trade.
The U.S. grain markets trade based on price signals that come from the three major grain trading floors: The
Chicago Board of Trade (CBOT), The Minneapolis Grain Exchange (MGEX) and the Kansas City Grain
Exchange (KCBT). This includes current and futures markets trades as all three trade in both.
TheStakeholders,theirrolesandrelationships
Domestic buyers of U.S. grain are first the ethanol producers, and next the feed markets, the two of which
account for over 60% of U.S. production. As noted above, human consumption represents 17% of the total
U.S. production. The following discusses each of the stakeholder groups, what they buy and sell in the U.S.
grain supply chain, and how this differs from the Canadian market.
Producers
Predominantly family farm owners but increasingly, corporate farms with directed production
What they buy and from whom: Seed, other crop inputs from both corporate agro science dealers as well as
local seed dealers. Often, local farmer owned cooperatives will “bulk buy” crop inputs.
What they sell and to whom: All crop production in the US emanates from farm based production. As noted
above, an increase in corporate farming has been seen although no reliable tracking of the total marketplace
is available. Companies involved in either ethanol or livestock production, such as Tyson Foods, are
increasing their interests in grain production to secure feedstock for their main production.

26 | Quorum Corporation: A Comparison of the Canadian and US Grain Supply Chains
The means by which their grain is sold varies dependent on the crop and the buyer. Cereal crops are sold
to either a grain company or directly to a miller, a maltster (in the case of malt barley) or a feed mill. The
nature of the commercial relationship between all is similar. Grain is sold either through a forward contract
or on a direct sale, the latter of which is declining in use with most buyers and producers favouring the
establishment of longer term agreements so as to mitigate risk on both sides.
Corn and special crops are sold in much the same manner with ethanol producers looking for stable supplies
of starch based feedstock and feed mills sourcing the lowest cost form of protein. Ethanol producers will look
to establish forward contracts wherever possible, while feed mills will look to source on a cash basis
How this differs from the Canadian market: The use of forward contracts on non cereal grains has been used
in canola and some pulse crops over the past number of years. The Canadian Wheat Board introduced a
modified form of a forward contract in recent years, but most cereal grains were sold through the pooling
options. There were some modified exceptions to this such as Warburton’s Bakery for which wheat
production is contracted. The current crop year saw offerings of forward contracts; however this option is
still being developed between grain companies and producers in Canada.
AgribusinessCropSuppliers
Companies such as: Monsanto, Dow AgroScience, Bayer, BASF, Dupont, Syngenta who are involved in the
development of hybrid seeds and associated chemical inputs for improved quality and yield
What they buy and from whom: Agribusiness companies will contract for the production of the seed of hybrid
or modified grains which they hold patents on.
What they sell and to whom: They sell this grain to producers either directly or through dealers and farmer
cooperatives. The terms of sale are normally cash or a modified form of credit through dealers or
cooperatives.
How this differs from the Canadian market: There is little difference in the relationships between corporate
agribusiness and producers in the U.S. and Canada, however, the current variety registration regulations in
Canada place restrictions on the types of grain that can be produced to those that have been through the
approval process.
Ethanolproducers
There are presently 92 ethanol operating production facilities in the U.S. owned by 79 separate companies13.
There are 82 of those facilities that use corn as their primary feedstock. The largest of the companies is
Archer Daniels Midland who operates 7 plants with production capabilities of over 1 billion gallons annually.
13 Source: Renewable Fuels Association Bio-refinery locations - 2012

Quorum Corporation: Grain Supply Chain Study | 27
What they buy and from whom: Feedstock from producers. As noted above, corn is the largest form of starch
used in ethanol production (93% of capacity) but other grains used include wheat, barley and sorghum,
although these account for less than 6% of the total feedstock supplied.
What they sell and to whom: Ethanol to gasoline producers (oil companies) to meet US regulatory blending
standards as well as dried distilled grains for use in the feed markets. As noted above, most ethanol
production facilities will establish forward contracts with producers to ensure a steady supply of feedstock
and with the intent of finding some form of price (cost) stabilization.
How this differs from the Canadian market: Blending of ethanol into gasoline remains voluntary for Canadian
oil companies and as such the demand for ethanol has not seen the increases experienced in the US, nor
has the grain market been impacted except where demand for corn has caused an increase in the price of
livestoock feed grains.
FeedIndustry
The feed industry in the U.S. supplies the livestock feed requirements for meat production. The science of
livestock feed has advanced rapidly and as such, driven by an increase in consumer awareness, as well as
regulatory changes driven by events such as BSE, market demand has changed from one of “protein at the
lowest cost” to the current situation that includes the feed’s contents, quality and genetic attributes as well as
cost. Increasingly, food manufacturers involved in high output livestock operations such as Tyson Foods
have entered into grain production as a way of ensuring supply of product.
What they buy and from whom: Feed processors source directly from producers, but increasingly look to the
dry distilled grains (DDG) markets from ethanol production and oil seed crush from soybean and canola
operations. Some grain sourced from producers and most DDG’s will be purchased on a contract basis.
What they sell and to whom: Livestock mills sell to feed lots, poultry and dairy producers and finishing barns
as well as food manufacturers.
How this differs from the Canadian market: This is no different from the Canadian market, in fact, the U.S.
feed market is a consumer of many Canadian products such as canola pellets from crushing operations as
well as Canadian oats, barley and feed wheat
Millersandfoodmanufacturers
Millers and food manufacturers will source most of their product on a forward contract basis, much of it directly
from the producer with the larger portion from smaller grain companies and cooperatives where quality and
consistency can be tightly managed.
The kinds of companies involved can range from small millers to large multinational food manufacturers such
as General Mills. Companies will have established agents through the growing areas who contract with
28 | Quorum Corporation: A Comparison of the Canadian and US Grain Supply Chains
producers as far out as two years. Many of these agreements are based on long term relationships. Many
of the companies also construct and manage country receiving and handling facilities.
What they buy and from whom: All grains under contract from producers and from local cooperatives and
dealers. Most commercial arrangements are on a forward contract basis tied to prices based on one of the
three futures markets. As noted above, the buyer looks to establish tight controls on quality and consistency,
with price adjustments in the contract tied closely to the management of that consistency.
What they sell and to whom: The products these companies produce cover the range from basic foodstuffs
(breakfast cereals to soups, bread, beer and spirits) to sophisticated derivative products that use grains as a
feedstock (i.e. corn sugar syrup, lysine, etc.)
How this differs from the Canadian market: The demographic differences between the U.S. and Canada
dictates that Canada’s internal demand from human consumption products is significantly lower. However,
the US is a consumer of Canadian products, such as milling wheats and oats.
GrainCooperatives
The country gathering network in the US has hundreds of farmer owned grain cooperatives that own and
operate receiving, storage and loading facilities. In some cases these cooperatives will act as a dealer and
others as agents for dealers and exporters. While the data to determine what proportion of the country
handlings flow through these types of facilities, their continued existence, as well as their increase in numbers
over the past years would suggest that they have flourished. The size of these facilities can vary from 2,000
tonnes capacity up to 150,000 tonnes. In discussion with US producers, it was suggested that these
cooperatives were formed in answer to a void in the market as well as a belief that the cooperative would
give farmers a better option in which to both market their product as well as purchase inputs using a volume
economics approach.
What they buy and from whom: Handle all types of grains
What they sell and to whom: As noted above.
How this differs from the Canadian market: While the cooperative grain company system in Canada was
what ultimately formed the base of Viterra, now owned by Glencore, a new cooperative system is in the works
in the form of producer owned inland terminals such as representated by the Inland Terminal Association.
More recently we have seen a number of producer owned shortlines established through the railway
abandonment process and trackside producer car loading sites constructed. This would suggest that the
same economic drivers influence producers on both sides of the border.
GrainCompanies
The US grain market is served by a broad cross section of grain companies of both a local, national and
multinational base. Multinationals include Cargill, ADM, Scoular, Louis Dreyfus amongst others whose
Quorum Corporation: Grain Supply Chain Study | 29
interests lie in both the domestic and global export markets. Nationally companies such as Columbia, The
Andersons and Gavilon have established themselves in both markets.
What they buy and from whom: Grain companies in the US operate in a manner not unlike Canada in that
they buy grain from producers for sale in both the domestic and export markets. For many producers this
relationship is preferred as it simplifies their choices and to some degree mitigates the risk. The grain
company is often the retailer of crop inputs with many of them operating in both a retail and wholesale fashion.
The licensing of grain facilities as locations for the acceptance and administration of grain being sold under
the US loan management programs provides some marketing advantage to these companies and most
operate under those licenses.
The commercial relationship between the producer and the grain company is either on a forward contract
basis or cash purchase on the driveway. While the proportion of contract to cash will vary from producer to
producer and company to company, the ranges go from 20-70%, dependent on each entity’s desire to
manage or accept risk and the way the markets are showing at any particular moment.
The producer contract approach most popular in the US grain markets today and used by both grain
companies and millers is the “hedge to arrival” contracts. In these contracts a producer will establish a
contract price for a specific month in the future, ostensibly a period for the next crop (i.e. September of the
following year). The contract price will be set on a particular grain exchanges futures price for that month.
Typically a contract will stipulate a number of lots (typically a lot size is 5,000 bushels) and the terms of
delivery (the location of the delivery facility and the month of delivery, the grade and protein expectation etc.).
Risk is mitigated by the buyer through an agreement that states that grade and protein differentials will be
adjusted at the time of delivery. The producer must then deliver the product at that forward point in time and
accepts the adjustments as determined by the buyer at the time of delivery.
What they sell and to whom: As noted above, dependent on the product and the company, grain companies
in the US will be involved in both the domestic and export markets. The multinationals that are also involved
in the manufacturing of food (Cargill and ADM for example) use the country network to source for all of their
operations, whereas companies such as The Andersons and Gavilon will work with both dealers and other
international exporters in the sourcing and gathering of product for positioning of an export sale.
The nature of the export sale will vary dependent on the buyer, although it has been suggested by many that
where FOB terms were once a prevalent approach, buyers are opting to move to C&F/ CIF terms as they
wish to control the terms of the ocean freight, likely looking to take as much advantage of low ocean freight
costs that are in place presently.
How this differs from the Canadian market: There are few differences in how this portion of the US market
works as compared to Canada with the exception of the management of the commercial transaction. In most
cases the transaction in and of itself (i.e forward contracting) is used more often as it has been a practice in
place for a longer period of time. The producers in the US interviewed for this assessment believe that as

30 | Quorum Corporation: A Comparison of the Canadian and US Grain Supply Chains
the recent Canadian market changes become more established, these more sophisticated contracting
approaches will become the norm as well.

Quorum Corporation: Grain Supply Chain Study | 31
SummaryoftheCanadian–USsupplychains
It is the view of many industry stakeholders that the North American grain industry is evolving into a
continental market, the Canadian Wheat Board marketing change being just one in a series of events driving
the transformation. The industries in the two countries have competed in only a few areas over the past 20
years – most predominantly in global wheat sales, yet even that was limited as there are many differences
in the quality and intended use of the varying wheat types. In real terms, the types of grain crops that are
grown are as much a function of climate and geography as they are about the markets they are intended for.
Canadian prairie geography and climate is geared to a type of grain with attributes that are different than a
grain grown in Iowa or Kansas. This contributes to why many US millers look to buy a portion of their milling
wheat from Canada so as to allow them to blend to a certain specification. In many ways the two markets
complement one another. This is a leading rationale of those who believe the evolution will be to a North
American one.
How the pricing of Canadian grain will evolve remains in question as the ICE14 futures market continues to
look for increases in its use and therefore relevance in its new markets (barley, durum and wheat). Many
have begun to use the US grain exchanges as the basis in which they trade and one (MGEX) is now pricing
futures on Canadian grain and accepting Canadian grain to settle futures contracts. It too lends to the
continental market theory.
Production contracts have evolved considerably over the past 12 months when the first cereal grain contract
was offered by a grain company in Canada. Since the transition from a single desk for marketing of wheat,
durum and barley to an open market, it is likely that as the markets mature and grain companies’
understanding of both markets becomes better, we will see an increase in the amount of producer contracts
and better forward planning of sales and logistics. It is the opinion of most that increases in forward
contracting will lead to the greater stregthening of relationships between buyers and producers in the future.
14 ICE refers to ICE Futures Canada which is the Canadian arm of Intercontinental Exchange, traded on the NYSE. It was formed from the former Winnipeg Commodity Exchange