A Comparison of Tension and Compression Creep in a ... Comparison of Tension and Compression Creep...
36
NASA Technical Memorandum 110273 / A Comparison of Tension and Compression Creep in a Polymeric Composite and the Effects of Physical Aging on Creep Thomas S. Gates Langley Research Center, Hampton, Virginia David R. Veazie Clark Atlanta University, Atlanta, Georgia L. Catherine Brinson Northwestern University, Evanston, Illinois August 1996 National Aeronautics and Space Administration Langley Research Center Hampton, Virginia 23681-0001 https://ntrs.nasa.gov/search.jsp?R=19960045294 2018-07-13T09:13:49+00:00Z
Transcript of A Comparison of Tension and Compression Creep in a ... Comparison of Tension and Compression Creep...

NASA Technical Memorandum 110273
/
A Comparison of Tension andCompression Creep in a PolymericComposite and the Effects of PhysicalAging on Creep
Thomas S. Gates
Langley Research Center, Hampton, Virginia
David R. Veazie
Clark Atlanta University, Atlanta, Georgia
L. Catherine Brinson
Northwestern University, Evanston, Illinois
August 1996
National Aeronautics and
Space Administration
Langley Research CenterHampton, Virginia 23681-0001
https://ntrs.nasa.gov/search.jsp?R=19960045294 2018-07-13T09:13:49+00:00Z


Abstract
Experimental and analytical methods were used to investigate the similarities and
differences of the effects of physical aging on creep compliance of IM7/K3B composite
loaded in tension and compression. Two matrix dominated loading modes, shear and
transverse, were investigated for two load cases, tension and compression. The tests, run
over a range of sub-glass transition temperatures, provided material constants, material
master curves and aging related parameters.
Comparing results from the short-term data indicated that although trends in the data
with respect to aging time and aging temperature are similar, differences exist due to load
direction and mode. The analytical model used for predicting long-term behavior using
short-term data as input worked equally as well for the tension or compression loaded
cases. Comparison of the loading modes indicated that the predictive model provided
more accurate long term predictions for the shear mode as compared to the transverse
mode. Parametric studies showed the usefulness of the predictive model as a tool for
investigating long-term performance and compliance acceleration due to temperature.
Key Words: Composites, Viscoelasticity, Physical Aging, Elevated Temperature,
Compression, Creep Testing

Introduction
Long term mechanical behavior of advanced polymeric composites (PMC's) are acritical issue for many modem engineering structural applications such as those found in
the biomedical, civil infrastructure, and aerospace disciplines. Three primary concerns
exist when the engineer addresses long term performance of PMC's: 1) screening for finalmaterials selection, 2) acquiring the data base of critical engineering properties that emend
over the projected life-time of the structure, and 3) developing the combined analysis and
test methods that provide a means of predicting durability and performance. The intent ofthis research is to present the results of recent work that applies to all three of these
concerns.
The three basic constituents of advanced PMC's are fiber, interphase, and matrix. In
many circumstances the polymeric matrix can be the major constituent that contributes todegradation or changes in durability of PMC's. Changes in composite stiffness, strength
and fatigue life can all be related to changes in the mechanical properties of the polymermatrix. As shown in Bank et al. [1] the matrix was found to be the key constituent in the
durability of PMC's subjected to long term exposure at elevated temperatures. Theirreport also demonstrated that individual test methods combined in an integrated scheme
will provide an accurate method for understanding the different contributions of variousdegradation mechanisms to durability. Therefore, to develop an understanding of the
degradation factors, the methods pursued in this work concentrated on matrix dominatedbehavior.
With this background established, the current work has utilized elevated temperature
creep tests to determine the effects of physical aging on the long term viscoelastic
compliance of an advanced PMC. Selection of creep to asses viscoelastic behavior in
PMC's was based upon the previous work by many separate investigators. A recent
review of this topic by Scott et al. [2] found that viscoelastic models (both linear and
nonlinear) should take into account the effects of shearing deformations to ensure accurate
predictions. In addition it was found that temperature was a primary factor in creepbehavior and that the use of time-temperature based superposition principles provided the
type of parameters necessary for making accurate long-term predictions. Other
investigators such as Struik [3] and McKenna et al. [4] have used creep tests of neat
polymers to determine the effects of physical aging on long term creep. In these studies
investigations were made into the concepts of effective time theory and relationships
between aging and free volume evolution. Combining creep tests, concepts of linear
viscoelasticity, and mechanics of composite materials has been done more recently by
investigators such as Hastie and Morris [5], Sullivan [6], and Wang et al. [7] utilizing
high performance PMC's tested below the glass transition (Tg) temperature.
For tension loaded materials, the authors recently used the procedures and models
found in the literature as a foundation for expanding the analytical and test methodologies.
Brinson and Gates [8] determined that the physical aging shift rate was the most critical
2
parameter in calculating the magnitude of agings' effect on long term performance.
Results from Gates and Feldman [9] and Veazie and Gates [10] showed that the
sequenced creep testing procedures produced repeatable test data for IM7/K3B laminates
loaded in tension and compression. Time/temperature and time/aging-time superposition
techniques provided the material properties required to make long-term predictions.
This paper extends these investigations by comparing the effects of physical aging in
tension versus compression for both shear and transverse loading modes. To establish the
background for the analytical methodology, a brief summary is given on linear
viscoelasticity and physical aging in composites. The properties of the test material,
IM7/K3B, are given and the experimental equipment and procedures are described. The
methods of data reduction are explained including the use of superposition techniques.
Results from the short and long term tests are discussed. Direct comparisons between
tension and compression behavior for shear and transverse loading modes are made by
comparing aging shift rates, material constants, material master curves, long term data and
predictions for a variety of laminates.
Viscoelasticity and Aging
An analytical model as provided in Brinson and Gates [8] was used to predict the long
term tension creep compliance using as input the material properties developed from short
term tests. A "long term" test was defined as a test time at least 10 times greater than the
time of the %hort term" material property tests. Using this definition it was expected that
the model would provide insights into the effects of physical aging on the long term
viscoelastic behavior of advanced polymeric composites. For the purposes of this
discussion, the model is briefly recounted for tension loading only. Apart from the obvious
sign differences between tension and compression loading the tension based model was
not modified for analysis of compression loading.
Linear Viscoelastic Creep Compliance
The time dependent linear creep compliance was modeled with a three parameter
expression given by
S(t) = S°e <t/_?
where S°, _, and [3 are the initial compliance, retardation time and shape parameter
respectively.
(1)
Time Based Superposition
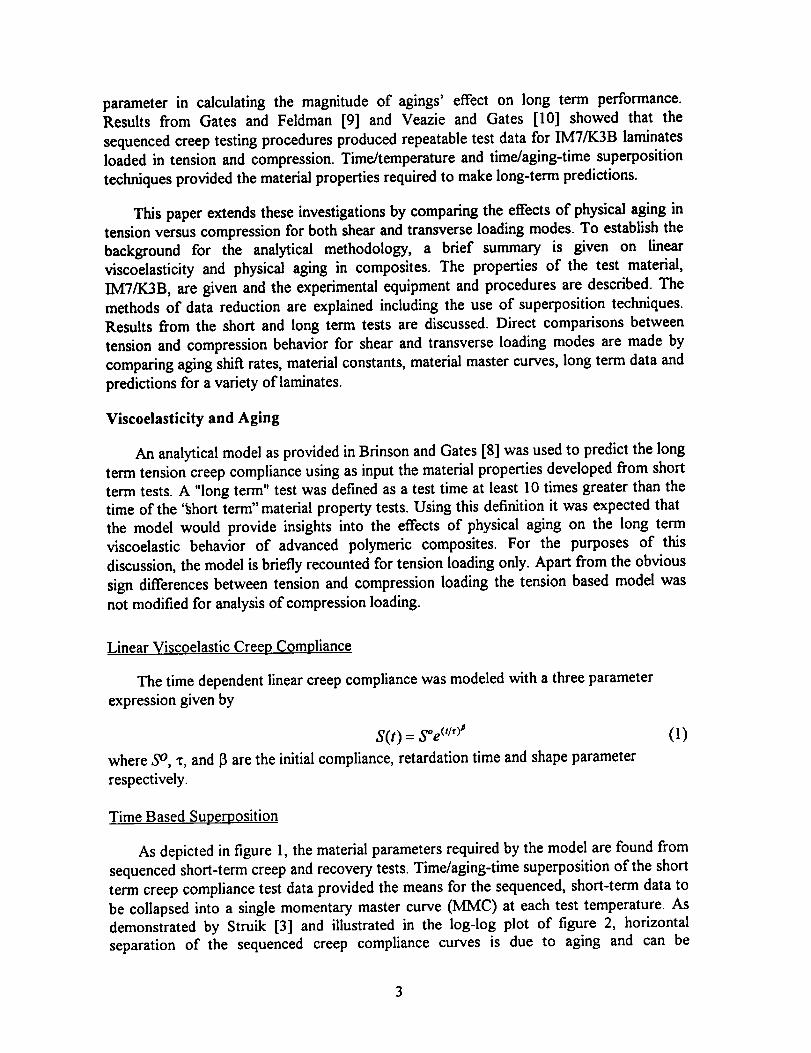
As depicted in figure 1, the material parameters required by the model are found from
sequenced short-term creep and recovery tests. Time/aging-time superposition of the short
term creep compliance test data provided the means for the sequenced, short-term data to
be collapsed into a single momentary master curve (MMC) at each test temperature. As
demonstrated by Struik [3] and illustrated in the log-log plot of figure 2, horizontal
separation of the sequenced creep compliance curves is due to aging and can be

characterized by the aging shift factor (-log a). This shift factor is simply defined as the
horizontal distance required to shift a compliance curve to coincide with a reference
compliance curve. A linear fit of all the shift factors versus the logarithmic aging time (log
te) for each MMC, (figure 3) gave the aging shift rate
-dloga= (2)
dlogt,
where te is the aging time. The reference compliance curve could be any of the sequenced
curves, but for convenience of data manipulation, the longest (96 hour) compliance curve
was selected as the reference during formation of the MMC. However, to facilitate data
reporting, all MMC parameters were subsequently referenced to the shortest (2 hour)
compliance curve. For a horizontal (time) translation of a compliance curve, only the
retardation time parameter needs to be recalculated. Given the aging shift rate and
aging time to another wasreference curve parameters, the translation from one
accomplished through the use of
\ teref J
(3)
where t,r,/is the reference aging time (Brinson and Gates [8]).
Equation 2 implies a linear relation between log a and log te. Figure 3 shows this
relationship for one of the replicate tests used to establish the MMC's. The shift factors for
the data on figure 3 were found from the curves on figure 2 and are representative of all
the IM7/K3B MMC data.
To facilitate the collapse of the shifted data for the MMC, vertical (compliance) shifts
were also utilized. This use of small vertical shifts in reduction of PMC creep
compliance/aging data was also reported by Sullivan [6] and Hastie and Morris [5]. The
vertical shifts for all data sets were small in comparison to the magnitude of the
corresponding horizontal (time) shifts. No clear trends existed in these vertical shifts and
analysis of vertical shift factors versus aging time did not lend itself to developing a
constant vertical shift rate. Figure 4 illustrates how a typical data set is collapsed through
the use of horizontal and verticalshifts.
Composite Physical Aging
The analytical model used to make long term creep compliance predictions for PMC's
required a time dependent form of laminated plate theory. As given in Jones [11], for a
single lamina under plane stress conditions, the compliance matrix referenced to the
material coordinate axis is,

[&, &2 ][s]= °o (4)
where subscripts 1,2 are the material coordinates referenced to the directions along and
transverse to the fiber respectively and the subscript 66 refers to shear.
As demonstrated by previous investigations, the only time dependent compliance
terms in equation 4 that play a role in creep are the transverse ($22) and shear ($66).
Therefore, using equation 1 and 2, the two time dependent terms are given as
$22(t) = f (S°=,fl=2, r==(t,,_f ), l.ta ;t)
$66(t ) = f (S°,fl_, r_ (t,= I),/.t_; t)
(5)
(6)
where the numerical subscripts reference properties in the material coordinate system and
S°, [3, _, and p are defined in equation 1 and 2. The term t,,efis the reference aging time.
Long Term Compliance
For test periods that exceed the time required to collect the short term (momentary)
data, the response can be expected to be influenced by the ongoing aging process. Struik
[3] proposed an effective time that could be used to replace time such that the compliance
in equation 1 would be written as
S(t) = S°e (an(';))_where _. is the effective time and is calculated according to
(7)
2= t,°ln(_ + 1) for /.t = 1
o (8)
2- 1--/at"[(l+.)>U_l],. for la:l: 1
where t_' is the aging time prior to loading and at some time later the total aging time is
t + t ° where t is the creep test time. Brinson and Gates [8] demonstrated that the effective
time theory is self-consistent and shill rates exceeding unity are both physically and
mathematically permissible. Use of the effective time expressions in the laminated plate
model allowed for the prediction of long term creep compliance. Input to the model was
the material parameters measured from short term tests.
Time/Temperature Superposition
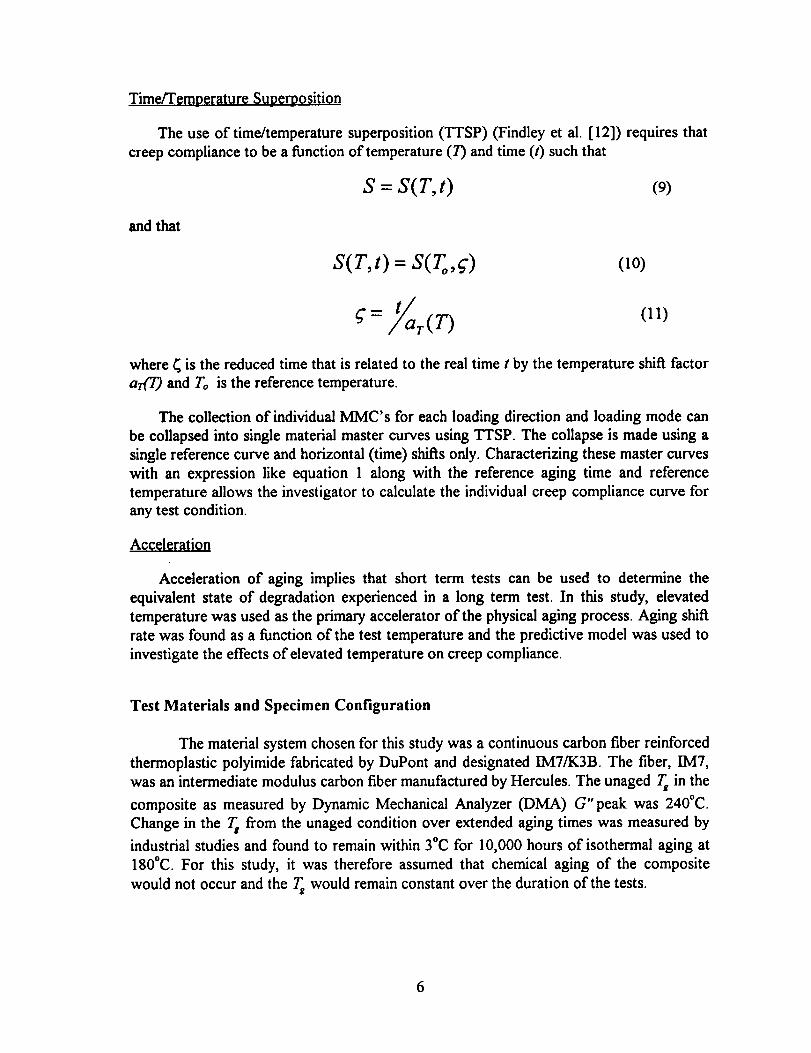
The use of time/temperature superposition (TTSP) (Findley et al. [12]) requires that
creep compliance to be a function of temperature (7) and time (t) such that
S=S(T,t) (9)
and that
S(T,t)= S(To,ff) (lO)
where _ is the reduced time that is related to the real time t by the temperature shiR factor
at(T) and To is the reference temperature.
The collection of individual MMC's for each loading direction and loading mode can
be collapsed into single material master curves using TTSP. The collapse is made using a
single reference curve and horizontal (time) shifts only. Characterizing these master curves
with an expression like equation 1 along with the reference aging time and reference
temperature allows the investigator to calculate the individual creep compliance curve for
any test condition.
Acceleration
Acceleration of aging implies that short term tests can be used to determine the
equivalent state of degradation experienced in a long term test. In this study, elevated
temperature was used as the primary accelerator of the physical aging process. Aging shift
rate was found as a function of the test temperature and the predictive model was used to
investigate the effects of elevated temperature on creep compliance.
Test Materials and Specimen Configuration
The material system chosen for this study was a continuous carbon fiber reinforced
thermoplastic polyimide fabricated by DuPont and designated IM7/K3B. The fiber, IM7,
was an intermediate modulus carbon fiber manufactured by Hercules. The unaged T_ in the
composite as measured by Dynamic Mechanical Analyzer (DMA) G" peak was 240°C.
Change in the T_ from the unaged condition over extended aging times was measured by
industrial studies and found to remain within 3°C for 10,000 hours of isothermal aging at
180°C. For this study, it was therefore assumed that chemical aging of the composite
would not occur and the T_ would remain constant over the duration of the tests.
6
Rectangular test specimens similar to those described in ASTM Specification
D3039-76 measuring 24.1 cm. by 2.54 cm. for tension specimens, and 20.32 cm. by 2.54
cm. for compression specimens, were cut from laminated panels. All specimens consisted
of 12 or 8 plys where each ply measured approximately 0.0135 cm. thick. To reduce
experimental errors at least three replicates were tested at each test temperature. Although
all the specimens came from the same material lot, many of the replicate specimens were
cut from different panels. Prior to testing, all specimens were dried for at least 24 hours at
110°C in a convection oven.
The in-plane transverse (S::) and in-plane shear ($66) creep compliance data came
from unidirectional 12-ply [90]_2 and angle-ply 8-ply [+ 45]_. specimens, respectively.
The use of a [ :1:45 ]2, for shear characterization requires that the shear be induced in the
laminate through uniaxial loading. To account for any measured differences due to the
applied loading direction, shear behavior was measured from 'tension induced shear" and
"compression induced shear."
Test Equipment
Testing was performed to understand the material behavior, develop material
constants for the analytical model, and provide verification of the predictive model. This
section will highlight some of the important test equipment and procedures. Specific
procedures and techniques relating to the tensile and compressive testing may also be
found in Gates and Feldman [9] and Veazie and Gates [10].
Review papers on static compression testing in composite materials by Berg and
Adams [13] and Schoeppner and Sierakowski [14] revealed that many features of
compression test apparatus and procedures can affect the ultimate compressive strength of
PMC's. However, very little work has been presented in the literature on compressive
creep of PMC's. References found in the literature showed most creep tests were
performed using relatively thick test specimens. Among these, Tuttle and Graesser [15]
used short (152ram) specimens with a center hole loaded in a high capacity load frame. In
another investigation, Irion and Adams [16] used variations of the standard fixtures
developed for static compression tests to study compressive creep at room temperature. In
a study of physical aging of polyetheretherketone at elevated temperatures, Nguyen and
Ogale [ 17] also performed compressive creep tests.
The current study used the long, thin specimens described previously. A uniaxial
constant load was applied through a dead-weight cantilever arm system. These tests were
performed in convection ovens equipped with digital controllers. For the tensile tests,
mechanical wedge grips held the specimen during the loaded or creep segments. High
temperature tabs were attached to the specimen ends to prevent slipping. For compression
testing, a unique apparatus (Veazie and Gates [10]) was constructed to allow a tensile
creep test frame to be used for application of a compressive load. The compressive creep
apparatus consisted of two rigid frames connected by steel rods running through linear
7

bearings.To ensure stable compression, the specimen was supported from column
buckling by lightweight knife edge guides. Column buckling was checked during loading
by longitudinally aligned back-to-back strain gages, that would show a lack of parity in
strain if simple bending occurred.
During the unloaded or recovery segments in the tension tests, the lower grip was
released using a remote cable and pulley system. For recovery in the compression tests,
the two inner rigid fixtures of the rigid frames were separated from the specimen by
applying a slight force from the creep frame lever arm. These unloading mechanisms
provided for virtually unconstrained recovery while allowing the test chamber to remain
closed during the entire test sequence. (See Veazie and Gates [ 10] for details).
Strain in the specimen gage section was measured with high temperature foil strain
gages applied in the center of the specimen. Proper selection of the gage type and adhesive
gave coefficient of thermal expansion (CTE) match and stability at elevated temperatures.
Thermal apparent strain was corrected for by using the compensating gage technique
(Murry [18]). Laminate damage in the form of matrix cracks can alter the strain
measurements therefore after each test sequence the specimens were inspected with an
optical microscope for matrix cracks along their exposed edges. These inspections
revealed no apparent damage after the sequenced tests.
Experimental Procedures and Data Reduction
To explore the effects of physical aging on the creep properties, a well-
documented technique that measures the creep compliance as described in Struik [3] was
used for all tests. This procedure consisted of a sequence of creep and recovery tests
using a constant applied load while the specimen isothermally ages. The test temperatures
selected for the study were 200 °, 208 °, 215 °, 220 °, 225 °, and 230°C. These test
temperatures were selected to ensure that measurable aging occurred within the test
period.
Linearity
For all the creep tests, a single applied stress level was chosen for each layup and
subsequently used at all temperatures. To provide compatibility, the same stress levels
were used in the tension and compression tests. Determination of the stress level necessary
to stay within the linear viscoelastic range was made by checking that proportionality
condition and Boltzman's superposition (Findley et al. [12]) would be satisfied. Creep and
creep/recovery tests provided data for checking superposition. Proportionality checks
were performed by plotting isothermal, creep compliance versus test time for a specimen
that was repeatedly rejuvenated (described below), quenched and loaded at various stress
levels. The supposed transition from linear to nonlinear behavior would be evident by the
vertical separation of the compliance curves with increasing stress. These linearity checks
were made at the lowest and highest test temperatures thereby minimizing the effects of

appliedstress.Thisprocess also allowed a linear assumption to be used with assurance of
reasonable accuracy.
Short-term Tests
To provide for the test condition that all specimens start the test sequence in the
same unaged condition, a means of rejuvenating the specimen was required. Rejuvenation
was accomplished by a procedure based upon work by Struik [3] and others who showed
that physical aging is thermoreversible and the excursion above Tg prior to quenching
effectively rejuvenates the material. In the current tests, the gaged specimen was heated to
250°C (10°C above Te) for 30 minutes immediately before the start of any physical aging
test sequence. High-pressure air was used to quench the specimen from above Ts to the
aging temperature. Relaxation of thermal residual stresses during a tensile test after using
this type of quenching procedure was investigated by Allen et al. [19]using data from a
resin similar to K3B. Although thermal residual stresses may play a role when trying to
compare compressive and tensile static loading, Allen concluded that during creep the
effect of apparent aging due to residual stress was much weaker than the effect of physical
aging itsel£
The duration of each creep segment was 1/10th the duration of the prior total
aging time. The aging times (time after quench) selected for starting each creep segment
were 2, 4, 10, 24, 48, 72 and 96 hours. After each creep segment, the specimen was
unloaded and allowed to recover until the start of the next creep test. To account for any
remaining residual strain due to a lack of complete recovery, the strain measured in the
creep segment was corrected by subtracting the extrapolated recovery strain from the
prior creep curve as illustrated in figure 1.
The momentary (short-term) sequenced creep/aging curves were collapsed into
MMC's through a horizontal (time) shift using the longest aging time curve as the
reference curve. In some cases, small (as compared to the horizontal shifts) vertical
(compliance) shifts were also used in reduction of the IM7/K3B data.
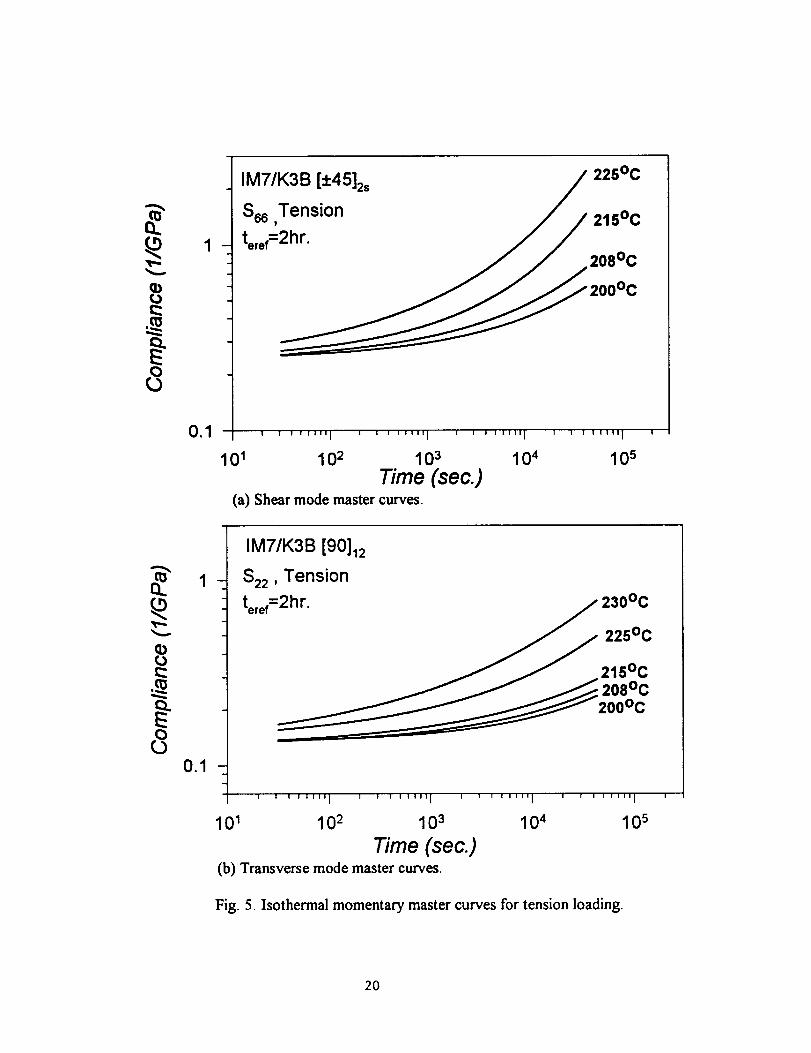
An individual MMC was found for both transverse and shear modes at each individual
test temperature. These MMC's are given in figure 5 for tension and figure 6 for
compression loading. All of these curves represent the best fit to collapsed data from all
replicates used in the test program. The three curve fit parameters used to characterize
each of the MMC's are given in table 1. The parameters from this fit were termed the
momentary master curve parameters for a given temperature.
Material Parameters
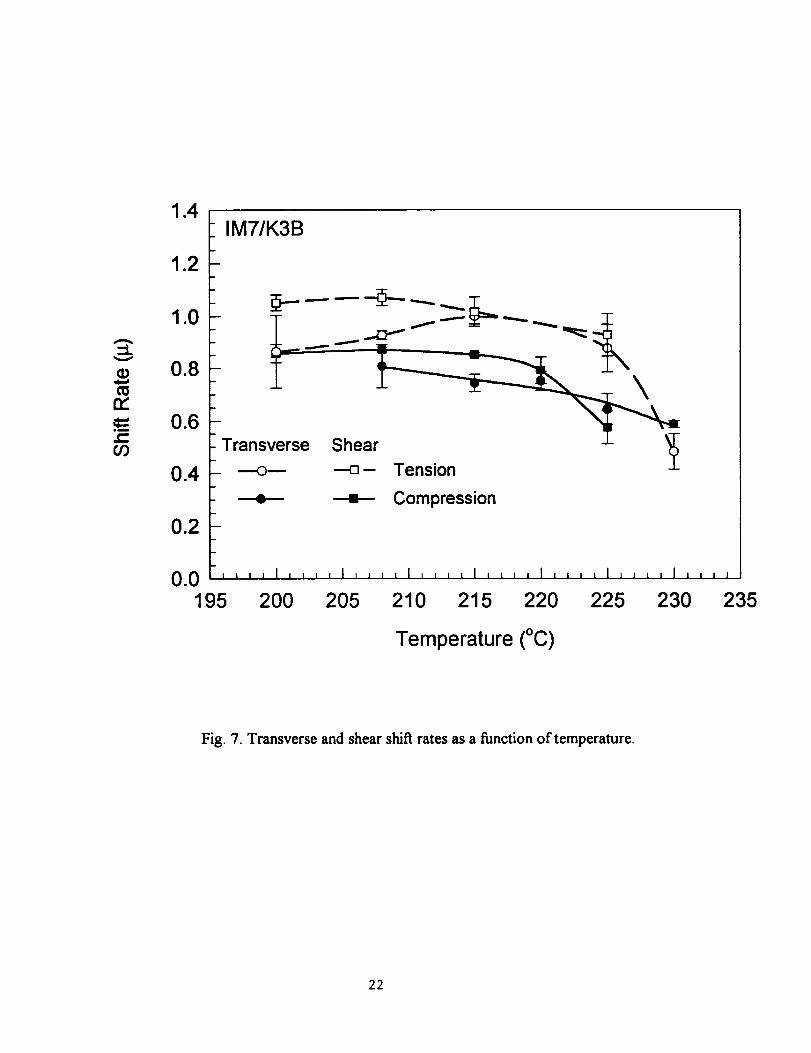
Aging shift rates (B) were calculated for all cases using the sets of master curves.
These calculated values are given in table 1 and plotted against test temperature in figure
7. The error bars on figure 7 represent the high-low scatter in the replicate testing. Each
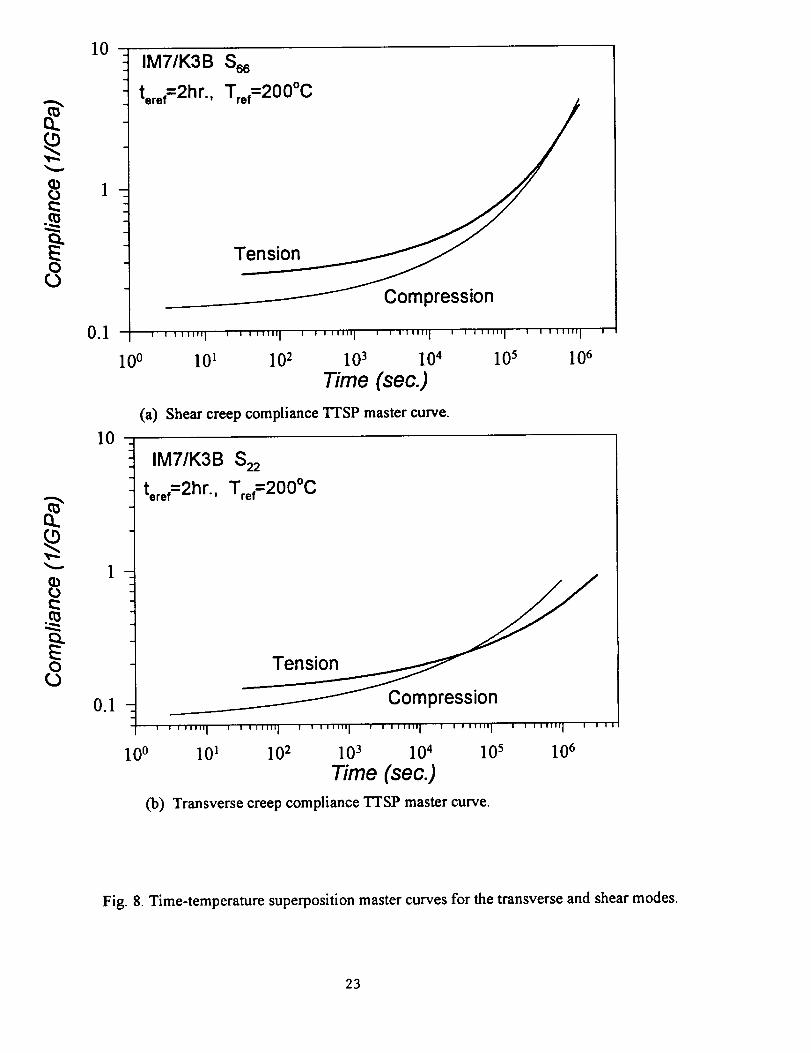
set of master curves can be further reduced using the time/temperature superposition

principle (TTSP). Curves of creep compliance versus time resulting from the TTSP
operation are given in figure 8.
Results and Discussion
Master Curves
The momentary master curves that resulted from time/aging-time superposition
demonstrated that IM7/K3B varied with temperature as expected but somewhat
differently than expected with regards to loading directions and modes. Creep compliance
in both the tension and compression case was a strong function of test temperature with an
increase in temperature resulting in an increase in compliance and associated creep rate.For all cases, TTSP provided a means for collapsing the sets of momentary master curves
into single material master curves. These curves, shown in figure 8, reveal that not only dodifferences exist between the transverse and shear modes but differences between tension
and compression loading exists as well. The repeatability of the testing and the consistencyof the data indicates that although these differences may be slight, they do reflect realmaterial behavior.
Aging Shift Rate
Based upon the known effects of physical aging in amorphous polymers, it wasexpected that aging shif_ rate would be a function of test temperature. This function wouldshow a decrease in shift rate as the temperature approached T s. Figure 7 in general
reflects these expected trends. The study by Nguyen and Ogale [20] showed that
polyetheretherketone exhibited a shift rate that was a function of loading mode. However,it was not known prior to testing how the differences due to loading direction and mode
would be reflected in the IM7/K3B composite data. The differences in the four sets of datain figure 7 and the sensitivity of the long term predictions to aging shift rate imply that to
obtain the highest degree of accuracy in the predictions one must account for loadingmode and loading direction.
Note that in all except the 225°C case, _t_ is less than g66. In linear sheardeformations there is no global volume change, whereas in tension there is typically asmall increase in volume on deformation. Since an increase in volume would provide
enhanced molecular mobility, one could correlate the smaller aging rate in the transverse
tests to this volumetric difference of the type of loading in the two tests. By the samelogic, since compression loading causes a small decrease in volume, one might expect that
in compression loading 1a22 would be greater than in the equivalent tension case (torepresent accelerated aging due to decreased mobility). However, the results are the
opposite of this scenario: in fact, _t22 in compression is even less than that in tension.
Consequently, it appears that the volume changes provided by the loading mode and
direction do not noticeably affect the aging of the material. The differences in the shift ratefor different loading modes and directions must be due to some other mechanism, not dueto the volumetric changes induced by loading. This postulate is supported by data of
10
Santore et al. [21] which show that for nonlinear torsional deformations, the volume
increase due to the application of the load is recovered quickly upon release of the load
and does not affect the baseline volumetric densification of the material due to aging,
which occurs over a much larger time scale. The effect of the volumetric changes due to
loading in long term test, where loading is sustained, is unknown.
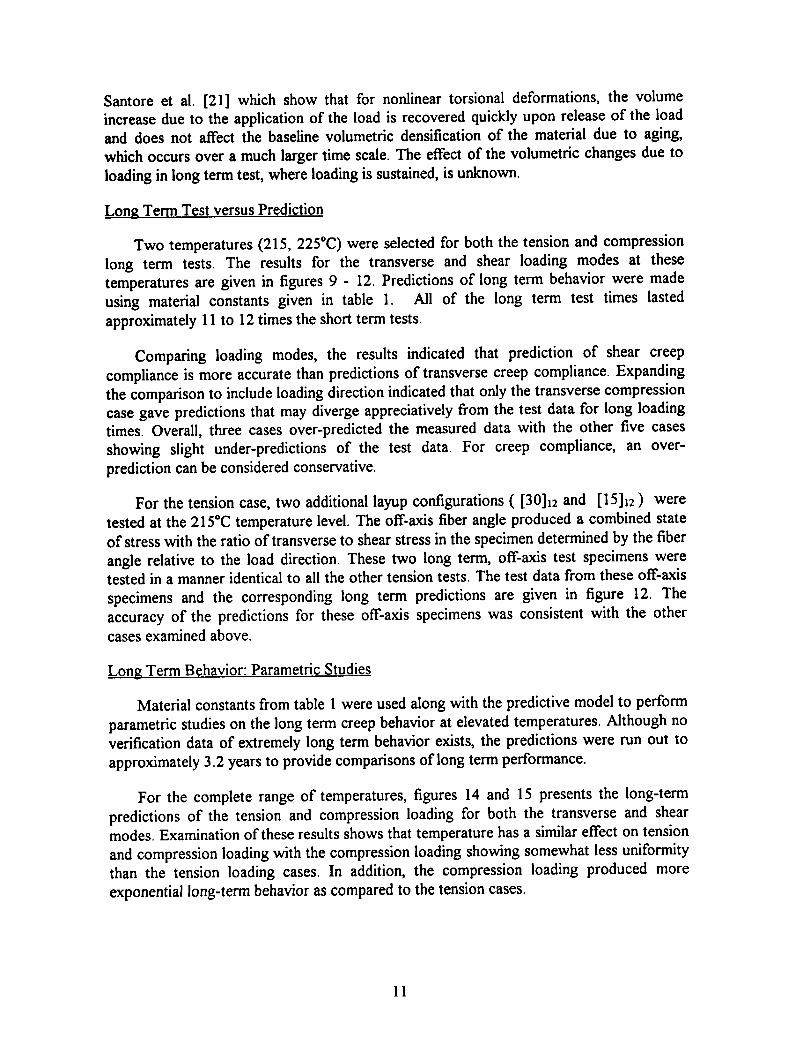
Long Term Test versus Prediction
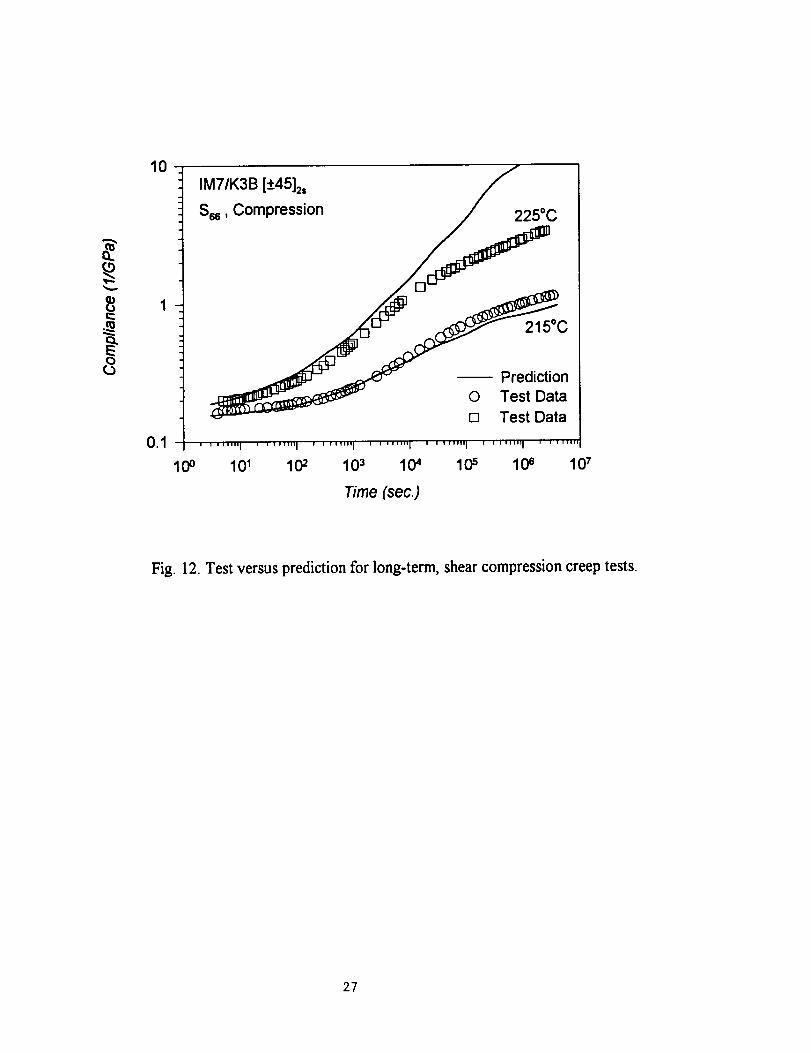
Two temperatures (215, 225°C) were selected for both the tension and compression
long term tests. The results for the transverse and shear loading modes at these
temperatures are given in figures 9 - 12. Predictions of long term behavior were made
using material constants given in table 1. All of the long term test times lasted
approximately 11 to 12 times the short term tests.
Comparing loading modes, the results indicated that prediction of shear creep
compliance is more accurate than predictions of transverse creep compliance. Expanding
the comparison to include loading direction indicated that only the transverse compression
case gave predictions that may diverge appreciatively from the test data for long loading
times. Overall, three cases over-predicted the measured data with the other five cases
showing slight under-predictions of the test data. For creep compliance, an over-
prediction can be considered conservative.
For the tension case, two additional layup configurations ( [30112 and [15112 ) were
tested at the 215°C temperature level. The off-axis fiber angle produced a combined state
of stress with the ratio of transverse to shear stress in the specimen determined by the fiber
angle relative to the load direction. These two long term, off-axis test specimens weretested in a manner identical to all the other tension tests. The test data from these off-axis
specimens and the corresponding long term predictions are given in figure 12. The
accuracy of the predictions for these off-axis specimens was consistent with the other
cases examined above.
Long Term Behavior: Parametric Studies
Material constants from table 1 were used along with the predictive model to perform
parametric studies on the long term creep behavior at elevated temperatures. Although no
verification data of extremely long term behavior exists, the predictions were run out to
approximately 3.2 years to provide comparisons of long term performance.
For the complete range of temperatures, figures 14 and 15 presents the long-term
predictions of the tension and compression loading for both the transverse and shearmodes. Examination of these results shows that temperature has a similar effect on tension
and compression loading with the compression loading showing somewhat less uniformity
than the tension loading cases. In addition, the compression loading produced more
exponential long-term behavior as compared to the tension cases.
11

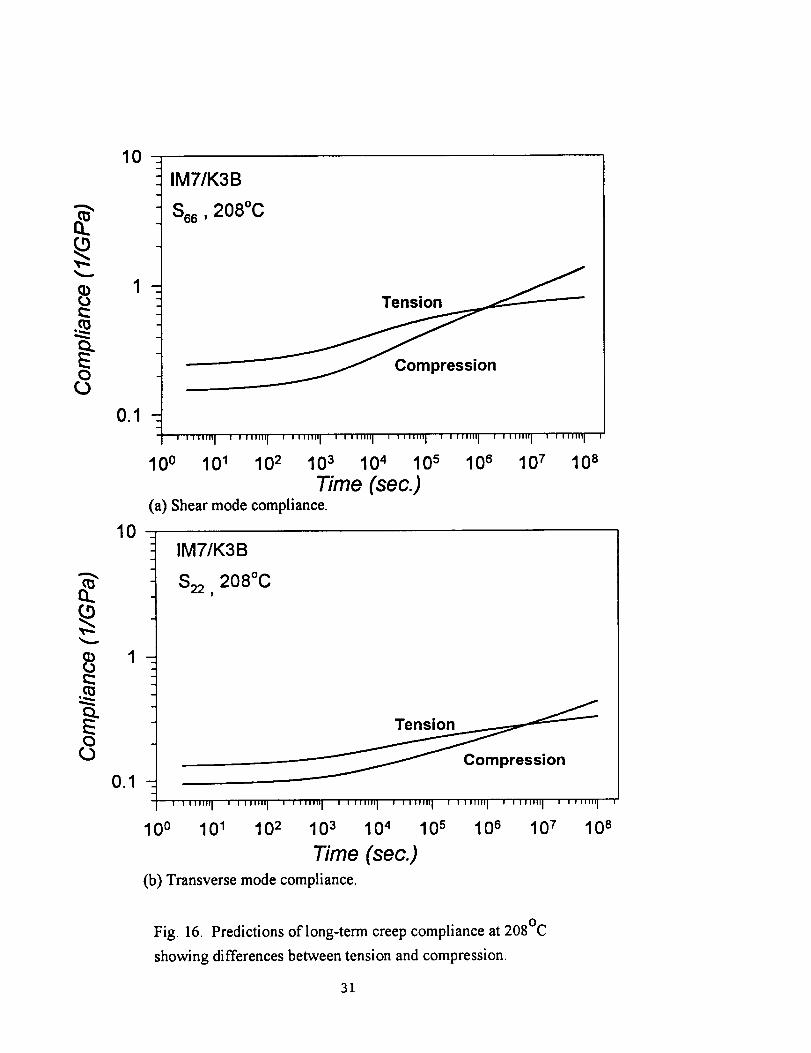
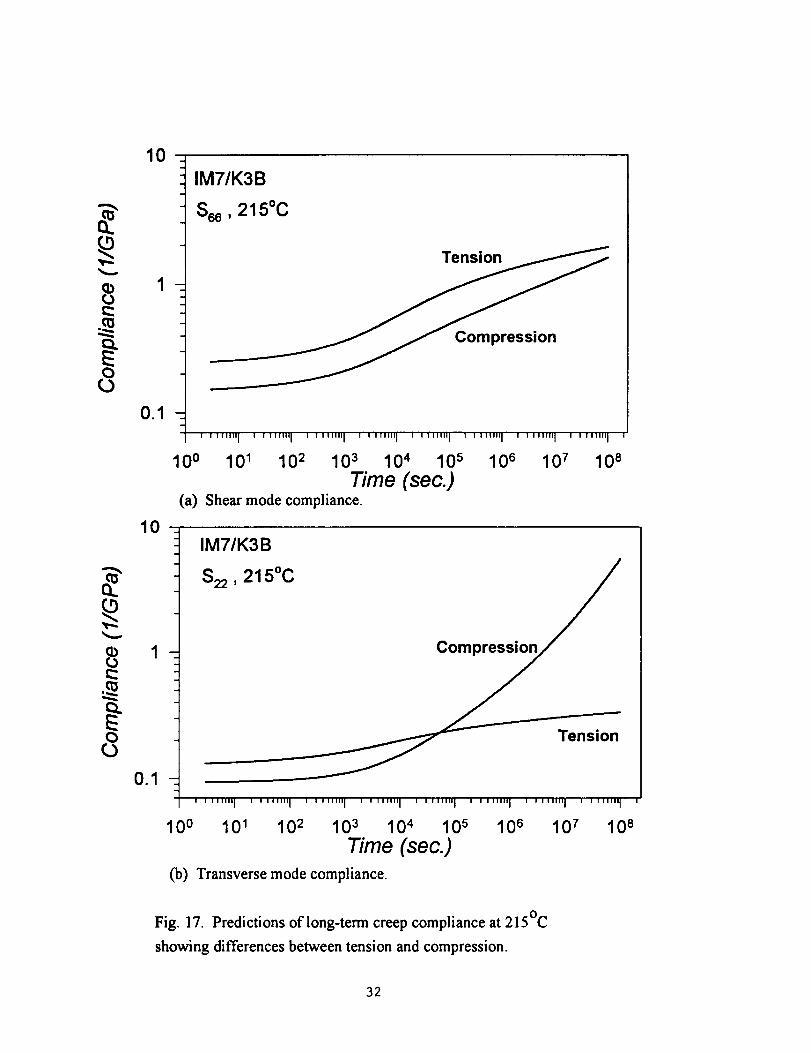
Figures 16 -18 present a direct comparison between long-term creep compliance for
both loading directions and modes at 208 °, 215 °, and 225°C respectively. Examination of
these figures reveals that initially the creep curves for the compression loaded cases were
shifted lower on the compliance axis than the corresponding tension loaded cases.
However, examination of the long-term predictions reveals that the compression loaded
cases ended up with greater compliance compared to tension for longer times. These
figures also illustrate how increased temperature will significantly alter the long term creep
compliance.
Concluding Remarks
Experiments were performed to determine the effects of physical aging on creep
compliance of IM7/K3B composite laminates loaded in tension or compression.
Experimental results and established analytical methods were used to investigate the
similarities and differences of tension and compression for both the shear and transverse
loading modes.
The short term (96 hour) tests, run over a range of sub-T s temperatures provided
material constants, material master curves and aging related parameters. The test data was
consistent and repeatable over the entire range of test temperatures. Comparing results
from the short term behavior indicated that although trends in the data with respect to
aging time and aging temperature are similar, differences exist due to load direction and
mode. Temperature has a similar effect on tension and compression loading with the
compression loading producing more exponential long term behavior as compared to the
tension cases.
The long term (1500+ hour) predictions compared favorably to the long term test
data with the model demonstrating more accuracy in the shear mode as compared to the
transverse mode. The sensitivity of the long term predictions to aging shit_ rate imply that
the predictive model must account for both loading mode and loading direction. This
implication would also hold true when considering development of accelerated test
methods based upon the changes in physical aging due to temperature.
References
[1] Bank, L. C., Gentry, T. g. and Barkatt, A., "Accelerated Test Methods to Determine
the Long-Term Behavior of FRP Composite Structures: Environmental Effects," Journal
of Reinforced Plastics and Composites, Vol. 14, June, 1995, pp. 559-587.
[2] Scott, D. W., Lai, J. S. and Zureick, A.-H., "Creep Behavior of Fiber Reinforced
Polymeric Composites: A Review of the Technical Literature," Journal of Reinforced
Plastics andComposites, Vol. 14, 1995, June, pp. 588-617.
[3] Struik, U C. E., Physical Aging m Amorphous Polymers and Other Materials,
Elsevier Scientific Publishing Company, New York, 1978.
12

[4] McKerma, G. B., Leterrier, Y. and Schultheisz, C. R., "The Evolution of Material
Properties During Physical Aging," Use of Plastics and Plastic Composites: Materials
and Mechanics Issues, MD -46, Y. K. Stokes Eds., The American Society of Mechanical
Engineers, 1993,
[5] Hastie, R. L. and Morris, D. H., "The Effect of Physical Aging on the Creep Response
of a Thermoplastic Composite," High Temperature and Environmental Effects in Polymer
Matrix Composites, ASTM STP 1174, C. Harris and T. Gates Eds., American Society for
Testing and Materials, Philadelphia 1992, pp. 163-185.
[6] Sullivan, J. L., "Creep and Physical Aging of Composites," Composites Science and
Technology, Vol. 39, 1990, pp. 207-232.
[7] Wang, J. Z., Parvatareddy, H., Chang, T., Iyengar, N., Dillard, D. A. and Reifsnider,
K. L., "Physical Aging Behavior &High-Performance Composites," Composites Science
and Technology, Vol. 54, 1995, pp. 405-415.
[8] Brinson, L. C. and Gates, T. S., "Effects of Physical Aging on Long Term Creep of
Polymers and Polymer Matrix Composites," International Journal of Solids and
Structures, Vol. 32, 6/7, 1995, pp. 827-846.
[9] Gates, T. S. and Feldman, M., "The Effects of Physical Aging at Elevated
Temperatues on the Viscoelastic Creep of IM7/K3B," NASA TM-109114, June, 1994.
[10] Veazie, D. R. and Gates, T. S., "Physical Aging Effects on the Compressive Linear
Viscoelastic Creep of IM7/K3B Composite," NASA, TM - 110224, December, 1995.
[11] Jones, R. M., Mechanics of Composite Materials, Scripta Book Company,
Washington, D.C., 1975.
[12] Findley, W. N., Lai, J. S. and Onaran, K., Creep and Relaxation of NonlinearViscoelastic Materials, North-Holland Publishing Company, Toronto, 1976.
[13] Berg, J. S. and Adams, D. F., "An Evaluation of Composite Material Compression
Test Methods," Journal of Composites Technology & Research, Vol. 11, No. 2, 1989, pp.
41-46.
[14] Schoeppner, G. A. and Sierakowski, R. L., "A Review of Compression Test Methods
for Organic Matrix Composites," Journal of Composites Technology & Research, Vol.
12, No. 1, 1990, pp. 3-12.
[15] Tuttle, M. E. and Graesser, D. L., "Compression Creep of Graphite/Epoxy Laminates
Monitored Using Moire Interferometry," Optics and Lasers in Engineering, Vol. 90,
1990, pp. 151-171.
[16] Irion, M. N. and Adams, D. F., "Compression Creep Testing of Unidirectional
Composite Materials," Composites, 1981, pp. 117-123.
13

[17] Nguyen, D. H. and Ogale, A. A., "Physical Aging of Polyetheretherketone:
Characterized by Creep Tests in Compressive and Flexural Modes," Journal of
Thermoplastic Composite Materials, Vol. 4, January, 1991, pp. 72-82.
[ 18] Murry, W. M., and Miller, W. g., The Bonded Electrical Resistance Strain Gage,
Oxford University Press, New York, 1992.
[19] Allen, D. H., Zocher, M. A. and Groves, S. E., "Apparent Physical Aging of
Polymeric Composites," ASME Winter Annual Meeting, November, 1995,
[20] Nguyen, D. H. and Ogale, A. A., "Compressive and Flexural Creep Behavior of
Carbon Fiber/PEEK Composites," Journal of Thermoplastic Composite Materials, Vol. 4,
January, 1991, pp. 83-99.
[21] Santore, M. M., Duran, R. S. and McKenna, G. B., "Volume Recovery in Epoxy
Glasses Subjected to Torsional Deformations: the question of rejuvenation," Polymer,
Vol. 32(13), 1991, pp. 2377-2381.
14

Table 1. Momentary master curve parameters for both thetransverse and shear creep compliance.
Compliance
Term_
Tension
$22
$22
S_
$22
$22
See
8e6
S_
See
Compression
S_
$22
$22
$22
822
S_
Se6
See
$66
$66
T(°C)
20O
2O8
215
225
230
200
208
215
225
208
215
220
225
230
208
215
220
225
225
So _ P(1/GPa) (sec.)
0.133 1.56E+5 0.423 0.864
0.130 1.23E+5 0.366 0.927
0.127 7.69E+4 0.315 0.999
0.134 1.76E+4 0.297 0.876
0.118 2.83E+3 0.231 0.482
0.238 5.56E+4 0.383 1.051
0.236 2.89E+4 0.362 1.070
0.239 9.19E+3 0.382 1.017
0.227 2.40E+3 0.301 0.928
0.139
0.016
0.030
0.O92
0.068
0.030
0.030
0.056
0.082
0.0937 7.76E+4 0.468 0.808 0.0827
0.0933 2.43E+4 0.559 0.742 0.0327
0.0914 1.53E+4 0.470 0.751 0.0370
0.0923 3378.87 0.316 0.644 0.0579
0.0589 43.617 0.155 0.587 0.0155
0.1521 2.21E+4 0.433 0.871 0.0089
0.1452 1.39E+4 0.368 0.853 0.0071
0.0510
0.0603
0.0603
0.1402 4595.7 0.356 0.791
0.1297 485.60 0.252 0.574
0.1297 485.60 0.252 0.574
15

Stress
or Strain
Max.--
Stress
Elapsed Aging Time>
Recoverv _1., Creeo" "I x - "1
\ S**ain/ i
_J exlTaPoIked recovery
o o _! -
Time
Fig. 1. Sequenced creep compliance test procedures.
16

0.3
0.25
0.2
_.0.15
8
0.1
IM7/K3B [90112
$22 @ 225°C
Aging Time = 2hr 10hr4hr
72hr 96hr48hr
24hr
' ' ' ''"'I I _ t tl_tt I t I I tittr[ t _ I rtr_ I I t _ llitl
10° 101 102 103 104 10s
Time (sec.)
Fig. 2. Typical transverse compression creep compliance momentary curves.
17

1.5
1.0
¢=
0.5
0.0
IM7/K3B [90112
S22 @ 225°C
_ Shift Rate (!_)
/ • Data Fit
,_ Linear
' ' _ ' I ' ' ' ' 1 ' ' ' ' I ' ' ' ' I ' '
0.0 0.5 1.0 1.5 2.0
log Aging Time (hr.)
! !
2.5
Fig. 3. Typical compression aging shift factor as a function of aging time.
18

0.3
0.25
0.2
__o_0.15
0.1
100
IM7/K3B [90112
S_ @ 225°C
101 102 10z 104
Time (sec.)
I I I III
10 s
Fig. 4. Typical momentary compression creep compliance during aging.
19
't'.,-
0.1
IM7/K3B [+4512 s
$66 Tension!
teref=2hr.
' _ ' '''"1 _ ' ' '''"1 ' ' ' '''"1
101 102 103 104Time (sec.)
(a) Shear mode master curves.
225Oc
215°C
208°C
I I , I IIII I
10 5
0.1
IM7/K3B [90112
S22 , Tension
teref=2hr. 230°C
225°C
215°C208°C
200Oc
' ' ...... I ' ' ' '''"I
101 102 103
Time (sec.)(b) Transverse mode master curves.
' ' ' '''"1 ........ I
104 105
Fig. 5. Isothermal momentary master curves for tension loading.
20

a
0.1
IM7/K3 B [+4512s //22s°c/
S_, Compression / /220Oc
teref=2hr" / /
/ / 215°C
/ / 208oc200°C
I' i I I Illit i ] I t Ill=l I f t I Illll I =
10 ° 101 102 103
Time (sec.)(a) Shear mode master curves
I l ! lltll i
10 s
Ea
0.1
IM7/K3B [90112
S22 , Compression
teref=2hr.
230°C
225°C
220°C
215°C
208°C
m=
1 1 I IIIII I I I .... II I I I I I IIII I I I I IIIll i I I I I Ilfl I I
10 ° 101 102 103 104 10 s
Time (sec.)
(b) Transverse mode master curves
Fig. 6. Isothermal momentary master curves for the compression loading.
21
1.4
:=LV
n,'
=i
t--_9
1.2
1.0
0.8
0.6
0.4
0.2
0.0195
IM7/K3B
\
Transverse Shear--o-- .--o- Tension
•--e--- ---=-- Compression
, ,, J I,,,,I, , , iI, ,,, I i,,, I,,, , I,, ,, I,,, J
200 205 210 215 220 225 230 235
Temperature (°C)
Fig. 7. Transverse and shear shift rates as a function of temperature.
22
0_0
10
0.1
10
IM7/K3B
tere_2hr.,
S66
Tref=200°C
Tension
Compression
100
..... Ill I , I I''''' I ' ' '''l'_ I ' ' '_'l'' I ' ' Illl'' I
l01 102 103 104 105
Time (sec.)
! I ! I IIII I
(a) Shear creep compliance TTSP master curve.
!
106
O
0.1i
IM7/K3B S22
teref--'2hr., Tref=200°C
Tension
Compression
' ' ''""1 ' '" .... I ' ' ''""1 ' ' ''""1 ' ' '_'"'1
100 101 102 10 3 104 105
Time (sec.)
Co) Transverse creep compliance TTSP master curve.
! I I I !Ill I
106
Fig. 8. Time-temperature superposition master curves for the transverse and shear modes.
23

10
8
0.1
IM7/K3B [90112 _ Prediction0 Test Data
S=2, Tension [] Test Data
'"'I ........ I .... '"'I ........ I ........ I ........ I ........ I
101 10 2 10 3 10 4 10 s 10 e 10 7
Time (sec.)
Fig. 9. Test versus prediction for long-term, transverse tension creep tests.
24

10
0.1
IM71K3B [+45]=,
S=, Tension 225°C
-- Prediction
O Test Data
[] Test Data
'"'1 ' ' .... "1 ' ' ''""1 .... '"'1 ' ' '''"'1 ' '''""1 ' '''""1
101 102 103 104 10 s 106 107
Time (sec.)
Fig. 10. Test versus prediction for long-term, shear, tension creep tests.
25

10
0.1
,.7,K3.[9o]1. o ;re_i;"_a"I
Szz, Compression 13 Test Data C I
........ I ........ I ' ....... I ........ I ........ I ........ I ' ' ' .... '1
10 o 101 102 103 104 10O 108 107
Time (sec.)
Fig. 1 l. Test versus prediction for long-term, transverse compression creep tests.
26
0
10
0.1
IM71K3B [+45]2, f
Sr_, Compression __:_25OCr_]y
eeress!' ' ' ''""1 ' '' ..... I ' ' ' ..... I ' ' ...... I ' ....... I .... '"'1 ' ' ''"'
10o 101 102 10 3 10 4 10 s 10e 10;'
Time (sec.)
Fig. 12. Test versus prediction for long-term, shear compression creep tests.
27

E8
0.1
0.01
IM71K3B
Tension @ 215°C
Prediction
''"1 ' ' '' .... I ' ' '''"'1 ' ' ''''"1 ' ' ''''"1 ' ' ''''"1 ' ' ''''"1
101 102 103 104 10s 10s 107
Time (sec.)
Fig. 13. Test versus prediction for long-term, off-axis tension creep tests.
28

10
Q.E0¢0
0.1
10
t:::
80.1
IM7/K3B 225o0
S66 TensionI
215°C
Fig. 14. Predicted long-term shear creep compliance for tension and compression.
29

10
0.1
10
0.1
IM7/K3B
Sz_ Tension!
' '"""1 ' '"'"'1 ' '"'"'1 ' II'""l ' ''''"'1 ' ''''"'1 ° '''1'"1 ' ''""'1
10 ° 101 10 2 10 3 10 4 10 s 10 6 10 7 10 8Time (sec.)
(a) Transverse mode, tension loading.
215Oc
' '"'"'1 ........ I ........ I ........ I ........ I ' "l'"'l ........ I ........ I '
10 ° 101 10 2 10 3 10 4 10 5 10 6 10 7 10 a
Time (sec.)(b) Transverse mode, compression loading.
Fig. 15. Predicted transverse creep compliance for both tension and compression.
30
10
EO
¢O
0.1
10
IM7/K3B
$66,208°C
_Compression
' '1'1'"1 ........ I i ,,,i,,, I ' '"'"1 i ....... I ' I'"'"l ' '_'IB"I ........ I
10 ° 101 102 103 104 105 106 107 108
Time (sec.)(a) Shear mode compliance.
¢bto
EO¢O
0.1
IM7/K3B
S22 ' 208°C
i ill,,,, I i ii°,,,J 1 ........ I ' ''l""l ' '''ll'JI ' ' ...... I , ii,.. I i ....... I
10 ° 101 10 2 103 104 105 106 10 T 108
Time (sec.)(b) Transverse mode compliance.
Fig. 16. Predictions of long-term creep compliance at 208°C
showing differences between tension and compression.
31
10
O¢O
0.1
10
IM7/K3B
$66,215°C
Compression
' ''"'"I ' ''"'"I ' ''"'"i i ''""'I ' ''"'"I i llJ,,,, I ' ''"'"I ' ''"'"I
10° 101 102 103 104 10s 106 10z 108Time (sec.)
(a) Shear mode compliance.
O_O
0.1
IM7/K3B
$22,215°C
Compression
...... "1 ........ I ........ I ''"'"'1 ''"'"'1 ........ I
10° 101 102 103 104 10s 106Time (sec.)
(b) Transverse mode compliance.
Tension
! ! IIIIII I ! I rlilll I
107 108
Fig. 17. Predictions of long-term creep compliance at 215°C
showing differences between tension and compression.
32

EO
10
0.1
10
IM7/K3B
$66,225°CCompression
.... ""1 _ '"l'"l ''f ..... I i ,,I,I. I ,i, ..... I .... '"1
10 ° 101 102 103 104 105Time (sec.)
(a) Shear mode compliance.
Tension
_I_HH I I _ _H_ i
106 107 108
O
0.1
IM7/K3B
S22,225°C
Compression
Tension
, ,i,,,. I i v, ..... I ' 'lll"'l ' I"1'"1 .... '"1 ' ''"'"1
10° 101 10 2 103 104 105 106
Time (sec.)(b) Transverse mode compliance.
' '"'"'1 ' '"'"'1
10 7 10 8
Fig. 18. Predictions of long-term creep compliance at 225°C
showing differences between tension and compression.
33

REPORT DOCUMENTATION PAGE Form ApprovedOMB No. 0704-0188
1. AGENCY USE ONLY (Leave bk_Mk) 2. REPORT DATE 3. REPORT TYPE AND DATES COVERED
August 1996 Technical Memorandum4. 1TRUEANOsUe_TrLE
A Comparison of Tension and Compression Creep in a PolymericComposite and the Effects of Physical Aging on Creep Behavior
s. AUTHOR(S)
Thomas S. Gates, David R Veazie, and L. Catherine Brinson
7. PERFORMINGORGANIZATIONNAME(S)ANDADORESS(ES)
NASA Langley Research CenterHampton, VA 23681-0001
9. SPONSORING I MONITORING AGENCY NAME(S) AND ADORESS(ES)
National Aeronautics and Space AdministrationWashington, DC 20546-0001
5. FUNDING NUMBERS
WU 505-63-50-18
8. PERFORMING ORGANIZATIONREPORT NUMBER
10. SPONSORING I MONITORINGAGENCY REPORT NUMBER
NASA TM-110273
11. SUPPLEMENTARY NOTES
Gates: Langley Research Center, Hampton, VA; Veazie: Clark Atlanta University,Atlanta, GA; Brinson:Northwestern University.
1Zt.DISTRIBUTION/ AVAILABILITYSTATEMENT
Unclassified- Unlimited
Subject Category - 24
12b. DISTRIBUTION COOE
13. ABSTRACT (Maximum 200 words)
Experimental and analytical methods were used to investigatethe similaritiesand differences of the effectsofphysical aging on creep compliance of IMT/K3B composite loaded in tension and compression. Two matrixdominated loading modes, shear and transverse, were investigated for two load cases, tension andcompression. The tests, run over a range of sub-glass transitiontemperatures, provided material constants,material master curvesand aging related parameters.
Comparing results from the short-termdata indicatedthat althoughtrends inthe data with respectto aging timeand aging temperature are similar, differences exist due to load directionand mode. The analytical model usedfor predicting long-term behavior using short-term data as inputworked equally as well for the tension orcompression loaded cases. Comparison of the loading modes indicated that the predictive model provided moreaccurate long term predictionsfor the shear mode as compared to the transverse mode. Parametric studiesshowed the usefulness of the predictive model as a tool for investigating long-term performance and complianceacceleration due to temperature.
'14. SUBJECT TERMS
Composites; Viscoelasticity; Physical aging; Elevated temperature; Compression;
Creep testing
17. SECURITY CLASSIFICATIONOF REPORT
Unclassified
18. SECURITY CLASSIFICATIONOF THIS PAGE
Unclassified
19. SECURITY CLASSIFICATIONOF ABSTRACT
NSN 7540-01-280.-5500
1S. NUMBER OF PAGES
34
16. PRICE COOE
A03
20. UMITATION OF ABSTRACT
Standard Form 298 (Roy. 2-89)Prescri_d by ANSI Slcl. Z:)9-18296-102