A Comparison of Online and Face-to-face Learning in ...economics.ca/2006/papers/0535.pdf · A...
23
Preliminary Do not quote A Comparison of Online and Face-to-face Learning in Undergraduate Finance and Economic Policy Courses JACQUES RAYNAULD MARIE-PIERRE-PELLETIER Institut d’économie appliquée 1 HEC Montréal 3000 Chemin de la Côte Sainte-Catherine Montréal, Québec H3T 2A7 [email protected] SUMMARY This paper addresses some of the questions about the effects of technology on student learning. Using data from students enrolled in a Canadian business school during the 2005 summer term, we compare the performance of online and face-to-face students in two different undergraduate courses: Economic Problems and Policy Analysis and Basic Corporate Finance. When controlling for a potential selection bias and other variables that may have an effect on students' performance, we find that online students perform better than face-to-face students in economics, while there is no such differences in finance. This is in sharp contrast with previous studies (Brown and Liedholm, 2002, Anstine, J. and Skidmore, 2005, and Coates, et. al., 2004) which showed that online students perform significantly worse than live students. As in other studies, we find that cumulative average has a positive effect on the results in both economics and finance, and that women have significantly lower results in economics than men. 1. INTRODUCTION Online courses and their impact on learning were the object of numerous studies over the years. Despite the fact that online programs are growing rapidly, not all researchers are convinced that students learn has much in these new formats compared to the traditional on campus alternative. A recent study by Brown and Liedholm (2002) show 1
Transcript of A Comparison of Online and Face-to-face Learning in ...economics.ca/2006/papers/0535.pdf · A...
Preliminary Do not quote
A Comparison of Online and Face-to-face Learning in Undergraduate Finance and Economic Policy Courses
JACQUES RAYNAULD MARIE-PIERRE-PELLETIER
Institut d’économie appliquée1
HEC Montréal
3000 Chemin de la Côte Sainte-Catherine Montréal, Québec H3T 2A7
SUMMARY
This paper addresses some of the questions about the effects of technology on student
learning. Using data from students enrolled in a Canadian business school during the
2005 summer term, we compare the performance of online and face-to-face students in
two different undergraduate courses: Economic Problems and Policy Analysis and Basic
Corporate Finance. When controlling for a potential selection bias and other variables
that may have an effect on students' performance, we find that online students perform
better than face-to-face students in economics, while there is no such differences in
finance. This is in sharp contrast with previous studies (Brown and Liedholm, 2002,
Anstine, J. and Skidmore, 2005, and Coates, et. al., 2004) which showed that online
students perform significantly worse than live students. As in other studies, we find that
cumulative average has a positive effect on the results in both economics and finance,
and that women have significantly lower results in economics than men.
1. INTRODUCTION
Online courses and their impact on learning were the object of numerous studies over
the years. Despite the fact that online programs are growing rapidly, not all researchers
are convinced that students learn has much in these new formats compared to the
traditional on campus alternative. A recent study by Brown and Liedholm (2002) show
1
that students enrolled in an online Principles of Economics course performed
significantly worse on the examinations than live students. This same negative result is
also confirmed by other recent studies.
In this study, we examine the results obtained by students enrolled in two undergraduate
courses offered during the 2005 summer term at HEC Montréal: Economic Problems
and Policy Analysis and Basic Corporate Finance. We formally compare the results
obtained by these students to those obtained by their colleagues exposed to the
traditional format. Special attention will be given to the course delivery format as one of
the two courses extended the studio approach first developed for Introductory Physics at
Rensselaer Polytechnic Institute (Wilson, 1994) and adapted to economics and finance
by Raynauld and Simonato (2005).
As in the previous studies, we control for potential selection bias and take into account a
set of observable characteristics (past grades, gender, number of credits, etc.). The
results indicate that online students scored better than the face-to-face students in the
economic policy course. No such difference was detected in finance (in fact the online
students did slightly worse).
This document is organized as follows: first, some key recent studies are quickly
reviewed. The institutional context of this study is then explained; special attention is
given to the various parameters of the experiment (class size, class configuration, role of
the instructor, assessment, exams, etc.). The third section of the paper gives a statistical
portrait of the students that are part of the sample. The fourth and fifth sections present
respectively the econometric models and the results. We then conclude by exploring
some further developments.
2. ONLINE VS LIVE COURSES
Although numerous comparisons have been made between online and live learning, no
broad consensus has yet been obtained; this was nicely summarized by Russel (2002)
in his extensive web site entitled “The No Significant Difference Phenomena” which
covers a large number of disciplines and empirical methodologies. Very few studies were
2

dedicated to learning in economic or finance courses. In one of the first studies on this
topic presented at the American Economic Association Meetings, Brown and Liedholm
(2002) “find that students in the virtual classes, while having better characteristics,
performed significantly worse on examinations than live students”. The results are
based on a OLS regression where the left-and-side variable is the percentage of correct
answers to the TUCE test while the explanatory variables include among others, gender,
race, ACT and GPA results, number of credits, etc.
To explain their results, Brown and Liedhlom mention the possibility that online students
had more responsibilities than their live colleagues, which points to a possible selection
bias. They also suggest that online students do not fully use all the learning resources
available to them. Finally, the authors find that women are less penalized than men by
the online formula.
Interestingly, the learning material used both by online and traditional students was
pretty much the same. The two groups were assigned the same textbook. The face-to-
face groups relied on lectures supplemented by animated Power Point slides, videos,
group demonstration, etc. The live students had access to streaming videos of the
instructor (the same who gave the lectures) that included synchronous viewing of the
textual material and an extensive collection of interactive collaborative material and
questions.
Coates, Humphreys, Kanes and Vachris (2004) study involved students enrolled in
Principles of Economics courses, both micro and macro. Their results which control for
possible selection bias indicate that “students in face-to-face sections scored better on
the TUCE test than students in online sections”. Simple OLS results did not detect any
statistically significative difference. According to the authors, the selection bias is
accounted by the fact that online students have jobs and other responsibilities that take
on the time available for their study. They also claim that online students do not
optimally use the learning material available.
They estimate an educational production function where learning is function of the
quantity and quality of the inputs used in the educational process. The explanatory
variables include various demographic, individual and skills indicators, results to an
3

economic pre-test, SAT and grade point average as well as dummies controlling for the
various instructors. The authors used as instruments a number of variables including the
students commuting time to the campus, a dummy to account for a friend who previously
took an online class, the use of Internet learning material in previous courses, the
number of hours worked, etc.
Anstine and Skidmore (2005) have analyzed the performance of MBA students enrolled
in statistics and managerial courses at University of Wisconsin at Whitewater. Both
courses were offered in an online and face-to-face format. Simple OLS results indicate
that the “outcomes of the online environment are inferior to the traditional format with
respect to the amount of material learned”. In the two environments, the students had
access to the same learning material and were graded in the same way. To substitute
for the lectures, online students had access to Power Point slides with audio overlay and
a discussion board. Moreover, the online and regular students had the same instructor
which alleviates any “instructor-specific” bias.
To control for any possible selection bias, the authors relied on two different methods.
Firstly, they implement a two stage least square analysis with the following instruments:
travel time to university, children at home and weekly hours at work. The results
obtained are quite similar to the OLS ones. Secondly, they also used a Switching
Regression Model which indicates that online students would have done as well as face-
to-face students if they had chosen the traditional format.
This very brief review clearly indicates that the online format is not as effective in terms
of learning outcomes and that a careful analysis should take into account any possible
selection bias that would naturally arise. Two of the three studies were based on the
TUCE, a widely used test. In two of the three experiments, students had access to video
or audio sequences of their instructors. These design characteristics will be compared
to those used in our study and that will be described in the following section.
3. INSTITUTION AND COURSES DESCRIPTION
Taking account the needs of several students who have to commute or are working on
atypical schedules, Economic Problems and Policy Analysis and Basic Corporate
4

Finance were offered during the 2005 summer term on an online format2. No class
attendance was required except for the final exam. These are two compulsory courses
in the Bachelor of Business Administration program (BBA) at HEC Montreal, the
Business School of the University of Montreal. They are usually taken during the second
year and require some prerequisite. The summer schedule is much more intensive as
face-to-face students must meet twice a week either from 9h to 12h for the day students
or 18h30 to 21h30 for the night students from early May to the end of June. All the
students were informed of this new online offering by email. The email also detailed all
the relevant parameters (assessment, learning material, etc.) and invited the interested
students to a live information session.
3.1 Economic Problems and Policy Analysis (EPP)
This EEP course is the last course of a three-course sequence and covers several topic
like general equilibrium, price mechanism, technological change, political market, price
controls, public services pricing, tax policies, external effects, public goods and
international trade. The course does not require any sophisticated mathematical tools
but relies extensively on graphical analysis including surplus and loss areas accounting.
The EEP course had three sections, all under the supervision of the same instructor and
two teaching assistants. The instructor was also in charge of grading all the exams
which were designed by the course coordinator. The traditional format was based on
lectures and lively class discussions but also included a series of class assignments
based on the studio format of Wilson (1994) but adapted to economics and finance by
Raynauld and Simonato (2005). Typically, the studio format rests on Excel
spreadsheet-based team assignments designed to foster active learning and favour
individual contacts between the instructor and each student. Most of the time, the
assignment takes the form of stylized facts to be explained or a practical problem
commonly encountered, illustrated with real and/or simulated financial or economic data.
When completed, studio assignments were sent electronically and graded by the
teaching assistants (see Table 1 for the assessment).
5

The online format was based on an extension of the studio approach but also relied on
other learning material. The summer term was sequenced in eight weeks. The workload
for a typical week looks like the following:
i. Monday morning at 9h, students had access to the class assignment of the week.
Prior to completing the assignment, the students were assigned required
readings, usually one or two chapters of the textbook Raynauld and Stringer
(2005). The students were invited to consult their colleagues, their instructor and
the teaching assistant by email or by instant messaging.
ii. Each student had to hand in the assignment by the next Monday before 9 AM.
From 10 AM, they had access to a Power Point presentation supplemented by an
audio track of their instructor summarizing the key points of the previous week
covered in the assignment.
iii. A few days later (usually on Tuesday), students received the graded assignment
with detailed comments on the errors made.
iv. Throughout the term, the students were required to post a set of comments on
their chosen policy question (Hydro-Québec pricing, India outsourcing, wind
production of electricity, bridge tolls, etc.). The discussion board was seen as a
substitute to class discussions and was closely monitored by the instructor and
the teaching assistants. Students posting were graded.
Table 1 : Assessment – Economic Problems and Policy Analysis
Face-to-face On line
Assignments (6) 25 % 25 %
Essay (1) 15 % 15 %
Quiz (2) 10 % –
Discussion board – 10 %
Final Exam 50 % 50 %
Total 100 % 100 %
3.2 Basic Corporate Finance
The Basic Corporate Finance course covers mathematical finance, asset pricing,
investment, risk-return tradeoffs, the cost and structure of capital. The course was
6

offered in six different sections, three on daytime, two on evening and one online by five
different instructors. The midterm and final exams were set by the course coordinator
who was also in charge of the online section. As in the EPP course, an information
session was advertised by email. The face-to-face format was exclusively based on
lectures and did not rely on class assignments. The assessment was based on a series
of in-class quiz, midterm and final exams (see Table 2).
The online format was organized as following:
i. Students were assigned a set of chapters in the required textbook, i.e. Ross,
Wethersfield, Jordan and Roberts (2001).
ii. Students also had access to a series of Power Point presentations supplemented
by an audio track of their instructor summarizing the key points under study.
iii. The students were also given a set of problems geared towards the application of
the different finance concepts and their calculations. The assignments had to be
handed-in electronically and were graded.
iv. After the submission of the assignments, students received a detailed answer
sheet.
Table 2 : Assessment – Basic Corporate Finance
Face-to-face On line
Quiz 20 % –
Midterm Exam 35 % 35 %
Assignments (6 on line, 1 in class)
– 20 %
Final Exam 45 % 45 %
Total 100 % 100 %
4. SUMMARY STATISTICS
Table 3 gives a detailed account of the official enrolment in the different sections: 230
(25 online) and 95 (43 online) students were respectively enrolled in the Basic corporate
finance and EPP courses. The section sizes went from 16 to 53 students with 5 sections
having 35 students or less. Data were collected prior to and at the end of the term.
7

Before the course for the online students and during the first class for the others,
students were asked to fill out a questionnaire on their commuting time, their
demographic profile, their summer work, their learning style, etc. The students were also
asked to sign a release form so the researchers could access their electronic transcript
(a requirement at HEC Montréal). Tables 3 and 4 indicate that 107 finance files (46.5 %)
and 69 EEP files (72.63%) could be collected. Final exam results (see Table 6) confirm
that our sample is quite representative of the population and that no obvious bias
resulted from the study participation rate.
Table 3 : Number of students in each section and their participation rate
Total Number of
Students Sample Participation
Economic Problems and Policy Analysis sections
A01 27 13 48.1 %
W01 16 8 50.0 %
Z01 (on line) 52 39 75.0 %
Total 95 60 63.2 %
Basic Corporate Finance sections
A01 53 22 41.5 %
A02 41 8 19.5 %
B01 38 20 52.6 %
W01 41 16 39.0 %
W02 26 8 30.8 %
Z01 (on line) 34 22 64.7 %
Total 233 96 41.2 %
8

Table 4 : Number of students in the sample
Number of students
Face-to-face 21
On line 39 Economic Problems and Policy Analysis
Total 60
Face-to-face 74
On line 22 Basic Corporate Finance
Total 96
Both face-to-face 7
Economics face-to-face, Finance on line 0
Economics on line, Finance face-to-face 1
Both on line 3
Both Economic Problems and Policy Analysis and Basic Corporate Finance
Total 11
Total 167
In Table 5, we provide several summary statistics of our overall sample as well as for the
traditional and online formats. Although men and women are equally represented in our
overall sample (as in the BBA program), the percentage of women is a bit higher in the
traditional format. Grade point averages are quite similar but online students have more
experience as witnessed by their credits completed. Not surprisingly, online students
hold a summer job in a higher proportion, work more hours per week and live much
farther of HEC Montreal than their colleagues in the traditional format. However, online
students are more committed to their study as 92% of them declared a full time status.
Finally, more international students are enrolled in the traditional sections.
9

Table 5 : Summary statistics by learning environment
All Traditional On line
Percentage of women 52.7 56.9 46.2
Cumulative average prior to Summer 2005 (/4.3) 2.84 2.83 2.84
Number of credits prior to Summer 2005 46.69 42.51 53.25
Percentage of students who are working in Summer 2005 74.9 65.7 89.2
Average distance between the student's home and school. (km) 30.4 14.4 56.1
Percentage of full time students 83.8 78.4 92.3
Percentage of part time students 9.0 10.8 6.2
Percentage of international students (part time or full time) 7.2 10.8 1.5
Table 6 provides the final exam results as well as the final grades for the two courses. (in
percentage) As discussed before, the sample results are quite similar to those of the
population. The final exam has been marked twice, each time by a different person (but
the same for all the EPP and finance courses) and the results were quite similar and no
grading bias could be detected.
Table 6 : Final exam results Economic Problems and
Policy Analysis Basic Corporate Finance
Population Sample Population Sample
FINAL EXAM
Average 64.6 % 66.5 % 62.1 % 62.8 %
Standard deviation 12.1 % 11.7 % 11.4 % 13.2 %
FINAL GRADE
Average 73.0 % 74.9 % 66.9 % 67.8 %
Standard deviation 9.3 % 7.8 % 12.2 % 10.5 %
10

5. THE MODELS AND THE ESTIMATION METHOD
5.1 Determinants of the choice of the online format
The factors underlying the choice of the online format can be estimated using a probit
model. These variables are central to the control of the potential selection bias. No
distinction is made at this stage between economic and finance students since we
postulate that the factors influencing the decision to adopt the online format are the
same. Our probit model comprises the latent (1) and observation rule equation (2)
iii XC μβ +=~
(1)
(2)
being the result of the student’s cost-benefit analysis of the decision to take the
online course or not. This variable is not observable as we only observe the final choice
made by the students as indicated by , a dummy variable equal to 1 if the student
ch
a
fluence the student decision. The first group corresponds to the variables
lated to the summer 2005 commuting time: the number of kilometers between his or
oint average and
e number of cumulated credits before the 2005 summer term. The importance of live
⎪⎩
⎪⎨⎧
<
≥=
0~0
0~1
i
ii
Cif
CifC
C~i
iC
ooses the online course, i.e. the cost-benefit analysis is positive. We assume that the
error term μ follows a standard normal distribution, thus the probit model instead of the
logit model.
The explan tory variables included in the X vector span the different sets of variables
that could in
i
re
her house and the school, the commuting time and the transportation method used. A
second group of factors are related to summer jobs: is the student working or not and if
the student is working, does it interfere with the face-to-face schedule.
We consider other variables related to the student studies like the number of courses to
which the student is enrolled during the 2005 summer term, its grade p
th
tutoring by an instructor for the student success as well as the student preference to
study alone or in a group are also included. The intention of the students to major in
11

economics or finance is also included in this group. Finally, we have identified the
students that have already taken an online course, a variable that could impact on their
2005 summer choice.
The next set of variables measures some technological aspects like high-speed internet
access, the number of weekly hours spent surfing on the internet for learning reasons,
r personal reasons, etc. Finally, the last group includes demographic variables like
he impact of the learning format on the learning achievements of the students is
d-side variable is the final exam results
btained in the two courses. Since the EPP and finance courses are different, both in
g the online
nvironment would be quite different from their colleagues choosing the face-to-face
fo
gender, age, number of children at home, etc.
5.2 Determinants of learning achievements
T
estimated in a regression where the left-han
o
terms of delivery and assessment, we estimate two separate regressions.
Using the two stage least squares method (2SLS), we specifically control for the
potential selection bias since it is very likely that students adoptin
e
format. The 2SLS method relies on variables that are correlated with the decision to
take the online environment as estimated in the probit model but that are not
theoretically contributing to the learning results. The regression equation used is:
(3)
ki
ki
kki XFinal ε+β=
[ ]financeEPPkwhere ,= .
The final grade obtained at the final exam is our dependant variable. As explained
before, all the exams were graded twice, each time by the same person. The vector
omprises the usual variables included in this type of educational production function.
is
uite likely in the summer term which is quite intensive. The fact that the student is
iX
c
We first include the number of courses taken in the 2005 summer term. It is likely that
an increase work load could decrease the study time and the results obtained. This
q
12

working is also a variable to be considered as it could impact on the study time. We
have also included a dummy variable indicating if the student has already followed the
course in a previous term. We have also included the cumulated grade point average
before the 2005 summer term as a measure of the quality of the human capital of the
students.
The explanatory variables vector also comprises the results on a certain number of pre-
requiste courses that control for knowledge and skills related to the two courses. We
us take into account the results on Introductory Microeconomics and Macroeconomics
ell as men in economic courses (and possibly in
e finance ones too). Student’s motivation is captured indirectly by intended major
lts. A complete discussion of this
sue appears in the next section.
th
which capture the level of mastering of important elementary economic concepts. We
also include the results of the course Optimization Methods and Models and Financial
Mathematics which measure basic mathematical skills. Finally, we also take into account
the students writing abilities which are proxied by the results in the sociology course.
Ideally, we should include the results to HECTOPE, a normalized test of writing but since
students are not required to take this test before the end of the second year, this variable
is not available for all the students in the sample. The results to the sociology course are
well correlated to the HECTOPE test.
The students gender is also a key control variable since previous empirical studies have
shown that women do not perform as w
th
declaration: a student wishing to specialize in economics or finance is more likely to get
better results. The number of cumulated credits is also included to control for the study
skills acquired by the student prior to taking the 2005 summer courses. Finally, we
include section dummies (only in the finance course) to account for any instructor-
specific learning impact. This dummy was not included for the EPP course since the
same instructor was responsible for all the sections.
As indicated before, we need a set of instruments which are correlated to the online
format choice but uncorrelated to the final exam resu
is
13
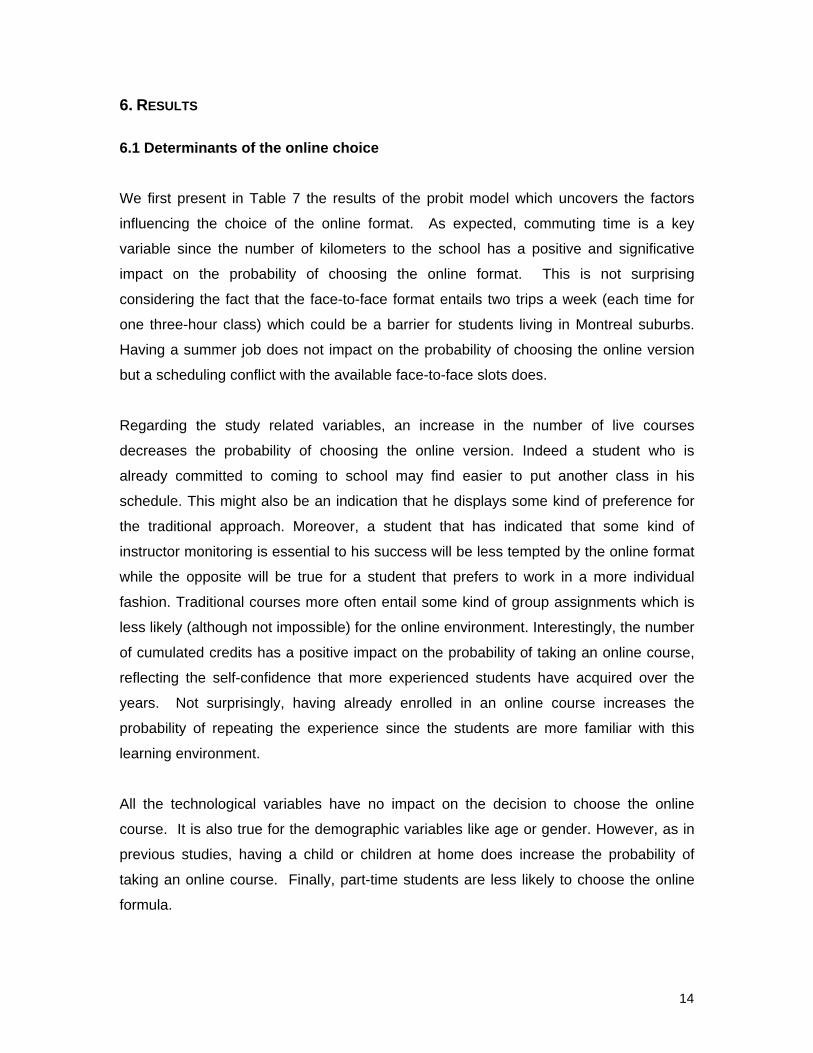
6. RESULTS
.1 Determinants of the online choice
ent in Table 7 the results of the probit model which uncovers the factors
mat. As expected, commuting time is a key
ariable since the number of kilometers to the school has a positive and significative
a student who is
lready committed to coming to school may find easier to put another class in his
or the demographic variables like age or gender. However, as in
revious studies, having a child or children at home does increase the probability of
6
We first pres
influencing the choice of the online for
v
impact on the probability of choosing the online format. This is not surprising
considering the fact that the face-to-face format entails two trips a week (each time for
one three-hour class) which could be a barrier for students living in Montreal suburbs.
Having a summer job does not impact on the probability of choosing the online version
but a scheduling conflict with the available face-to-face slots does.
Regarding the study related variables, an increase in the number of live courses
decreases the probability of choosing the online version. Indeed
a
schedule. This might also be an indication that he displays some kind of preference for
the traditional approach. Moreover, a student that has indicated that some kind of
instructor monitoring is essential to his success will be less tempted by the online format
while the opposite will be true for a student that prefers to work in a more individual
fashion. Traditional courses more often entail some kind of group assignments which is
less likely (although not impossible) for the online environment. Interestingly, the number
of cumulated credits has a positive impact on the probability of taking an online course,
reflecting the self-confidence that more experienced students have acquired over the
years. Not surprisingly, having already enrolled in an online course increases the
probability of repeating the experience since the students are more familiar with this
learning environment.
All the technological variables have no impact on the decision to choose the online
course. It is also true f
p
taking an online course. Finally, part-time students are less likely to choose the online
formula.
14
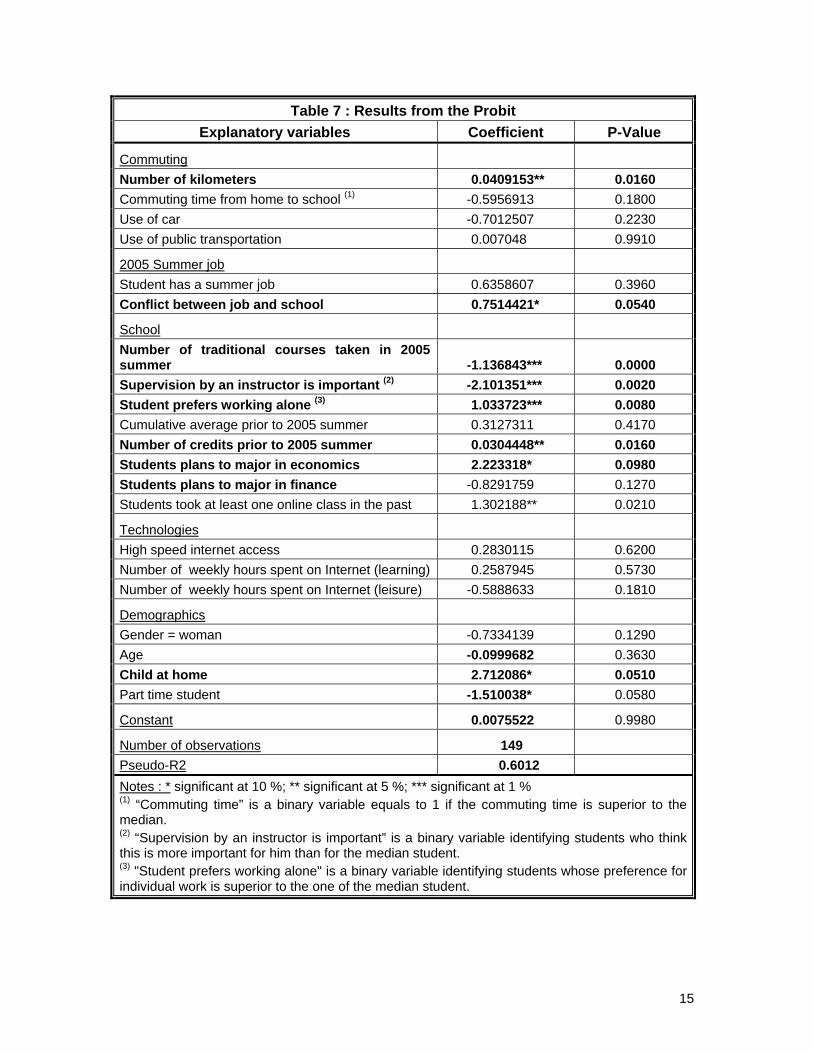
Table 7 : Results from the Probit Explanatory variables Coefficient P-Value
Commuting Number of kilometers 3** 0.0160 0.040915Commuting time from home to school (1) -0.5956913 0.1800 Use of car -0.7012507 0.2230 Use of public transportation 0.007048 0.9910
2005 Summer job Student has a summer job 0.6358607 0.3960 Conflict between job and school * 0.7514421 0.0540
School Number of traditional courses taken in 2005
-summer 1.136843*** 0.0000 Supervision by an instructor is important (2) -2.101351*** 0.0020 Student prefers working alone (3) 1.033723*** 0.0080 Cumulative average prior to 2005 summer 0.3127311 0.4170 Number of credits prior to 2005 summer 0.0304448** 0.0160 Students plans to major in economics 2.223318* 0.0980 Students plans to major in finance -0.8291759 0.1270 Students took at least one online class in the past 1.302188** 0.0210
Technologies High speed internet access 0.2830115 0.6200 Number of weekly hours spent on Internet (learning) 0.2587945 0.5730 Number of weekly hours spent on Internet (leisure) -0.5888633 0.1810
Demographics Gender = woman -0.7334139 0.1290 Age -0.0999682 0.3630 Child at home 2.712086* 0.0510 Part time student -1.510038* 0.0580
Constant 0.0075522 0.9980
Number of observations 149 Pseudo-R2 0.6012 Notes : * significant at 10 %; ** significant at 5 %; *** signific(1) binary variable equals to 1 if the com ing time is sup r to the
on by an instructor is important” is a binary variabl ing student o think
work is superior to the one of the median student.
ant at 1 % “Commuting time” is a
median. mut erio
(2) “Supervisi e identify s whthis is more important for him than for the median student. (3) "Student prefers working alone" is a binary variable identifying students whose preference for individual
15

The resulting pseudo-R2 of the regression (0.6012) is much higher than the one
ported (0.373) by Anstine and Skidmore (2005). It seems that our questionnaire
ontained a richer set of variables and that our sample size is much larger (149 vs. 76).
.2.1 Instruments
ollowing the estimation of the probit model, we can now select the appropriate
herefore control for the selection bias problem. As indicated before, a
ood instrument is correlated to the choice of the online format but is uncorrelated to the
ly exogenous to the learning process and should not be
lated to the results obtained in any course. Moreover, the probit results indicate that
ility of choosing an online course and should
ot have any effect on our learning success measure. Finally, the number of face-to-face
re
c
6.2 Online vs. face-to-face results
6
F
instruments and t
g
results obtained in the course.
As in previous studies, the number of kilometers between home and school is a good
candidate. This variable is clear
re
the students that are living further from the schools are more likely to take the online
format. The presence of a scheduling conflict is also a candidate instrument as it turned
out to be significant in the probit estimation. Controlling for the fact that the student is
working or not, adding this scheduling conflict variable should not have any impact on
the final grade obtained by the students.
Having already enrolled in an online course also meets our two instrument conditions:
this variable has an impact on the probab
n
courses taken during the 2005 summer could also be used as an instrument. It was
significant in our probit estimation and, controlling for the total number of courses taken
during the summer term, the use of this dummy variable should not be correlated to the
performance of the students.
16

6.2.2 Results for the Economic problems and policy analysis course
Controlling for the selection bias problem, the estimation of our regression model reveals
that the online students scored better on the final exam (6.07% on average) than their
face-to-face colleagues. For the overall course, this represents 3.03%.
These results contrast with those obtained in previous studies where online students
were not doing as well as their colleagues in the traditional format. Many explanations
can be put forward. Firstly, our dependant variable (the final exam) is quite different
from those used in other studies. Considering the nature of the course, our final exam
has been historically composed of a set of simple real life cases leading to some
calculations and interpretations. This is in sharp contrast with two of the previous studies
that relied on the TUCE multiple choice questions. The use of normalized questions is
obviously a good approach for a principle-type course but no such questions exist for a
policy oriented course covering a wide range of topics. Moreover, in the history of the
EPP course at HEC Montréal, multiple choice questions have been rarely used and
practice tests were not using them at all.
We now discuss the results for the other variables that have an impact on the final exam.
Having a summer job decreases the final exam results by 6.95% on average and
confirms the conjecture that students who work have less study time. Not surprisingly,
the grade point average is positively related to the course performance. A one-point
increase in the GPA leads to a 10.1% increase in the final exam results or 5.05 % for the
final grade of the course. The quality of the human capital is clearly an important factor
to consider. Surprisingly, the effect of prerequisites is not uniform across courses: doing
well in the Microeconomic course does not translate in better grades in the EPP course
while it is the case for the Optimization Methods and Model course. No easy explanation
can be given.
As in previous studies, women do not perform as well as men in the final exam. On
average, we find a 7.9 % difference. Finally, the students that have declared an intended
major in economics have better results, 9 % on average. It is quite likely that these
students are more motivated or possess economic-specific skills.
17

Table 8 : Regression Result for Economic Problem and Policy Analysis Explanatory variables Coefficient P-Value
On line class dummy 6.06984** 0.023 (2.582432)
Number of traditional courses for 2005 summer -0.4409562 0.828 (2.020426)
Summer job in 2005 summer -6.944513** 0.011 (2.62658)
The student takes the class for a second (or third) time in 2005 summer 7.934206 0.317 (7.83968)
Cumulative average prior to 2005 summer 10.11927*** 0.002 (3.058328 )
Microeconomic analysis grade -3.725523 0.084 (2.110037)
Optimization Methods and Models grade 6.322612*** 0.001 (1.721544)
Financial mathematics grade 2.600077 0.131 (1.691931)
Sociology grade 0.5868003 0.741 (1.763881)
Gender woman =1 -7.942368*** 0.003 (2.582429)
Student plans to major in economics 8.973999*** 0.000 (1.810081)
Number of credits prior to 2005 summer -0.1197523 0.115 (0.0745072)
Constant 30.06092 0.001
Number of observations 61
R2 0.665
Notes: * Significant at 10 %; ** significant at 5 %; *** significant at 1 %. Robust Standard deviation in parenthesis
18
6.2.3 Results for the finance course
For finance, the results indicate that the online students did not perform as well as their
face-to-face colleagues. In fact, if we control for the selection bias problem, they get on
average 6.31% less (significant at the 10% level). This is in sharp contrast with the EPP
result but in line with the previous studies although they did not include finance courses
in their investigation. Various reasons can explain this result. Firstly, the finance course
was offered online for the first time in the 2005 summer (contrary to the EPP course). It
is very likely that the learning material and the overall format were not fully tailored to the
students needs. Secondly, the online formula was quite different from the face-to-face
one which relied exclusively on traditional lectures. The overall assessment was also
different as face-to-face students had to answer a series of in class quiz while online
students were given a series of assignments. One can conjecture that the two methods
did not prepare the students in the same way for the final exam. The final exam
structure does not seem to be a factor: although the final exam was based on both
multiple choice questions and questions relying on financial calculations,this
characteristic did not bring any difference in the performance of the online students
compared to their colleagues.
As in the EPP course, the impact of the grade point average is positive: however, the
coefficient is larger indicating that a one-point increase in the GPA leads to a 21.8%
increase in the final exam results. As for the prerequisite courses, only the results of the
sociology course are significant but negative. This is interesting and points to the fact
that not all students have the same kind of abilities and that verbal skills might be quite
different than mathematical skills. As in the EPP case and probably for the same
reasons, the students that have declared an intended major in finance have better
results, 4.46 % on average.
19

Tableau 9 : Regression Results for Basic Corporate Finance Explanatory variables Coefficient P-Value
On line class -6.310231* 0.0970 (3.752123)
Number of traditional class for 2005 summer -1.795786 0.3190 (1.788887)
Summer job 4.320496 0.1100 (2.671105)
The students takes the class for a second (or third) time in the 2005 summer 1.298217 0.5200 (2.481011)
Cumulative average prior to 2005 summer 21.77313*** 0.0000 (2.908433)
Microeconomic Analysis grade 1.328615 0.3790 (1.499535)
Optimization Methods and Models grade -0.096209 0.940 (1.275661)
Financial mathematics grade -1.390948 0.3120 (1.366459)
Sociology grade -3.987959** 0.0110 (1.531936)
Gender Woman=1 -2.477027 0.2680 (1.945423)
Student plans to major in finance 4.464568* 0.0890 (2.590213)
Number of credits prior to 2005 summer 0.0827226 0.2270 (0.0679009)
Constant 10.88855 0.1600
Number of observations 88
R2 0.618
Notes : * Significant at 10 %; ** significant at 5 %; *** significant at 1 %. Robust Standard deviation in parenthesis Instructor-specific dummies are also a part of the model.
20

7. CONCLUSION
The present study adds to the overall assessment of online vs. face-to-face learning by
documenting a case where students enrolled in an online economic policy course
performed better than their face-to-face colleagues. The learning setup of the online
course was adapted to the students needs yet was also similar to the face-to-face
formula: students had access to a series of Power Point files with audio tracks of their
instructor, completed a set of Excel assignments geared towards the important economic
concepts to learn and more importantly had a sequence of activities fostering the
reading of the relevant textbook chapters. Moreover, the online and live students had the
same instructor and the face-to-face sections had respectively 27 and16 students, an
almost ideal learning environment. The same kind of positive result did not apply to the
finance course which indicates that the performance of online courses is linked to
numerous factors: the type of course, the setup of the learning environment and the
assessment decisions. We should emphasize again that the online finance course was
offered for the first time in the 2005 summer and that minor adjustments are most likely
to be made.
This study clearly shows that online courses are quite valuable to HEC Montreal
students, especially those who live farther away from the school or have scheduling
conflicts. The pseudo-R2 and the t-tests obtained in the probit model confirm this
observation. The results also indicate that further work is needed to develop and test
robust methodologies that could not only compare the results obtained by on-line and
live students but also identify more precisely the marginal impact of specific learning
tools or methods. The design of normalized questionnaires that could be given before
and after a course is a promising but difficult research avenue. The TUCE questions
currently available only apply to principles courses and would have to be adapted to
more complex and richer set of economic concepts.
21

BIBLIOGRAPHY ANSTINE, J. and M. SKIDMORE (2005), “A Small Sample Study of Traditional and
Online Courses with Sample Selection Adjustment”, Journal of Economic Education, Vol. 36, No. 2, pp. 107-127.
BROWN, B. and C. LIEDHOLM (2002), “Can Web Courses Replace the Classroom?
Lessons from Microeconomics”, American Economic Review, Vol. 92, No. 2, Mai, pp.444-448.
COATES, D., B.R. HUMPHREYS, J. KANES and M.A. VACHRIS (2004), “"No significant
distance" between face-to-face and online instruction: evidence from principles of economics”, Economic of Education Review, Vol. 23, pp. 533-546.
COOPER, L. (2001), “A Comparison of On-line and Traditional Computer Applications
Classes “, T.H.E Journal, Vol. 28, No. 8, 52-58. GAGNE, M. and M. SHEPHERD (2001), “A Comparison Between a Distance and a
Traditional Graduate Accounting Class”, T.H.E Journal, April 2001. LU, J.,C-S. YU and C. LIU (2003),“Learning style, learning patterns, and learning
performance in a WebCT-based MIS course”, Information & Management, Vol. 40, No. 6, pp. 497-500.
RAYNAULD, J. and J-G. SIMONATO (2005), “Studio Teaching in an Undergraduate
Course in Options and Futures”, Journal of International Financial Education, Vol. 1, pp.124-40.
RAYNAULD, J. and Y. STRINGER (2005), “Problèmes et politiques économiques”,
mimeo, HEC Montréal, available at http://zonecours.hec.ca/af1Presentation.txp?instId=a-285197.
ROSS, S.A., WESTERFIELD, R.W., JORDAN, B.D. and ROBERTS, G.S., “Gestion
financière”, Première édition (adaptation of Martin Boyer and Jacques St-Pierre), Les Éditions de la Chenelière/McGraw-Hill, 2001.
RUSSELL, T. (2002), “The no significant difference phenomena”, available at
http://teleeducation.nb.ca/nosignificantdifference/ VACHRIS, M. A. 1999, “Teaching Principles of Economics without “Chalk and Talk”: The
Experience of CNU On-line», Journal of Economic Education, 37, 292-302. WILSON, J. M., 1994, «The CUPLE Physics Studio», The Physics Teacher, 32, 518-
523.
22
NOTES 1 Jacques Raynauld is associated with the Institut d’économie appliquée of HEC Montréal. He holds the Chair for teaching and learning in management education. Marie-Pierre Pelletier is a former graduate student of HEC Montreal. We would like to thank HEC Montreal for its financial support. The first author was the coordinator of the economic course of this experiment. He would like to thank Nathalie Elgrably who was the instructor for the face-to-face and on line sections of the EPP course and Jean-Philippe Tarte, its finance colleague. Catherine Michaud and Valérie Paré generously and cheerfully participated in this experiment as teaching assistants. We would like to thank Manon Vaillant, registrar of HEC Montréal and Marie Lattouf for their collaboration, Yves Goyette and the staff of the media center for their expertise. Finally, we would like to thank all the students that participated in this experiment. 2 The Economic problem and Policy Analysis course was launched online for the first time in the 2004 summer term.
23