A Comparison of Crimson Clover and Winter Wheat as an · PDF fileA Comparison of Crimson...
36
A Comparison of Crimson Clover and Winter Wheat as an Economical Wildlife Food Plot A Research Paper Submitted for the Master of Science in Agricultural and Natural Resources Degree University of Tennessee at Martin Submitted by: Bryan F. Barnes December 2012
Transcript of A Comparison of Crimson Clover and Winter Wheat as an · PDF fileA Comparison of Crimson...

A Comparison of Crimson Clover and Winter Wheat
as an Economical Wildlife Food Plot
A Research Paper Submitted for the Master of Science in
Agricultural and Natural Resources Degree University of Tennessee at Martin
Submitted by: Bryan F. Barnes December 2012


ii
Abstract
Managed wildlife food plots seek to improve the wildlife habitat by providing
additional quantities of nutritious foods, usually in the form of herbaceous openings or
cultivated plots. A field study was conducted in fall 2011 to spring 2012 to determine the
wildlife preference, economic viability, and potential yield loss in crimson clover,
Trifolium incarnatum L., and winter wheat, Triticum aestivum L., forage. A randomized
complete block design with four replications was used; there were two treatments sown
on 1 September 2011: winter wheat planted at a rate of 160 kilograms pure live seed
per hectare and crimson clover planted at a rate of 33 kg of pure live seed per hectare.
Exclosure cages were constructed at random locations within each plot. The cages
were 1.5 m x 1.5 m surrounded by 1.8 m metal t-posts wrapped with a woven mesh
material. The plots were fenced off and left to grow and be grazed by wildlife through 26
February 2012. Numerous white-tailed deer and wild turkeys were observed regularly
during this time. At the end of the study, forage samples were taken from the plots and
exclosure cages at random. There were significant differences between clover and
wheat for the dry weights produced in the plots (P=0.0114) and in the exclosure cages
(P=0.0217). The clover produced more dry forage both within the plots and within the
exclosure cages. There was no significant difference (P=0.4432) between the wheat
and clover for percent of forage that was grazed, but the weights of the forages
consumed did show a significant difference (P=0.0308).
A cost analysis was conducted to see which forage was more economical for
providing nutrition for wildlife. The clover had a higher input cost ($41.99/ha) than the

iii
wheat ($40.54/ha), but the clover provided more forage per dollar of input (7.7 kg/dollar)
than the wheat (3.7 kg/dollar).
At the end of the study it was concluded that wildlife did not prefer either the
wheat or crimson clover as the percentage of each forage that was eaten was not
significantly different. However, from a cost standpoint, clover provided more than
double the amount of forage per dollar of input compared to wheat.

iv
Table of Contents
Title Page
Chapter I. – Introduction ............................................................................................... 1
Objectives ............................................................................................................. 2
Chapter II. - Literature Review ...................................................................................... 3
Wildlife Food Plots ................................................................................................ 3
Crimson Clover ..................................................................................................... 6
Winter Wheat ........................................................................................................ 7
White-tailed Deer .................................................................................................. 7
Eastern Wild Turkey ............................................................................................. 9
Agricultural Yield Loss Due to Wildlife ................................................................ 10
Chapter III. - Materials and Methods .......................................................................... 11
Plot Design ......................................................................................................... 11
Data Collection ................................................................................................... 14
Statistical Analysis .............................................................................................. 15
Chapter IV- Results and Discussion .......................................................................... 16
Forage Produced and Consumed. ...................................................................... 18
Cost Analysis ...................................................................................................... 22
Chapter V- Conclusion ............................................................................................... 24
Literature Cited ............................................................................................................ 25
Appendix ................................................................................................................. 28

v
List of Figures
Page
Figure 1. Aerial view of plot layouts with drawn grid lines ............................................. 12
Figure 2. Research plot layout with plot measurements. .............................................. 13
Figure 3. Five foot (1.5 m) x five foot (1.5 m) exclosure cage constructed within a clover plot ................................................................................................................... 13
Figure 4. One foot (0.3 m) by one foot (0.3 m) square constructed of 0.75 inch (1.9 cm) PVC used for selecting forage samples. ......................................................... 14
Figure 5. Visual difference between clover in exclosure and grazed plot ..................... 17
Figure 6. Mean dry weights of wheat and clover within the grazed plots and within the exclosures in the plots. ............................................................................................ 19
Figure 7. Mean percentages of moisture for clover and wheat within the plots and exclosures. .................................................................................................................... 20
Figure 8. a. Percentage of clover and wheat consumed within the plots. b. Mean amount of forage consumed (kg/ha) per species (crimson clover and wheat) in grazed plots ................................................................................................................. 21
Figure 9. a. Mean amount of clover and wheat consumed within the plots. b. Amount of forage consumed per species (crimson clover and wheat) per dollar of input ........... 23

vi
List of Tables
Page
Table 1. Local weather records during experiment in 2011-2012 ................................. 16
Table 2. Summary of ANOVA results for all variables measured in the experiment ..... 18
Table 3. Summary of means for all variables measured in this experiment .................. 18
Table 4. Seed cost, fertilizer cost, seeding rate, cost of working ground, percent forage consumption, weight of forage consumed, and value of plant species for forage consumed for clover and wheat. ........................................................................ 22
Table A.1. ANOVA table of dry forage weights (Kg/ha) of clover and wheat in grazed plots ............................................................................................................... 28
Table A.2. ANOVA table of dry forage weights (Kg/ha) of clover and wheat in exclosures ................................................................................................................. 28
Table A.3. ANOVA table of moisture percentage for forage of clover and wheat in grazed plots ............................................................................................................... 28
Table A.4. ANOVA table of moisture percentage for forage of clover and wheat in exclosures ................................................................................................................. 29
Table A.5. ANOVA table of forage percentage consumed ............................................ 29
Table A.6. ANOVA table of dry forage weights consumed ........................................... 29

1
Chapter I - Introduction
Managed wildlife food plots seek to improve the wildlife habitat by providing
additional quantities of nutritious foods, usually in the form of herbaceous openings or
cultivated plots (VDGIF, 2012). Numerous companies market pre-mixed seed blends
that are specially designed for wildlife. However, these blends can be costly to use and
may not be designed for the region or climate for which they are used. It is important
that the consumer knows what is being purchased and understands when, where, and
how to plant the seed for a successful food plot.
Research has shown that wildlife food plots are a good way to concentrate
wildlife into a particular area by improving the available nutrition and carrying capacity of
the land. It is important to understand that food plots do not and cannot replace the
overall management of habitat. They are simply used to contribute an additional quality
food source to an area (Harper, 2008).
The white-tailed deer, Odocoileus virginianus., and the wild turkey, Meleagris
gallopavo silvestris, are the two most heavily populated big game species in the Middle
Tennessee Region and are the most sought after by hunters. Deer and turkeys are also
the two big game species that are most often managed in the Middle Tennessee area
(TWRA, 2010). When managing these species, it is important to look at the times of the
year that are most stressful to the animals, and provide a food source that will be
beneficial to the animals during these periods of the year. It is important not to plant too
large or too many food plots in an area, though. One food plot per forty acres of
managed area is recommended and no more than five percent of the managed area

2
should be devoted to food plots (MacGowan and Osborne, 2004). Cool season plots
provide forage to wildlife during the winter stress period when there are few food
sources readily available (Harper, 2008).
Crimson clover and wheat are cool season forages that are recommended for
both white tailed deer and wild turkey food plots (Hamrick and Strickland, 2011). With
the number of food plot blends and seed options in the market increasing each year, it
is important to find the plot and seed type that is the most economical and efficient for
the hunters and wildlife managers in the region.
Objectives
This research project evaluated the use of cool season food plots by wildlife to
measure wildlife preference and provide a cost analysis of winter wheat vs. crimson
clover.
This study was specifically designed to:
1. Determine if crimson clover or winter wheat is preferred by white tailed deer
and wild turkeys.
2. Determine if crimson clover or winter wheat provides a more economical
source of dietary supplement for white tailed deer and wild turkeys.
3. Determine the potential loss of a livestock grazing pasture of winter wheat
and crimson clover due to wildlife use.

3
Chapter II - Literature Review
Wildlife Food Plots
Food plots can be defined as small areas that are planted in annual or perennial
crops to provide supplemental food sources for wildlife (Minnesota Department of
Natural Resources, 2010). Food plots have become one of the most popular wildlife
management practices used by landowners and hunters who want to enhance wildlife
habitat. Food plots can provide up to ten times the amount of digestible energy and
protein than can be provided by a properly managed mature forest or a recently
regenerated forest. A food plot can also increase the nutritional carrying capacity of an
area for wildlife. While food plots add nutritional value to a tract of land, they also
increase hunting and viewing opportunities for wildlife (Harper, 2008).
When creating food plots, it is important to plant the correct size plot in the
correct area of the property. One food plot should be planted for forty acres of managed
area; food plots should not exceed 5% of the managed area (MacGowan and Osborne,
2004). The area in which the plot is planted is important so that wildlife can maximize
their use of the supplemental food source. The plots should be close to nearby cover
such as wooded areas or brushy draws so that wildlife will have a place to which they
can escape. To further maximize the value of the plot to wildlife, livestock should be
fenced out or otherwise excluded from the area (Missouri Department of Conservation,
2012).
Once an area is selected for the food plot, careful consideration should be given
to selection of the seed to be planted (Harper, 2008). Selecting the right forage to be

4
planted can be overwhelming due to the number of choices available. In fact, an
economic market based on wildlife management has emerged in recent years. There
are several companies marketing seed blends, sprayers, spreaders, tillers, harrows,
and discs to aid in the cultivation of wildlife food plots. Several of these seed blends
consist of forbs that provide a good source of nutrition throughout several seasons
(Messner, 2011). For example, plants such as winter wheat or brassicas provide
nutrition during the winter when other naturally occurring food sources may be scarce
(MacGowan and Osborne, 2004). Some of these commercial blends also claim to
contribute to antler growth and other physical developments. However, antler
development and other physical characteristics are governed primarily by genetics and
the animal’s age. There is a nutritional component to physical development of the
animals, and providing a food source during otherwise lean periods of the year can help
to prevent starvation in the wildlife population (Messner, 2011). Different species of
wildlife will benefit from different food sources, but often multiple wildlife species will
benefit from the same food source. It is important to determine which wildlife species is
being managed and what food source will provide the most nutritional value for that
species (Harper, 2008).
The time of year the food plots are planted also plays an important role in what
plant species should be used to maximize nutritional supplementation. In the southeast
during the warm season, a mixture of buckwheat (Fagopyrum esculentum), cowpeas
(Vigna unguiculata), rape (Brassica napus), and forage turnips (Brassica rapa) can be
planted for white-tailed deer and turkeys in upland areas. In bottomland sites, forages
such as buckwheat, alyce clover (Alysicarpus vaginalis), American joint vetch

5
(Aeschynomene Americana), rape, and forage turnips can be planted to benefit
nutritional requirements of white tailed deer and turkeys. Although rape and turnips are
considered cool season forages, when planted early enough in the spring they will
produce quality forage for wildlife into the summer due to their short germination time
and quick growth patterns (Harper, 2008).
There are several cool season forages that can be planted in the southeast to
supplement the diets of white-tailed deer and turkeys. Annual forages that are high in
protein such as crimson clover, Austrian winter peas (Pisum sativum), arrowleaf clover
(Trifolium vesiculosum), oats (Avena sativa), wheat (Triticum aestivum), rape, and rye
grass (Lolium perenne) can be planted to help with antler development of white-tailed
deer and the reproductive demands of deer and turkey. White clover (Trifolium repens),
alfalfa (Medicago sativa), and birdsfoot trefoil (Lotus corniculatus) are cool season
perennial plants that can be used in food plots to benefit both white-tailed deer and
turkeys (Harper, 2008).
The green forages in both the cool and warm season plots will also host a large
number of insects and other invertebrates that are a crucial component of the diets of
wild turkey poults. Chufa (Cyperus esculentus), a variety of yellow nutsedge, is also a
good food source for turkeys. They feed on the plant’s tuber that is produced a couple
inches under the ground. This food source works best in sandy or loamy soils so that it
is easier for the turkeys to scratch the food source out of the ground (Harper, 2008).
In the southeast, grain plots such as corn (Zea mays) and sorghum (Sorghum
spp.), also provide a good food source for both deer and turkeys. Soybeans (Glycine
6
max) are a favorite of white tailed deer, but the bean plants do not stand up to browsing
well, so soybeans should only be used in situations where a large field can be planted
(Harper, 2007).
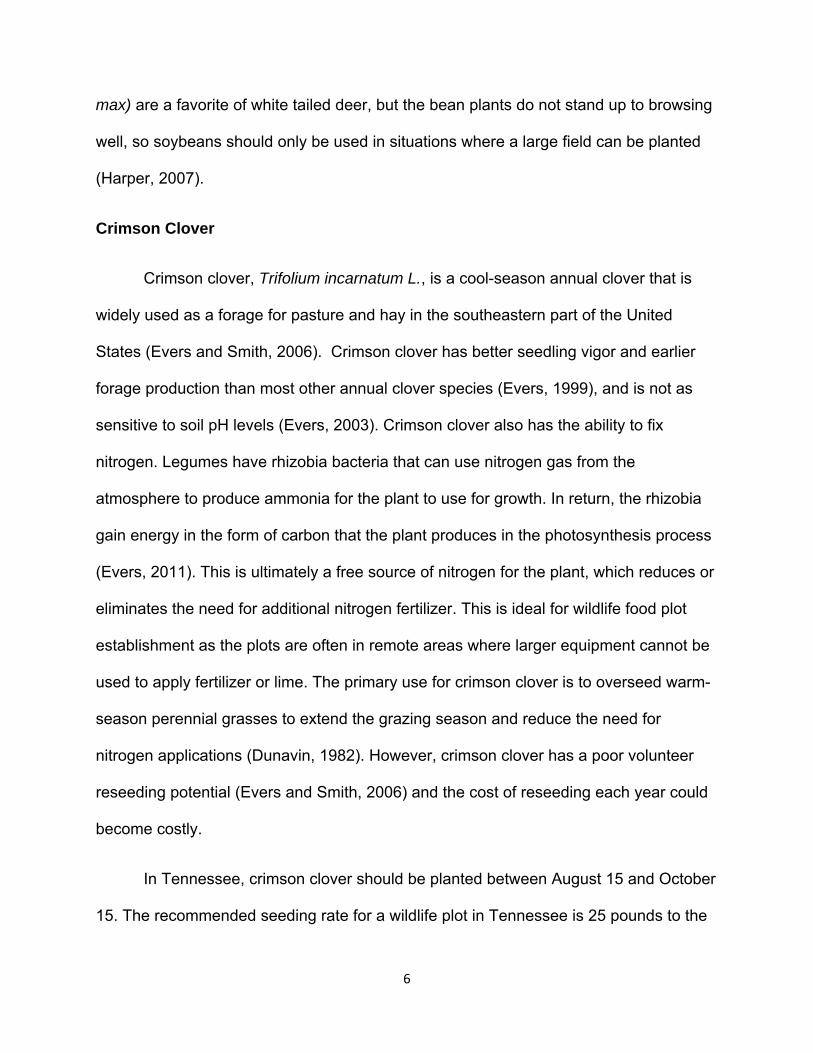
Crimson Clover
Crimson clover, Trifolium incarnatum L., is a cool-season annual clover that is
widely used as a forage for pasture and hay in the southeastern part of the United
States (Evers and Smith, 2006). Crimson clover has better seedling vigor and earlier
forage production than most other annual clover species (Evers, 1999), and is not as
sensitive to soil pH levels (Evers, 2003). Crimson clover also has the ability to fix
nitrogen. Legumes have rhizobia bacteria that can use nitrogen gas from the
atmosphere to produce ammonia for the plant to use for growth. In return, the rhizobia
gain energy in the form of carbon that the plant produces in the photosynthesis process
(Evers, 2011). This is ultimately a free source of nitrogen for the plant, which reduces or
eliminates the need for additional nitrogen fertilizer. This is ideal for wildlife food plot
establishment as the plots are often in remote areas where larger equipment cannot be
used to apply fertilizer or lime. The primary use for crimson clover is to overseed warm-
season perennial grasses to extend the grazing season and reduce the need for
nitrogen applications (Dunavin, 1982). However, crimson clover has a poor volunteer
reseeding potential (Evers and Smith, 2006) and the cost of reseeding each year could
become costly.
In Tennessee, crimson clover should be planted between August 15 and October
15. The recommended seeding rate for a wildlife plot in Tennessee is 25 pounds to the

7
acre (28 kg/ha). It can be drilled or broadcast to a depth of 0.25 inch (0.6 cm) (Harper,
2008).
Winter Wheat
Winter wheat, Triticum aestivum L., is a cool-season annual grass that can be
used for both forage and grain production. Wheat that is used for pasture produces a
source of forage that is high in minerals, protein, and energy. However, winter wheat is
low in fiber (Hossain et al., 2003).
Wheat can be planted at various times of the year in Tennessee. However, for
fall forage production, it is recommended that it be planted from September 1 to October
1. The recommended planting rate is 120-180 pounds per acre (134 to 202 kg/ha).
Wheat can be drilled or broadcast to a depth of 1 to 1.5 inches (2.5 to 3.8 cm) (Shelby,
1997). The soil pH should be between 6.0 and 6.5 for a successful wheat crop (Harper,
2008). A soil test can be utilized to determine the pH and lime can be applied
accordingly.
White-tailed Deer
The white-tailed deer, Odocoileus virginianus., is native to Tennessee and is the
most heavily populated large game species in Tennessee (Tennessee Wildlife
Resources Agency, 2010). A common goal of wildlife managers is to estimate and
maintain the carrying capacity of habitat, while managing the wildlife population and
available natural resources (Gordan et al., 2004). The nutritional and energy
requirements of deer can become detrimental to their habitat during winter months due
to the lack of available forage, especially in an area that is overpopulated by wildlife

8
(Gray and Servello, 1995). An area that is overpopulated with deer gets browsed
heavily during the winter months. This eventually destroys their habitat by reducing or
eliminating regenerative growth that could provide an ample supply of nutrition for the
current deer population. This can play a major role in the carrying capacity of the land.
Several factors influence intake of forages by deer, such as digestibility of forage,
climate conditions, and the availability of quality forages (Welch and Hooper 1988).
Another factor to consider in the diets of white tailed deer is their ability to modify their
feeding patterns during the winter months to meet their nutritional requirements while
minimizing body mass loss (Ozoga and Verme, 1970). Deer may limit their movement to
warmer daylight hours and focus their feeding in areas that have little or no snow cover
(Beier and McCoulough, 1990). Deer movement is reduced during winter months and
this reduction is directly related to cooler temperatures, heavier snow cover, and the
lack of quality forage (Taillon et al., 2006).
The nutritional condition of white-tailed deer is important to wildlife managers for
a number of reasons. Growth rates, ovulation, conception rate, age at first reproduction,
neonatal fatality rate, and number of fawns per offspring event are all influenced by the
overall nutritional condition of the animal (Swihart et al., 1998). Therefore, it is
important to monitor and manage available food sources for white-tailed deer according
to the wildlife manager’s goals.

9
Eastern Wild Turkey
The eastern wild turkey, Meleagris gallopavo silvestris, has the second highest
population of large game species in Tennessee (Tennessee Wildlife Resources Agency,
2010). The eastern wild turkey prefers a habitat that consists of open mature hardwood
forests, mixed forests, and open fields. The open fields provide food sources, habitat for
rearing brood, field edges for nesting, and an area for courtship (Stewart, 1989).
The diet of the eastern wild turkey is rather diverse. For the first few weeks of a
turkey poult’s life, it consumes primarily insects. Once their digestive system develops
and they become more mobile, turkeys begin to consume more fruits and seeds
(Stewart, 1989). As the seasons change, so do the food sources for turkeys. In the
spring and summer, their diets will consist primarily of insects and seeds from grasses
and herbaceous plants. These open field type areas are also heavily used during the
mating season for the turkeys to “display” themselves. Then, during fall, turkeys will
begin migrating toward areas that have thicker cover, such as hardwood forests. These
areas provide food such as dogwood fruits and acorns from oak trees during fall and
winter (Stewart, 1989).
Turkeys generally feed throughout the day, but primarily forage during the first
two or three hours following daybreak and two to three hours prior to sunset (Stewart,
1989). As sunset nears, turkeys begin to roost. They roost at night for protection from
predators and adverse weather. The eastern wild turkey prefers to roost in conifer trees
that are adjacent to water sources, but they will roost in pine plantations, bottomland
hardwoods, upland hardwoods, and mixed pine-hardwood stands (Stewart, 1989).

10
There are several ways to directly improve habitat quality for turkeys. Prescribed
burns can be used to encourage growth of an herbaceous understory. Another way to
improve habitat is to maintain mixed stands of trees when possible. Clover can also be
planted in open areas to encourage insect populations and provide green foliage for
food and cover (Stewart, 1989).
Agricultural Yield Loss due to Wildlife
Wildlife damage is a major concern for most landowners in the United States who
manage their property for agricultural production. The amount of crop damage caused
by wildlife was projected to be $619 million in field crops and $146 million in vegetables,
fruits, and nuts in 2001 (USDA-APHIS, 2008). In a national survey, 80% of farmers
indicated that they had suffered damage from wildlife in the previous year, and 54% of
these respondents reported that their damages from wildlife exceeded $500 (Conover,
1998). In the same national survey noted above, 53% of agricultural producers stated
that the amount of damage from wildlife on their property exceeded their tolerances
(Conover, 1998).
Another study examined actual yield loss in legume forage production due to
wildlife grazing (Richer et al., 2005). The study looked at clover and alfalfa fields that
bordered woodlots. This study utilized control cages to determine the percentage of
forage lost to wildlife browsing. The results showed an estimated loss of 12% to 14% in
production yields due to wildlife browsing during the fall and spring growing seasons
(Richer et al., 2005).

11
Chapter III- Materials and Methods
This project was conducted on private property in central Williamson County, TN.
The area where the plots were planted had been used for forage production for the past
20 years, and prior to that it was used as a site to grow burley tobacco. The soil type in
this area is a mixture of Egam silt loam, Talbott silty clay, and Talbott silty clay loam
(USDA-NRCS, 2012).
Plot Design
The entire research site was fenced off using three strands of barbed-wire to
prevent any livestock from grazing in the plots. On the north and west of the plot is
pasture. To the east is a wooded lot that serves as a riparian buffer to a stream. On the
south side of the plot is another wooded area that is composed mostly of eastern red
cedar, Juniperus virginiana (Figure 1). Prior to planting, a soil sample was collected
from the plot site to determine the nutrient availability and pH of the soil. The results of
the soil test did not indicate a need for lime. Fertilizer was applied as recommended for
each plant species. The wheat plots received 60 pounds of nitrogen per acre (67 kg/ha)
at seeding. The wheat and clover plots both received an application of 80 pounds of
potash per acre (90 kg/ha). The plots were planted in a randomized complete block
design using two treatments (crimson clover and winter wheat) with four replications.
The individual plots were 70 feet (21.3 meters) by 145 feet (44.2 meters) with 5 foot (1.5
meters) buffer strips in between each replication and a 5 foot (1.5 meters) outside
border around the edge of the plots (Figure 2). The seed bed was created by disking the
soil. The plots were then measured and marked off using a measuring wheel and

12
fluorescent flags. The seed was broadcast over the plots using a shoulder seed
spreader in a grid pattern to ensure an even seeding rate. Once the seed was sown, a
cultipacker was run over the seed bed to ensure seed to soil contact. Treatment one
was winter wheat planted at a rate of 160 kg/ha or 37.3 kg per plot. Treatment two was
crimson clover planted at 33.6 kg/ha or 7.8 kg per plot. An exclosure cage of 5 feet (1.5
m) by 5 feet (1.5 m) was installed in a randomly selected location within each plot
(Figure 3). The spot was selected by tossing a tennis ball over my shoulder into the plot.
Wherever the ball landed, that was the center of the exclosure. This exclosure was
fenced off with four 6 foot (1.8 m) iron t-posts with a woven mesh material attached to
all four sides (Harper, 2008).
Figure 1. Aerial view of plot layouts with drawn grid lines. C=crimson clover; W=winter wheat (Grid is estimated, not actual measurements).Photo compliments of WCDIT (2011).

13
Clover 4
75’ wide
Wheat 3
Clover 2
Wheat 1
5’ Buffer Strip
Wheat 4
Clover 3
Wheat 2
Clover 1
Figure 2. Research plot layout with plot measurements.
Figure 3. Five foot (1.5 m) x five foot (1.5 m) exclosure cage constructed within a clover plot.
145’
long

14
Data Collection
The plots were planted on 1 September 2011, and the plot was left to grow and
be used by wildlife until 26 February 2012. On 26 February 2012, forage samples were
collected from each treatment plot and exlosure. Three 1 square foot (0.9 m²) samples
were collected from each plot and each exclosure. The plants were cut to a height of 0.5
inch (1.3 cm). The samples were selected at random by tossing a 1 foot (0.3 m) by 1
foot (0.3 m) frame constructed of 0.75 inch (1.9 centimeters) PVC pipe over the
shoulder (Figure 4).
Figure 4. One foot (0.3 m) by one foot (0.3 m) square constructed of 0.75 inch (1.9 cm) PVC used for selecting forage samples.

15
The samples were weighed before drying using an Ohaus Adventurer Pro
Precision Balance. The samples were then dried utilizing the microwave oven method
(Steevens et al., 1993). A glass of water (¾ full) was placed in the back corner of the
microwave, and the forage sample was placed on a paper plate within the microwave.
The sample was heated for 90 seconds on high. The sample was stirred and then
heated for another 90 seconds. Once the samples were dried, the dry weight of each
sample was recorded. The percent of forage consumed was calculated by using the
mean of the samples taken from each individual exclosure as the control, as it was not
grazed. The percent forage consumed was calculated as:
% . .
. 100
Statistical Analysis
The data were analyzed using the ANOVA procedure of Statistical Analysis
Software (SAS). Data for dry forage weights, moist forage weights, percent moisture,
and percent of the forage consumed were all analyzed separately.

16
Chapter IV- Results and Discussion
The weather during this trial played a vital role in the growth of the plots. The
month of September provided nearly ideal conditions for germination and establishment
of the plots (Table 1). October was a dry month providing less than 1 inch of rainfall.
This could have affected the growth of the plots in a negative way. November and
December showed some relief from the dry pattern and continued to provide mild
temperatures that were conducive for plant growth. Surprisingly, January and February
followed the same pattern; there was plenty of rainfall during the winter months and the
temperatures remained unseasonably mild (Table 1).
Table 1. Local weather records during experiment in 2011-2012.
Month Rainfall (inches) Avg. High Temp (˚F)
Avg. Low Temp (˚F)
Average Daily Temp(˚F)
September 6.20 80 59 69 October 0.93 71 46 59 November 6.15 62 42 52 December 4.25 53 34 44 January 5.13 54 32 43 February 2.81 56 35 46

17
When the plots were harvested there were some visible differences between the
grazed areas and the exclosures, especially in the clover. The forage in the exclosure
had more vertical growth and appeared to be more dense (Figure 5). Throughout the
project, there were numerous observations of wildlife using the plots. There were as
many as 34 turkeys observed feeding throughout the plot at one time, and on any given
day, 5-10 turkeys could be seen. There were also as many 23 deer observed at one
time grazing in the plots. On a regular basis, there were 5-15 deer observed feeding in
the plots, primarily in the early morning and late afternoon hours.
Figure 5. Visual difference between crimson clover in exclosure and grazed plot.

18
Forage Produced and Consumed
The data analysis showed that there was a significant difference (P=0.0114;
Table 2) between the dry weights of the clover and wheat within the grazed plots. As
expected, there was also a significant difference (P=0.0217; Table 2) between the dry
weights of the wheat and clover within the exclosures. The dry clover forage weighed
significantly more than the dried wheat samples in both the grazed plot and the
exclosed areas (Table 3, Figure 6).
Table 2. Summary of ANOVA results for all variables measured in this experiment.
P value
Measured Variable Block Treatments
Forage dry weight of plots (kg/ha) 0.8904 0.0114 Forage dry weight of exclosures (kg/ha) 0.6793 0.0217 Moisture in plot (%) 0.5375 0.1552 Moisture in exclosures (%) 0.6943 0.0122 Amount of plots consumed (%) 0.3026 0.4432 Weight difference plot vs. exclosures (kg/ha) 0.6176 0.0308
Table 3. Summary of means for all variables measured in this experiment.
Measured Variable Crimson Clover Wheat
Forage dry weight of plots (kg/ha) 116.4 aᶧ 61.2 b Forage dry weight of exclosures (kg/ha) 440.3 aᶧ 212.8 b Moisture in plot (%) 32.1 a 26.5 a Moisture in exclosures (%) 31.6 aᶧ 25.1 b Amount of plots consumed (%) 26.7 a 29.1 a Weight difference plot vs. exclosures (kg/ha) 323.8 aᶧ 151.7 b
ᶧWithin rows, means with the same letter are not significantly different by
ANOVA. (P≤0.05).
19
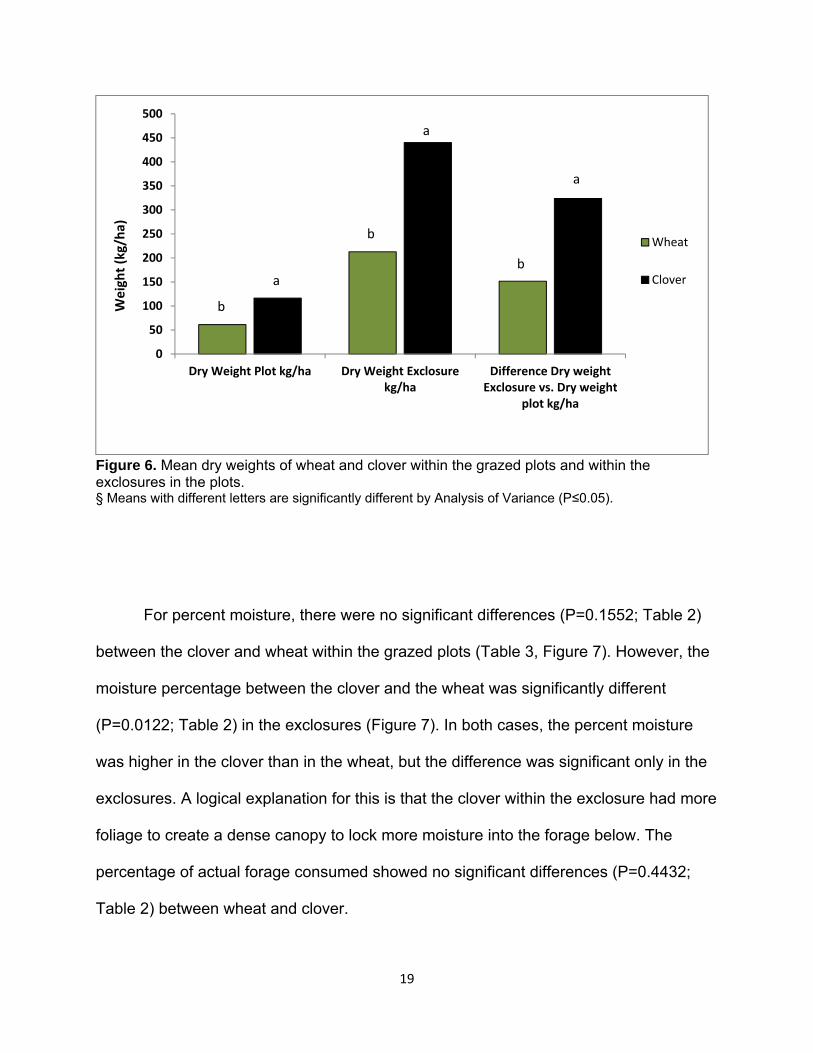
Figure 6. Mean dry weights of wheat and clover within the grazed plots and within the exclosures in the plots. § Means with different letters are significantly different by Analysis of Variance (P≤0.05).
For percent moisture, there were no significant differences (P=0.1552; Table 2)
between the clover and wheat within the grazed plots (Table 3, Figure 7). However, the
moisture percentage between the clover and the wheat was significantly different
(P=0.0122; Table 2) in the exclosures (Figure 7). In both cases, the percent moisture
was higher in the clover than in the wheat, but the difference was significant only in the
exclosures. A logical explanation for this is that the clover within the exclosure had more
foliage to create a dense canopy to lock more moisture into the forage below. The
percentage of actual forage consumed showed no significant differences (P=0.4432;
Table 2) between wheat and clover.
0
50
100
150
200
250
300
350
400
450
500
Dry Weight Plot kg/ha Dry Weight Exclosurekg/ha
Difference Dry weightExclosure vs. Dry weight
plot kg/ha
Wheat
Clover
Weight (kg/ha)
a
b
a
b
b
a

20
Figure 7. Mean percentages of moisture for clover and wheat within the plots and exclosures. § Means with different letters are significantly different by Analysis of Variance (P≤0.05).
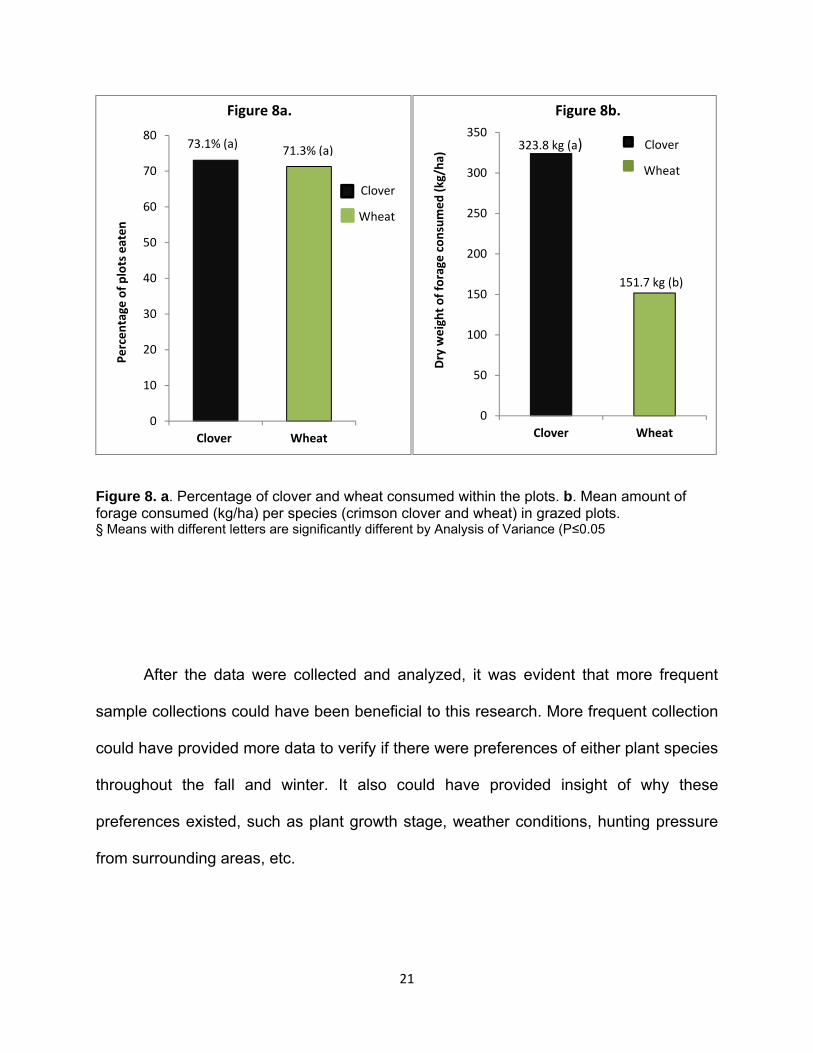
The mean weight difference between the clover and wheat in the plots was
significantly different (P=0.0308; Table 2). The clover plots produced twice as much
forage than the wheat (Figure 8b). However, the percentage of the forages consumed,
surprisingly, was not significantly different (Figure 8a). In the clover plots, 73.1% of the
forage was consumed and 71.3% of the wheat was consumed. This was a higher
consumption rate than was expected as previous studies showed an estimated loss of
only 12% to 14% in production yields due to wildlife browsing (Richer et al., 2005). This
indicates that the area in this study may be overpopulated by wildlife, or other food
sources are not abundant enough to supply the local wildlife the proper amount of
nutrition. In addition, wildlife may have preferred this food source compared to other
sources in the immediate vicinity.
0
5
10
15
20
25
30
35
% Moisture Plot % Moisture Exclosure
Wheat
Clover
a
a
b
aPercentage
21
Figure 8. a. Percentage of clover and wheat consumed within the plots. b. Mean amount of forage consumed (kg/ha) per species (crimson clover and wheat) in grazed plots. § Means with different letters are significantly different by Analysis of Variance (P≤0.05
After the data were collected and analyzed, it was evident that more frequent
sample collections could have been beneficial to this research. More frequent collection
could have provided more data to verify if there were preferences of either plant species
throughout the fall and winter. It also could have provided insight of why these
preferences existed, such as plant growth stage, weather conditions, hunting pressure
from surrounding areas, etc.
0
10
20
30
40
50
60
70
80
Clover Wheat
73.1% (a)71.3% (a)
Percentage
of plots eaten
Clover
Wheat
Figure 8a.
0
50
100
150
200
250
300
350
Clover WheatDry weight of forage
consumed (kg/ha)
Wheat
Clover323.8 kg (a)
151.7 kg (b)
Figure 8b.

22
Cost Analysis
The cost of the food plots was also studied in this project. The clover seed had a
higher input cost at $0.69/kg ($0.31/lb) pure live seed than the wheat at $0.10/kg
($0.05/lb) pure live seed, but with the fertilizer costs included, the cost of the wheat plots
increased to nearly that of the clover. The cost of preparing the plots and cultipacking
was the same for both the wheat and clover. The input cost of the clover was $41.99/ha
($17/acre) and the cost of the wheat plots were $40.54/ha ($16.41/acre) (Table 4).
After collecting the samples in the grazed plots and the exclosure cages, the clover
provided more kg/ha of forage at a more efficient cost. The clover provided 7.7 kg of
forage consumed per $1 of input and the wheat provided only 3.7 kg of forage
consumed per $1 of input cost (Table 4, Figure 9).
Table 4. Seed cost, fertilizer cost, seeding rate, cost of working ground, percent forage consumption, weight of forage consumed, and value of plant species for forage consumed for clover and wheat.
Forage Seed
Cost/kg
Fertilizer cost kg/ha
Seeding Rate (PLS) kg/ha
Cost of discing &
cultipacking per ha
% Plots Consumed
Dry weight of Forage consumed kg/ha
Forage consumed per dollar input kg/$
Clover $0.69 $11.65 33.64 $5.50 73.05 323.84 7.7
Wheat $0.10 $19.04 159.85 $5.50 71.3 151.65 3.7

23
Figure 9. a. Mean amount of clover and wheat consumed within the plots. b. Amount of forage consumed per species (crimson clover and wheat) per dollar of input. § Means with different letters are significantly different by Analysis of Variance (P≤0.05).
0
50
100
150
200
250
300
350
Clover Consumedkg/ha
Wheat Consumedkg/ha
323.84 kg/ha (a) Clover
Wheat
151.65 kg/ha (b)
kg consumed per ha
Figure 9a.
0
1
2
3
4
5
6
7
8
9
Clover Wheat
Figure 9b.
Clover
Wheat
kg consumed
per dollar input
7.7 kg/$
3.76 kg/$

24
Chapter V- Conclusion
With seed companies marketing several expensive food plot seed blends, using
winter wheat or crimson clover in a food plot is a viable option for hunters and wildlife
managers. The individual must first decide if they want to pay less for seed or to provide
more forage for the amount of money spent. In this research, neither crimson clover nor
winter wheat was preferred by wildlife, as the percentage eaten within the plots was not
significantly different. However, crimson clover is the more economical choice to provide
the most available nutrition by mass through the fall and winter months. This research
also showed that agricultural forage producers could expect to lose as much as 70% of
their winter pasture in both winter wheat and crimson clover due to wildlife grazing in an
environment with conditions similar to those in this study.

25
Literature Cited
Beier, P. and D.R. McCullough. 1990. Factors influencing white-tailed deer activity patterns and habitat use. Wildlife Monographs 109:1-51.
Conover, M.R. 1998. Perceptions of American agricultural producers about wildlife on
their farms and ranches. Wildlife Society Bulletin 26:597-604. Dunavin, L.S.1982.Vetch and clover overseeded on a bahiagrass sod. Agron. J. 74:793-
796. Evers, G.W. 1999. Seedling growth comparison of arrowleaf, crimson, rose, and
subterranean clovers. Crop Sci. 39:433-140. Evers, G.W. 2003. Emergence and seedling growth of seven cool-season annual
clovers as influenced by soil pH. J. Sustain. Agric. 23:89-107. Evers, G.W. 2011. Forage legumes: forage quality, fixed nitrogen, or both. Crop Sci.
51:403-409. Evers, G.W. and G.R. Smith. 2006. Crimson clover seed production and volunteer
reseeding at various grazing termination dates. Agron. J. 98.6: 1410-1415. Gordan, I.J., A.J. Hester, and M. Festa-Bianchet. 2004.The management of wild large
herbivores to meet economic, conservation, and environmental objectives. Journal of Applied Ecology. 41:1021-1031.
Gray, P.B. and F.A. Servello. 1995. Energy intake relationships for white-tailed deer on
winter browse diets. Journal of Wildlife Management. 59:147-152. Hamrick, B., and B. Strickland. 2011. Supplemental wildlife food planting manual for the
southeast. Mississippi State University Extension Service, Publication 2111, 2nd edition. http://msucares.com/pubs/publications/p2111.pdf (accessed 29 November 2012).
Harper, C. 2007. Planting chart for wildlife food plots in Tennessee, The University of
Tennessee Agricultural Extension Service, Publication SP 550-A. http://www.huntfish.info/article_uploads/Wildlifefoodplotplantingchart.pdf (accessed 14 March 2012).
Harper, C. 2008. A guide to successful wildlife food plots-blending science with common
sense, The University of Tennessee Agricultural Extension Service, Publication 1769. https://utextension.tennessee.edu/publications/Documents/PB1769.pdf (accessed 11 August 2011).

26
Hossain, Ishrat., F.M. Epplin, and Eugen G. Krenzer. 2003. Planting date influence on dual-purpose winter wheat forage yield, grain yield, and test weight. Agronomy Journal 95 (2003): 1179-1188.
MacGowan, B. and D. Osborne. 2004. Food plots for White-tailed deer, Purdue
University Forestry and Natural Resources, Publication FNR-194. http://www.extension.purdue.edu/extmedia/FNR/FNR-194.pdf (accessed 2 April 2012).
Messner, Timothy C. 2011. White-tailed deer management strategies and domestication
processes. Human Ecology 39 (2011): 165-178. Minnesota Department of Natural Resources. 2010. Wildlife food plots in northern
minnesota. Minnesota Department of Natural Resources. Minnesota Department of Natural Resources. http://files.dnr.state.mn.us/publications/wildlife/wildlife-_food_plots.pdf (accessed 25 March 2012).
Missouri Department of Conservation. 2012. Green browse food plots. MDC Online.
Missouri Department of Conservation. http://mdc.mo.gov/landwater-care/landowners-and-farmers/habitat-development-and-improvement/food-plots/green-browse-fo (accessed 12 April 2012).
Ozoga, J.J. and L.J. Verme. 1970. Winter feeding patterns of penned white-tailed deer.
Journal of Wildlife Management 34:431-439. Richer, M.C., J.P. Ouellete, L. Lapointe, M. Craate, and J. Huot. 2005. Impacts of
White-tailed deer grazing in hay fields of southern quebec. Wildlife Society Bulletin 33. Winter 2005: 1274-1285.
Shelby, Paulus P. 1997. Wheat production in Tennessee. The University of Tennessee
Agricultural Extension Service. The University of Tennessee. Publication 576 http://trace.tennessee.edu/cgi/viewcontent.cgi?article=1042&context=utk_agexcrop&seiredir=1&referer=http%3A%2F%2Fsearch.yahoo.com%2Fsearch%3B_ylt%3DAkpsDfiYyuBRoFUt29wcmu2bvZx4%3Fp%3DShelby%252C%2BPaulus%2BP.%2B2009.%2BWheat%2BProduction%2Bin%2BTennessee%26toggle%3D1%26cop%3Dmss%26ei%3DUTF-8%26fr%3Dyfp-t-701 (accessed 18 February 2012).
Steevens, B., R. Belyea, and R. Crawford. 1993. Using a microwave oven to determine
moisture in forages. University of Missouri Extension, Publication G3151. http://extension.missouri.edu/publications/DisplayPub.aspx?P=G3151 (accessed 3 February 2012).
Stewart, D.W. 1989. Forest management for wild turkeys. Tennessee Wildlife
Resources Agency. Ed Carter. http://www.tn.gov/twra/pdfs/turkeyforestmanage.pdf (accessed 17 January 2012).

27
Swihart, R.K., H.P. Weeks, A.L. Easter-Pilcher, and A.J. DeNicola. 1998. Nutritional condition and fertility of White-tailed deer from areas with contrasting histories of hunting. Canadian Journal of Zoology 76:1932-1941.
Taillon, J., D.G. Sauve, and S.D. Cote. 2006. The effects of decreasing winter diet
quality on foraging behavior and life-history traits of white-tailed deer fawns. Journal of Wildlife Management. 70:1445-1454.
Tennessee Wildlife Resource Agency (TWRA). 2010. Big Game Harvest Report 2009-
2010. Tennessee Wildlife Resources Agency. Ed Carter. http://www.tn.gov/twra/pd-fs/biggamereport.pdf (accessed 13 November 2012).
United States Department of Agriculture, Animal and Plant Health Inspection Service
(USDA-APHIS). 2008. Managing Wildlife Damage to Crops and Aquaculture. Wildlife Services USDA-APHIS. http://www.aphis.usda.gov/wildlife_damage/state_report_pdfs/FY_2008_State_Reports/protecting%20agriculture.pdf (accessed 12 Dec. 2012).
United States Department of Agriculture, Natural Resources Conservation Service
(USDA-NRCS). 2012. Web Soil Survey: Soil data mart. USDA-NRCS. http://websoilsurvey.nrcs.usda.gov/app/WebSoilSurvey.aspx (accessed 10 Sept. 2012).
Virginia Department of Game and Inland Fisheries (VDGIF). 2012. Food Plots. Virginia
Department of Game and Inland Fisheries. http://www.dgif.virginia.gov/habitat/landowners/infosheets/food-plots.asp (accessed 13 Dec. 2012).
Welch, J.G., and A.P. Hooper. 1988. Ingestion of feed and water. In: D.C. Church,
editor, The Ruminant Animal: Digestive Physiology and Nutrition. Prentice Hall, Englewood Cliffs, NJ. p. 108-116.
Williamson County Department of Information Technology (WCDIT). 2011. 2011
Internet mapping with aerial photography. Williamson County Department of Information Technology. http://www.williamsoncounty-tn.gov/index.aspx (accessed 22 April. 2012).

28
Appendix Table A.1. ANOVA table of dry forage weights (Kg/ha) of clover and wheat plots.
Source DF Sum of Squares
Mean Square F Value Pr > F
Block 3 118.38 39.46 0.20 0.8904 Treatment 1 6108.44 6108.44 30.97 0.0114 Error 3 591.76 197.25 Corrected Total 7 6818.58
Table A.2. ANOVA table of dry forage weights (Kg/ha) of clover and wheat in
exclosures.
Source DF Sum of Squares
Mean Square F Value Pr > F
Block 3 8903.45 2967.82 0.56 0.6793 Treatment 1 103469.28 103469.28 19.37 0.0217 Error 3 16021.91 5340.64 Corrected Total 7 128394.64
Table A.3. ANOVA table of moisture percentage for forage of clover and wheat in
grazed plots.
Source DF Sum of Squares
Mean Square F Value Pr > F
Block 3 45.23 15.08 0.89 0.5375 Treatment 1 60.61 60.61 3.57 0.1552 Error 3 50.91 16.97 Corrected Total 7 156.75

29
Table A.4. ANOVA table of moisture percentage for forage of clover and wheat in
exclosures.
Source DF Sum of Squares
Mean Square F Value Pr > F
Block 3 4.50 1.50 0.53 0.6943 Treatment 1 84.50 84.50 29.59 0.0122 Error 3 8.57 2.86 Corrected Total 7 97.57
Table A.5. ANOVA table of forage percentage consumed.
Source DF Sum of Squares
Mean Square F Value Pr > F
Block 3 55.90 18.63 1.92 0.3026 Treatment 1 7.53 7.53 0.78 0.4432 Error 3 29.10 9.70 Corrected Total 7 92.53
Table A.6. ANOVA table of dry forage weights consumed.
Source DF Sum of Squares
Mean Square F Value Pr > F
Block 3 8207.63 2735.88 0.69 0.6176 Treatment 1 59297.07 59297.07 14.88 0.0308 Error 3 11953.21 3984.40 Corrected Total 7 79457.91