A Comparison of Blood Cholesterol Levels and the Intake of ...
64
Eastern Illinois University e Keep Masters eses Student eses & Publications 1998 A Comparison of Blood Cholesterol Levels and the Intake of Dietary Trans Fay Acids in Post- Menopausal Women Bridget Cartwright Eastern Illinois University is research is a product of the graduate program in Physical Education at Eastern Illinois University. Find out more about the program. is is brought to you for free and open access by the Student eses & Publications at e Keep. It has been accepted for inclusion in Masters eses by an authorized administrator of e Keep. For more information, please contact [email protected]. Recommended Citation Cartwright, Bridget, "A Comparison of Blood Cholesterol Levels and the Intake of Dietary Trans Fay Acids in Post-Menopausal Women" (1998). Masters eses. 1760. hps://thekeep.eiu.edu/theses/1760
Transcript of A Comparison of Blood Cholesterol Levels and the Intake of ...

Eastern Illinois UniversityThe Keep
Masters Theses Student Theses & Publications
1998
A Comparison of Blood Cholesterol Levels and theIntake of Dietary Trans Fatty Acids in Post-Menopausal WomenBridget CartwrightEastern Illinois UniversityThis research is a product of the graduate program in Physical Education at Eastern Illinois University. Findout more about the program.
This is brought to you for free and open access by the Student Theses & Publications at The Keep. It has been accepted for inclusion in Masters Thesesby an authorized administrator of The Keep. For more information, please contact [email protected].
Recommended CitationCartwright, Bridget, "A Comparison of Blood Cholesterol Levels and the Intake of Dietary Trans Fatty Acids in Post-MenopausalWomen" (1998). Masters Theses. 1760.https://thekeep.eiu.edu/theses/1760

THESIS REPRODUCTION CERTIFICATE
TO: Graduate Degree Candidates (who have written formal theses)
SUBJECT: Permission to Reproduce Theses
The University Library is receiving a number of request from other institutions asking permission to reproduce dissertations for inclusion in their library holdings. Although no copyright laws are involved, we feel that professional courtesy demands that permission be obtained from the author before we allow these to be copied.
PLEASE SIGN ONE OF THE FOLLOWING STATEMENTS:
Booth Library of Eastern Illinois University has my permission to lend my thesis to a reputable college or university or the purpose of copying it for inclusion in that institution's library or research holdings.
IZ /r 3 / 9? Date
I respectfully request Booth Library of Eastern Illinois University NOT allow my thesis to be reproduced because:
Author's Signature Date
thesis4.form

A Comparison of Blood Cholesterol Levels and the Intake
of Dietary Trans Fatty Acids in Post-menopausal Women (TITLE)
BY
Bridget Cartwright
THESIS
SUBMITIED IN PARTIAL FULFILLMENT OF THE REQUIREMENTS FOR THE DEGREE OF
Master of Science in Physical Education
IN THE GRADUATE SCHOOL, EASTERN ILLINOIS UNIVERSITY CHARLESTON, ILUNOIS
1998 YEAR
I HEREBY RECOMMEND THIS THESIS BE ACCEPTED AS FULFILLING THIS PART OF THE GRADUATE DEGREE CITED ABOVE
DATE

A comparison of blood cholesterol levels and the intake of dietary trans fatty acids in post-menopausal women
by
Bridget Cartwright
Thesis Advisor: Dr. Phyllis Croisant
December 7, 1998

ABSTRACT
The purpose of this study was to examine the correlation between dietary trans
fatty acids and levels of total serum cholesterol, high and low density lipoproteins, and
the ratio of total serum cholesterol to HDL in apparently healthy post-menopausal
women.
Subjects (n = 21) were current members of the Eastern Illinois University Adult
Fitness Program. All were moderately active Caucasian women determined to be post
menopausal and not taking hormone replacement therapy or lipid lowering medications.
Mean age of the subjects was 69.1±9.1 years.
Dietary intakes were assessed with the use of a multiple day food record and
personal interviews. The first was a face to face interview using food models to assess
portion sizes, while two following interviews were done over the telephone. Intake
during one 24 hour period was collected per interview. From the collected data from the
food records, grams of trans fatty acids consumed were determined for each individual.
In addition fasting blood lipid profiles were obtained for each subject through venous
blood samples.
The mean dietary trans fat consumed over the three day period was 51.68 ± 38.45
grams. Lipid profile values were determined for total cholesterol (TC), HDL, LDL, and
HDL/TC ratio. The mean value of total cholesterol (TC) for the 21 subjects was 220.8 ±
40.5 mg/dL. The mean values for HDL and LDL were 51.2 ± 15.3 and 142.6 ± 45.7
mg/dL respectively. The mean HDL/TC ratio was 4.7 ± 1.6. The blood lipid profile
values were correlated to trans fat values. The correlations (r) were calculated as follows:
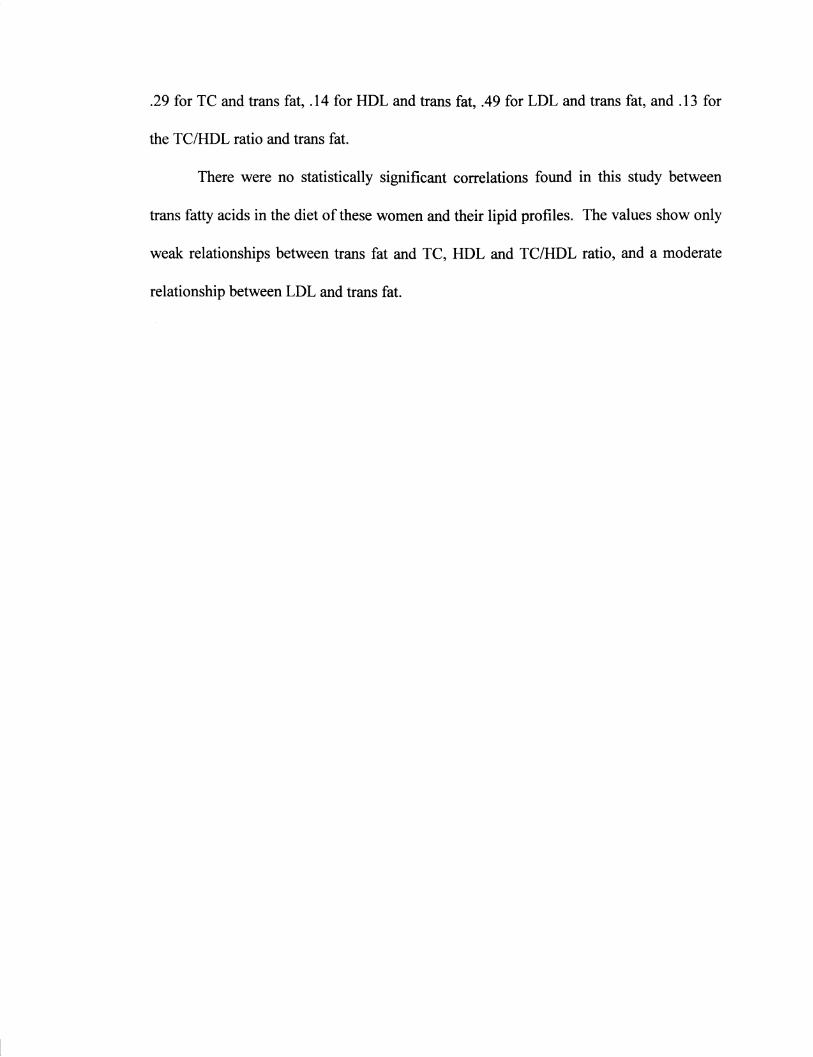
.29 for TC and trans fat, .14 for HDL and trans fat, .49 for LDL and trans fat, and .13 for
the TC/HDL ratio and trans fat.
There were no statistically significant correlations found in this study between
trans fatty acids in the diet of these women and their lipid profiles. The values show only
weak relationships between trans fat and TC, HDL and TC/HDL ratio, and a moderate
relationship between LDL and trans fat.

TABLE OF CONTENTS
Page
List of Tables .................................................................................... ... iii
List of Figures ....................................................................................... iv
Acknowledgments ................................................................................... v
Dedication ............................................................................................ vi
CHAPTER
I. Introduction ..................................................................................... 1
Purpose ........................................................................................ 3
Hypothesis ..................................................................................... 3
Significance ................................................................................... 4
Limitations .................................................................................... 4
Definition of Terms .......................................................................... 6
II. Review of Literature ........................................................................... 9
Metabolism of Trans Fatty Acids ......................................................... 9
Dietary Availability of Trans Fatty Acids ............................................... 11
Effect of Trans Fatty Acids on Serum Cholesterol and Lipoprotein Levels ....... .12
Cardiovascular Disease and Trans Fatty Acids ........................................ .16
III. Methods ........................................................................................ 19
Subjects ...................................................................................... 19
Setting for the Study .............................................................. 19
Target Population ................................................................. 19

Recruitment of Subjects ......................................................... 20
Collection of Data .......................................................................... 20
Blood Lipid Profile ................................................................ 20
Dietary Record ..................................................................... 21
Dietary Assessment Sessions ..................................................... 21
Analysis Procedures ........................................................................ 23
Trans Fatty Acids ................................................................. 23
Total Lipid Profiles ............................................................... 24
Statistical Analysis ................................................................ 24
IV. Results and Discussion ...................................................................... 25
Results ....................................................................................... 25
Population ......................................................................... 25
Trans Fatty Acids ................................................................. 25
Lipid Profiles ..................................................................... 27
Lipid Values vs. Trans Fats Consumed ....................................... 27
Discussion of Results ..................................................................... 30
V. Summary, Conclusion, and Recommendations ..................................... ... 33
References .......................................................................................... 35
Appendix A: Dietary Intake Record Sheet .................................................... 39
Appendix B: Checklist for Dietary Records ................................................. .40
Appendix C: Fatty Acid Profiles of 123 Foods (Dickey and Caughman, 1995) ........ 42

LIST OF TABLES
Page
Table 1: Raw Data Collected for 21 Subjects ............................................. 26
Table 2: Results of Data Analysis .......................................................... .26
l1l

LIST OF FIGURES
Page
Figure 1: Structure of Cis and Trans Fatty Acids (Mensink & Katan, 1990) ........ .2
Figure 2: Total Cholesterol (TC) to Dietary Trans Fat Consumed .................... .28
Figure 3: HDL Level (mg/dL) vs. Dietary trans fat (grams) ............................. 28
Figure 4: LDL Level (mg/dL) vs. Dietary Trans Fat (grams) ........................... .29
Figure 5: Total Cholesterol to HDL ratio vs. Dietary Trans Fat (grams) ............... 29
lV

ACKNOWLEDGEMENTS
The author wishes to express her sincere appreciation to her advisor, Dr. Phyllis
Croisant for her guidance, instruction and motivation in the completion of this paper.
The author also wishes to express her appreciation to Dr. M. Thomas Woodall, Dr. Brian
Pritschet, and Dr. Carol Ries for their valuable guidance and encouragement in the
preparation of this paper. The author would also like to express her thanks to Ms. Lori
Davis and the graduate assistants and exercise leaders who helped in the recruiting of
subjects for this study. I would also like to express my sincere gratitude to both my
mother and father for their motivational words of encouragement throughout the process
of completing this paper. Finally, this paper would not be possible without the
participation of the subjects. Thank you so very much!
v

DEDICATION
This paper is dedicated to David B. Ramsland who has supported me throughout
the process of completing this paper. He is my source of strength and motivation.
Without his encouragement this paper would not have been possible.
Vl

CHAPTER I
INTRODUCTION
Seventy percent of all premature deaths, disabilities, and illnesses in the United
States are associated with dietary risk factors (Gabel, 1992). If Americans were to follow
the United States Health and Human Services recommendations for better nutrition, the
incidence of coronary artery disease (CAD), cancers, stoke, diabetes, atherosclerosis, and
alcohol related illnesses would be greatly reduced (Britt, 1990). However, there is still a
lot to learn about the impact of nutrition information and education on health.
Many studies have emphasized the importance of reducing saturated fats out of
concern for their effect on increasing blood cholesterol levels, and therefore increasing
the risk of CAD. The American Heart Association (AHA) estimates that as many as 11.2
million Americans will develop CAD, but the role, if any, of trans fats in the
development of this disease is unknown (Bullock, 1995). The AHA also states that CAD
risks can be predicted from serum cholesterol and other existing risk factors (as cited by
Dwyer, 1995). However, more recent research has started to focus on foods containing
trans fatty acids, and their effects on cholesterol levels. Naturally occurring unsaturated
fats and oils are composed of a carbon "backbone" (long chains of carbon atoms with
hydrogen atoms attached to them) bonded to an acid group containing a double bond, and
a cis-double bond in the backbone. This means that the double bond in the long chain is
located on the same side (cis) of the carbon backbone as the double bond in the acid
group. Trans-fatty acids on the other hand, are usually formed by a process known as
hydrogenation, or the addition of hydrogen atoms. This process changes the chemical
1

properties of the oil to a solidified fonn for manufacturing and commercial use. When
trans fatty acids are formed, the double bonds then lie on the opposite side (trans) of the
carbon backbone from the double bond in the acid group. (See figure 1, taken from
Mensink & Katan, 1990.) Trans fatty acids can also be synthesized by bacteria in the
rumen of some animals (5% of total trans fats), but their primary origin (95%) lies in the
process of hydrogenation (Enig, 1996).
Cis double bond: olelc acid
Trans double bond: el&Jdic acid
Figure 1. Structure of Cis and Trans Fatty Acids
Note: Cis double bonds produce a bend in the fatty acid molecule which keeps it a liquid oil. When it is converted into a more solid form via hydrogenation, the cis molecules of edible oils straighten out, forming the trans configuration.
Source: Mensink and Katan, 1990.
Products that are high in trans fatty acids include: margarines, many of which
contain 30-50% dietary trans fatty acids (Ostlund-Lindqvist, Albanus & Croon, 1985);
2

baked goods using hydrogenated vegetable oils; french fries and other deep fried foods;
and vegetable shortenings, created to replace lard (Katan, 1994). These trans fatty acids
have physical properties similar to saturated fatty acids, making them rigid rather than
fluid in cell membranes. Therefore, some researchers state that these fats are
metabolized similarly to saturated fats in the human body (Dupont, White & Feldman,
1991).
Due to this potential effect of trans fatty acids on raising blood cholesterol levels,
there is a need to continue research in this area. Hyperlipidemia is one of the primary
risk factors of coronary heart diseases, which are responsible for the greatest number of
adult deaths every year in the United States (ACSM, 1995).
Purpose
The purpose of this study was to examine the correlation between dietary trans
fatty acids and levels of total serum cholesterol (TC), high density lipoproteins (HDL),
low density lipoproteins (LDL), and the ratio of total serum cholesterol to HDL
(TC/HDL) in apparently healthy post-menopausal women.
Hypothesis
There is a positive relationship between the level of trans fatty acids in the diet
and the level of total serum cholesterol, LDL levels, and TC/HDL ratio, and there is an
inverse relationship of dietary trans fatty acids with HDL levels.
3

Significance
The incidence of CAD in the United States is overwhelmingly high, and an
elevated cholesterol level is thought to be one of the primary causes (ACSM, 1995).
Many Americans are aware of the dietary influences of saturated fats, and many have had
first hand experience of being medically advised to switch from butter to margarine as a
healthier alternative. There is evidence to suggest however, that this may not be a more
healthful alternative in preventing adverse affects on the lipid profile of humans. In fact,
there is evidence suggesting that trans fatty acids may not only raise TC and LDL levels,
but they may also lower HDL cholesterol levels (considered to be the "good"
cholesterol), correspondingly increasing the coronary risk ratio depicted by the TC/HDL
ratio ("More on estrogen and lowered heart attack risk", 1995). Because the
consumption of partially hydrogenated fats is almost universal in the United States, the
number of deaths attributable to such fat is likely to be substantial (Willett & Ascherio,
1994). Some researchers feel that federal regulation should require manufactures to
include trans fatty acid content on food labels, and also to reduce or eliminate the use of
hydrogenated fats in consumer products.
Limitations
This study was limited to the female participants of the Eastern Illinois University
Adult Fitness Program who volunteered to participate in the dietary analysis. Therefore,
this study may not be representative of all post-menopausal women, especially sedentary
women. Secondly, the sample size was relatively small, n = 21. Third, many of these
4

women were already conscious of adopting a healthy lifestyle including taking steps to
follow a sensible diet. Fourth, the women in the study who already had diagnosed
hypercholesterolemia, were aware of their condition and thus, may have already modified
their diet accordingly, reducing their total fat intake, and therefore also consuming less
trans fats. Fifth, there are limitations of using food diary record for data analysis. For
example, although subjects are instructed to keep track of their food as they are
consumed, people are probably more likely to write it down at the end of the day, or even
the next morning when foods and portion sizes are not fresh in the memory. Another
problem with the food dietary record is that when people know they have to report what
they are eating on a given day, they may either consciously or subconsciously modify
their diet on that day. A sixth limitation of this study is the fact that as much as 6 months
may have passed between collecting the dietary data and when cholesterol values were
obtained. Another important limitation is that saturated fats were not measured or
controlled for in this study, although they are known to alter cholesterol levels. Lastly,
since trans fatty acids are a relatively new area of concern in the nutritional field,
databases used to analyze these fats are highly limited, and manual data analysis was
required for this study. Enig (1996) found that all of the existing databases, including the
provisional table used for this study, contain some discrepancies in the amount of trans
fat estimated for a single food. For example, "cookies" were estimated the same for each
subject, but in reality there are differences in the amount of trans fat depending on the
brand name of the cookies.
5
Definition of Terms
Cis fatty acids-naturally occurring unsaturated fatty acids in which the long carbon
chain is bent due to the location of the double bonds on the same side of the carbon
backbone.
Coronary Heart Disease or Coronary Artery Disease (CAD)-the terms are used
interchangeably to describe a number of conditions that fall under this classification of
artery or heart diseases such as hardening of the arteries, plaque buildup in the arteries of
the heart, angina (chest pain), and hypertension.
High Density Lipoproteins (HDL)-type of cholesterol containing lipoprotein in the
blood which has been found to be a risk factor for heart disease. This lipoprotein is often
called the "good cholesterol" because higher values of HDL are associated with lower
CAD risk.
Hydrogenation-process involving the addition of hydrogen atoms to unsaturated fats
to make them more solid. The process causes the formation of a double bond in the
trans formation, or opposite sides of the fatty acid chain, verses cis-fatty acids in which
the double bond is located on the same side of the fatty acid chain, which is how they
exist naturally.
Hypercholesterolemia-the condition of having high blood cholesterol, usually defined
as over 200mg/dL.
6
Hypercholesterolemic-having a blood cholesterol raising effect.
Isomeric fatty acid-commonly used to refer to unsaturated fatty acids which exist in
either the cis or the trans configuration.
Lipid profile, Total Lipid profile, or Lipoprotein profile--determined by taking a
fasting venous blood sample. The profile includes measures of total cholesterol, HDL,
LDL, and triglycerides. These four values make up the lipid profile. (TC/HDL ratio can
then be determined mathematically.)
Low Density Lipoproteins (LDL)-type of cholesterol containing lipoprotein in the
blood that has been found to be a risk factor for CAD. This lipoprotein is labeled the
"bad cholesterol" because higher values are associated with higher risk of CAD.
Monounsaturated fat-fatty acids with only one double bond found along the carbon
chain (Hoeger & Hoeger, 1992).
Polyunsaturated fat-fatty acids with two or more double bonds found along the
carbon chain (Hoeger & Hoeger, 1992).
Saturated fat-fatty acids with carbon atoms fully saturated with hydrogen atoms,
therefore only single bonds link the carbon atoms on the chain.
7

Total serum cholesterol (TC)--total amount of cholesterol in the blood. TC has been
determined to be a risk factor for heart disease. Lower values have been associated with
lower risk of CAD, any value under 200mg/dL is considered normal.
TC/HDL ratio or Coronary Risk Ratio-a ratio calculated by dividing the total
cholesterol value by the HDL value. This quotient has been established as a predictor of
CAD; a ratio of less than 4 is considered desirable, and higher values are associated with
a higher risk of CAD.
Trans fat or trans fatty acids-a byproduct formed by the process of hydrogenation, in
which unsaturated vegetable oils are solidified for manufacturing and commercial use.
Double bonds in these fatty acids are on opposite sides of the carbon chain (Hoeger &
Hoeger, 1992).
8

CHAPTER II
REVIEW OF LITERATURE
An individual's diet is linked to serum lipid levels, high blood pressure, and other
risk factors of CAD. According to Shrapnel, et al.(1992) changes in the typical diet may
have contributed to a fall in CAD risk and mortality. Through dietary changes it may be
possible to decrease the risk of certain diseases. The current interest in reducing heart
disease risk involves attention to total fat, saturated, monounsaturated, polyunsaturated,
and trans fatty acids, as well as to dietary cholesterol, soluble fiber, salt, alcohol, and
other dietary constituents as well (Dwyer, 1995). This chapter will review the existing
literature on the metabolism and dietary availability of trans fats, and their relationship to
blood lipids and lipoprotein levels, in addition to their role in CAD risk.
Metabolism of Trans Fatty Acids
The distribution and levels of trans fatty acids in rat tissues have been reported to
be influenced by the diet (Ostlund-Lindqvist et al., 1985). In their research, they found
that when rats were fed trans fatty acids, their phospholipids were affected, and contained
these trans fatty acids in them. Another study using rats was conducted by two
biochemists at the Technical University of Denmark, H<j>y and H<j>lmer (1990). This
study used seven groups of 8 rats fed different combinations of oils in their diets to
examine the influence of linoleic acid (a cis fatty acid) and trans fatty acids on the fatty
acid profile in these animals as determined by autopsy. Trans fatty acids were found in
various organs of the rats, particularly the heart and liver. This is an important finding
9
because rat tissues have been established by research to behave similarly to human
tissue. Trans fatty acids have physical properties like saturated fatty acids, making them
rigid rather than fluid in cell membranes, and thus believed to act like saturated fats in
the human body. Saturated fats have been determined by research to have a strong
influence on CAD.
One study by Wood, et al.(1993) used 40 Texas A & M healthy male faculty
members, aged 30-60 years, to examine the effects of two margarines on serum lipids
and lipoprotein levels. One of the margarines contained zero trans fatty acids and the
other contained 29% trans fatty acids. This was done using five diet periods of 6 weeks
each, with a 6 week wash out in between each diet period. The results of the study
showed that the margarine with no trans fat lowered total cholesterol and LDL levels
significantly with no change in HDL levels; but the trans fat margarine did not change
serum cholesterol, LDL, or HDL levels. The data indicate that trans fatty acids were not
metabolically equivalent to the naturally occurring cis isomers, and that margarines
containing trans fats did not alter the serum lipid profile positively (Wood et al., 1993).
The structure of trans fatty acids suggests that they are metabolized like saturated fatty
acids. They are absorbed and stored, transported and oxidized for energy similar to other
dietary fatty acids (Dupont et al., 1991). For a number of decades scientific research has
established the dietary risk associated with CAD and blood cholesterol levels.
According to Fred A. Kummerow (cited in Beardsley, 1991), a food scientist at the
University of Illinois at Urbana-Champaign, "trans monounsaturates act in the body like
saturated fats" indicating the need to address these fats for dietary concern.
10

Dietary Availability of Trans Fatty Acids
In order to perform research on the dietary influence of a substance, it is helpful to
establish the dietary availability of that substance. Foods have been analyzed chemically
to determine their trans fat content. The problem however is not determining exactly
how much trans fat is in food, but rather determining exactly how much is being
consumed. Beginning in the 1950' s the food industry has capitalized on its ability to turn
liquid oils into solid fats (Enig, 1996). Since the l 960's there has been a gradual decline
in butter sales with a subsequent increase in margarine sales, partially reflecting
consumer efforts to reduce saturated fat intakes and increase polyunsaturated fat intakes
for health purposes. This increase in hydrogenated polyunsaturated fats indicates the rise
in products that are being consumed which contain trans fatty acids (Hunter &
Applewhite, 1986). According to Katan, Zock, and Mensink (1995) many people eat no
more than a few grams per day, which they believe would produce only modest effects
on lipoprotein concentrations. The estimation of the amount of trans fatty acids
consumed in the dietary studies reviewed varied considerably. According to Panigrahi &
Sampugna (1993), the average dietary intake in the U.S. has been estimated to be
anywhere between 7.6 and 13.3 grams (g) of trans fat per person per day. Hunter and
Applewhite (1991) increased their dietary estimate from 7 .6g/person/day in their 1984
study to 8.1 g/person/day in 1991. The Federation of American Societies for
Experimental Biology (F ASEB) predicted 8.3 g/person/day (Hunter & Applewhite,
1991). Enig, Atal & Sampugna, (1990) believe that the estimated amounts used in most
studies are too low. They stated that most Americans consume a mean of 19.3
11

g/person/day of trans fats. They indicated that for health considerations, an intake of 8
g/person/day or less should be recommended.
Effect of Trans Fatty Acids on Serum Cholesterol and Lipoprotein Levels
Recent research has focused on the dietary impact of dietary trans fatty acids on
total serum cholesterol, LDL, and HDL levels. According to Katan, et al. (1995) trans
isomers of oleic acid lower HDL and raise LDL. One representative study that raised
much awareness was "The Dutch study". This study reported remarkable elevations in
serum cholesterol and LDL levels with higher trans fat intake, but the most important
finding was a notable decline in HDL levels. The subjects used in the Dutch study,
conducted by Mensink and Katan (1990) were 34 women (mean age 26 years) and 25
men (mean age 25 years), all apparently healthy. The subjects all followed three
different diets for three weeks each, with no wash out period in between the different
diets. The diets were identical except that 10-11 % of the daily energy intake was
provided by: (diet 1) oleic acid with one cis double bond; (diet 2) trans isomers of oleic
acid; and (diet 3) saturated fatty acids. The results of the study showed that trans fatty
acids were hypercholesterolemic as compared to the cis oleic acid, and that the
hypercholesterolemic effect of the trans oleic acid was about half of that of the saturated
fat diet. Both total serum cholesterol and LDL levels also were elevated in diets 2 and 3
above, but the effect of trans fatty acids on the lipoprotein profile was even more
unfavorable than this finding suggests. The level of HDL was lowered in the trans fat
diet, causing the ratio of total cholesterol/HDL to be nearly double that of the saturated
12
fat diet. The Dutch study was criticized for the amount of trans fatty acids that they used
in the diet. The subjects consumed 34g/person/day, which is about two to four times the
estimated average daily intake cited in other literature (Judd et al., 1994). However, they
have also been commended by others for their methodology and procedures used in this
study ("The trouble with margarine", 1991 ). In addition McKeigue ( 1995) criticizes the
Dutch study for relying on self-reported dietary data rather than biological markers such
as adipose tissue concentration.
A number of studies were done in response to these findings, and many of them
have observed similar results. The researchers of the Harvard study, Willett and
Ascherio ( 1994) also concluded that trans fats are even more harmful than saturated fats.
Their conclusion was based on the evidence determined from the Dutch study,
particularly the finding of the doubled value of the TC/HDL ratio. Nestel, et al. (1992)
used 26 mildly hypercholesterolemic men put on a series of dietary periods varying the
amount of trans fatty acids that were present in the diet from low to moderate to high
intakes in random order with washout periods in between. The results of the study did
not confirm a rise in total cholesterol and LDL levels, but they did show a decline in
HDL levels and subsequently an increase in the CAD risk ratio. Troisi, Willett, and
Weiss (1992) who studied 748 men aged 43-85 years, used a multiple-linear-regression
analysis to adjust for age, body mass index, waist to hip ratio, circumference index,
smoking status, physical activity, alcohol consumption, total energy, dietary cholesterol,
linoleic acid intake, and previous serum cholesterol concentration. They concluded that
trans fatty acids were directly related to total serum cholesterol and LDL levels, and
inversely related to HDL cholesterol. The TC/HDL ratio also was positively associated
13

with trans fatty acid intake as seen by an increase from a ratio of 4.4 at a 2.lg/person/day
intake to a ratio of 4.9 for subjects consuming 4.9g/day. All of the above results were
found to be statistically significant. Although both of these values are fairly low values
of consumption, the significant increase in trans fats, corresponds to a significant
increase in the coronary risk ratio.
Mensink and Hornstra (1995) reported the results of an analysis of 38 men
following two diets for six weeks each in random order. The first diet was a Western
type diet in which trans fat content equaled 4.7g/person/day, which was followed by a 3
week wash out period. The subjects then consumed a modified diet in which trans fat
content equaled 2. lg/person day and 70% of the fat intake of the first diet was replaced
by palm oil, a naturally occurring cis-unsaturated fat. Although the trans fat diet still
only consisted of 4.7g/day, a relatively low value, the results showed a significantly
higher level of serum triacylglycerols and platelet phospholipids on the trans fat diet, as
compared to the cis fat diet.
Zock and Katan (1992) compared the effects of linoleic acid (a cis fatty acid) and
its hydrogenated products elaidic (a trans isomer), and stearic acid (which has a lower
concentration of trans fatty acids) on serum lipoprotein levels in humans. Twenty six
men and 30 women, all apparently healthy, followed the three experimental diets
(linoleic, elaidic, and stearic) for 3 weeks each in random order using a multiple
crossover research design. Fasting lipid profiles were drawn at the end of each dietary
period. The mean LDL level rose from 109 ± 24 mg/dL while on the linoleic diet to 116
± 27 mg/dL on the stearate diet (an increase of 7 mg/dL), and to 119 ± 25 while on the
trans fat diet (an additional increase of 4mg/dL). HDL cholesterol decreased by 2mg/dl
14

from the linoleic diet to the stearate diet, and an additional decrease of 4mg/dL on the
trans fat diet. These findings showed that trans fatty acids in the diet significantly
decreased HDL cholesterol and raised LDL cholesterol relative to the linoleic acid diet.
All of the above studies have shown dietary trans fatty acids to produce an
increase in LDL and/or a decrease in HDL levels of subjects. This would indicate that
the overall effect of trans fatty acids on lipid profiles is likely to be unfavorable. Other
studies, however, did not confirm these results. One study used a Latin square design,
where 29 men and 29 women aged 25-65 years consumed controlled diets of low,
moderate, and high trans fat contents, and a fourth diet consisting of saturated fats (Judd
et al., 1994). LDL cholesterol increased proportionally to increased trans fats, but HDL
did not change from the low to the moderate trans fat diets, and decreased slightly on the
high trans fat diet. None of the diets, however altered cholesterol levels to the extent that
the saturated diet did. Most people consume fewer grams of trans fatty acids than
saturated fat, and therefore trans fats may only have modest effects on lipoprotein
concentrations. Judd et al. (1994) felt, however that there is enough evidence to suggest
that trans fatty acids do differ metabolically from their cis fatty acid counterparts, and
may effect serum cholesterol and lipoprotein levels adversely.
Another similar study by Nestel, et al (1992) published in the Journal of Lipid
Research used a double blind comparison of four separate diets. They concluded that 3
weeks of consumption of trans fatty acids at about 7% total energy (which they believe to
be about twice the Australian average) did not significantly change LDL cholesterol
levels over other diets examined in the study.
15

Cardiovascular Disease and Trans Fatty Acids
In both men and women, cardiovascular disease is the number one cause of
premature death and disability in the United States. Total serum cholesterol is a primary,
independent risk factor for heart disease (ACSM, 1995). In addition, high LDL levels
and/or low HDL levels are also associated with risk of CAD. The coronary risk ratio is
determined by the value of total serum cholesterol divided by the HDL level, and is
thought to be a valuable predictor of CAD (ACSM, 1995). Substantial data support the
notion that the trans fatty acids contained in partially hydrogenated vegetable oils
adversely affect the risk of CAD (Ascherio & Willett, 1995). According to Lichtenstein
(1993), the consumption of hydrogenated vegetable oils rather than unhydrogenated
vegetable oils may negatively influence the plasma lipids and risk of CAD. Willett, et al.
(1993) conducted the Nurses' Health Study, in which 85,095 registered nurses completed
dietary questionnaires. These questionnaires were then used to evaluate the influence of
trans fatty acids on CAD. The subjects had no history of diagnosed CAD, stroke,
diabetes, or hypercholesterolemia at the beginning of the study in 1980. The amount of
trans fats they were consuming were estimated using values obtained by Enig, Pallansch
& Keeney (1983) and Slover et al. (1985). During 8 years of follow up, those women
who were consuming approximately 4.0 g/day of trans fats were 50% more likely to
develop CAD than those women who were consuming 2.4g/day. There were 431 new
cases of CAD measured by non-fatal myocardial infarctions or death caused by CAD.
These findings supported the hypothesis that the consumption of partially hydrogenated
16

vegetable oils, or foods that are major sources of trans isomers, is associated with a
higher risk of CAD.
Troisi et al., (1992) conducted a cross-sectional study of 748 men aged 43-85. A
semi-quantitative food frequency questionnaire was used to assess dietary intake. The
results determined that trans fatty acids were associated with an adverse lipoprotein
profile, and an increased incidence of myocardial infarction. Trans fatty acids were
positively related to LDL level and inversely related to HDL level. Trans fatty acid
intake was positively related to TC/HDL ratio, and directly related to total serum
cholesterol and LDL level. Troisi et al. (1992) reported that this effect on the TC/HDL
ratios would correspond to a 27% increase in the risk of myocardial infarction.
Reviews by the National Research Council, and the Canadian Scientific Review,
however, found that trans fatty acids posed little cardiovascular risk at current levels of
intake (Shrapnel et al., 1992). Margaret A. Flynn, a nutritionist at the University of
Missouri, conducted a dietary experiment with 71 faculty members. Those who usually
consumed butter were asked to switch to margarine, and vice-versa. She found that it
made no difference in cholesterol levels whether the subjects consumed the saturated fats
contained in butter or the hydrogenated trans fats contained in margarine (as cited in
Beardsley, 1991). Emken, Hudgins and Hirsch (as cited in Beardsley, 1991) published a
study in the American Journal of Clinical Nutrition which found no association between
levels of trans fats in human adipose tissue and their cholesterol profiles. They suggest
that trans fats are not a major threat to most people.
In summary, it appears that there is a great deal of evidence to suggest that there is
a need for further investigation of trans fatty acids. Although the evidence is not
17

unanimous, there is certainly enough evidence that suggest that trans fatty acids in the
diet certainly may pose a threat to the health of Americans, and this issue needs to be
addressed.
18

CHAPTER III
METHODS
The description of subjects, the collection of data and the analysis procedures are
explained in this chapter.
Subjects
Setting for the Study
The subjects for this study were recruited from the Eastern Illinois University
Adult Fitness Program which is sponsored by the Physical Education department at EIU,
located in Charleston, Illinois. This program is available to all apparently healthy adults
over the age of 21 who are interested in increasing their cardiovascular endurance,
muscular strength, and muscular endurance. Supervised exercise is administered in a
structured environment. Subjects for this study were recruited from the program on a
voluntary basis.
Target Population
The target population was post-menopausal, apparently healthy women as
determined by their health history questionnaire, medical screening and evaluation. To
be considered post-menopausal, subjects must have been without menses for at least one
year. Women were eliminated from the subject pool if they were current cigarette
smokers, diabetic, or sedentary. Women taking medications such as post-menopausal
hormone replacement therapy (HR T), antihyperlipidemic agents, or any drug that may
19
alter blood lipid levels as determined by the Physician's Desk Reference were also
eliminated from participation in the study.
Recruitment of Subjects
Subjects were recruited in three ways. First, the researcher called the potential
subjects on the telephone to encourage them to participate in the study. Second, a sign
was posted at the exercise site to encourage interest from prospective subjects to have a
"nutritional analysis" done. Third, exercise leaders verbally encouraged members to
partake in a nutritional study if they were post-menopausal women.
Twenty three women who met all criteria were recruited as subjects for this study.
Two subjects were eliminated during the study, one because she was following a very
strict, rapid weight loss diet during the time of dietary collection. The second was
eliminated because no blood results were obtained for that subject.
Collection of Data
Blood Lipid Profile
The subjects received regular fasting blood lipid profiles as part of their
membership in the adult fitness program, the most recent of which was used to determine
their total serum cholesterol, LDL, HDL and TC/HDL ratio for this study. The screening
used for this study was a maximum of 6 months from the date of their dietary data
collection.
20

Dietary Record
A three day dietary intake diary was used for the analysis. Two weekdays and one
weekend day were used, and subjects were encouraged to pick the most typical days to
record. If they engaged in a weekly event involving food (such as dinner out after church
every Sunday, or a Thursday night card group where snacks are served) they were
encouraged to use that for one of their three days. (A sample of the record sheet used is
displayed in Appendix A.) Special attention was paid to what and how much was eaten,
where the food was eaten, name brands, principal ingredients, whether foods were
homemade or commercial, properties of the foods consumed such as stick, tub, whipped,
etc., and whether the foods were imitation, reduced calorie, or fat-free products. (See
Appendix B for the Checklist for Dietary Records used to help subjects keep accurate
food diaries.)
Dietary Assessment Sessions
The first day of data collection was recorded via a face to face interview with the
researcher, which took approximately 30-45 minutes. For this original interview the
researcher went to the subject's home if possible. This way the subject might feel more
comfortable with the interview, and in many cases were able to present the actual food
packages for the researcher to examine labels, as well as the bowl or cup the subjects
used. This enabled the researcher to more accurately assess the food products, brand
names and food portion sizes. Only five subjects did not have this face to face interview
in their home. Two of the subjects met the researcher in the Adult Fitness program
office, and the other three met the researcher at a public meeting spot. In these five
21

cases, more time was spent discussing brand names, principle ingredients, recipes
followed, food properties and portion sizes. Food models and size of fist or palm of
hand were used as visual cues to help determine portion sizes. The same models were
used for every subject. Information for the second two days were collected through
telephone interviews of 10-15 minutes each, in which the researcher made references
back to models used and the fist and palm size. The subjects were instructed to write
down everything that they put into their mouth on the chosen days, and did so prior to all
of the interviews, including the first face to face interview. Subjects were not told what
in their diet was being examined, nor were they made aware that their lipid profile was of
any significance prior to dietary collection. The same researcher conducted all of the
interviews.
A traditional multi-day diet record was used since it has been found to provide
valid assessments (Block, 1986). There are a number of strengths to using this method
of assessment for dietary studies. First, it is usually fairly representative of an
individual's typical diet. Second, it does not require a great deal of time, although more
than a food frequency questionnaire, to collect the dietary data. Third, it allows for great
variety of foods in the diet. Since subjects are not forced to pick from a list of foods,
they can report exactly what was eaten. This method was chosen over the 24 hour
dietary recall method, which may not provide a valid reflection of an individual's diet
(Block, 1986).
22

Analysis Procedures
Trans Fatty Acids
The trans fatty acid content of each subject's diet was analyzed manually, using
the fatty acid profiles developed (but not published) by Dickey and Caughman (1995)
from the Food Safety and Inspection Service and the Centers for Disease Control and
Prevention. This is a list of 123 food sources with grams of trans fatty acids per 100
grams of food determined (Appendix C). For the subjects interested in receiving
nutritional feedback from their participation in the study, further nutrient analysis was
done afterwards. For many of the foods consumed by the subject the researcher asked
for the name brands and properties of the foods, and was then able to go the grocery store
to examine the food labels more closely for fat content and primary ingredients. For
example, if "Fleshman's stick margarine" was consumed, the researcher was able to
determine that "com oil" was the primary oil used by that manufacturer, and could then
make the proper choice on the fatty acid profiles in regard to their trans fat content.
Some foods which were absent from the list completely, were substituted by the most
similar food found on the list such as using 2 slices commercial white bread for a
commercial white hamburger bun. Other foods that were absent from the list, like
commercial peanut butter, was estimated using the summation of fat technique. This was
done by taking the total fat grams minus the saturated, monounsaturated, and
polyunsaturated gram amounts. The remaining "unaccounted for" grams was used as the
estimate of the trans fat grams. The same substitution was used for every subject for
consistency.
23

Total Lipid Profiles
All subjects underwent a fasting lipid profile test to determine their total lipid
profile levels. Blood was drawn intravenously and analyzed at the Sarah Bush Lincoln
Health Center laboratory in Mattoon, IL. Subjects were asked to be fasting for 14 hours
prior to the blood test. LDL values were not received for two subjects, but all other
values were complete. For those two subjects their data was omitted from the LDL
statistical calculations and graphs, and n = 20 was used. (See Table 1, subjects 8 and
20).
Statistical Analysis
A direct correlation method was used. The three day total for grams of trans fats
consumed by each subject was correlated to: (a) total cholesterol (TC); (b) HDL level;
(c) LDL level, all measured in mg/dL; and (d) TC/HDL ratio.
24

CHAPTER IV
RESULTS AND DISCUSSION
The purpose of this chapter is to present the results of the data compiled in this
study, and includes a discussion of the results.
Results
Population
All of the subjects (n=21) were moderately active, post-menopausal, Caucasian
women. The mean age of the subjects was 69.l ± 9.1 years. The youngest subject was 54
and the oldest subject was 86. Moderately active is defined for the purposes of this study
as participating in at least 20 minutes of continuous aerobic activity, an average of three
days a week. All of the subjects had been members of the adult fitness program for at
least a year, many for much longer.
Trans Fatty Acids
Using the fatty acid profiles established by Dickey and Caughman (1995), shown
in Appendix C, the consumption of trans fatty acids were manually calculated for the
three days of diet for each subject (Table 1). The mean 3 day total for all subjects was
51.4 ± 38.7 grams (Table 2), or 17.1 ± 12.9 g/day. The highest 3 day value was 157.5
grams (52.5 g/day) and the lowest value was 7.8 grams (2.6 g/day).
25

Table 1: Raw data collected for 21 subjects
SUBJECT AGE Trans Fat TC HDL LDL TC/HDL (years) (3 dav total) (m2/dL) (mg/dL) (m2/dL) Ratio
1 79 7.83 244 34 141 7.2 2 78 17.40 175 39 122 4.5 3 66 22.36 215 35 133 5.6 4 62 22.63 187 52 118 3.6 5 61 23.59 204 44 148 4.6 6 81 26.12 181 70 99 2.6 7 70 27.15 176 39 122 4.7 8 65 32.34 286 44 unknown 6.5 9 55 33.05 176 73 96 2.4 10 77 35.01 204 48 134 4.3 11 68 35.27 205 30 134 6.8 12 65 38.48 283 51 202 5.5 13 76 39.39 227 66 140 3.4 14 86 50.88 290 60 204 4.8 15 84 56.11 243 76 149 3.2 16 64 71.28 145 46 89 3.2 17 60 75.55 228 67 151 3.4 18 54 92.82 239 43 158 5.6 19 68 96.22 238 45 170 5.3 20 67 124.29 215 80 unknown 2.7 21 65 157.52 274 34 200 8.1
Table 2: Table of Results
VARIABLE MEAN STANDARD CORRELATION DEVIATION (with Trans fat)
Age 69.l 9.1 -----Trans fat 51.7 38.5 -----
TC 220.8 40.5 .29 HDL 51.2 15.3 .14 LDL 142.6 45.7 .49
TC/HDL Ratio 4.7 1.6 .13
26

Lipid Profiles
Total Cholesterol (TC) for all subjects ranged from 145 mg/dL to 290 mg/dL
(Table 1 ). The mean ± standard deviation was determined to be 220.8 ± 40.5 mg/dL.
HDL values ranged from 30 mg/dL to 80 mg/dL with a mean of 51.2 ± 15.3 mg/dL. LDL
values ranged from 89 mg/dL to 204 mg/dL, with a mean of 142.6 ± 45.7 mg/dL. The
ratio of TC/HDL was calculated for each subject and the mean value was 4.67 ± 1.60.
The lowest value was 2.4 and the highest was 8.1.
Lipid Values vs. Trans Fats Consumed
A direct correlation method was used to determine: (a) total cholesterol
(TC) vs. trans fats consumed, r = 0.29; (b) HDL level vs. trans fats consumed, r = 0.14;
( c ); LDL level vs. trans fat consumed, r = 0.49; and ( d) TC/HDL ratio vs. trans fats
consumed, r = 0.13 (Table 2). None of these correlations were found to be statistically
significant, but the trendline of the following graphs (Figures 2,3,4, and 5) does indicate
that all results did have a positive relationship, including the HDL level verses trans fats
which was hypothesized to be an inverse relationship, and as many of the studies
reviewed also indicated. LDL levels showed only a moderate relationship with dietary
trans fat, and the rest of the correlations indicated low to very low relationships. The
calculations, graphs, and trendlines in the following figures were done using Microsoft
Excel, part of the Microsoft Office software used in Windows 95.
27

r= .29
300 • • • • ~ 2~ !· • • .. -Cl • E + •• • - 200 - • ~ .... • I '~ f • <3 100 iii - 50 0 I-
0 0 5 10 15 20 25
Trans Fat (grams)
Figure 2. Total Cholesterol (TC) to Dietary Trans Fat (grams)
80 • •• • r= .14
70 • • - 60 • ..J -'tl • Ci 50 - I §. •• • # Qi 40 •• > GI •• • ..J 30 • ..J 0 :I: 20
10
0 0 50 100 150 200
Trans Fat (grams)
Figure 3. HDL Level (mg/dL) vs. Dietary Trans Fat (grams)
28

250 r= .49
200 •• • ::J' :E en 150 §.
~ ~ 100 •• _, • c _,
50
0 0 50 100 150 200
Trans Fat (grams)
Figure 4. LDL Level (mg/dL) vs. Dietary Trans Fat (grams)
r = .13
9 8 • 7 • ,
0 ;I 6 ll • • ~ _, 5 .... • c 4 ::c • • • , 0 3 I- •• • 2
1 0
0 50 100 150 200
Trans Fat (grams)
Figure 5. Total Cholesterol to HDL ratio vs. Dietary Trans Fat (grams)
29

Discussion of Results
Dietary factors are associated with approximately 70% of all premature deaths,
disabilities, and illnesses in the United States (Gabel et al., 1992). Following the
guidelines recommended by the U.S. Health and Human Services for better nutrition is
important towards lowering this risk. Saturated fat has been established by research to
account for increased health risks, and many guidelines and recommendations now exit
in regards to the human consumption of saturated fats. The speculations and new
findings about trans fatty acids require further research to determine the roll of trans fatty
acids upon health risk, and recommendations for their consumption need to be
established.
Most research that has been done on the consumption of trans fatty acids as
reviewed in Chapter 2, has examined a change in the blood lipid profile based on some
alteration in the diet made by researchers, or the subjects were to follow a carefully
controlled diet for a set period of time. This study, on the other hand, used a descriptive
design looking at what these subjects were already eating, attempting to see if there was
any correlation between dietary consumption of trans fatty acids and cholesterol levels.
In addition, saturated fat was not controlled for or even measured in any way in this
study. Thus, one factor established by research to affect cholesterol levels was not
examined in this study. A stronger correlation may have been seen between saturated
fats and the lipid profiles, than what was shown between trans fats and lipid profiles.
This limitation to the study could falsify any data found. But, since none of the
correlations were found to be statistically significant, it seems pointless to examine
saturated fats more closely at this time. Again, this presents a need for further research.
30

Subjects in this study consumed from 7.8 grams to 157.5 grams of trans fats over
the 3 day period (or 2.6 to 52.5 grams per day). The mean consumption of trans fats for
3 days was found to be 51.7 g ± 38.5 (or a mean of 17.2 g/day). These values are close
to the mean consumption established by Enig et al. (1990), of 19.3 g/day. However,
based on Enig et al. (1990), the recommended dietary value of trans fatty acids should be
8 g/day. Even though the subjects ofthis study are likely more diet and health conscious
than the population in general, as determined by the program participation and their
health histories, yet most were still eating far more than this recommended value.
A moderate relationship of dietary trans fats with LDL level was found in this
study. Most of the other studies reviewed in Chapter two found stronger correlations
between lipid values and dietary trans fats consumed. Several of the studies showed an
elevation of LDL cholesterol levels, and a decline in HDL cholesterol levels which were
statistically significant.
The results of this study indicate a number of things. First, that substitution of a
food source containing partially hydrogenated vegetable oils instead of saturated fat (as
in switching from butter to margarine) for reasons of lowering cholesterol levels and
consequently ones risk for CAD, may not be effective. Too much trans fatty acids in the
diet may or may not contribute to CAD. There is no indication in this study that they are
either worse or better for your health. Since the subjects in this study were not asked to
modify their diet in any way, a difference in blood lipids was not depicted for two diets
in the same individual, although this may have proved to provide more useful findings.
Secondly, no dietary controls were placed on the subjects. For example, controlling for
the amount of saturated fats each individual had consumed. This too may have proved to
31

provide more useful findings. Third, the need for further research is pertinent, as is the
need to inform consumers about the health speculations of these fats and label foods
appropriately. Currently the FDA does not require manufacturers to label how much of
these trans fats are in the foods that they package and sell, although it is already required
in Canada.
32

CHAPTERV
SUMMARY, CONCLUSIONS, AND RECOMMENDATIONS
The purpose of this study was to examine whether there was a relationship
between dietary trans fatty acids and blood cholesterol levels in apparently healthy, post
menopausal women. A dietary record was used over a three non-consecutive day period
to determine trans fat consumption of the subjects. The three day trans fat values were
correlated to fasting lipid profiles for each of the subjects in the study. No statistically
significant correlations were found.
The results of this study did not show that trans fatty acids are harmful to human
health when consumed in the diet, as saturated fats are. None of the findings in the study
were statistically significant and only a weak to moderate (as with LDL) positive trend
could be seen in the data, suggesting only the possibility of a relationship. As previously
discussed, the methodology used in this particular study was inadequate to show
significant results. However, if a different research design had been used, there may have
been more dramatic and statistically significant results. It is very difficult to control
human behavior for experimental purposes and in particular when it comes to controlling
diet, especially in a free-living environment. This is why the researcher did not choose to
have the subjects alter their diet in a controlled manner, but merely to conduct somewhat
of a pilot study, and hopefully convey the need for future research which is the most
important finding that this study can report. Contrary to the hypothesis of this study, it
reports no effect between dietary trans fat levels and blood cholesterol levels in post
menopausal women.
33

While the results of this study did not show that dietary trans fatty acids were
harmful, neither did they indicate that high levels of trans fat in the diet are safe. This
conveys the need for further research to be conducted. Based on the studies reviewed,
there is evidence on both sides of the trans fat equation, and like all problems that arise
in science, this needs to be addressed. There is evidence in the literature that suggests
that trans fatty acids in the diet may be harmful to the health of human beings.
Secondly, there is no current regulation on their use by manufacturers nor are they
required to list the amount of trans fats on their food labels, so there is no way for the
consumer to know how much trans fat is in a product, allowing people to make a more
educated choice (McCord, 1994). In our society, in which "the consumer beware", and
where we like to think that we have choices and education, and educated choices are
important to us; where we like to think of ourselves as a modem society and "cutting
edge" when it comes to science, technology, and nutrition as well; the importance of
labeling our foods truthfully and accurately is important to us as a society. Research is
one very important way that these things can get accomplished. Unfortunately, it is
sometimes a very lengthy process.
34

REFERENCES
American College of Sports Medicine. (1995). Guidelines for Exercise Testing and Prescription (5th Edition). Philadelphia, PA.: Williams and Wilkins.
Ascherio, A., & Willett, W.C., (1995). New directions in dietary studies of coronary heart disease. Journal of Nutrition, 125 (3 Suppl.), 647S-655S.
Beardsley, T. (1991). Trans fat: does margarine really lower cholesterol? Scientific American, 264, 34.
Block, G., Hartman, A., Dresser, C., Carroll, M., Gannon, J. & Gardner, L. (1986). A data-based approach to diet questionnaire design and testing. American Journal of Epidemiology, 124, 19-35.
Britt, E.C. (1990). Viewpoint: Healthy People 2000. Society for Nutrition Education, 22, 239-240.
Bullock, C. (1995, November 9). The expanding world of fats. The Charleston Harold, pp. Cl-C2.
Dickey, L.E., & Caughman, C.R.(1995). Fatty acid profiles including trans isomers of 123 food sources presented as grams of fatty acid per 100 grams of food. Paper presented at the meeting of the American Oil Chemistry Society, San Antonio, TX.
Dupont, J., White, P.J., & Feldman, E.B. (1991). Saturated and hydrogenated fats in food in relation to health. Journal of the American College of Nutrition, 10, 577-592.
Dwyer, J. (1995). Overview: dietary approaches for reducing cardiovascular disease risks. Journal of Nutrition, 125 (3 Suppl..), 656S-665S.
Enig, M.G. (1996). Trans fatty acids in diets and databases. Cereal Foods World, 41 (2), 58-63.
Enig, M.G., Atal, S., & Sampugna, J. (1990). Isometric trans fatty acids in the U.S. diet. Journal of the American College ofNutrition, 9, 471-486.
Enig, M.G., Pallansch L.A., & Keeney, M. (1983). Fatty acid composition of the fat in selected food items with emphasis on trans components. Journal of American Oil Chemistry Society, 60, 1788-1794.
35

Gabel, L.L., Fahey, P.J., Gallagher-Allred, C.R., & Sickles, R.T. (1992). Dietary prevention and treatment of disease. American Family Physician, 46,(Suppl.), 41S-48S.
Hoeger, W.K., & Hoeger, S.A. (1992). Lifetime of Physical Fitness and Wellness (3rd edition). Colorado: Morton Publishing Company.
H$y, C.E. & H$lmer, G. (1990). Influence of dietary linoleic acid and trans fatty acids on the fatty acid profile of cardiolipins in rats. Lipids,~, 455-459.
Hunter, J.E., & Applewhite, T.H. (1991). Reassessment of trans fatty acid availability in the U.S. diet. American Journal of Clinical Nutrition, 54, 363-369.
Hunter, J.E., & Applewhite, T.H. (1986). Isomeric fatty acids in the U.S. diet: levels and health perspectives. American Journal of Clinical Nutrition, 44, 707-717.
Judd, J.T., Clevidence, B.A., Muesing, R.A., Wittes, J., Sunkin, M.E., & Podezasy, J.J. (1994). Dietary trans fatty acids: effects on plasma lipids and lipoproteins of healthy men and women. American Journal of Clinical Nutrition, 59, 861-868.
Katan, M.B., Zock, P.L., & Mensink, R.P. (1995). Dietary oils, serum lipoproteins, and coronary heart disease. American Journal of Clinical Nutrition, 61 (Suppl. 6), 1368S-1373S.
Katan, M.B. (1994). Letter to the editors: European researcher calls for reconsideration of trans fatty acids. Journal of the American Dietetic Association, 94, 1097.
Lichtenstein, A. ( 1993 ). Trans fatty acids, blood lipids, and cardiovascular risk: where do we stand? Nutrition Reviews, 51 (11), 340-343.
McCord, H. (1994). The spread on butter verses margarine. Prevention, 46, 55.
McKeigue, P. (1995). Trans fatty acids and coronary heart disease: weighing the evidence against hardened fat. Lancet, 345, 269-270.
Mensink, R.P., & Hornstra, G. (1994). The proportion of trans monounsaturated fatty acids in serum triacylglycerols or platelet phospholipids as an objective indicator of their short-term intake in healthy men. British Journal of Nutrition, 73, 605-612.
Mensink, R.P ., & Katan, M.B. (1990). Effect of dietary trans fatty acids on high density and low density lipoprotein cholesterol levels in healthy subjects. New England Journal of Medicine, 323, 439-445.
36

More on estrogen and lowered heart-attack risk. (1995, October) Harvard Heart Letter, 6 ill,1-2.
Nestel, P.J., Noakes, M., Belling, G.B., McArthur, R., Clifton, R.M., & Abbey, M. (1992). Plasma cholesterol-lowering potential of edible oil blends suitable for commercial use. American Journal of Clinical Nutrition, 55, 46-50.
Nestel, P.J., Noakes, M., Belling, G.B., McArthur, R., Clifton, R.M., & Abbey, M. (1992). Plasma lipoprotein lipid and Lp[a] changes with substitution of elaidic acid for oleic acid in the diet. Journal of Lipid Research, 33, 1029-1036.
On the margarine-butter controversy. (1994, July). Tufts University Diet and Nutrition Letter, 12, 1.
Ostlund-Lindqvist, A.M., Albanus, L., & Croon, L.B. (1985). Effect of dietary trans fatty acids on microsomal enzymes and membranes. Lipids, 20, 620-624.
Panigrahi, K., & Sampugna, J. (1993). Effects of trans fatty acids on lipid accumulation in 3T3-Ll cells. Lipids, 28, 1069-1074.
Say It Isn't So, Oleo! Even margarine may be bad for the heart. (1990, August 27). Time, 136, 53.
Shrapnel, W.S., Calvert, G.D., Nestle, P.J., & Truswell, A.S. (1992). Diet and coronary heart disease. The National Heart Foundation of Australia. Medical Journal of Australia, 165 (Suppl.), S9-S 16.
Slover, H.T., Thompson, R.H. Jr., Davis, C.S., & Merola, G.V. (1985). Lipids in margarines and margarine like foods. Journal of American Oil Chemical Society, 62, 775-786.
Troisi, R., Willett, W.C., & Weiss, S.T. (1992). Trans fatty acids intake in relation to serum lipid concentration in adult men. American Journal of Clinical Nutrition, 56, 1019-1024.
The trouble with margarine. (1991, March). Consumer Reports,-2.Q, 196-197.
Willett, W.C., & Ascherio, A. (1994). Trans fatty acids: are the effects only marginal? American Journal of Public Health, 84 (5), 722-724.
Willett, W.C., Stampfer, M.J., Manson, J.E., Colditz, G.A., Speizer, F.E., Rosner, B.A., Sampson, L.A., & Hennekens, C.H. (1993). Intake of trans fatty acids and risk of coronary heart disease among women. Lancet, 341, 581-585.
37

Wood, R., Kubena, K., O'Brian, B., Tseng, S., & Martin, G. (1993). Effect of butter, mono- and polyunsaturated enriched butter, trans fatty acid margarine, and zero trans fatty acid margarine on serum lipids and lipoproteins in healthy men. Journal of Lipid Research, 34, 1-11.
Zock, P.L., & Katan, M.B. (1992). Hydrogenation alternatives: effects of trans fatty acids and stearic acid versus linoliec acid on serum lipids and lipoproteins in humans. Journal of Lipid Research, 33, 399-410.
38

APPENDIX A
Dietary Intake Record Sheet
Name -----Day of Week __ _
24 Hour Report Date ------DOB/age. ___ _ Telephone ___ _
Where Description of Food Eaten How Prepared Amount Eaten
39

AppendixB
Checklist for Dietary Records
Instructions: Use the list below to help you keep an accurate Food Diary. Compare each item in your Diary to the appropriate type of food. Include enough details in your description to answer the question below.
Type of Food All
Cereals
Baked Goods
Fruits and Juices
Vegetables
Milk Products
Meat, Fish, Poultry
Eggs
Mixed Dishes
Soups
Did You Specify D Amount eaten? By cup, tablespoon, or teaspoon, using
standard household measurements? By size, giving dimensions (by length, width, thickness, or diameter)? By number for standard sized items? By weight?
D Size of servings? Brand name? Additions such as milk, sugar, fruit, or nuts? Instant or ready-to-eat type?
D Homemade or commercial? From scratch or mix? Brand? Topping or frosting? Dimensions? Weight or number eaten?
D Cooked, raw, or dried? Peeled? Fresh, frozen, or canned juice? Sweetened? Size of serving?
D Cooked or raw? Fresh, frozen, or canned? Sauces, or other additions? Serving size?
D Percent fat? Imitation or reduced calorie? Powder or liquid?
D Type of cut? Percent fat? Oil or water packed? Fat, skin removed? How prepared? Additions? Cooked weight or dimensions of amount eaten?
D Size? How prepared? Added fat?
D Homemade or commercial? From scratch or mix? Brand? Major ingredients and proportions? Cooking method?
D Homemade or commercial? From scratch or mix? Brand? Major ingredients and proportions? Cooking method?
40

Fats and oils D Stick, tub, diet, whipped, squeeze, or liquid margarine? Brand? Major oil, brand of oils, and type of shortening? Homemade or commercial salad dressing? Type of oil or brand? Low-calorie? Creamy? Additions?
Beverages D Brand? Sweetened? Diet? Decaffeinated? Alcohol content? Additions? Amount?
Snacks D Brand? Size, weight, or number eaten?
Restaurant meals D Type: fast food, ethnic, deli, family-style?
SOME SUGGESTIONS ... ON KEEPING A FOOD DIARY
1. Write down everything that you eat or drink, including all foods, beverages, nutrient supplements, vitamins, etc. Include all your meals and between meal snacks from the time you get up until the time you go to bed.
2. Do not change your usual eating habits while you keep this diary. Eat just as you normally do, and be honest!
3. Write down the information as soon as you finish eating since meals are difficult to recall in detail after time has passed.
4. Describe the type of food you have eaten, giving as many details as possible. For example, if you drank milk, indicate whether you had whole, skim, 2%, or 1 % milk. Include the brand name of commercial products; and indicate whether the item was fresh, canned, or frozen.
5. Describe how the food was prepared: raw, baked, boiled, steamed, fried, stirfried, poached, grilled, toasted, broiled, or microwaved. Also indicate if you trimmed the fat off meat, or followed any other special preparation or cooking technique.
6. Record the amount of food eaten. Use standard household measurements, such as teaspoon, tablespoon, or cup. Try to use a measuring cup with increments so you can distinguish V4, Yi, etc. You may also measure food by number of pieces (10 french fries), by size (meatballs, 2 inches in diameter), or by weight (2Vi oz. bag of potato chips).
7. Include all added ingredients, such as butter, salt, pepper, cooking oil, gravy, sauces, syrup, sugar and cream in coffee, and also all alcohol containing beverages, i.e. brandy, whiskey, sherry, wine, beer, etc.
41

Appendix C
Fatty Acid Profiles including trans Isomers of 123 Food Sources Presented as Grams of Fatty Acid per 100 Grams of Food
42

""' w
Fat
ty A
cid
Pro
file
s in
clud
ing
tran
s Is
omer
s o
f 12
3 F
ood
Sou
rces
P
rese
nted
as
Gra
ms
of
Fat
ty A
cid
per
100
Gra
ms
of
Foo
d
Lyn
n E
llen
Dic
key
Foo
d S
afet
y an
d In
spec
tion
Ser
vice
U
. S.
Dep
artm
ent o
f A
gric
ultu
re
Wes
t E
nd C
ourt
Bui
ldin
g V
.'ash
ingt
on D
.C..
2025
0-37
00
tele
phon
e:
202-
254-
2576
Fa
x:
202-
254-
2499
Cli
ffor
d R
. C
augh
man
C
ente
rs f
or D
isea
se C
ontr
ol a
nd P
reve
ntio
n U
.S.
Dep
artm
ent
of H
ealt
h an
d H
uman
Ser
vice
s R
oom
900
. P
resi
dent
ial
Bui
ldin
g H
yatt
svil
te.
MD
207
82
tele
phon
e:
301-
436-
7072
Fa
x:
301-
436-
3436

Thi
s re
port
inc
!ude
s fa
tty
acid
pro
file
dat
a fo
r 12
3 fo
od c
ateg
orie
s; p
rese
nted
as
gram
s o
f fa
tty
acid
s pe
r 10
0
gram
s o
f fo
od.
The
se d
ata
wer
e de
rive
d fr
om a
naly
tica
l da
ta r
epor
ted
in p
eer-
revi
ewed
, sc
ient
ific
lit
erat
ure
and
from
USD
A-s
pons
ored
con
trac
ts.
Dat
a w
ere
grou
ped
by f
ood
type
to
calc
ulat
e m
ean
fatt
y ac
id v
alue
s.
"n1 '
t re
pres
ents
the
num
ber
of
sam
ples
/stu
dies
use
d in
the
cal
cula
tion
s.
Ser
ving
siz
es a
re th
e R
efer
ence
Am
ount
s
Cus
tom
arily
. Con
sum
ed a
s co
ntai
ned
in th
e N
utri
tion
Lab
elin
g R
egul
atio
ns o
f th
e F
DA
's O
ffic
e of
Foo
d
Lab
elin
g an
d th
e t;
SD
A's
Foo
d S
afet
y an
d In
spec
tion
Ser
vice
.

.i:-.
Vl
FATl
Y A
i:ID
PA
OFU
.ES
AS
GU
M P
Eit
'TOO
GRAH
S FO
OO
Pag
e 1
.,,..
.. ~,..
01 s
l!lq
>te
s/st
ud
fes
lnch
Jded
tn
th4
P .,
..,,
vet~• o
f th
e fa
tty
ad
d d
iita
····
····
····
····
····
·Gr..
.a p
er 1
00 g
r ...
foo
d ··
····
····
··--
--··
····
···-
----
·--·
····
····
····
····
···
Agg
rega
ted
Food
Pro
du
ct O
escr
fptl
on
s Se
rYln
g T
otal
T
otal
· T
otal
T
otal
T
otal
O
ther
•r
f"
Sl~e
Lip
id
Tra
nt
Set
s Jt
ono&
Po
lys
14
:0
16
:0
13
:0
20
:0
Sat
• 14
:1
16:1
c 1
6:t
t 13
:1c
18:1
t
1. '
B!EF
; CO
l'IPOS
ITE
OF l
tETA
IL c
urs.
LEAN
, ltA
V Z.
BE
EF;
FAT,
RAY
3
. BE
EF;
CROU
JIO
4. B
EEF;
LI
VER
, RA
W S
. PO
RC;
COM
POSI
TE O
f R
ETA
IL
CUTS
, LE
All,
RA
W 6
. PO
RIC;
FA
T,
RAii
T.
SKAC
ICS;
PO
RIC
R 1 l
lD S
8.
OA
IRT;
M
lllC,
WltO
lE,
BCW
INE
9.
Jiii L
IC;
HUM
AN
10.
DA
IRY
; TO
UGUR
T,
PLAI
N, L
OV F
AT
1t.
OA
IRT;
Cl
lEDO
AR
CHEE
SE
1Z.
OA
IRT;
A
MER
ICA
ll PA
STEI
WR
IZEO
PR
OCE
SSED
C
"EES
E
( 9
) (
5)
(10
)
( 2)
(
T)
C S>
(
4)
( 4
) (2
1)
( 2
) (
2)
( 2
l 13
. D
AlR
Y;
AIE
RIC
A>I
PA
STEJ
tUIZ
EO P
RO
CES
S C
NEE
SE
Fo:.c
> Ir
(
4)
SPR
EAD
S 1
4.
fAST
FO
OD
S;
CCM
MER
CIAL
M
ilt
SNA
KE
( 1Z
)
1S.
FAST
FO
C:O
S;
t'OIM
ERC
JAL
MIL
1' S
llAIC
E,
LOW
FA
T (
2)
16.
POU
l TltY
; CI
UCI
CEll
SIC
lN.
RAii
( Z
l 1
7.
POU
t.TltY
; tH
ICJC
EV
FAT,
RA
ii (
Z)
13
. PO
O\. T
ltY;
CIU
CC
E'I
MEA
T• 1~11
C 3
) 1
9.
POU
t.TltY
; TU
tlCE.
T M
EAT,
RA
V C
Z)
20
. PO
Oi.T
RY
; TU
ltlCE
Y S
Kii
i,
RAV
C 1
)
2t.
PCJ
IJLTR
Y; ~y
FAT.
RA
W C
1)
ZZ
. PO
Ut.n
Y;
CRCI
UNO
TURK
eY,
MEA
T A
ID S
KIN
, RA
ii (1
2)
23
. E
"S;
C"I
CIC
Etl,
llllO
LE,
fltf
S!I
(
1)
24
. F
tsH
; TU
NA
, LI
CilC
T •
UA
TER
PACI
C,
DRA
INED
sot
.ID
S
( 2
)
2S.
SM
ISllG
ES
; BO
LOCi
ltA '
FR
AK
FUR
l'EtS
, BE
EF
C 5
) 2
6.
SAU
SAto
t:S;
llO
lOC
llA
' F~TEIS,
PO
lt(,
llE
Ef'
&
(11
)
OTl
lER
S?E
CIE
S
27
. SA
USA
Ges
; PO
ltsC SAU~GE.
FRES
H,
LIN
U
28.. ~;SMOKED
SAUS
AGES
2
9.
SAU
SAG
ES;
PEllP
ERO
llJ
30
. SA
USA
GES
; A
SSO
tTED
LU
ICH
EOll
MEA
T 3
1.
SOU
PS; ~F
llOU
IU.O
lf D
Ell'R
>MTE
O O
R CU
SES
3l.
SO
UPS
; BE
EF
BROT
!'l/ST
CCIC
3
3.
SCIU
PS; t1I~lt
BltO
Tll/S
TOCI
C
( 2
) (
2)
( 1
)
( 3
) (
3)
( t)
( 1
)
er..
. --
·-·-
--·-
--·
--·
....
. ..
...
---·
· ··
··-
---·
· •.
...
-·-·
· --
-·-
---·
·---
----
----
·---
-··
114 14
8S
114
114 14
30
240
225 30
30
30
240
240 14
11
4
114 14
1t4
50
55
55
55
55
55
55
55 1
~5
245
6. 1
6 70
.89
26.S
5 3
.M
S.8
8 6
7.7
0
34.1
3 3
.10
3
.39
1.
1S
36.3
6 29
,99
2Z.1
6
3.21
.zo
33
.90
69.2
0 3.
93
3.S
S
39.8
0 6
5.0
9
9.9
9
10
.oz
1.0
2
28.5
0 2
7.3
9
ia.s
a 28
.09
41
.34
13
.n
s.n
.1
6 3.
JZ
.21
2.2
9
2.2
8 ll.
14
1.1
8
10
.71
.0
2 1
.67
.01
2.08
.1
9
23.a
o .3
7
10
.74
.0
9
1.99
.1
5 1
.la
.02
.76
.91
24.2
6 .n
1t.
n
.t.:Z
1
4.3
6
.08
2.07
.0
1 .1
3
'.4
1
9.31
••
20
.35
.0
4
.95
.o
a 1
.00
1.
22
10.9
7 2.
43
19.7
0 .3
1 2.
64
.06
Z
.87
.OT
.31
1.20
1T
.73
.26
9
.87
_,,
9
.67
1.0
6
10
.80
.3
6
16.5
3 -,
, 8
.33
1.
S6
l.3
4
.01
.06
.0
3
.91
2.53
.5
7 2
9.7
4
3.0
5
12.1
0 .7
6 .T
T
.45
2.73
.5
3 29
,83
3.04
17
.92
3.8
3
.81
• 13
1.31
.5
4 .2
9
.05
&.7
7 1
.44
7
.55
1.
16
5.81
.8
4
.85
.1
3
• 05
.01
n.n
6.
31
3Z.3
9 1Z
.9a
1.1
a .n
1.
0S
.85
16.3
4 9
.13
2
9. 1
2 1
6.0
7
3.6
7
2.41
4.
45
1.00
• 1
4 .4
S
13.8
8 1.
19
13.2
4 2.
60
14.~
14
.16
19.8
3 11
.15
4.46
.0
8
1.6S
2.64
1.
45
2.7'
5 2.
83
.32
.01
.62
.13
1.32
.7
S
.oo
.09
.1
1 1.
06
.oz
.lS
.0
3 • 1
0
.OT
.03
.1
2 .4
0
2.19
1
8.9
6
10
.83
.94
6.39
3
.04
.05
.79
.71
.oe
1.1
3
.63
.8
1 14
.71
.46
7.16
.2
9 .8
3 .zo
.7
0 .1
2 .3
2 4.
10
10.5
4
7.76
Z
.87
.39
.2
3 .1
4 3.
73
.06
• 1
9 • 0
1 .4
7
.01
.24
• 00
.18
3.00
8
.36
3
.39
.0
9 5
.80
.O
S 4
.92
.0
4
3.5
3
2.1
5
5.9
7
.33
.89
.0
2 .0
5 .2
6
7.21
.5
6 tS
.69
.02
.63
.02
.62
.3
6
7.92
.6
S
14
.05
.0
9
1.81
.OJ
2.10
.0
1 -1
8 .7
9 6
.36
.S
l 6.
44
.34
.1
9 .8
0
.35
.15
.00
.02
6.08
6
.65
9.
79
6.2
3
1.4
5
.03
.T
t
Z.6
6
.38
.0
5
1.6
4
3.59
.2
2 .2
8
2.42
4.
54
.69
.7
0
.oa
3.78
2
.67
.01
.45
.oo
.02
-°'
. tr
.09
.4
5 .o
z .0
6
.oz
.06
.06
.2
1 • ,
, .3
5 .0
1 .0
4 0.
00
,03
0.00
.0
5
.04
.76
.OS
.18
3.0
6
.07
Z.9
8 o.o
o 5
.46
.0
6
1.6
4
o.oo
1.4
9
.oz
.11
.34
-42
.11 .zo
.oo
.0
1 .o
z .oo
.1
6
.ot
.02
.22
• 16
2.86
.2
6 .9
9 0
.00
.<
Tl
.01
• 18
.02
1.90
.0
1 1.
20
.oz
.05
.oz
.10
.o•
.02
.3S
-~
.24
.53
.18
.3
9
.03
.0
6
.oo
.oo
.09
2
.52
.2
0
5. 1
9 .0
1 .2
0 .0
1 .1
2 .O
T 2.
04
.13
3.3
1
.oz
.33
.0
1 .3
4 .0
0 .o
z .2
2 1
.09
.0
2 1
. t4
o.oo
.8
'5
.22
1.2
3
.11
1. 1
5 0.
00
1.37
·°'
.18
.00
.0
0
.01
.2S
.02
2.
00
.04
24
-81
.05
9.61
o.o
o .6
a o.o
o 2.
48
o.oo
21
.04
0.0
0
1S.9
9 .0
0 .M
.O
t 1.
05
o.oo
.23
.01
6.9
' .0
1 6.
05
.01
4.§&
o.oo
• .s
a o.o
o .0
4 .0
2 12
.14
.OJ
26,0
2 .oo
.9
2 o.o
o .8
3 .0
2
12.9
7 .0
3
2'3.
24
.ot
2.94
o.o
o 3
.98
.0
0
.10
o.oo
tt
.05
.0
1 11
.44
o.oo
13.1
4
.02
11
.49
0.00
18
.01
.01
9.55
0.
00
2.66
0
.00
.0
6 0.
00
1.3
'
.17
1.7
3
.98
.oz
.Of
.1S
.2
S
.06
• 1,
.02
.M
.47
.42
.06
.0
1
.32
.6
Z
.Ol
.OT
1.0
4
2.oa
.2
5 .0
6 .o
o .9
8 .2
S
.(W
.911
.36
• 10
1.4
9
.Of
.03

~ "'
A1
19
rep
ted
Foo
d Pr~t O
escr
fptJ
on
&
1.
BEE
F; C
OM
POSl
nl O
F ~TAil C
UTS
, LE
AN
, RA
W
Z.
BEE
F;
fAT
• RA
Y 3
. Be
1!F;
GRO
OllD
4
. B
EEF;
U
VE
lt,
RAV
S.
POU
; CC
M'O
SlTE
OF
RETA
IL C
UTS
, LE
M.
ltAV
6.
PORI
C;
FAf,
RAY
T.
SIW
XS
; PO
R1C
RIND
S I.
DA
Jlt'f
; M
lllC
, V
MO
lE,
IOW
INE
9.
MlL
K;
llJM
AW
TO.
DA
ilt'f;
TO
UQ
JRT
• PL
AIN
, LO
ii FA
T 11
. D
AIR
'f; C
HEO
OA
R C
UE
SE
12.·
DAIR
Y; A
MER
ICAN
PAS
TERU
RIZE
D Pl
lote
SSEO
CNE
ESE
13.
DA
IRT;
AM
etICA
N PA
STl!R
UIZE
D PI
OCES
S Cl
lEH
E FO
OD
& S
PREN
JS
14.
FAST
FCJ
CDS;
CCJ9
1ERC
IAL
MIU
C SM
AICE
15
. FA
ST F
OCDS
; CO
flNER
CIAL
MIU
C SM
AICE
, LO
lol FA
T 16
. PO
tJ'L l
ltT
; C
lllC
ICEI
SI
Cill
, ttA
W
17.
PO
U\ T
RT;
CI
UCIC
EJS
FAT•
RA
V 18
. 11
a1L T
ltY;
CllJ
CIQ
!ll M
EAT,
ltA
V
19
. PO
UL TR
T;
tUU
E1'
MEA
i • R
AV
20.
PCU
.IRT;
N
Ria
:l'
SICI
N. R
AW
21.
PCU
.TRY
; TU
rtlCE
l' FA
T. l
tAW
22
. PC
UlT
RY;
GJtO
UND
TURI
CET.
MEA
T AH
O Sl
CJl
l, RA
ii
ZS.
EGGS
; Cl
llCIC
EN.
VllO
l.E.
FRES
H 2
4.
FISH
; tlM
A,
LIG
HT
, W
ATER
PA
C[,
OR
Alll
m S
OI.I
DS
25
. SA
USA
GES
; IO
lOG
ltA &
'FIW
ICFU
RJU
S.
IUF
26
. W
JSA
Ges
; 80
UX
iU &
FIW
llCFU
UtR
S,
PORI
C,
BEEF
Ir
01'1
'ER
SPE
CIES
2
7.
SlllJ
SAG
ES;
PORl
C SA
USA
GE,
F
US
H,
UIC
ICS
28
. W
JS.U
ES
; 5'
DC
EO
WJS
AG
ES
29
. SM
ISA
G!S
; P
EP
PE
Ral
l 3
0.
SAU
SAG
Et;
ASS
OR
TtO
LCJ
llClll
!OI
MEA
T 3
1.
SQJP
S; 8
EEF
BCIU
ILLC
lr D
Elm
llL\T
ED C
R al
llE
S
32
. SO
UPS
; llE
EF I
MCJ
Tll(S
TOCI
C 3
3.
SCJU
PS;
Cff
!Clt
ll B
ROTM
/STO
CIC
-··-
···-
--··
····
··--
·-·G
r ...
per
100
gr ... f
oo
d·-
····
--··
····
·-··
····
····
-···
····
··
20:f
Otf
ler
Ta:z
18:2
18
:2
18:2
18
:3
11h3
2
0:4
20
:S
22:5
22
:6
Od
ler
MoN
>s
n·6
tt
tc,c
t
.01
.06
.1
3 0
.00
.05
• 17
o.oo
0.
00
.OJ
.02
.S6
• 1
6
.33
.1
4 .oo
.0
2 .0
2 .o
o .0
0 .01
.0
9 . T
1 .0
6
.19
.0
7 .1
5
.39
.01
1.4
9
o.oo
.41
.05
.25
o.oo
.44
o.
oo
6.S2
0.
00
3.21
o.oo
.0
8 o.
oo
.43
.ot
.03
o.oo
.7
3
o.oo
.63
o.oo
.4T
0
.00
.0,
.oo
.1Z
.01
.09
.01
.23
.0
1 .01
• 15
.23
.02
.OS
.oo .1a
.24
.oo
.01
o.oo
.0
4 S
.55
0.00
.09
1t.6
J o.o
a .oz
.5
5 o.o
o .0
1 .6
2
o.oo
.06
a.12
o.oo
.1
1 14
.22
o.oo
.0
1 2.
oa
o.oo
.O
J .8
2 0.
00
.01
.01
0.00
.3
5
.71
o.oo
.17
2.
24
o.oo
.37
.O
S .0
7
.1S
.1
a o.
oo
2.3Z
o.
oo
1.05
o.
oo
2.43
o.
oo
2.68
o.
oo
0.0
0
.11
.02
.0
7
.oo
.oo
.Ot
.01
.ZS
0.00
.o
t o.
oo
.sa
o.oo
.01
0.00
.1
8
0.00
.1
1 o.o
o 0.
00
0.00
.00
o.o
o .0
5 o.o
o .1
2 0.
00
.02
0.00
.0
2 0.
00
.01
o.oo
.2
3 .1
2 .2
4 o.
oo
.19
o.oo
.01
0.00
.oo
o.oo
.oa
·°'
.1s
.os
.01
0.00
.0
1 o.
oo
.16
.0
6
.32
.11
.05
.01
o.oo
o.oo
0.00
o.
oo
.2, o.
oo
0.00
0
.00
.oz
o.oo
.0
6
o.oo
o.oo
o.oo
o.
oo
o:oo
.o
r o.
oo
.00
0.00
0.
00
o.oo
n·3
no
t n·
3 n
·6
n·J
n
-J
Pol
ys
.01
.71 .06
0.00
.0
2 .J
7
.14
.01
.03
.00 . ,, .1a
.13
o.oo
.3
2 0.
00
0.00
.o
o 0.
00
o.oo
o.oo
.oo
o.
oo
o.oo
o.oo
o.
oo
.01
0.00
.o
o o.
oo
.29
o.o
o .5
9 o.o
o .0
2 o.o
o .0
3
0.0
0
.47
o.
oo
.78
o.
oo
.10
.o,
·°'
o.oo
.0
0 .o
o .1
1 0.
00
.14
o.o
o
.09
.0
7
.11
o.oo
.o
z .0
0 .O
l
o.oo
0
.00
0
.00
o.
oo
0.00
o.o
o o.o
o
• TO
.00
0
.00
0.
00
.04
o.oo
.0
5
.21
o.oo
.09
.04
0.0
0
o.oo
o.oo
.Cl
• 16
.OJ
0.00
0.
00
o.oo
.04
.0
2 o.
oo
o.oo
.01
.34
.2
9
• t2
0.0
0 .3
6 .0
9 .O
S 0.
00
0.00
.23
.01
o.oo
o.o
o o.o
o .oo
.0
1 .0
0
.01
.01
.02
.oo
o.oo
o.oo
o.oo
.oo
.06
.0
3
.04
o.o
o .1
3
.05
.02
o.o
o o.o
o .0
4 .0
4 o.
oo
o.oo
0.00
.03
.01
.oo
o.oo
o.oo
.oo
.oo
0.0
0
o.oo
0.00
o.o
o .t
s .0
3 .0
2 .O
J .1
2 .1
6
.13
0
.00
o.o
o .Z
J • 1
t .0
1 .0
1 .oz
.0
5 .1
2
o.oo
.oz
.0
2
,04
.1S
0.
00
0.0
0
0.0
0
.17
.Z
J .1
0
0.00
o.o
o .3
2 .1
0 .o
o .0
1
.09
o.oo
o.o
o .0
5
.05
.01
.oz
.OJ
.OS
0.00
.3
0 .a
s .0
6 0
.00
0.
00
o.oo
.09
.04
o.oo
o.
oo
o.oo
.11
.07
o.oo
o.o
o o.o
o ·'
' .0
4
0.0
0
o.oo
o.
oo
.23
.10
o.oo
o.
oo
0.00
.11
.Oto
o.
oo
o.oo
0
.00
.1
1 o.
oo
o.oo
0.
00
0.00
0.0
0 0.
00
o.oo
o.
oo
o.oo
.00
.01
o.oo
o.
oo
0.00
.01
hie
1.
1

~
"'-I
FATT
T A
CID
PR
OFI
LES
AS
CtW
IS
P'Et
t 10
0 G
RM
S fO
CD
Pag
e 2
-,.,
. •
l"U
ltler
of s~\es/studles
fncl
udec
f In
th
e .. ., v
e\u
es o
f th
e f
att
y e
c:fd
deta
---·
······
···-·
---·
-·G
r ...
per
10
0 .
,. ... f
ood
···-
-··
····
····
···-
·----··
····
-·-
-·-
----··
··------·-
-A
gg
ng
eted
fo
od
Prc
du
ct D
escr
ipti
on
s
3'.
SO
UPS
; C
llCIC
EI l
lOU
lUC
ll DE
llYDM
TE.11
Olt
CUBE
S 35
. FA
Sr
FCIO
OS;
AAM
BURG
ER,
ltEC
IJL
M.
Pt.
All
3
6.
FAST
FO
CIOS
; CH
USE
llURG
1!1t
, llE
CU
LM
. PL
Aill
3
7.
FAST
FO
COS;
fl
SI
SMID
WIC
R 3
8.
FAST
fO
CO
S;
FISH
Uf
CREE
SE S
AJID
VICM
3
9.
fAS
t FO
CO
S;
ElrG
LlS
ll H
UFF
ifi .
.,,
ecc.
CltE
ESE
&
SAU
SAG
E '0
-BI
EAIC
FAST
a:
ltEAL
: C
OllT
o\lll
lllC
AOO
E1>
Fo\T
• >
lX F
AT
'1.
BltE
AIC
FASt
CE
1tEM
.; C
OllT
AlN
lllG
.-o
DE
1)
FAT•
-c:
SX F
AT
'2-
SllA
CIC
S:
CORI
C llU
1S
'l·
SNA
OCS
: PO
PCD
ltll
'4.
llA
(aY
Pl
tCO
UC
rs:
BREA
DS,
aJ
IER
CIA
L,
IW>E
WIT
H
ltTD
RO
GEN
ATED
on.
s 45
. IA
UlY
PIC
XlJ
CtS
; BR
EAD
S.
CO
MllE
RC
lAL.
M
ADE
VIT
I U
lll'tD
llOG
OCA
TED
FA
TS '
O
ILS
46
. IA
ICEI
Y n
:oou
cts;
Alf
f PA
STlt1
' 41
'. u
att
Y P
RCD
UCT
S;
MJF
FIK
/8IS
tulT
48.
IAX
ERY
..a
DU
CT
S; W
.FF1
.ES
49.
IAIC
ERY
llttO
DtJC
TS;
8REA
JCFA
St P
AST
RIE
S
50
. llA
ICER
Y P
IOD
UC
TS;
DCJU
GHNU
'f, C
ME
TTP
E
S•r
vln
g
tota
l "n
• S
ize
lfp
ld
er-
< 3)
(1
1)
(13
)
c 3)
( 4
)
( 2
)
c 7
) (,
0)
( 1
)
( 5)
(2
0)
(23
)
( I)
( 5)
(
2>
(10)
c
9)
1 90
1
00
140
140 ''° 30
30
50
50
9.43
15
.111
17.0
1 U
.66
17
.57
11.Z
J
4.41
1.
S6
"· 10
27
•. 70
6.61
3.1"
5
51
. llA
UlY
PllQ
lUC
TS;
DC
IUC
HllU
T,
CM
E T
TPE
; llA
DE
\llT
lt
( 2
)
~
85
55
55
SS
38.5
0
10.9
0 10
.S5
15.9
5 2
2.n
15
.13
Alll
MA
l FA
TS
52.
IAIC
Elt1
' PR
ODUC
TS;
oouc
litlUT
. Y
eASt
TTP
E 51
. B
Aal
tY P
llCD
UC
TS;
SMAC
IC t
:AIC
ES
54
. BA
ICER
Y PR
CO
Ucr
s:
LAYE
R CA
ICE
55
. IA
Ult
T P
RCIO
UCT
S;
PClU
NID
CAIC
E 5
6.
BAIC
ERY
PRCI
DUCT
S;
CH
EESE
CM
E,
Pl.A
lli
57.
MKe
RY P
RODU
CTS;
COF
FEE
CU
E 58
. 8M
EltY
PRO
DUCT
S: AS
SOltJ
ED C
DOIC
IES
59
. B
M.U
Y P
ROD
UCJ
S;
CllO
tU.A
TE C
lllP
tool
ClE
60
. IA
klR
T P
RCX>
UCH;
SM
DU
IClt
TYPE
CIO
OIC!
E 6
1.
SAXE
1tT
PICX
IUCT
S;
VA
IIL
U V
AfE
RS M
D T
EA l
lSC
UIT
S 6
2.
BA
aR
T P
llOD
UC
TS;
SUG
AI!
CCCI
CIE
63
. U
.Ulf
f PR
ClllC
ltTS;
O
ATI
EA\.
AllD
CftE
WT
IM C
OO
ICIE
'S 64
. U
ICal
Y P
IKlD
UCTS
; Cl
lEES
E C
ltAO
t£R
S
6.5.
ll
MD
Y P
ICID
UC
TS;
CRM
:ICER
S V
/ P£
NIU
1'
BU
fTEl
l
( l>
55
C
Z>
llO
c 3>
llO
(
5)
llO
< 1)
12
5 (
3)
55
( 4)
3G
<
5)
3G
(11
) 3
0
(15)
•
10
(12
) 30
c
3)
30
( 5>
30
(
2>
3G
25.9
5 10
.2S
19
.59
20.3
6 15
.79
27.l
lS
7.53
2
'.6
6
Z0.
61
13.5
5 2
4.a
9.
34
zs.1
a 2
9.U
To
t•l
fote
l T
ote
\ T
ote
\ O
ther
T
r-
. Set
s li
lano
9 P
olys
1
4:0
16
:0
US:
O
20
:0
S•t
• '4
:,
16:1
c:
16:1
t ,a:,~
18
:,t
1.eo
2.
96
.52
5
. IZ
.6
4 8.
05
.39
3.05
.2
9 5
.oa
.10
4.91
,_,,1
1.
01
.21
.47
2.
83
2.54
7.
llO
6.14
.8
7
1.44
.06
.7
2
.51
34.5
6 2
.69
2.
70
2.49
Z
.36
Z.7
7 4.
24
5.71
5.
59
5.00
7.
2Z
6.36
4
.79
5.25
4.
20
Z.4
0 .5
0 7.
ZS
16
.1S
2.
4Z
1.1
0
1.U
6.
07
s.r.
7.
74
12.7
3
1.05
1
.17
1
.07
4.
117
6.0Z
1.
34
.51
.39
3.1
8
3.8
' 1
.89
1.4
4
.59
1,3
6
1.4
7
3.00
2.
99
.50
11
..34
4.61
1
.27
4.'
9
6.0
6
2.20
2.
68
3.1
3
5.11
4 3
.77
7.
03
.5&
S
.60
2
.86
8
.73
1
.oa
2.69
6.
19
a.48
3.
78
6.80
2.
04
4.37
4
.28
9.
34
2. 1
2 2.
65
5.7'
0 8
.60
1
.65
5
.29
12.0
S
5.44
to
. 14
9.27
5
.07
11
.72
2.8
7
12.8
4 1
0.W
6
.0t
10.9
7 5
.13
12
.21
14
.95
6.4
6
1.4
8
2.54
z.a
5 .8
1 5.
62
1..2
3
2.1
0
2.15
1.
45
2.94
.8
2
2..3
4 7
.18
.06
1.
53
.42
2.63
.8
3 4
.15
.1
6
1.7
6
.38
2.74
.5
0
2.75
.08
.39
.04
• 17
.03
1.57
.0
5 l.
07
.o
s .eo
.O'
.44
1.30
.0
2
MIO
0.
00
Z.21
.0
6 1.
03
o.oo
1.53
.O
S ,_
01
.0
1
.31
.01
.1'
.oo
.ex.
o.oo
2.
79
.10
.4
6 .0
2
.17
.0
2
.05
.27
.llO
.1
0 .3
S .sa
.22
.11
.0
1 .t
3
.11
.04
.01
.27
.14
~-00
.0
5 .O
ii
o.oo
0.00
o.o
o 0.
00
.01
.01
.33
0.00
2.
87
.71
o.oo
5.76
.5
5 o.o
o 5.
00
.52
0.00
3.
05
.26
o.oo
4.60
.'Z
T o.
oo
J.6
9
.01
o.oo
1
.38
.o
o o.
oo
.3Z
.0
1 o.
oo
4.78
.24
o.o
o 8.
s1
.01
o.oo
1.
66
.02
.oo
.99
6.6
0
.03
.05
.24
.1
2
4.03
7
.'6
1
.48
1.
11
1.21
,.
02
Z.
211
1.48
2.
9'2
2.32
o.oo
f6.4
6 o.o
o o.o
o o.o
o .0
4 .0
4 0.
00
0.00
0.
00
0.00
.oa
O
.OI
.00
0.0
0
.73
l.6
1
3.5
' s.
11
7.5
2
.05
.20
.01
.16
.Ot
.08
.1S
0.00
.0
3 0.
00
1.75
.4
8 .5
3 .3
1
.24
.09
1.0
0
. ,, 2.44
7.
36
.73
.02
.51
2.46
2.
2J
2.43
5
. 16
.86
3.50
2.
59
.03
1.36
.0
6
.20
o.oo
3.83
.4
6
.Ol
.OS
.04
.5
7 1.
02
1.1
0
.46
1.
10
.44
.37
.9
1 .1
3 1
.32
• T
1
3.0
9
1.l
l 3.
03
Z.4
6
3.70
4.
28
.71
3.34
2
.74
Z.04
4.
21
.71
3
.59
3.
02
2.73
1.
12
Z.6
1 1.
71
2.87
t.a
o .5
2 3.
19
1.86
1.
33
2.79
.8
4 1
.71
1.
4.S
.oe
·''
o.oo
-~
.13
o.oo
.07
.0
9 o.o
o .0
6
Z..2
4 0
.00
.O
S .9
5
.f1
l
o.oo
1.55
0.
00
o.oo
1
.00
0
.00
.0
6
,79
o.oo
.06
1
. 71
o.oo
.03
.60
0.00
0
.00
1
.42
0
.00
.0
4
.116
0
.00
.o
e t.
83
o.oo
.2
S .4
7 0.
00
.oz
.01
.03
.04
.1'
0.00
.0
2
.04
.1
9 .1
3 .or
.01
.06
.16
o.oo
a.
23
o.oo
l.4
8
0.00
7.
13
.0.0
0 5
.86
.0
1 4
.40
o.oo
9.0
6
o.oo
1
.86
o.o
o 7.
23
o.oo
6.24
0.
00
3.99
o.o
o 7.'
36
o.oo
3.20
o.o
o 7.
31
o.oo
12.1
5
3.77
1
.90
2.
95
3.l
l .o
2.
51
.95
5.55
3
.50
1.
78
3.49
1
.91
4
.7'
1.41
1

~
00
Agg
rega
ted
FoO
'J P
rod
uct
D~criptions
34
. ~;
OU
CIC
Ell
8001
\.lO
N O
Ell'fO
RAT
ED O
lt CU
BES
35
. FA
ST
FOC
OS;
K
AM
BURG
Elt,
RE
OU
W,
Pl.A
IW
36
. FA
ST
FOC
OS;
CM
EESE
BUltG
ER,
RE
Qlt.
All,
PL
AIN
37
. FA
ST
FOCO
S;
FISl
l SA
llDW
ICM
38
. FA
ST
FOC
OS:
F
ISI
V/
CHEE
SE
SAN
DV
lOI
39
. FA
ST F
'OCO
S;
ENG
llSH
MU
F'Fi
ll U
/ EG
G,
CHEE
SE &
SAUS
AGE
40
. ll
tEA
UA
Sl
CER
EAL;
C
X>I
TA
lU•G
AO
OEO
FAT,
>
31 F
AT
41.
11RE
A1tf'A
ST t
tltE
Al;
C
OllT
A?l
l UIG
Al
>l>E
U Fo
\T,
<3
l FA
T
42
. S
ICA
CU
; CO
R'll
NUTS
43.
SllAC
ICS;
POPC
ORN
44
. IM
ER
Y P
RO
OtlC
TS;
BR
EAD
S,
!XllM
ERC
IAL,
M
ADE
WIT
H
ll'tD
llOG
ENA
TED
OIL
S 4
5.
INC
EltT
PR
a>U
C:T
S;
BR
EAD
S,
CO
IHE
llCIA
L,
IW>E
llI
TN
UllK
YORO
GEIC
ATED
Fo
\TS
r. O
ILS
46.
11M
tltT
PRO
OU
CTS;
PU
FF
PAST
RY
47
. IM
Elt
Y P
ROO
VCT
S;
l«JF
FIN
/BIS
CU
IT
48
, SA
ICER
Y PR
OO
VCTS
; W
AFF'
LES
49
. BA
XEl
t'I'
PRO
DU
CTS;
BR
EAK
FAST
PA
STR
IES
50
. BA
ICER
Y PR
OO
UCT
S;
DO
JGIN
UT
• CA
ICE
TYPE
S".
~tf P
ROO
UCTS
; D
QJG
INU
T •
CAIC
E TY
PE
; M
ADE
WIT
H
AICI
MA.
1. FA
TS
52.
BAKE
RY ~OOUCTS;
DOUG
INUT
, YE
AST
TYPE
53
. BA
ICEl
tY P
RODU
CTS;
Sl
iACl
t CA
ICES
54
. 8'.
ICER
T PR
OD
UCT
S;
LAYE
R CA
ICE
55
. B
AU
RT
PRO
OV
CTS;
PU
JllO
CA
ICE
56
. BA
ICER
Y Pl
ta>u
CT
S;
CKEE
SECA
ICE,
PL
AIN
57
. BA
ICEl
t'r P
ROD
UCT
S;
CO
FFEE
CAI
CE
58
. IW
C£1t
Y PR
OO
VCT
S;
ASS
OR
T£0
COO
ICIE
S
59
. BA
ICER
T llt
tOO
UC
TS;
Cl!O
OO
J.AT?
C
HIP
COO
ICIE
60
. IW
:EtT
PRO
DU
CTS;
SA
JCO
\llCN
l'Y
?E C
OO
ICIE
61.
IW:E
ltY P
ROD
UCT
S;
VA
NIL
LA W
-.F£1
t$ N
G r
u l
lsall
TS
62
. lfM
:EltY
PRO
DU
CTS;
SU
GA
R CO
OIC
IE
63
. IW
CERY
Sll!
(XJU
CTS;
OA
TMEA
L AN
O O
IEV
f B
M
COO
ICIE
S
64
. B
AX
Elt'r
"R
OO
UC
TS;
CH
EESE
CR
ACK
ERS
65
. IA
ICER
Y PR
al«J
CT'
S:
CM
CX
ER
S V
I P
EA
llUT
llUTT
£R
--··
--·-
·-·-
----
----
---G
rlll
8 p
er
100
gr!ll
lllJ
food
···--
----
----
----
·---
--·-
--·-
·--·
··-20
:1
Ott
i.r
18:2
18
:2
18:2
18
:2
13:3
18
:3
20:4
20
:S
22:S
22
:6
Oth
er
~
n-6
tt
tc
,ct
n·l
n
ot
n-3
n-
6 n
-3
n-l
l'
oly
s
.02
.02
o.oo
0.00
.0
3
.12
o.oo
0.
00
.04
.06
.O
S .0
5
.01
.00
.oo
o.oo
0.
00
.01
.OJ
o.oo
.0
1 0
.00
.96
0.00
1
.04
0.
00
.81
.05
4.43
o.o
o 5
.10
o.
oo
t.1
4
0.00
.44
o.oo
.31
.oo
2.73
o.o
o 2.
58
o.oo
1.5
5
o.oo
.04
.01
1.2
3
o.oo
o.oo
• 18
.Ot
0.00
o.
oo
o.oo
.ot
.01
.02
0.00
.0
1 .0
1
.03
0.00
.0
3 .0
1 .0
3
o.oo
.OS
0.00
.0
2 .oo
o.o
o .1
4;
o.oo
.OJ
.02
o.oo
• 13
.03
.02
.08
o.oo
.05
.02
0.0
0
.04
.03
.Z1
.35
.40
o.o
o 1
.04
.0
3 1
.15
o.o
o 2.
41
.05
2.
11
.13
1.0
8
0.00
5.5
0
0.00
.7
8 .0
6 Z
.20
0.00
1.
81
o.oo
.62
0
.00
4
.39
.0
3
1.01
) .0
2
1.4
3
0.0
0
1.2
0
.03
1.05
.0
3
1.9
7
.21
.52
.0
5 '.
30
.2
.6
6.6
2
o.oo
.04
0.00
.0
4 0
.00
.0
6 0.
00
.07
o.oo
.05
o.oo
.00
o.oo
.01
.02
.03
.03
.3
9
o.oo
.44
.75
• ,
, .0
8
.01
.01
o.oo
o.oo
.zo
0.0
0
.26
0
.00
.2
3
0.00
.4
7 o.o
o .0
4 o.o
o
.42
0.00
.2
3 .2
7
• 1S
0.00
.4
4 .5
5 .1
1 o.o
o .2
5 0.
00
.1'
0.00
.6
4 o.o
o .z
s .s
a .2
3 0.
00
.42
o.oo
.1
6
0.00
.6
T 0.
00
.17
0.
00
.03
o.o
o .0
9
o.oo
.10
C.0
0 .3
7 0.
00
.63
o.oo
.OS
0.00
.03
0.00
.0
2
0.00
.O
S o.o
o .0
7
0.00
.1
1 .o
z
.01
0.00
O.
OC>
0.00
0,
00
0.00
o.o
o o.o
o o.o
o 0.
00
.03
.01
0.00
D
.00
.01
o.oo
o.oo
o.o
o o.o
o 0.
00
.07
.02
0.00
o.o
o .1
5 .1
1 0.
00
o.oo
0.00
.0
3
0.00
0.
00
O.O
ll 0.
00
.01
0.00
0.
00
o.oo
o.oo
.00
0.00
o.o
o o.o
o o.o
o .0
1 0.
00
o.oo
o.oo
o.oo
o.oo
0.
00
o.oo
o.oo
o.oo
.oo
.17
.o
z o.
oo
o.oo
o.oo
o.oo
.oo
o.oo
.09
.O
S .2
Z
.26
.14
.54
.13
.1
6 .0
4
.04
.5
0 .O
S .0
4
.06
.0
6
• 15
.09
_ 1
1
.OS
o.oo
o.oo
0.00
.0
5
.03
o.o
o
o.oo
.0
1 0.
00
o.oo
0.00
.o
e o.o
o 0.
00
o.oo
0.00
.1
6 o.o
o o.
oo
0.00
o.oo
o.o
o o.o
o o.o
o .1
a 0.
00
0.00
o.
oo
0.00
o.o
o 0.
00
o.oo
0.00
o.o
o o.o
o .0
2 o.o
o o.o
o o.o
o .0
3 0.
00
0.00
O.
DO
0.00
0.
00
o.oo
0.0
0
o.oo
o.oo
o.oo
0.00
o.
oo
0.00
0.
00
0.00
o.o
o 0.
00
o.oo
0.00
o.o
o 0.
00
0.00
o.o
o 0.
00
o.oo
o.oo
o.oo
o.oo
0.00
.0
1 .oz
o.o
o 0.
00
o.oo
.oz
0.00
o.o
o 0.
00
o.oo
.38
0.00
0.
00
o.oo
o.oo
.0
2 0.
00
0.00
o.o
o 0.
00
0.00
o.o
o o.o
o 0.
00
0.00
.o.
s o.o
o o.o
o o.
oo
o.oo
.oa
o.oo
0.0
0
0.0
0
o.oo
.03
o.o
o 0.
00
0.00
o.o
o 0.
00
0.00
0.
00
0.00
0.
00
0.00
0.
00
0.00
0.
00
0.00
.3
5
p~
2.1

+:' '°
FA
Tn
AC
lO P
ttOFl
LE
S A
S CR
AMS
PS
I 10
0 G
1tM
S r
oo
o
Peg
e l
"n•
• ~ o
f sa
np
les/
stu
dte
s In
clud
ed I
n t
he ..., Y
ltlu
es o
f ti
. f•
tty
.cfd
d9
t•
······
······
······
···G
r811
1a p
er 1
00 1
r ...
fo
od
····
····
····
····
····
····
····
····
····
····
····
····
····
· A
ggre
98te
d F
ood
Pro
cM:t
Des
crtp
t•cn
1
serv
ing
T
ot•
l to
tel
To
t•l
To
t•l
To
tal
Otb
er
..,.,.
S
fn
Lip
id
r ...
r.s se
ts
9'on
oe
Po
lys
14
:0
16
:0
18:0
2
0:0
se
ts
11.:1
16
:1c
t6:t
t 1
a:t
c
18
:1t
er-
FIU
111G
6
6.
8A
a1
"' P
RC
DU
CTS
: \M
EA
T C
IW:C
ERS
<a>
30
67
. B
AK
ER
Y
PltQ
OU
CTS
; S
MA
OC
·TY
PE
C
RAC
ICEI
: (1
4)
68
. IM
ER
Y P
11.C
X>UC
TS;
GltM
All
CRAC
ICER
S (
4)
69
. B
MER
Y P
R<X
lUCT
S:
M:1
.BA
tC
MSJ
<
t >
7
0.
w:£
RT
PR
CllU
CTS
: SC
OA
CIW
XE
R
C 8
)
71
. 8A
ICE1
1Y P
RCO
UCT
S;
BAK
!llY
CRt
JMIS
(
Z>
72..
IAIC
ERY
PIC
OU
CTS
; PA
STRY
ANO
PIE
CRU
STS
( 8
)
71
. 8M
ER
Y P
ROO
VCTS
: P
IZZA
CW
UST
( 3>
7
4.
BA
ltRY
PRO
DU
CTS:
FR
IED
PIH
(
7)
75
. SN
AIXS
: PR
ETZE
LS
< 3)
7
6.
SNA
Clt'
S;
CftE
ESE
PUFF
S C
Z>
77
. Sl
lAC
XS;
TO
RTIL
LA C
KIP
S
( 3
) 7
8.
SWA
CJtS
: CO
Rll
NG
t1A
.TI·
GIW
1t C
MIP
S (
5)
79
. St
lACJ
CS:
TRA
IL M
IX,
REG
UlA
R (
1)
80.
SNAC
XS:
POTA
JO C
KIP
S ~E V
ITK
HYO
IOG
ENAT
ED O
ILS
( 9
) 8
1.
SlllA
Cl:S
; 90
TATO
CH
IPS
RAD
E V
ITI
UN11
111R
OG
EIAT
ED
C1S
>
OIL
S 3
2.
SIW
XS
; FR
EM
a FR
lED
PO
TATO
ES,
FIU
ED
lll
WG
ETA
BLE
( 2>
on.s
1!3.
Sl
lMX
S:
FltE
NCll
FIU
ED P
OTA
TOES
, fR
lED
II
"11>
ROG£
1CAT
EO V
EGET
ABL
E O
ILS
8'.
SllA
CX
S;
FREl
lCll
H1E
D P
OTA
Tile
S,
FRO
ZEN
, Pt
tEPA
ttED
85
. SI
AC
KS;
PW
DIN
G.
lll:A
DY
•TO
EAT
8
6.
ME
TS
; V
Atl
llU
IC
E CR
EAM
87
. M
ET
S;
FRO
STU
IGr
C04M
ERCI
AL.
RE
MJY
'•TO
•SPR
EAI>
8
1.
ME
TS
; AS
SCllT
ED
CA
fiDIE
S
89
. M
ET
S:
ASSC
llTED
CA
HDY
BARS
9
0.
FA1S
g.
Oil
S;
BEE
F TA
LLOW
9
1.
FATS
& OI
LS
: B
Ut'T
EI
9l.
FAT
S &
OIL
S:
MJT
TOll
TALL
OW
93
. tW
ICA
IUN
E:
snca
:. Pt
lED
OIU
IATE
on.
. C
OIN
9«
.. M
llCiA
ltUIE
; S
llO
C.
PRED
CJllU
fATE
on
. S
O\'l
lEA
ll 9S
. M
AA
GM
INE;
sr
ux.
PR
EllO
UN
.\TE
Oil
. SO
YBEA
N A
llD
PA
Uf
96
. IW
tGM
INE
; S
TIC
X,
PREO
CN
?N.\1
£ O
IL0
SOT9
EAll
&
(1
t)
< S>
(
2)
( Z>
( 9>
c
4)
c 5
)
( 1
)
(10)
(
1)
CZD>
<S
Z)
(11
)
('1
)
30
'30·
tS
1S
30
2.0
SS
30
30
30
30
30
30
30
70
70
70
130 67
35
40
t.O " 14 14
14 ,, 14
14
17.4
3 3
.33
4.
t;Z
8.
71
2.7
6
23.7
8 10
.45
2.75
12
.30
5.15
3
1.0
0
5.24
t7
.21
3.50
34
.40
25.5
4 Z
7.63
29
.12
36
.26
33
.40
1Z
.'6
S.l
l T
.M
3.W
2.
S4
.oa
.44
2
.07
3
.M
.81
1.71
3
.56
11
.ZS
1
.07
.8
4
1.28
8
.47
.6
4 .7
3
8.66
7.
'l.9
3.t
s 3
.as
7.6/
J 3.
71
.OS
4.8
4
8.4
0
7.25
.4
2 10
.SIS
n.7
0
Z.9
7
5.93
1
.03
1.
08
1.0
0
5.5
9
,.6
6
1.a
t 1
.15
1:
5.93
3
.61
z.
n 1
.03
6.
65
1.21
1.
38
1.10
21
.49
2.8
7
11.3
2 8
.3'
17.3
1 5.
Z8
9.74
12
.85
'9.9
0
7.5Z
6.
Z1
15.1
5
.10
3.71
3.
1!3
4.3
7
15.0
4 S.
00
4.94
7.
78
1.66
6.8
3
3.80
11
. IJ
17.5
7 3
0.9
5
21.2
4 10
0.00
at
.'1
10
0.00
ea
.so
80.S
O
ao.5
o
2. U
1.
2.6
1.20
.a
7 .3
6 7
.14
3.
67'
s.az
2.43
,0
.81
2.
21
9.4
4
1.7
2
53.S
Z
2.7
0. 5
0.61
6.
JO
5a.S
4 17
.S9
14.4
3 Z
0.63
15
.35
23.3
2 21
.41
3.9
6
.9'l
2.
S4
.22
2.
91
.45
9.
02
1.8
5
11.1
0 t.
.5a
S.1
1 1
.03
39
.20
2.5
8
22.0
1 4
.27
33
.52
3.5
5
36.8
7 Z
S.6S
4
1.S
J Z
0.08
42
.30
13.2
5
80
.50
14
.60
14.7
3 3
1.4
3
30
.80
.15
2
.48
1.
11
o.oo
.ta
o.oo
.29
o.o
o s.
sa
2.7
9
.84
.2
3 .0
2 .2
.0
.oz ·" .02
.5
1 .oz
.3t
.06
.0
6
.20
.1a
.40
2.6
6
.89
.2
5
1.74
.8
1 S
.78
.48
4.
32
.45
4.S
S
Z.8
4 z.z
o Z
.18
4.66
6.
35
.1s
z.eo
1.S
f
.79
• 1
4
.98
.83
4
.79
.33
3.
20
.22
2
.19
.9
3
1.2
7
.95
Z
.16
.79
.68
.23
2
.49
1.
97
.01
.7l
.4S
.0
1 .4
0 .4
3 1
.13
3.
05
1.Ja
.n
2.
34
2.58
.2
8 5
.24
4.
76
.36
4.3
4
4.4
4
1..0
2 1
6.8
6
13.9
6 8
.40
22
.31
8.6
0
6.4
0
23
.69
1
9.9
6
.01
a.11
4.
95
.10
a.4
0
6.11
.1
9 14
.73
5.12
.t5
8
.12
S.
66
.05
2.8
3
.Ol
.59
o.o
o .0
4 .0
4 .9
2 .o,
.02
o.oo
.27
o.oo
.0
1
.03
·"
0.0
0
.OS
o.oo
.20
o.oo
.0
1 o.
oo
.18
.17
1
.JS
.1
2 .1
3 .r
n 2.
96
.01
o.oo
o.oo
o.oo
o.
oo
0.0
0
o.oo
.0
8 o.
oo
o.oo
o.o
o o.o
o 0.
00
o.oo
.0
2
.()11
.02
.0
1 .1
4 .0
1 .4
5 o.
oo
.18
.0
0
.1J
o.oo
.06
.0
3
.10
. "
o.oo
6.8
0
o.oo
2.2
&
o.oo
.9
9
0.0
0
3.6
1
o.oo
.98
o.
oo
10
.,,
o.oo
1.7
9
0.00
5.
20
o.oa
.B
Z 0.
00
13
.17
o.o
o 9
.08
o.
oo
10.2
5 0.
00
9.45
o.
oo
12..
86
0.0
0
5.95
4.64
3.
5S
.06
1.
80
.19
3.2
6
.93
1.04
.5
6 7.
95
2.24
6.
7'9
.05
6.es
.o
a
.06
.05
0.00
.0
1 O.
OG
3.7
8
0.00
.f11
.19
.09
.2
0 .0
1 4
.76
2
.69
.02
.05
o.oo
.02
.OS
1.54
.f1
1 .5
1 .1
7
.3S
.11
.zo
o.oo
a.9
9 .1
2 1
1.18
o.
oo
8.5
0
..26
.45
..27
.48
.ZJ
1.1
s
.Z6
.55
D.0
0
o.oo
.0
9 o.o
o ·°' .oz
o.oo
.5
9 o.
oa
0.00
.o
a .0
8
.oo
o.oo
z.
os
1.a
1
0.00
D
.00
t.3
9
1.14
.2
0 .0
1 2.
24
.'30
.05
o.oo
5.5
9
:S.3
6 .0
7 .O
! 9.
56.
t.99
.1
2 0.
00
6.05
1.~
1.n
o.oo
:ss.75
, .1
2 1.
68
• n
11
.u
2.zs
2.
01
D.0
0 25
.21
6.3
0
.O!'
o.oo
19
.98
16.6
8 .1
1 ·°'
22-
47
1a.
s1
• n
o.oo
22
.34
'9.6
2
.oe
.09
o.
oa
1a.1
1 12
.90

VI
0
A9
gre
pte
d F
ood
Pn
xb
:t D
escr
fptl
on
s
FIL
Lll
G
66
. BA
KEJt
T PR
OD
UC
TS:
'llKEA
T Cl
tACI
CERS
6
7.
BM
£JtT
PIO
OU
Crs
: Sl
fACI
C•TT
PE C
RACI
C£1l
68-.
BA
K!ll
Y P
RCIO
UCT
S;
GIW
WI
CllM
XER
S 6
9.
BAIC
ERT
PttO
DU
CTS
; 11
£LIA
~ST
7'0.
W
EJt
T P
ROD
UCT
S: S
QM
CltA
CXE
R
71
. IW
CSt
T P
Ral
tJC
TS;
BAIC
ElY
Cl'"8
S
72
. B
AG
RY
PR
<lO
UC
TS;
PAST
RY A
MI>
PIE
CR
UST
S
73
. BA
KERY
PttO
OU
CTS
; PI
ZZA
CRU
ST
74
, IA
KER
T PR
OO
UC
ts;
f .. IE
O
PIE
S
75.
SNAC
ICS;
P'
IETZ
ELS
76.
SIW
XS;
CHE
ESE
PUFF
S 7
7.
SllA
O:S
; T
OR
TIL
LA C
MJP
S
78
. St
lAO
CS;
C
Olll
l AM
O K
A.T
l•C
U.I
• tM
IPS
79.
SttA
CICS
; TR
A1l
MIX
. RE
GULA
R 8
0.
srw
xs;
POl'A
YO C
M1P
S MA
OE l
llT
ll l
l'IDRO
GalA
YEO
OIL
S
81.
SllA
OC
S;
POTA
TO C
HIP
S IW
>E V
ITM
UM
llYOR
OGEl
lATE
D O
ILS
llZ
. S
IWX
S;
FltE
lilCl
l FI
UEO
PO
TATO
ES,
FRIE
D
Ill
VEGE
TABt
.E O
ILS
83
. SN
ACI
CS;
FREl
lCll
FRIE
D P
OTA
TOES
. Fl
tIED
IN
in
DllO
GEl
lAtE
D
VEG
ETA
SlE
OIL
S 84
. SM
ACKS
; FR
ElilC
M
f'Rlf.
'I) P
Ol'A
TOES
. F
llOZ
Ell,
PR
EPAR
ED
IS.
SNAC
ICS;
P\JD
Olll
C, R
EADY
·TO
EAT
86
. S\
o'EET
S;
VA
llU.L
A
ICE
CREA
M
87
. S\
IEE
lS;
FRO
STIN
G.
CO
lllER
CIA
L, l
lEA
DT·
TO·S
PllE
AD
118.
M
ET
S;
AS
satT
ED
C
AND
IES
89.
SWEE
TS;
ASS
OltT
ED C
ANDY
IA
lS
91t.
FATS
& O
ILS;
IE
EF
TALL
CIV
91
. FA
TS &
OIL
S;
BU
l'T!R
9
2.
FATS
& O
ILS
; 'llJ
TTOf
C TA
LLOW
93
. *R
GA
IUllE
; ST
ICIC
, PR
£DCI
UllA
TE O
IL,
CO
U
9'.
MA
ltGM
1tle
; Sr
tCIC
, PR
EDCM
lllA
TE O
il,
SO'l'I
EAll
95
. IW
IGA
JtllE
; sn
oc.
PREI
XM
ltCA
TE O
IL,
SOf8
EAll
All>
P
AV
!
96
, M
ARG
ARI
NE;
ST
ICK
. Pl
lEO
OM
lllA
TE O
IL,
SO'IB
EAll
&
-····
--·-
-··-
-····
·---
-G,..
.. p
et'
10
0 tr
... f
ood-
----
·····-
······
-····
-····
··-···
···
20:1
O
ther
18
:2
18:2
. 1
8:2
18:2
18
:3
18:3
20
:4
20:5
22
:S
2Z:6
O
thet
'
Mon
os
n·6
tt
tc
.ct
n-3
not
n-3
""'
.,...3
n-
3 P
alys
o.oo
.05
.01
o.oo
.03
.05
z.os
,17
.1
0 1.
68
.04
.0
7 .5
7 .0
8 .0
1 .9
6
0.0
0
.oz
t.15
o.
oo
.oz
.01
o.oo
• 12
0.00
0.
00
.03
.1
1 0.
00
.Ot
0.0
0
.ZS
o.oo
o.oo
1.01
0.
00
3.00
o.o
o .1
'S
.01
.91
.05
.96
o.
oo
1.8
0
o.oo
7.2
7
o.oo
o.o
o .2
1 4.
00
.10
.19
.0
2 12
.78
0.00
.0
5 o.o
o 5.
73
.29
.01
0.00
14
.50
.06
.04
o.oo
4. 1
4 .0
1
.OJ
0,00
1.
25
.06
.01
.oz
o.oo
o.oo
.02
.os
.oz
o.oo
.OJ
o.oo
o.oo
o.oo
0.00
0.
00
.u
o.oo
o.oo
0.00
.61
.06
• 1
5 o.o
o .2a
o.o
o 1.
41
0.00
4.
02
o.oo
.6
5 .0
9
Z.20
o.
oo
2..3
6 .0
8
2.48
o.
oo
.13
o.oo
2'.0
7
.t1
.1
0 .1
7 15
.92
.32
0.00
.1
5 8.
54
.27
.32
o.oo
.5
5 .5
2 .2
7 0.
00
0.00
o.o
o .'
D
.18
.02
o.oo
.30
o.oo
.12
o.oo
.20
o.oo
.08
0.
00
.72
o.oo
.9'
o.oo
.S7
0.00
o.o
o o.o
o 1
,07
0
.00
.14
o.oo
.04
o.oo
.21
.01
.20
.oz
.06
o.o
o .0
5 .0
5 .3
2 0
.00
.4
8 o.o
o .2
3
o.oo
0.00
o.o
o .2
1 .7
.5
0.00
o.
oo
.73·
.1
8
1.6
0
-~
3.24
.3
0
.06
o.oo
28.5
5 .4
2 1.
24
0.00
.t6
.0
4
.03
.0
3
.04
.1
1 .1
7
.13
.0
4 .O
ft
• 10
.13
.2
5
.OJ
.2.8
.3
t
.t3
.09
.04
o.o
o .O
J .0
6 .0
6
.04
.38
.S
7 t.o
s .3
8 1.
54
.66
.54
.04
o.oo
o.o
o o.o
o o.o
o o.
oo
0.00
.0
2 o.o
o 0
.00
o.o
o 0.
00
.15
o.oo
.1
5 .1
5
o.oo
o.
oo
o.oo
o.
oo
o.oo
·°'
o.oo
o.o
o o.o
o o.o
o 0.
00
o.oo
o.oo
o.oo
0.00
o.o
o o.o
o 0
.00
o.o
o o.o
o
.02
.1
0 .0
7
.01 .oz
o.oo
0.00
o.o
o o.o
o .0
1 0.
00
0.00
o.o
o o.o
o .1
3 o.o
o o.o
o o.o
o 0.
00
0.00
0.
00
0.00
0.
00
0.00
.0
2 o.
oo
o.oo
o.oo
o.oo
.oo
0.00
0.
00
0.00
0.
00
.ZS
0.00
o.o
o o.o
o 0.
00
0.00
o.o
o o.o
o o.o
o o.o
o .2
1 o.o
o 0.
00
o.oo
o.oo
.or.
0.00
0.
00
O.OD
0.
00
0.00
0.
00
0.00
o.o
o o.o
o o.o
o
.05
o.oo
o.oo
o.oo
o.oo
o.oo
.03
o.oo
o.oo
0.00
o.o
o o.o
o o.o
o o.o
o .0
7 o.o
o .O
S • 1
, .1
9
.04
.01
o.oo
o.oo
o.oo
o.oo
o.oo
o.oo
o.oo
o.oo
.oo
o.oo
o.oo
0.00
o.o
o .0
1 .o
z o.o
o o.o
o o.o
o o.o
o o.o
o o.o
o o.o
o o.o
o .0
7
.oo
0.00
o.o
o o.o
o .0
1 0.
00
0.00
0.
00
o.oo
.01
o.oo
0.00
0.
00
o.oo
0.00
·''
0.00
0.
00
o.oo
.14
o.oo
o.oo
0.00
o.o
o o.o
o o.o
o o.o
o 0.
00
0.00
.1
0 o.o
o o.o
o o.o
o o.o
o .1
3 0.
00
o.oo
o.oo
o.oo
·°'
o.oo
o.oo
o.oo
o.oo
.oz
,..,
. 3
.1

V1
.....
..
FATT
T A
CID
Pll
0f'I
L£S
A$
CR
MS
PO
,0
0 C
tNIS
FOO
D
.. .,. '
-n-
• ~ o
f •1
111P
les/
stud
i• t
nclu
dld
1n t
he M
Nn
"W
8lun
~
tli.
fatt
y 1
1c:ld
dat•
-------------·----···~ p
er
,00 g
r ... f
ood
---·
·---
-···
·---
----
---·
·-··
··-·
··--
·---
--··
····
··--
· A
nre
si•t
ed F
ood
Pre
dic
t D
escr
ipti
on
s SerYf~
To
te\
To
tal
To
tet
To
t•l
To
t•\
Oth
er
"n"
Sfz
e L
fpid
T~
Sat
s M
onos
P
oly
s 1
4:0
1
6:0
1
8:0
2
0:0
S
•ts
14
:1
,6:'
1c
16
:1t
,8:1
c
16
:1t
SU
llfl
.Oll
Et
OR W
Fla.
.Ell
W.
WJtG
AR
IWE;
Stt~.
PRED
OM
INA
fE O
IL.
CANO
LA
98
. 1W
«OM
1ia:
; TU
B. ~uun on
.• SO
'tBEA
M
99
. 1W
tGA
ltlN
E;
TUB
; PU
DO
MU
IATE
OIL
, SO
'l'11f
.AM
'
SU
NFL
Ooa
OR
SA
Ffl
QU
(71
)
(4
')
( 9)
,00
. M
R.G
MIN
E;
lU8;
Pl
tED
a.lll
AIE
OIL
, SO
YBEA
N &
CAM
OLA
(14
)
101.
IW
tGA
lllt
ll!;
!W
tGM
INE
& S
UTT
Eii
8LEN
O
( 6
)
10
2.
MA
RG
AR
INE;
ST
lCIC
; V
EC
EtA
BlE
01L
S &
Alll
tCA
L FA
TS
( 4
)
103,
flW
tCA
ltIN
E;
TU
B;
PIEO
OM
UIA
TE O
IL,
CORl
l (1
4)
10
4.
ewtG
Alt
lNE
; T
UB
, PR
EDO
MIN
ATE
OIL
, S
Ol'
IUN
AIC
D PA
l.M
(10
)
10
S.
Mtt
GA
Ull
£;
LIQ
UID
, PR
EDO
MIN
ATE
OIL
. SO
TIE
All
10
6.
SAi.A
O
DltE
SS 1
llG;
ltAltC
H
lOT
. SA
LAD
D
W!S
Sllf
G;
fREl
tCN
A
llO
ITA
l.JA
N
1Da.
. N
AW
>nA
lst!
, ltE
QJL
AR
& C
HO
UST
E•O
L F
REE
(IEIC
A,RE
ICM
,RE1
4A,llE
BJ>
c 1
)
< 3
) (
8)
< 5
)
10
9.
SllC
RTE
lllfr
G; AMI~
FATS
Ir
VEG
ETA
9LE
Oll
S
(15
) ,1
0.
SllO
ltTE
NlN
C;
LARD
C
S)
11
1.
SllO
RTE
WU
IG;
LARO
M
D 8
£EF
TA
LLO
W
< J>
11
2. S
IOltT
EN
lltc;
V
ECET
AB
lE,
PRED
CIU
MA
TE O
il,
SOT6
EAll
(28
) ,1
3.
SllO
RT
Elll
NG
; vt
GE
lAQ
LE
. Pt
t£D
OM
INA
T£ O
il,
SOY
IEA
M,
( 2
) C
OO
IER
CIA
l U
SE
11
4.
SllO
lffE
NlN
G;
Y'E
CETA
Bl.1
', PR
EOO
IUllA
TE
Oil
, SO
TIEA
M &
C 2
)
SVllF
LCM
:t &
PAL
M O
ll.S
11
5.
COOI
CUIG
01\
.: P
11EO
OMIM
.1E O
ll,
SOTI
EAJI
1
16
. SA
UD
0
1L
; W
l1t1
Elt
lza>
vtG
ET
A9l
E O
JLS
, 17.
8A
8T
FOC
OS;
ST
RAIM
ED L
Ntl
BRO
TH
11
8.
IAB
T
fOO
OS;
ST
RA1N
EO B
EEF
UV
ER
11
9.
IAIT
FO
OO
S;
Vl:G
ElA
Bl.E
S &
8E£
f O
IMllE
R
,20
. B
MT
FOO
Os;
CltlC
ICEK
&.
MOO
DLE
Dill
llEI.
t21
. U
IY F
OO
DS;
T
a>O
lER
CIU
CIC
D S
JEV
122,
1M
l1A
110N
PJlO
OU
ClS
; C
OFR
E C
R£NE
•, PV
IOE
VIT
M
UU
ltlt
011
.S
123.
lM
tTA
TIO
N P
ltOD
Uet
s;
SOUR
CR
EM
. *D
E V
ITll
ll'tO
IOG
!IA
TED
~GETMl.E 0
1 L
(10
)
( 4
) c
1)
c 1
)
c 2)
(
2)
( 1
)
c 4
)
c 1
)
Gr ..
14
14
14
14
14 ,, 14 ,, 14
30
30
15
13
13
13
13
13
13
14
14
60
60
60
60
170 2 30
80
.50
80
.40
80
.40
25.Z
2 1
4.4
8
52
.90
9.
SIJ
13
.32
1
4.2
0
33
.48
2
9.1
8
15
.06
1
3.2
1
28.7
0 3
4.9
6
80
.40
1
8.0
4
12.2
5 4
8. 1
1 16
.50
81.7
9 8
0.5
0
80
.40
8
0.4
0
20.2
5 2
4.3
5
40
.06
1
3.7
8
26.5
1 1
6.6
7
50
.06
10
.21
11
.09
1
3.7
3
30.Z
O
32
.93
1
2.1
9
17
.61
32
.73
26.5
2
80.-
'0
8.1
6
11
.85
J0
.47
J4
.S5
SJ.
11
5.53
8.
0'5
19.6
9 Z
3.04
41
.29
.40
6.'
4
10.Z
1 22
.82
34
.93
1.
41
4.8
1
9.3
6
19.0
6
10
0.0
0
99.4
7 10
0.00
10
0.D
O
10
0.0
0
17.7
2 2
7.8
7
1.6Z
3
9.2
7
2.91
47
.57
18
.n
24
.45
35.8
0 ~-40
52
.69
1S
.04
'3.7
1
12
. 11
40
.87
7.
17
44
.l.4
2
6.9
1
60.8
1 9.
40
100.
00
20
.78
29
.06
42
.47
24
.05
100.
00
10
0.0
0
9.3
l 4
.10
Z.8
5 1.
61
4.02
3
5.4
8
11.3
7 1
4.0
4
t.5
5
9.5
4
.JS
4
. 19
.06
1
.42
.1
0
t.1
3
.01
.4
4
.01
.57
3 ·"
31 .
34
19.S
o z.
s8
4.41
39.5
0 4Z
.06
40.3
7 4S
.69
3.51
.3
3 .7
1 .6
0
, .35
.1
1
.68
.3
8 1
.50
.7
0
1.9
4
.64
6.10
8.
13
.08
.07
.0
8
7.9
't
8.39
6.
7'9
S,3
4 5
. 18
5.62
.03
6.39
4.
74
1.8
0
,,.5
2
.45
9.
07
.04
8.61
.1
1 1
3.0
4
6.2
9
7.1
6
4.46
J.
90
.47
,24
.25
.65
.32
.4
7
o.oo
0.
00
o.oo
.37
.7
2 o.o
o
.23
4
.50
D.0
0 O
.DO
.J
O
.32
.22
.35
.31
O.D
O
o.oo
o.oo
.09
.0
7
.06
o.oo
2.S.
79
22
.88
o.oo
2
1.9
' 1
1.0
4
o.oo
17
.11
11
.37
.06
0
.00
30
,85
15
.Ta
.35
o.oo
2
1.1
3
17
.98
.7
4 o.
oo
26.2
S
23
.09
.0
7
o.oo
19
.8.S
1
0. 1
3
.09
0
.00
22
.0S
1
0.Z
l
.OS
IS.O
D
3.7
7
0.00
0
.00
0
.00
• ,
5
0.0
0
25
.0I
5.2
3
.09
4
.96
z.
10
.Z9
.60
o.oo
.0
1
o.oo
,5
.6t
3.6
4
.08
4.
15
1.73
,,
5
.31
o.oo
.0
3 o.
oo
9.7
0
_,,
.0
2
l.3
6
t.Z
l .f
f/
• ta
0.0
0
.03
0
.00
8
.16
1
.0S
1.02
1
5.J
Z
11
.24
1.33
22
.74
13.9
4 2.
311
25
.56
1
9.3
3
.21
12
.72
,0
.45
.1
9
12
.53
1
1.3
S
.oa
.z1
.25
't
.01
0.0
0
.:so
.39
.6
8 .'3
9 • 9
't
.sa
o.oo
o.
oo
o.oo
o.o
o
1.1
2
2.37
o.
oo
.10
.05
.10
35
.61
14
.98
0.
00
39.1
&
1.34
0
.00
3
3.3
' 2
.48
o.oo
29
.76
13.8
5 o.
oo
28.5
9 3
2.1
7
.34
19.o
a 9.
66
o.oo
o.
oo
o.oo
o.
oo
o.oo
2
1.s
a 1
4.a
9
.01
9.
57
·°'
5.2
0
.21
1.9
4
.04
.63
.09
.6
' .0
1
.33
.04
.62
T.1
1 4.~o
3.9
7
3.1
9
1.86
,6
T
.39
.0
9
.19
6,07
.24
.15
o.oo
.41
.68
0.0
0
.01
• 18
.01
.oo
.oe
.oo
.00
.06
.Ol
.oo
.01
.00
.0
0 .0
7
.DO
o.o
o 13
.61
o.oo
.3'
Z.2
2 1
.09
0.00
.7
5 0.
00
.16
0.
00
31.5
3 T
.61
.11
.OJ
J7.6
i ..8
8
• 11
0.00
3.
0Z
.31
.OS
O.D
O
.'5&
.0
6
_,,
o.
oo
1.o
a .1
0
.09
0
.oo
.57
.01
.11
0.0
0
1.3&
.0
0
.07
0.
00
.90
·"
.oz
o.oo
3.92
z.
17

\JI
N
Ag
gre
gat
ed F
ood
Pro
du
ct O
escr
fptl
on
s
SUlll
FlO
WP
DR S
AFFL
OWER
9
7.
MR
GA
RU
iE:
ST
UX
, PR
EDO
tJllA
TE O
il,
CA
llOlA
9
8. MltGAAI~;
TUB
, l'tl
EOOM
IWAT
E O
il,
SOY
BEA
tl
99 •.
*RG
AA
IME;
TU
B; P
ltEtlO
UN
A.T
E O
tL,
SOTB
EAW
l
SUN
FUN
ER O
lt SA
FFLO
WE1
' 10
0.
'4ARC
Mrre
; Tt
JB; ~IllATE O
il.
SOY
8EA
N r
. CA
NOl.A
10
1.
MA
RGA
RIN
E;
MAR
GAAU
IE &
8U
TJE1
t BU
!llO
10
2. I
WIG
AA
INE:
ST
ICIC
: V
EGET
AltE
OIL
S &
AN
IML
FATS
1
03
. M
ICA
Ril
lE:
TUB;
PR
EDCI
MIN
ATE
Oil
, CO
RN
HK
. *R
GA
RIW
E;
TUB,
PR
EOOM
IIC4T
E O
il,
SOY
BW
AND
PA
LM
105.
W.lt
GN
UllE
; lI
CU
ID,
PRED
OM
INA
TE O
IL,
SOY
BEA
N
,06
. S
AlA
O
OR
ESSU
CG
; Ra
AllC
N
107.
SA
i.AD
DR
ESS
l•G
; flt
£11C
H M
D
ITA
LIA
N
10
8.
ltATO
NllA
lSE,
Rf
GU
lAR.
Ir
CHOL
ESTE
ROL
FREE
C~EXA.tEICM,RENA,ltEBJ)
10
9.
SPIO
RTEW
IWG;
A
NIK
ft\.
FATS
& V
EG1:
TABL
E O
ILS
11
0.
SPIO
RTEM
ING
; LA
RO
11
1.
SNO
RTE
llUrG
; t.A
AI>
ANO
8EEF
JA
l.lO
V
11
2.
SMO
RTE
lltN
G;
YEG
ETA
8\.E
, PR
ED
Ottl
l-TE
OIL
, SO
YBEA
N
113.
SHO
RTEN
tNG;
VEG
ETA
BLE,
"IE
DCM
tNAT
E O
IL,
SO'l'I
EAtl,
C
CM
tEltC
tA\.
US
f
11
4.
SHO
R'U
:lllil
lG;
VEG
ETA
BLE.
PI
U!DO
MUI
ATE
OIL
, SO
'l'BEA
N
& S
UM
FLO
IER
' PA
\.M O
ILS
115.
CX
>OIC
ING
OIL
; PR
EDOM
INAT
E O
IL,
SO'l'8
EAM
116.
SA
LAD
OlL
; W
INTE
l'IZED
VEG
efABL
E O
itS
11
7.
BAST
fl
XO
S; ST~ltlED
LAM
B IR
OTK
11S
. B
AIT
FO
CO
S;
STRA
UIED
IU
F L
IVER
1
19
. IA
BT
FOO
DS;
Y
EGET
Al1
.ES
& B
EEF
DIN
NER
12
0.
8AB
T FC
Q)S
; Cl
flCX
EK &
. ltO
OO
t.E D
IMllE
R
12
1.
MS
T ~S:
Tm
CL
ER
CH
lQCE
Jf S
lE\I
12
2.
IMIT
AllO
M P
Ra>
Uer
S; C
OFF
t:E C
RU
MER
. M
OE
\11 JK
U
IJlt
C O
lLS
1Z3.
IM
ITA
TIO
tc f
lRO
OU
CTS;
SO
OR ~,
MAD
E V
llff
trr'O
tlOG
9tA
TS>
VEG
ETQ
l.E O
il
--·-
·--·
···-
·-··
·---
-··G
rlll
llS
pe1
" 10
0 9r1
111&
foo
d-·-
-····
-···-
-·--
-·--
---·
··---
--··-
· ZO
: 1
Oth
er
18:2
18
:2
t8: Z
1
8:2
18
:3
18
:3
20:4
2
0:5
22
:S
22:6
O
the
r
Mon
os
n-6
tt
tc
.ct
n·3
n
ot
n·3
n
·6
n-3
n
·3
Pol
ys
.64
.49
5.67
.1
5
.28
24
.01
.oa
.oa
30.oo
.38
1.61
.1
6 1.
41
.16
t.4
S
.Z3
2.36
.6
5 2.
45
.S4
.56
.34
.66
.5
9
.70
.68
11.0
6 .2
4 .9
3
.31
Z.8
8 1.
09
.09
.2
1 10
.44
.'6
0.
00
o.oo
6.34
1.
04
.14
o.oo
30.7
3 .0
7 o.o
o .3
7 20
.95
.13
o.oo
o.oo
29.0
1 o.o
o .1
S
.21
18.3
1 0.
00
.11
.2
7
19.8
7 o.o
o .0
7
.04
16.6
6 o.o
o
.24
.0
6
11.6
4 .2
1 .8
2 o.o
o 10
.70
0.00
o.o
o 0.
00
5.S
l .1
0 .z
o .3
2 19
.87
.57
o.oo
o.oo
5.1
9
0.00
o.oo
0.00
17
.24
0.00
.OS
.15
35.4
7 0.
00
.sa
.86
40.3
1 o.o
o o.o
o .0
6
.1a
.01
0.00
.0
1 .O
t .0
3
.01
0.00
o.o
o .oo
0.
00
.53
.20
D
.00
.07
0.00
.3
4 0.
00
.66
0.
00
• ,,
0.0
0
o.oo
o.oo
r.48
o.oo
1.51
.2
3 Z
.38
0.00
.7
8 .1
7 1.
22
0.00
.8'
.45
.76
2.S8
.31 .oo
.11
.61
Z.9
2 0.
00
Z.6
2 0.
00
1.so
1.
4a
1.:s:s
.0
9 .1
5 .1
0
Z.5
7
.14
.2
s o.
oo
2.02
.o
a
Z.2
4 .0
8
.28
0.00
.2
3 0.
00
3.88
.6
6
3.63
.3
1
s.sa
o.o
o
2.64
o.o
o .6
4 .2
8 .0
3 o.
oo
0.00
0.
00
0.0
0
.03
o.o
o .0
0 .0
0. o
.oo
0.00
0.
00
.41
0.0
0
.65
.4.S
.9
0
1.3Z
.2
6
.92
2.56
4.
Zl
.10
.OT
.01 .oz
.02
o.oo
.Z3
.19
0.00
.1
0 .4
2 0.
00
o.oo
1.a
o.o
o 0.
00
o.oo
o.oo
o.o
o 0
.00
o.o
o
0.00
o.oo
0.00
o.o
o o.o
o o.o
o 0.
00
0.0
0
0.0
0
o.oo
.31
0.00
o.o
o o.o
o 0.
00
.17
o.oo
o.oo
o.oo
0.00
o.o
o
0.00
0.
00
0.00
o.o
o 0.
00
o.oo
o.oo
o.oo
0.00
o.o
o o.o
o 0.
00
o.oo
0.00
.2
6
o.oo
0.00
o.o
o 0.
00
1.03
o.oo
o.oo
o.oo
0.0
0
o.oo
o.oo
0.0
0
o.oo
0.
00
o.oo
0.00
o.
oo
0.00
o.o
o o.o
o .0
1 0.
00
0.00
0.
00
.Ot
o.oo
o.oo
0.00
o.o
o .oz
.1
9
0.00
o.o
o o.o
o .4
9 0.
00
o.oo
o.oo
0.00
0.
00
o.oo
o.oo
o.oo
o.oa
.1a
0.00
0.
00
0.00
0.
00
o.oo
o.oo
0.00
o.o
o 0.
00
0.00
0.00
0.
00
0.00
o.o
o .2
7 o.o
o 0.
00
o.oo
o.oo
.Zl
.02
0.00
o.o
o 0.
00
o.oo
.14
.or.
.06
.o
t .o
a D
.00
0.0
0
O.D
O
0.00
0
.00
.0
1 .oo
o.o
o o.o
o .0
1 .0
1 0
.00
0
.00
o.o
o .0
0 o.o
o o.o
o o.o
o o.o
o .S
J
0.00
o.o
o 0.
00
o.oo
.oz
,~
4.1