A comparative study of positive versus negative polarity ...
55
University of the Pacific University of the Pacific Scholarly Commons Scholarly Commons University of the Pacific Theses and Dissertations Graduate School 1986 A comparative study of positive versus negative polarity in the A comparative study of positive versus negative polarity in the treatment of acute ankle sprains utilizing high voltage treatment of acute ankle sprains utilizing high voltage electrogalvanic stimulation electrogalvanic stimulation Lauren Michelle Wells University of the Pacific Follow this and additional works at: https://scholarlycommons.pacific.edu/uop_etds Part of the Medicine and Health Sciences Commons Recommended Citation Recommended Citation Wells, Lauren Michelle. (1986). A comparative study of positive versus negative polarity in the treatment of acute ankle sprains utilizing high voltage electrogalvanic stimulation. University of the Pacific, Thesis. https://scholarlycommons.pacific.edu/uop_etds/2122 This Thesis is brought to you for free and open access by the Graduate School at Scholarly Commons. It has been accepted for inclusion in University of the Pacific Theses and Dissertations by an authorized administrator of Scholarly Commons. For more information, please contact mgibney@pacific.edu.
Transcript of A comparative study of positive versus negative polarity ...

University of the Pacific University of the Pacific
Scholarly Commons Scholarly Commons
University of the Pacific Theses and Dissertations Graduate School
1986
A comparative study of positive versus negative polarity in the A comparative study of positive versus negative polarity in the
treatment of acute ankle sprains utilizing high voltage treatment of acute ankle sprains utilizing high voltage
electrogalvanic stimulation electrogalvanic stimulation
Lauren Michelle Wells University of the Pacific
Follow this and additional works at: https://scholarlycommons.pacific.edu/uop_etds
Part of the Medicine and Health Sciences Commons
Recommended Citation Recommended Citation Wells, Lauren Michelle. (1986). A comparative study of positive versus negative polarity in the treatment of acute ankle sprains utilizing high voltage electrogalvanic stimulation. University of the Pacific, Thesis. https://scholarlycommons.pacific.edu/uop_etds/2122
This Thesis is brought to you for free and open access by the Graduate School at Scholarly Commons. It has been accepted for inclusion in University of the Pacific Theses and Dissertations by an authorized administrator of Scholarly Commons. For more information, please contact [email protected].

A Comparative Study of Positive Versus Negative Polarity
in the Treatment of Acute Ankle Sprains '--'-'---
~----
Utilizing High Voltage Electrogalvanic Stimulation ~--
A Thesis
Presented to
the Graduate Faculty
of the
University of the Pacific
In Partial Fulfillment
of the Requirements for the Degree
Master of Science H-----
by
Lauren Michelle Wells
January 1986
.---;;

This thesis, written and submitted by
Lauren M. Wells
is approved for recommendation to the Committee
on Graduate Studies, University of the Pacific.
Department Chairman or Dean:
Thesis Committee:
Chairman
Dated --------~--------------~------------

TABLE OF CONTENTS
PAGE ~----
H----~-
Acknlowledgments iv
List of tables ....................................... v
List of figures ...................................... vi
Introduction ......................................... 1
Materials and methods ................................ 13
Results .............................................. 18
Discussion ........................................... 19
Summary . . . . . . . . . . . . . . . . . . . . . . . . . . . . . . . . . . . . . . . . . . . . . . 25
Literature cited ..................................... 26
iii

ACKNOWLEDGEMENTS ~--
I would like to thank Stockton Orthopaedic Medical M---
Group for referring patients for treatment. Without their
support, proper medical care and follow-up, the study would
not have been possible. Also, I would like to thank Gerry
Solberg for his assistance in developing the treatment pro-
tocol. My thesis committee has also been helpful in
completing this study. In particular, I would like to thank !o-l-----
Dr. Funkhouser for her support and understanding of some-
times difficult situations and circumstances. Last, but not
least, I would like to thank my parents for the opportunity
and encouragement necessary for me to complete this degree.
;--,-- ------ ---
i n
g
iv

TABLE
1.
2.
LIST OF TA.BLES
Ankle-Foot Volume and Range of Motion measurements of patients treated with negative polarity of high voltage electrogalvanic stimulation. Data presented as volume (ml), dorsiflexionplantorflexion (degrees of movement) •..........
Ankle-Foot Volume and Range of Motion measurements of patients treated with positive polarity of high voltage electrogalvanic stimulation. Data presented as volume (ml), dorsiflexion-plantarflexion (degrees of movement) .......... .
iv
PAGE
29
==-- -- ---c r-.; -
30
;:;:;- ----- ----

LIST OF FIGURES ,-=
FIGURE PAGE --------
p--
1 DLagram of High Voltage Electrogalvanic Waveform . . . . . . . . . . . . . . . . . . . . . . . . . . . . . . . . . . . . . . 12
2 Range of Motion versus Time' of all Subjects . . . . . . . . . . . . . . . . . . . . . . . . . . . . . . . . . . . . . . 31
[2---------
----------
3 Volume change versus Time of all Subjects ......................... _............. 32
4-11 Volume versus Time and ROM versus Time for negative polarity group subjects .......... 33
12-19 Volume versus Time and ROM versus Time for positive polarity group ................... 42
~--
~-------
v

Introduction
Electrical stimulation has long been used in the
treatment of a variety of ailments. Its current uses range
from muscle re-education and orthotic substitute to
scoliosis management and edema control. I chose to study
the effect of electrode polarity in high voltage
electrogalvanic stimulation in the treatment of edema for
several reasons. I had access to subjects because I was the
only physical therapist at the Stockton Orthopedic Medical
Group. High voltage electrogalvanic stimulation is a
commonly used modality in treating edema (Brown, 1981).
High voltage generators have a polarity switch, and the
direction manual which accompanies the Electro-Med generator
used by the Stockton Orthopedic Medical Group states that
the negative pole should be used for edema reduction.
(Instruction manual for high voltage Electrogalvanic
Stimulator, 1977). However, the effect of electrode
polarity on edema reduction has not been demonstrated, nor
documented in the literature.
In rilinical practice electrical stimulation can be
provided by a variety of generators. Low voltage
stimulation (using less than 150 volts) has been used for
many years and the effects are well understood (Osborne and
Holmquest, 1944). More recently, high voltage electro~
""" ,~ ~
~-~--
--------
r-" = -- -------
- - ---<=;=~~
~--~~-~~
- -- ----

2
galvanic stimulation (using greater than 150 volts) has been
introduced for clinical use (Instruction Manual for High
Voltage Electrogalvanic Stimulator, 1977).
The major effects of low voltage electrical current
include:
1) Iontophoresis, which is electrode and cellular
polarization due to ion transfer. Clinically this technique
can be used to drive compounds through the skin.
2) Electrophoresis, which is the movement of charged
cells or particles. This technique is not used in the
clinic; it can lead to caustic anion and cation accumulation
at the electrode interface.
3) Electro-osmosis, which is a shift in cellular water
content. This effect can be utilized in edema control.
4) A change in nerve sensitivity, which can be
effective in controlling pain and spasm.
5) A mild heating effect in tissue between electrodes
due to the conduction of current.
6) A slight increase in circulation due to the mild
heating effect and the increase in 02 and nutrient demand of
contracting muscle (Wolf, 1981).
In most instances, the current form (AC or DC) as well
as its magnitude and frequency determine the extent of these
effects in low voltage electrical stimulation. The effects
0---~-------------
~----------
~
~=----
~~-~-

-~----~-~-----~--------------------------~------- -------------------- -
I
3
of high voltage electrical stimulation are not as clear, but ,_...,- -----------
it is known that iontophoresis and electrophoresis do not
occur, nor does temperature change (Killian, 1985).
Electro-osmosis may or may not occur. There does appear to
be a change in nerve sensitivity and a slight increase in
circulation resulting from high voltage electro-galvanic
stimulation (Sohn, et al. 1982).
Treatment techniques can be either monopolar or
bipolar. In monopolar treatment one electrode (positive or
negative) is placed on the treated area and the other
electrode is placed in a remote location. In bipolar
treatment both the positive and negative electrodes are
placed on the treated area and in relative proximity to each
other (Killian, 1985).
The effects of current passed through tissues and the
magnitude of the reaction depend on the tissue type, pulse
duration, the type of waveform, current density through a
specified area, and the frequency of the current used
(Killian, 1985).
The perception of pain that many people anticipate
prior to being stimulated is motivated by fear of high -------
voltage generating a high average current of long pulse ~-~~
duration. Adjusting pulse duration and voltage so that
there is a low average current and therefore a less painful

stimulus is the basis of both high voltage electrogalvanic
stimulation (EGS) and low-voltage electrical stimulation
(Benton, et al, 1981). If patients are to tolerate the
treatment, they must not be stimulated with a higher
amplitude (higher current) than their pain threshold.
Therefore, high voltage electrogalvanic stimulation uses a
short pulse duration (measured in micro-seconds) and high
voltages to deliver an average current at non-painful
levels; low voltage uses a longer pulse duration and lower
voltages to deliver an average current at non-painful
levels. The pulse duration on a high voltage stimulator
range from 50-75 microseconds and may be delivered at 20-80
4
pps, while low voltage pulse durations last 300 microseconds
and are usually delivered at a frequency of 35 pps (Killian,
1985; Benton, et al, 1981).
The waveform of the pulse is also important in how
stimulation is perceived and how it functions in treatment.
Most low voltage generators are battery operated and convert
continuous direct current into rectangular pulsed direct
current. The high voltage generator used in this study
changes 120 volt, 60 cycle household current into dual
spiked pulsed direct current. The interval between the
pulses is much longer than the duration of the pulse. The
current is off more than it is on. This allows for the low
,.._..,_ ----------R- --- ------
-- --- --

5
average current (approximately 1.5 milliamps in typical ~ ------.=-::---::..:__-:__-= ~---
treatment) delivered by high voltage generators despite peak
currents between 300-400 milliamperes (Killian, 1985).
The short pulse duration of high voltage direct current
stimulation permits selective stimulation of predominantly
sensory and motor axons and much less stimulation of pain
conducting fibers. Consequently, such stimulation is more
tolerable.
The short pulse duration does not seem to cause the
chemical and thermal effects seen with low volt, long pulse
duration direct current stimulation. Therefore, high
voltage electrogalvanic stimulation may be used for extended
treatment periods with no apparent side effects. Because
pulse duration cannot be shortened, any increase in pulse
frequency rate will increase average current. Such an
increase will cause a stronger contraction of the stimulated
muscle and will increase the patient's perception of the
current, but it will not increase the depth of penetration
of the current.
However, increasing the amplitude of the peak current
--- - -- ---
will increase the depth of penetration of current into ----
------
tissues. Some electrogalvanic stimulators have maximum peak
currents of approximately 300-400 milliamperes, compared
to the 80 milliampere current of low voltage stimulators.

6
Even though the peak currents in electrogalvanic stimulation
are 4-5 times that of low voltage electrical stimulation,
they are safe because the average current is low (Smith,
1981). Because of the greater penetration of current with -------
electrogalvanic stimulation, deep nerves and muscles can be
stimulated effectively. As a result, muscle contraction is
effective and can be achieved even without placement of the
electrode on a nerve or muscle motor point. -----
The deep penetration obtained from high voltage
electrogalvanic stimulation is not limited to peripheral
nerves and skeletal muscles. It may be possible to
stimulate sympathetic nerves and the smooth muscles of
blood vessels directly or indirectly (Alon, 1981).
The current physiological theory concerning pain
reduction through electrical stimulation is that stimulation
can release endorphins and enkephalins from several sites in
the central nervous system (Killian, 1985). However, the
supposed release of endorphin/enkephalins is theoretical.
This has not been demonstrated in humans, and the mechanism
by which electrical stimulation of a peripheral body part
can stimulate release of a substance from the central ner-
vous system is not clear at present. Two different methods
are presumed to achieve endorphin and enkephalin release E--
(Francis, 1983).
.-..,---------

7
-~
===--------
One method is to use a supra-painful stimulus to a very ==----=---'--'=--=---
narrow area at a trigger point, acupuncture point, or motor --- ------ --
point. Trigger, acupuncture and motor points are often the
same points, but they are defined differently. A trigger
point is one where pain, numbness or tingling radiate from
the point while being palpated. The name trigger describes
the use of the index finger to press the point and "trigger"
the radiation. An acupuncture point lies along the meri---~--
. ~
~---
dians of the body (Tappan, 1978). A motor point is where a
nerve to a muscle lies close to the skin (Brobeck, 1979).
The Western use of acupuncture points has been used for many
years without realizing it, because many trigger, acupunc-
ture and motor points are the same (Paris, et al, 1983).
The other method is to deliver non-painful stimuli to
larger areas (usually to a painful area where a trigger
point cannot be isolated, or to an injured area) in which
pain fiber stimulation is minimized and sensory fiber
activation is maximized. High voltage electrogalvanic
stimulation can be used to deliver either a supra-painful
stimulus or a non-painful stimulus (Killian, 1985).
By using larger electrodes, controlling intensity, and
having very short pulse durations, selective non-painful
sensory fiber stimulation can prevail. Both treatment ' methods appear to function equally well in most patients
(Killian, 1985). =- ---- ---e

8
The mechanism by which high voltage electrical stimula-
tion functions physiologically in increasing joint mobility
is unclear. The use of long pulse duration, low voltage
direct current is known to cause softening of some tissues
under the negative electrode due to "liquification" of the
protein (Osborne & Holmquest, 1944, p. 38). This softening
is attributed to an increase in alkalinity due to the chemi-
cal effect of the stimulation (Alon, 1981). What tissues
are affected by the current depends on the depth of penetra-
tion and tissue type. Current will flow more easily through
substances with low impedance than through substances with
high impedance. The relative conductivity of tissues is
approximately equal to their content of water and available
ions. Skin and bone are not softened by electrical stimula-
tion because of their high impedence (5-16% water and ion
content compared to 75% water and ion in muscle) (Benton, et
al, 1981). In high voltage electrogalvanic stimulation such
effects are practically non-existent, thus such a mechanism
is unlikely to explain the result (Newton and Karselis,
19 83) .
With low voltage electrical stimulation peripheral
circulation can be increased to the skin, muscles, core and
any combination of these. High voltage pulsed direct
current does not seem to increase the core circulation of
normal subjects (Alon, 1981).
~----
~----- -----
~---
i""'""': -·---------
;;;;---==-----
b'--
--~:-- -

9
It may, however, have a electrical effect on blood
vessels to increase blood circulation (clinical obser-~-~·---
vation). When electrical stimulation is used to increase ~-----
peripheral blood circulation the results that occur could
be attributed to either a direct or an indirect effect on
the circulatory system (Alon, 1981).
The direct effect could be direct activation of the
sympathetic fibers of the autonomic nervous system. The """---
indirect effect could be achieved by three different _c:-
mechanisms. The first would be the circulatory response to
the chemical changes of acid and alkaline under the positive
and negative electrodes respectively. Such an effect would
be unlikely to occur when high voltage pulsed direct current
is used because the pulse characteristics eliminate the
chemical changes under the electrodes (Newton and Karselis,
1983). ------
The second possible indirect effect is through the
somatic sympathetic reflex. Such a response has been
demonstrated on the sympathetics innervating a dog's
kidneys. Whether such an influence affects the autonomic
innervation of the peripheral arteries is still unclear
(Alon, 1981).
The third possible indirect effect is from the pumping
action of muscles. Effective venous return requires strong

10
intermittent contractions. High voltage pulsed direct - ----- ---
current, because of its depth of penetration and relatively
comfortable stimulation, can elicit such contractions (Alon,
1983).
Acute ankle sprains, strains and fractures develop
post-traumatic edema which seriously limits recovery due to
abnormal adhesion formation (Cyriax, 1978). The primary
goals of treatment are to decrease pain and swelling and
increase mobility. If range of motion limitation is asso-
ciated with pain, then reduction of such pain should improve
joint mobility (Nirschl and Sobel, 198li Grava and Schelberg-
Karness, 1983). Edema reduction would be a secondary gain
because the patient would be more willing to move the
affected part thus reducing adhesions.
Post-traumatic edema has traditionally been treated
with compression, elevation and ice (Lehman, et al, 1974i ~---=--- -- ----
Quillen and Rouillien, 1982). This treatment is currently
being supplemented with high voltage electrogalvanic stimu-
lation. The literature which accompanies the Electro
Galvanic Stimulator (Electro-Med Health Industries, Miami,
FL) used by the Stockton Orthopedic Medical Group suggests
that negative polarity be used to treat edema. There is no
literature available to verify that negative polarity is
more effective than positive polarity. - ------ ----
- ----------
~---

11
The object of this study is to test the use of both ~-
positive and negative polarity of high voltage ;;--
electrogalvanic stimulation in the treatment of edema in
acute ankle sprains. The null hypothesis of this study is
that polarity has no effect on edema reduction.

12
~-----
Figure l.
(a) "High voltage" paired spikes are most frequently
monophasic, resulting in ion flow in one direction.
Because of their short duration, spikes are paired
and required high amplitude to generate neural
excitation (Benton, et al, "1981).
-------
~

13
Materials and Methods
Patients participating in this study were seen
initially by one of the physicians of the Stockton
Orthopedic Medical Group, Stockton, California. These
patients were then referred to Physical Therapy with a
diagnosis of second degree ankle sprain. (In a second
degree ankle sprain, the ligament is weakened, but there is
no instability. Weight bearing is painful and range of
motion is limited. Tenderness is marked over the anterior
talofibular ligament. Swelling and ecchymosis are signifi-
cant. X-rays are normal. Ice, elevation, taping and non-
weight bearing are the immediate treatment (Floriani,
1976.)) All patients were treated according to the protocol
shown below. The information from those who attended 75% of
scheduled appointments was used as data in this study.
Subjects whose information was included signed a release of
information form after discharge.
Protocol:
Once a patient is referred to the clinic the stability
of the ankle is re-evaluated according to the method of
Hoppenfeld. The anterior talofibular ligament is checked
for a positive drawer sign (when the talus slides anteriorly
from under the cover of the ankle mortise). If the patient
has a positive drawer sign, they are not a candidate for the
R __ .::-_ ~--------~:___-:_:_.::E:
'---"----

14
study. Only those patients with ecchymosis and swelling,
without ligamentous instability may participate.
Once the stability of the ankle is verified, range of
motion is evaluated. Dorisiflexion and plantarflexion are
measured with a goniometer. (When the angle between the
tibia and 5th metatarsal is at 90° the ankle is in neutral
position and is re-defined as 0° for dorsiflexion-
plantarflexion measurement. Normal dorsiflexion range is
considered 0° - 20° and normal plantarflexion is considered
0°- 50°. Many individuals do not have "normal 11 range of
motion, (ROM), therefore the injured ankle is compared to
the non-injured ankle (Esch & Lepley, 1974). The goal of
treatment is equal ROM for both ankles.
Volumetric displacement measurements are taken to
quantify the amount of edema. A plexiglass tank (30 x 45 x
15 em) with a side spout was built for the study. The tank
is filled to the base of the spout. The patient places
their non-injured foot in the tank with the foot resting on
the bottom. The water run-off is collected in a graduated
cylinder and the volume of water is recorded. The same
procedure is repeated with the injured ankle. The
difference between the two measurements is the volume due to
edema. The normal slight size or shape difference between
left and right feet does not result in a significant volume
difference (Paris, et al, 1983).
~----
-----,_,. _________ _

15
Following initial evaluation, treatment is begun. The
patient begins by icing the injured ankle. When the ankle H~:_ ---- --
appears red the icing is stopped and patients begin the
exercise program. The exercises consist of active
plantarflexion and dorsiflexion with resistance added to
patient tolerance, toe flexion and extension and toe
abduction and adduction.
The ankle is then stretched by the patient with a
towel, by the therapist, then again by the patient in a
weight-bearing position.
Following stretching, patients are treated with high
voltage electrogalvanic stimulation (Electro Galvanic
Stimulator, Electro-Med Health Industries, Miami, FL). The
dispersive pad (ground) is placed over the lower back and
held in contact with an elastic belt. The toes are covered
with a neoprene bootie and the injured ankle submerged in a
bucket of cold water. The two active electrodes are
submerged on the medial and lateral sides of the ankle (not
in contact with the ankle) (Roy, 1983).
Treatment is delivered for 20 minutes. Switching rate
is set on constant and the frequency at 80 pulses per
second. The patient dorsiflexes and plantarflexes the foot
during treatment. Ice cubes are added to the water 10
minutes into stimulation. Following stimulation, the ankle

16
is taped (Johnson & Johnson, 1983). The tape is to be kept
on until the next clinic visit unless complications occur
secondary to decreased circulation. Each patient is sche-
duled to be seen daily Monday through Friday.
Follow-up measurements for ROM and volume are taken,
when possible during clinic visits.
The first group of patients were treated with negative
pole, and the second group were treated with positive pole.
During a year and a half only sixteen patients met the
criteria of the study. The group treated with (-) polarity
had an age range of 14 to 56 years, with 50% of the patients
under 25. The group treated with (+) polarity had an age
range of 18 to 45 years, with 25% under 25. Patient Cr, age
18, sprained both ankles at different times and was a
subject in both groups.
In each group the younger patients (age 14-20) incurred
their injuries in sports-related activities associated with
competition for their high schools. They accounted for 6 of
the 16 subjects participating in the study.
The other 10 patients sustained their injuries by
tripping, and presented under a variety of circumstances:
three CGu, An and Do) were seen within 24 hours of injury,
four (Sm, Fl, Ga, Br) were seen within 72 hours of injury,
one (Bi) had circulatory insufficiency so could not ice or
"--"-----
;:;;; -=------=--=-=-===-'-"

17
exercise, one (Va) had been injured in New York, seen in the ;____;_ _____ _
emergency room there and was not seen in the clinic until P-- - ---
two weeks post-injury, and one (Th) sustained a fracture
that required further follow-up.
Despite this difference in prior histories, all
patients were begun on the same protocol.
" ,.---,-- -- ------
[j_ ______ _ :=:---------
m:··-p-~ ---~
b
18
Results c: ---
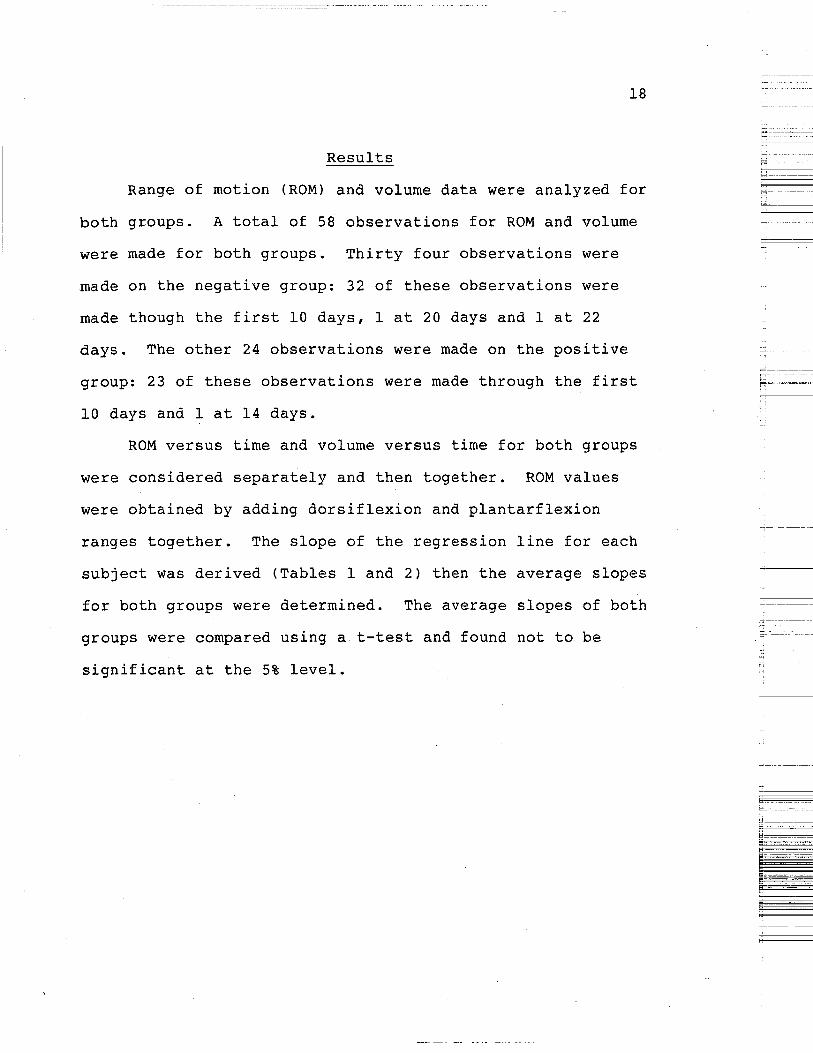
Range of motion (ROM) and volume data were analyzed for c __
both groups. A total of 58 observations for ROM and volume
were made for both groups. Thirty four observations were
made on the negative group: 32 of these observations were
made though the first 10 days, 1 at 20 days and 1 at 22
days. The other 24 observations were made on the positive
group: 23 of these observations were made through the first
10 days and 1 at 14 days.
ROM versus time and volume versus time for both groups
were considered separately and then together. ROM values
were obtained by adding dorsiflexion and plantarflexion
ranges together. The slope of the regression line for each
subject was derived (Tables 1 and 2) then the average slopes
for both groups were determined. The average slopes of both
groups were compared using a t-test and found not to be
significant at the 5% level.

19
Discussion
The ankle is one of the primary weight bearing joints.
It must be both mobile and stable. Inversion or eversion
sprains can tear the joint's supporting ligaments and pro-
duce instability. Excessive inversion stress is the most
common cause of ankle sprains. There are two anatomical
reasons for inversion ankle injuries: The medial malleolous
is shorter than the lateral malleolous, and the talus can
thus be forced to invert farther than it can evert and the
ligamentous thickening on the lateral side of the joint are
separate, and therefore not as strong as the massive deltoid
ligament on the medial side (Hoppenfeld, 1976). The
anterior talofibular ligament is the ligament most often
involved in ankle sprains. The anterior talofibular and the
calcaneofibular ligaments must both be torn to produce gross
lateral ankle instability. All of the subjects participating
in the study suffered from inversion sprains and Lu may also
have had some stress applied to the deltoid ligament on the
medial side. Th also had an associated fracture.
Each individual participating in the study suffered
from various degrees of disability from their injury. Each
had visible ecchimosis with swelling resulting in pain and
stiffness, but the amount varied considerably between sub-
'----------
"""' ;----':------ --
-----
----=---- ---
n

20
jects. The more severe the injury the more swelling present
at the time of initial evaluation. The patient with the
greatest amount of swelling was also the patient who suf-
fered from an associated fracture.
The amount of post-traumatic edema is also influenced
by the length of time between injury and initial treatment,
the age of the individual and the number of complicating
factors (i.e., fractures, tendon rupture, vascular compro-
mise, other systemic disease). These factors acting in con-
junction may lead to higher original volumes. For example,
the second largest initial volume measured was that of a
patient who had venous insufficiency and suffered from
swollen ankles independant of trauma (Bi).
An acute injury is more likely to respond to treatment
than a chronic injury because secondary damages caused by
excessive bleeding, adhesion formation and weakness have not
developed. The longer the tissues remain edematous the more
stretched the tissues and associated vessels become. The
accumulation of extracellular fluid is therefore greater in
regions which are loose in texture and where the skin is
readily stretched. In persons with firm resistant skin,
edema makes its appearance later and is less pronounced. If
edema can be prevented from forming and stretching the
tissues, the initial volume is lower and there is less to
'---'-------
-- -- -- ---

21
reduce. Those patients in the study who were seen imrne-
diately post-injury were those who participated in high
school atheletics (Cr, Me, Ha, Lu, De, Cr), one seen in the
emergency room (An) and two in the office (Gu, Do). In
general younger patients have more elastic and resilient
tissues than older patients.
There are some significant muscle changes that occur
with aging that may affect an individual's recovery from
injury. These include: "Gross muscular atrophy secondary to
the loss of both number and size of muscle fibers" (Payton
and Poland, 1983:43). This "muscular atrophy may be
differentially attributed to a decrease in the number of red
fibers" (McCarter, 1978:17). Muscle atrophy is always
associated with weakness.
In the lower extremities, venous return is aided by the
muscular pump. The stronger the contraction the more effi-
ciently the muscular pump works to return blood to the heart
(against gravity). When an i'ndividual becomes less active
because of weakness they do not "pump" as effectively as an
individual without weakness.
Weakness may also result from an increasing proportion
of skeletal muscle free fat being replaced by fibrous
tissue. Nevertheless, the primary cause of loss of strength
appears to be a change in lifestyle and decreased use of the
=----=-~:__ __ ~ __ ~
EO :=:;--
=== i---=i
E ~ --- --
~----

22
----
neuromuscular system. Osteoarthrosis is a result of an Fi-- ---- -- --
imbalance between the stress a joint receives and the abi- :==.-~~- -=-=----~-
;___;;
lity of the physiological shock absorbers in that joint to
absorb the stress (Radin, 1976). This is accompanied by a
marked decrease in tensile stiffness and fracture strength
with increasing age. On the average, strength begins to
decline around age 40 (Raven & Mitchel, 1980).
These musculoskeletal changes which occur with aging
are accompanied by cardiovascular changes. Both the heart
and the smooth muscle of vascular tissue decrease in sym-
pathetic responsiveness in people of advanced age (Lakotta,
1980). Associated with the aging cardiovascular system is a
decline in lipid catabolism, which generates lipid accumula-
tion; this process may underlie the development of ------
atherosclerosis (Kritchevsky, 1980).
These changes associated with aging coupled with the
degree of injury account for some differences in recovery
time and initial volumes. When these factors are considered
in conjunction with the time between injury and first treat-
ment, the test subjects are further divided into the
following subgroups: young subjects with acute injuries;
young subjects with chronic injuries; old subjects with d- -
acute injuries; old subjects with chronic injuries; patients
with complicating factors. The sample size of each subgroup

23
is so small it is difficult to draw conclusions about the
effect of the polarity of treatment.
The other major complicating factor is the amount of
home follow-up. Each patient was instructed in a home exer-
cise and icing program to be done three times per day. The
amount of compliance cannot be verified. Each patient
reported about their compliance level, which was frequently
less than the amount prescribed. Standardizing and quan-
tifying the amount of home follow-up is difficult. One
patient may have overdone his home program in an attempt to
get back to the football field faster, while another patient
may have underdone her home program because the exercises
may be painful and she does not tolerate pain well (by
admission of patient). In essence, data from each patient
can only be considered as an individual case study making it
impossible to arrive at any significant conclusions from
this study.
To help eliminate the variability which prevented
conclusions from being drawn from this study, the following
suggestions are offered.
It is essential to have (1) a large number of patients,
(2) of similar age. The investigator should (3) adopt a set
of standards related to the degree of injury (for example,
decide on limits of talar-tilt), (4) obtain patients with
~--~--
F~
~~~-
..... ____ ------------------
f§-

24
---
comparable injuries who are (5) seen no later than 24 hours
post injury (6) before initial treatment. ~-
One way to achieve most of these goals would be to per-
form the study out of an emergency room rather than from a
private practice. The number of acute patients is greater
during a given time period in an emergency room and they are
less likely to have received previous treatment. They may
then be referred to a physical therapist directly. A larger ---
------
initial number of patients would facilitate selection for
age and comparable degree of injury.
There is probably no reasonable way of insuring that
patients keep their appointments and perform the home
follow-up treatment and exercises. However, a large enough,
initial sample might provide enough data to eliminate some
of the individual differences.
~'---

25
Summary t ____ _
The goal of this study was to determine whether one [___, --
pole of high voltage electrical stimulation is more effec-
tive than the other in edema reduction of acute ankle
sprains.
Patients were seen initially by a physician of the
Stockton Orthopedic Medical Group and referred to Physical
Therapy for treatment. Range of motion and volume of the
affected ankle were measured during initial treatment, and
follow-up measurements were taken until time of discharge.
The first eight patients who attended 75% of their scheduled
appointments were treated with negative pole and the second
eight patients with positive pole.
Range of motion and volume data from each subject and
from each group were analyzed by linear regression and
t-tests. No significant difference was found between the
range of motion and volume of individuals in the two treat-
ments. The small sample size prohibits any conclusions
being drawn regarding the relationship between polarity and
edema reduction.
-
~

Literature Cited
Alon, G., Synopsis and High Voltage Stimulation, Chattanooga, TN, Chattanooga Corporation, 1981.
26
Benton, Laurel A., Baker, Lucinda L., Bowman, Bruce R., and Waters,'Robert L., Functional Electrical Stimulation A Practical Clinical Guide. The Professional Staff Association of the Rancho Los Amigos Hospital, Inc., Downey, California, 1981
Brobeck, John R., Best and Taylor's Physiological Basis of Medical Practice. Williams & Wilkins, Baltimore/ London, Tenth Edition, 1979, pg. 9-9.
Brown, Sam C.P.T., "Ankle Edema and Galvanic Muscle Stimulation," The Physician and Sports Medicine, Vol. 9, No. 11, November 1981, pg. 137.
Cyriax, James, Textbook of Orthopaedic Medicine, Vol. 1, Diagnosis of Soft Tissue Lesions, Baillere Tindall, London, 1978.
Esch, Dortha, Lepley, Marvin, Evaluation of Joint Motion: Methods of Measuring and Recording. University of Minnesota Press, Minneapolis, Minnesota, 1974.
Floriani, Lawrence P., MD, "Ankle Injury Mechanism and Treatment Guides," The Physician and Sports Medicine, September 1976, pg. 72-78.
Francis, Kennon T., "The Role of Endorphins in Exercise: A Review of Current Knowledge," Vol. 4, No. 3, JOSPT, Winter 1983, pp. 169-173.
Grava, William A., MD, Schelberg-Karness, Eileen, RPT, "How I Manage Deep Muscle Bruises," The Physician and Sports Medicine, Vol. 11, No. 6, June 1983, pp. 123-127.
Hoppenfeld, Stanley, Physical Examination of the Spine and Extremities, Appleton-Century-Crofts, New York, 1976.
Instruction Manual for High Voltage Electrogalvanic Stimulator. Electro-Med Health Industries, Miami, FL, 1977
Johnson & Johnson, Athletic Uses of Adhesive Tape, 1983.
~ ------
=---

Killian, Clyde, Seminar on High Voltage Electrogalvanic Stimulation, Ralph K. Danes Hosp., San Francisco, CA 1985.
27
Kritchevsky, D.: "Age-related Changes in Lipid Metabolism," Proc. Soc. Exp. Biol. Med. 165: 193-199, 1980.
Lakotta, E. G., "Age-related Alterations in the Cardiovascular Response to Adrenergic Mediated Stress," Fed Proc. 39: 3173-3175, 1980.
Lehmann, Justus F., MD, Warren, Gerald C., MTA, and Steward, Scham, M., MD, "Therapeutic Heat and Cold," No. 99, Vol. 3-4, Clinical Orthopaedics and Related Research 1974, pp. 207-245.
McCarter, R., "Effects of age on Contraction of Mammalian Skeletal Muscle." In Kalkor, G., DiBattista, W. J. (Eds.): r Aging in Muscle. New York, NY, Raven Press, 19 7 8, pp. 1-2 2 .
Newton, Roberta A., Karselis, Terence c., "Skin pH Following High Voltage Pulsed Galvanic Stimulation," Vol. 63, No. 10, Physical Therapy, October 1983, pp. 1593-1595.
Nirschl, Robert P., MS, MD, Sobel, Janet, BS, RPT, "Conservative Treatment of Tennis Elbow," The Physician in Sports Medicine, Vol. 9, No. 6, 42-54, June 1981.
Osborne, S.L., Holmquest, H.J. Technic of Electrotherapy and Its Physical and Physiological Basis, Bannerstone House Springfield, Illinois. Second Edition, 1944, pg. 38.
Paris, David L., Baynes, Frank, Grucker, Barbara, "Effects of the Neuroprobe on the Treatment of Second-Degree
·Ankle Inversion Sprains," Physical Therapy, Vol. 63, No. 1, January 1983, pp. 35-40.
Payton, Otto D., Poland, James L., "Aging Process Implications for Clinical Practice," Physical Therapy, Vol. 63, No. 1, January 1983, pp. 41-47.
Quillen, Williams, Rouillier, Leon H., "Initial Management of Acute Ankle Sprains with Rapid Pulsed Pneumatic Compression and Cold," Vol. 4, No. 1, JOSPT, Summer 1982, pp. 39-43.
~----

28
Radin, E., "Aetiology of Osteoarthrosis," Clin. Rheum. Dis., 2: 509-522, 1976.
Raven, P. B., Mitchell, J., "The Effects of Aging on the Cardiovascular Response to Dynamic and Static Exercise," In Weisfelt, M. L. (Ed.), The Aging Heart, New York, NY, Raven Press, 1980, pp. 269-296.
Roy, Steven, MD, "How I Manage Planta Fascilitis," The Physician and Sports Medicine, Vol. 11, No. 10, October 1983, pp. 127-131.
Smith, Wayne, ATL, RPT, "A Case Report: High Galvanic Therapy in the Symptomatic Management of Acute Tibial Fracture," Athletic Training, Spring 1981, reprint.
Sohn, Norman, MD, FACS, Weinstein, Michael A., MD, FACS, Robbins, Richard P., MD, FACS, "The Levator Syndrome and its Treatment with High-Voltage Electrogalvanic Stimulation," The American Journal of Surgery, Vol. 144, November 1982, pp. 580-582.
Tappan, Frances M., Healing Massage Techniques: A Study of Eastern and Western Methods. Reston Publishing Company, Inc., 1978.
Wolf, Steven L. (Ed.), "Applications of Low and High Voltage Electrotherapeutic Currents," Clinics in Physical Therapy: Electrotherapy, Chapter 1, Churchill, Livingston, New York, Edinburgh, London, and Melbourne, 1981.
~~---=-=--==-
~
ci_-
"
' ,..., _____ ~

i. I
0"\ N
' 1!111 I •II I I
.. , ! I'll I ij I
I ]"II ' , ~~I I I
I 1!,! I :1,
I I 'I i
I 'I ' .illillr:::d Jl! !II l,i
Table 1. Ankle-foot volume and range of motion measurements of patients treated with negative polarity of electrogalvanic stimulation. Data presented as volume (ml), dorsiflexion-plantarflexion (degrees of movement).
Patient/ TREATMENT DAYS diagnosis/
time post- Sex/ iniurv age Initial Day 2 Day 3 Day 4 Day 5 Day 6 Day 7
Gu/acute M/17 180 ml 100 ml 90 ml 24 hours 0-30° 50-300 lQD-300
An/acute M/53 180 ml 160 ml 110 ml 24 hours -30-300 -30-300 00-300
Cr/acute M/18 80 m1 80 m1 70 m1 24 hours lQD-450 10°-40° lQ0-400
SM/acute M/27 80 ml 60 ml 0 m1 30 ml 72 hours 00-300 00-300 00-450 00-450
fl/acute M/43 220 m1 140 m1 72 hours -15°-30 00-300
Me/acute M/14 200 ml 140 m1 20 m1 24 hours oo-450 0°-45° oo-450
Ha/acute M/18 60 m1 60 m1 24 hours 0° 45° 0°-45°
Lu/acute M/18 140 m1 140 ml 120 ml 90 m1 24 hours 00-300 00-300 00-300 00-350
I i
SloP.e b I I Dav 8 Dav 9 Dav 10 Volume ROM I
20 ml -18.71 1.8 '
lQ0-350 I 80 m1 80 ml -11.58 1.08
I 50-300 50-300
50 ml - 3.51 .058 10°-45
- 4.5 2.967
40 m1 -19.05 3.214 oo-450
-29.99 0
20 ml - 4.78 0 oo-450
60 m1 100 m1 20 days - 5.34 .8825 Q0-450 Q0-400 30 m1
OD-450 -12.182 1.25
22 days 20 ml 5°-45°

0 ("'')
I ! ! I
I
I
II:
Table 2. Ankle-foot volume and range of motion measurements of patients treated with positive polarity of e1ectrogalvanic stimulation. Data presented as volume (ml), dorsiflexion-plantarflexion (degrees of movement).
Patient/ TREATMENT DAYS diagnosis/
time post- Sex/ injury age Initial Day 2 Day 3 Day 4 Day 5 Day 6 Day 7
Ga/acute M/35 170 ml 160 ml 160 m1 72 hours 00-350 00-350 oo-350 Bi/chronic vascular in- f/37 260 ml 100 ml 80 ml sufficiency 00-400 00-450 00-450
Va/chronic f/62 130 ml 130 ml 90 m1 70 ml 50 ml 2 weeks -50-300 -50-300 -50-300 -50-350 00-350
Do/acute M/33 10 ml 24 hours 5°-50° Th/acute fracture M/42 270 ml 200 ml 24 hours -15°-30 00-300
Br/acute f/28 160 ml 80 ml 72 hours 00-300 00-350
De/acute M/18 60 ml 25 ml 24 hours 00-400 00-450
Cr/acute M/18 60 ml 50 ml 24 hours 10°-45° 10°-45°
... 1 I
Slof!e b Day 8 Day 9 Day 10 Volume ROM
100 ml - 6.9 .476 00-400
14 days .26581 0 ml - 16.50
00-450
80 ml - 5.93 1.8688 00-400
No Slope
100 ml - 21.12 2.3468 00-350
40 ml - 14.28 1.8877 00-450
- 8.75 1.25
- 3.33 0
- 10.97 l.?Q.4

r-1 ('")
!I !IIIII I' !:: :J.
til 41 (11 L 0\ (11
-o • ~
• 0
• ~
60
SCJ
4CJ
- 3~
20
10
B
X
0
0
B
~
B
X
~
B
X
0
:I
B
B
0
X
B
Ill 0
lilt' 1:::::"
B
X
0
X
X
X
I I I I
I I ·1· "l!ll·h
B
X
Ill
X
X
0
1 1 ~ l ~ ~ 1 ~ ~ lo TREATMENT DAIS ------->
FIGURE 2 - RANGE OF MOTION
Change in range of motion (R.O.M.) of all subjects during treatment with either negative (x) or positive (o) polarity following acute ankle sprain.

:lillll I I ! Ill I I
, I I I I
! ! I I
'HIIC!ill'--,1 , I ! !···p··1 ' ! I I
3~~
N 25CJ 8 (V)
,.... 2CJCJ
X
E X
--0
w X :a: 15CJ 8 :::l X 0 0 _J X 0 0 >
leJCJ
so I ~ ~ X X
~ X B 0 8 s X
X X 0 0 X
X X 0 0
0 ~ X
FI GORE 3 - VOLUME CHANGE
Change in ankle-foot volume (Volume - ml) of all subjects during treatment with either negative (x) or positive (o) polarity following acute ankle sprain.
, I I I
l , I
I ' ~ 1111 ~~ l

{V')
{V')
I
l: :I I ., !~ ~.~ [lll:':lil. . I I . !I ' I ~ i ,IJIII,Iil,
3eJeJ
,-.
25eJ X ,_..
- 2(1(1 E
w 5 . 15(1 -1 0 > leJeJ
10 ; I· I I I I I I I I I ·
1 2 3 4 ' 5 6 7 8 9 1~
TREATMENT DAYS ------~>
FIGURE 4- SUBJECT lGu
Change in ROM and volume of subject GU during treatment with negative polarity following acute ankle sprain. X = volume, o = ROM
'II , I r1::1•,
6CJ
Sel ;;u • 0
4eJ • ::3: •
3eJ n. ro c.O ,
2eJ tD Jl) lJl
leJ 0 .......

:I
i I
i I
l Iiiii
11!1"
3eJCl ~ ("")
X 2SeJ ......
!i 2eJeJ w :;E:
lSeJ => _J 0 > leleJ
scr
I I J I f f I I I f 1 2 3 4 5. 5 7 8 9 leJ
TREATMENT DAIS ------->
FIGURE 5- SUBJECT lAn
Change in ROM and volume of subject An during treatment with negative polarity following acute ankle sprain. x = volume, o = ROM
6~
SeJ ;:u • C)
4CJ • 3: •
3eJ a.. rt> \0 ,
2Cl ro (I) tJl .......
1~ 0 .._,.
II
~I I,, 'r"' 1.'1 '1:' II rr·1
5Cl 0 I
SeJ :::0
~--------------&--_ -•
4eJ 0 .. 3: •
3eJ . CL ro \0 "1
2CJ tD (I) tA
-¥ fD 0 ~
- X --------- ~~-~----~------------------------------------
i
[
I I 9 l(j
I I I I I I I I 1 2 3 4 5 6 7 8
i TREATMENT DAIS ------->
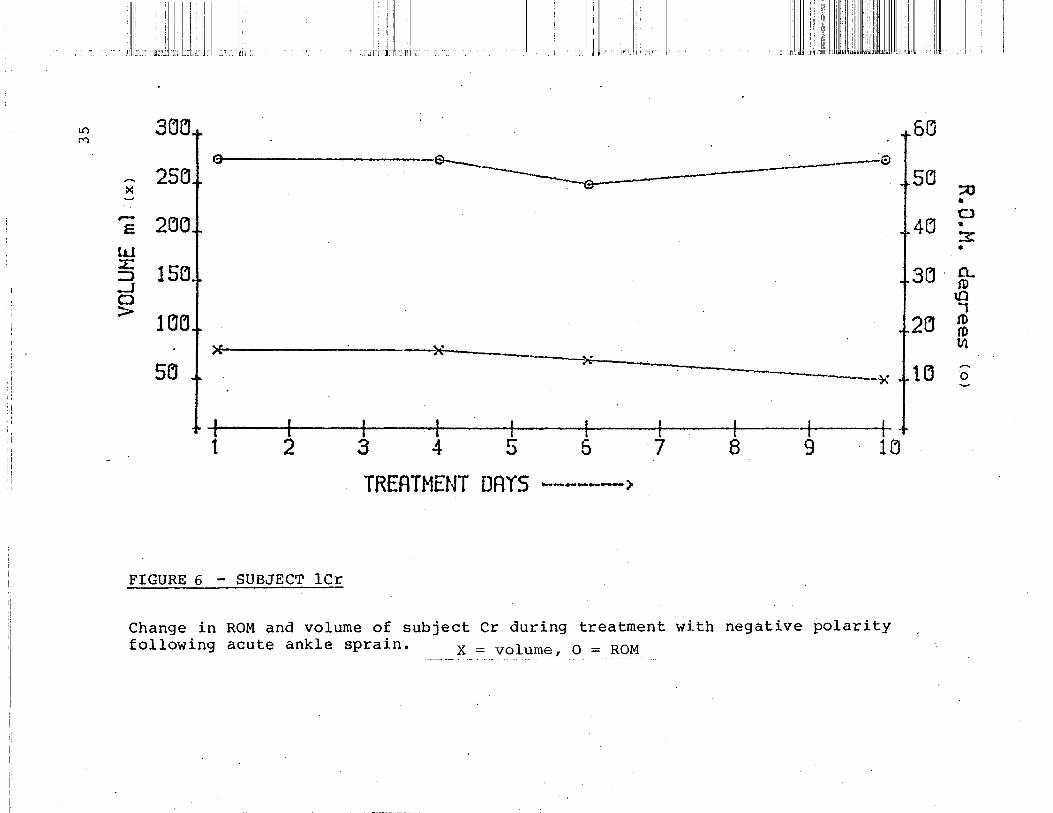
FIGURE 6 - SUBJECT lCr
Change in ROM and volume of subject Cr during treatment with negative polarity following acute ankle sprain. x = volume, o = ROM

1.0 CV)
! 'I
,, ' I I ',,. :•1 II
i I
'': ll"'i'lit·:ji-•111 l:l"l
3ClCl
25~ :<
.......
s 2eJCl tu ::E: 15CJ ::,) _J
....----~..e..------ ~-
. --------------------- --e
n~--~ 0 >
lCJCJ
~CJ ~-----------------x I f I f I I I I I --t 1 2 3 4 5 5 7 8 9 lei
TREATMENT DAYS -------~
FIGURE 7 - SUBJECT lSm
Change in ROM and volume of subject Sm during treatm~nt with negative polarity following acute ankle sprain. . x = volume, o = ROM
I
I :Ill"
6('J
SCJ
4eJ
3eJ
2~
lCJ
:;u a
0 • ""7 -'""' • 0.. fl)
tD ., tD tD til
0 .......

ill I ~ ,,
~ ! ! " .. I" llili '' :I
:!JL i ::i lllii!T l'i
!:; 3('1Cll oeJ
~ 25eJ 5(j ~ --- . ~ - 2(JCJ 4CJ E.
--------------w ------------- ----~ 3el =.J · lSCJ -----~ _J --~---- -x.., . 0 -------------- ~ > l(jeJ 2Cl ---- ~ ~
~ ll(j Sel I
I I I I I - - __ 1_ ______ --JL------..k.-------' · --r ------ I I I
1 2 3 4 5 5 7 8 9 lCJ
TREATMENT ORIS
FIGURE 8 - SUBJECT lFl
. --..... ------~
Change in ROM and volume Df subject Fl during treatment with negative polarity following acute ankle sprain. x = volume, o = ROM
;u • 0 w
~
-0.. ro
U) ..... I
:1) ro lll ...... 0

1\il II l,li,
I
1:. i ! 1'. '!I'll ··::1 '111 II 1 1" l"!!lll!r·
.- CH'I j - 6() 00 M
X 25(J
_.. Sl:l
;Q •
F. 206 0---------o----- --- -··~--·---0 0
4eJ • "7" _,.
LLJ ~
.. -L. 15() ::.J _J 0 >
l~[j
3L1 o_ fD
tiJ ..... I
26 fD (!)
5(J
.......................... -......., . .........__ -............ ..............
-...~
lfl
lCJ ~
0
·I I I I .l I 1··- I I I 1 2 3 4 5 6 7 8 9 lEI
TREATMENT DAYS ------->
FIGURE ~ - SUBJECT lMc
Change in ROM and volume of subject Me during treatment with negative polarity following acute ankle sprain. x =. Y<?lume, o = __ RQ~--

.1.1 ,: 1
~~~~.~ 1.
1
I i
1/1': 1 rl:illltll ·ri1· lj
' I
I I l•i/ I
I . '1, :·:n:l,;
0"1 ("') 3CJCJ t'
25~1 r6Q I
SCl X
.... ···---··--~----- e I Of---- "' '.__
. 4Cl r-- 2CJG £
tl.J
3eJ :£: lSCJ ::::> _J ("..)
> leJCJ 2LJ
1~ .. 5CJ x------x-*--- ---------------+, .j. .
I I r 1 1 I j s 9 1~ 1 I ~ 4 ·5 5
TREATMENT DAYS ------->
FIGURE 10 - SUBJECT lHa
Change in ROM and volume of subject Ha during treatment with negative polarity following acute ankle sprain._~ __ X; volume, o = RQ~---
;:u • CJ • 3: •
CL (D
u:1 1 IV !D VI
o·

I
i : !':. I l 1: '" ':' i ''T [
~ 3CHj
--- 25Ci >:
-$...__ . .. -- -....____ ·---- '=J --·----·· -------. -
,--
~ 2[j[J ---w ;.:: => _J 0 >
~
15Clf r-----~~--------/ l~Lll
SCJ I
I I I I - I I I l + 1 2 3 4 5 7 8 9 16 -.
TRERTHENT ORIS --·- ... ·--->-
FIGURE 11 - SUBJECT lLu
Change in·ROM and volume of subject Lu during treatment with negative polarity following acute ankle sprain. ___ ~-J<:. =_y9~uii1~ { _ o = ROM
iii ' 1::
5C'J
sa ;;o • 0
4Cl :::s: •
3LJ 0... ro
\.0 . .., I
2CJ f'j) rD 11'1
---lei 0 ......

i 1:11:11 "·; nJ ...
I 'I 11·1; 'I'
r--1 3CJO "<t
....... 25() X ......
.---E 26CJ
l.LJ -;::- 15~ 1 ~-5
- - .... - .. -----·· ·-----·-·=.::_._ ~__.a ~
_j 0 >
leJCJ ·}."
'_5CJ
I I I -1 . --t- I I 1 2 3 4 5 5 7 8 9 1~
TREATMENT DRYS ------->
FIGURE .12 - SUBJECT 2Ga
Change in ROM and volume of subject Ga during treatment with positive polarity following acute ankle sprain. X = volume, o = ROM
5eJ
5fJ
4fJ
3(J
2el
II !j
!I :1'1
;;o ~
CJ • 3: •
CL ro ~ I ro ro IJl
1 eJ 0 .....
' '"

I
N '<:!'
~ ---F.
l.L) :-:: =.J _J 0 >
Cllll
li,f' II,' II ,,
., 'Jll:ri:lr::l' · , :llr .,.
II I . i
::! I
IIi
3CIEI
25~1 X
2(jl'JI ~ --e-------~-· ·--·····--·---1 ~ --·--0
15l'll ~ '"" ...... lEleJ
Sll
+ J ~ 1. "-
'\. "X.-- - -- ----?:
I I I I I I 3 4 ' 5 5 7 8
TREATMENT DAYS -------1
FIGURE ·13 - SUBJECT 2Bi
5Cl
5CJ
4!J
3!J
2(j
l(j
I I I -l-g lel
Change in ROM and volume of subject Bi during treatment with positive pol?rity following chronic ankle sprain with vascular insufficiency. x = volumer o = ROM
I I
'11'1
;;o • 0
3: ~
CL ro
\,{)
I ro ro 1.11 ,_ 0 ~

'Ill :I ,,
~~~ I
,, ,. ,, li ,i
1:1 i.i I I I 1:1 'I II i I
II I I,
1:1 II II I I!'
I '!, I I!' 1''11111'1 ilh,t·,iilu [! I, ; !i
1': 1[";1""! I I ~ Ill
('\")
""' 3()()
..,..._ ':'>5(] >< ~
r(3 5() . ;::o
I • . r--
2CiC1 E
llJ :E:
150 ::J _j 0 >
1 eJO.
so
--·--~ + 4(J 0 I
3: •
3D ;:)__ :i) l[) -.,
2el I
ro :ll
~: I trl
r~ 0
____ _.. ...... -------· .. ~ -----.....e------·
($ -~------~ '~
··~- ----·---------,-........
++- ') 3 1 L.
:t;----1
-t---+ 9 l(j
r---5
TREATMENT DRYS -------/
FIGURE 14 - SUBJECT 2Va
Change in ROM and volume of subject Va during treatment with positive polarity following chronic ankle sprain. x = volume, o = ROM

I i I
l;li::, ! :I IIi: '1:!
'<:!' 3~CJ '<:!'
le ,... 25~ ><·
:,_.
,--2eJCJ E
w :::L 15(j ::J _J 0 >. 1 CleJ
5rJ
f I I I I I I I I · 1-1 2 3 4 . 5 . 6 7 8 9 leJ
TREATNENT DAYS ----->
FIGURE _15~ SUBJECT 2Do
Change in ROM and volume of subject Do during treatment with positive polarity following acute ankle sprain. X = volume, o = ROM
5EJ
5Cl
4EJ
3CJ
2B
lei
::0 • 0 • 3: • 0... (t) \0 , tD (t) IJl ,... 0

Ul .q<
>:: ~
---E
w :L.: ::) _J 0 >
I I"
3CJ(Jr
25()
i I I
i ; I" I[ "'Til ...
2('J('Jr --
15(']+ ~----1 ('](') 1 __ __.---.a- - -· ___ -=:::::::_..,_
I 1: .,.
,,,
!'I
I
----x
1
111111
"·il'l1i:·:··
1:: t4('J
fCJ f20
. l ---------------------- =:::::..:-·--··--Sel a--- . --~~--
1
-~---- .. ___ _
I 1 I 3 I ·
I +lei I I
RERT ~1ENT PRYC I 9 -+ ! 5 T 6 ,
I l ,:) ---·- 1 (7J ---) u
FIGURE 16 - SUBJECT 2Th
Change in ROM and volume of subject Th during treatment with positive polarity following acute ankle sprain with an associated fracture. X = volume, o = ROM
;u . 0 • -~ •
0... fD
\.0 I (1J lD Ill
0 ~
------------------------------------------~==--~~~-=~~~--~--------------~----~----~--~------------~-------------------------------··

ll!ll.:.'.i .. 1':1111 ~:II' II '.1 I! II i• I • I ' •
llll,i I, I . '' I IIJilill[' I' I
I
I
I !: 1·111: 'i!ITI! 'lill·:ri I :Ill I: 'I
_L ____ 1 _______ L_ -~ _ .. L __ ___ L__ _ ____ I ____ _ __ L _ __ _ __ L_ ______ L_ ___ 1
l- ----- -r-- - --- -,~·----.---------,- ---r----~-,--------,
2 3 4 5 6· . 7 8 9 10
TREATMENT DAIS ~----->
FIGURE 17- SUBJECT 2Br
Change in ROM and volume. of subject Br during treatment with positive polarity
following acute ankle sprain. x = volume~ 0 = ROM -----·

I !
ill ')"" I !
:
!
,'lllJ: I!:: I IIIII i · ] i:l! I
II : I' IC:I " 1'1 " '
.I'
"""
3LJLI 5el
...... 25Cl X
5CJ ::::0
~
2CJCJ+ a .--E
- _____________ ...-----
tLl
• 0
4el • 3: •
---·€>
:!: 15el => _.J 0 > l(J(j
SCi IX-
3(} o_ ~ \0 "1
2CJ fD fD l"l ,.... 0
1Cl ~
I ---------------x -t I I I I. I~- __ l I I t--~----~r-------,
1 2 3 4. 5 5 7 8 9 lEI
TREATMENT DRYS -------> FIGURE 18 - SUBJECT 2De
Change in ROM and volume of subject De during treatment with positive polarity following acute ankle sprain. X = vo~~~~! · __ Q_ :::_:RQ!V!_~--

:1111
1
1 :/
II J;
II ii II !I I I " , I ···I il I 'II I !I I I i _ IIIII 'I ''' ''lll'llm···::IJJIItl!i[l lll I 'I
I '1111 .I Ji t•::.1JI·1 ::' n11:n Ill
00 3CJCJ "<f'
0 0
~ 25CJ
~
,..-2eJCJ s
'W ::::E:
15Cl ::J _J 0 > l(jeJ
S.Cl 1 ~ I I I I f I I I -1 I 1 2 3 4 5·- 6 7 8 9 lCJ
TREATMENT DAIS ------->
. FIGURE 19 - SUBJECT 2Cr
Change in ROM and volume of subject Cr during treatment with positive polarity following acute ankle spra{n. -X= volume o =ROM , . .
6eJ
SeJ
4eJ
3eJ
2CJ
leJ
II . II I :''II
;o • 0 • 3: • 0.. tD \0 ., (0 (0 11\ ~
0 ~