A COMPARATIVE STUDY OF INDIAN MAJOR PORTS 3.1...
45
CHAPTER 3 A COMPARATIVE STUDY OF INDIAN MAJOR PORTS 3.1 Introduction India has an ancient and glorious maritime history and tradition and, long before the Christian era; Hindus had crossed the waters of the Indian Ocean and not only penetrated many countries in South East Asia and the Far East, but also colonized several Pacific Islands. However, during the British rule, Indian shipping was suppressed for commercial and political reasons. The British practiced various strategies - to keep the British interests and to keep down Indian shipping ventures— such as relentless competitions, unfair practices and political persecutions before India got independence (Hariharan, [1970]). At the end of 1947, a new shipping policy was announced. The Government of India, in their new shipping policy mentioned the need for active co-operation of the state with enlightened private enterprises. As a result, one Shipping Corporation was formed. The Scandia and the Government formed that corporation. This policy did not attract other Indian Shipping Companies. After 1956, the Government changed this policy. The second Shipping Corporation, which was started in 1956,was entirely owned, controlled, and managed by the government itself. This was the Shipping Corporation of India. It is recognized by leading maritime nations that it is their prominent responsibility to so develop their ports as to enable them to provide for all the increasing modern needs and requirements of the trade that pass through and the ships that call at their ports. The fulfillment of this obligation is vital for the growth of economy and the effective Defense of the country. It is also imperative for a free and Sovereign India to maintain her strategic position in the Indian Ocean and to preserve and to develop her maritime strength. In this chapter, a brief description of the development of a|l—major ports in India is given. A comparative study of all major ports carried out is also presented in this chapter. This enables one to understand and compare the present status
Transcript of A COMPARATIVE STUDY OF INDIAN MAJOR PORTS 3.1...
CHAPTER 3
A COMPARATIVE STUDY OF INDIAN MAJOR PORTS
3.1 Introduction
India has an ancient and glorious maritime history and tradition and, longbefore the Christian era; Hindus had crossed the waters of the Indian Ocean and
not only penetrated many countries in South East Asia and the Far East, but also
colonized several Pacific Islands. However, during the British rule, Indian
shipping was suppressed for commercial and political reasons. The British
practiced various strategies - to keep the British interests and to keep down
Indian shipping ventures— such as relentless competitions, unfair practices and
political persecutions before India got independence (Hariharan, [1970]).
At the end of 1947, a new shipping policy was announced. The Government
of India, in their new shipping policy mentioned the need for active co-operation
of the state with enlightened private enterprises. As a result, one ShippingCorporation was formed. The Scandia and the Government formed thatcorporation. This policy did not attract other Indian Shipping Companies. After
1956, the Government changed this policy. The second Shipping Corporation,
which was started in 1956,was entirely owned, controlled, and managed by the
government itself. This was the Shipping Corporation of India.
It is recognized by leading maritime nations that it is their prominent
responsibility to so develop their ports as to enable them to provide for all the
increasing modern needs and requirements of the trade that pass through and
the ships that call at their ports. The fulfillment of this obligation is vital for the
growth of economy and the effective Defense of the country. It is also imperative
for a free and Sovereign India to maintain her strategic position in the Indian
Ocean and to preserve and to develop her maritime strength.
In this chapter, a brief description of the development of a|l—major ports in
India is given. A comparative study of all major ports carried out is also presented
in this chapter. This enables one to understand and compare the present status
of Indian major ports. Data used in this study was collected from various reports
such as Basic Port Statistics of India from 1991 to 2001, Indian ShippingStatistics from 1995 to 2001, Administrative Reports of all Major ports in India
from 1991 to 2001, Report of Economic Intelligence Service, ‘CMIE’ (Center for
Monitoring Indian Economy Pvt. Ltd, 2002 January) etc.
3.2 Major Ports in India
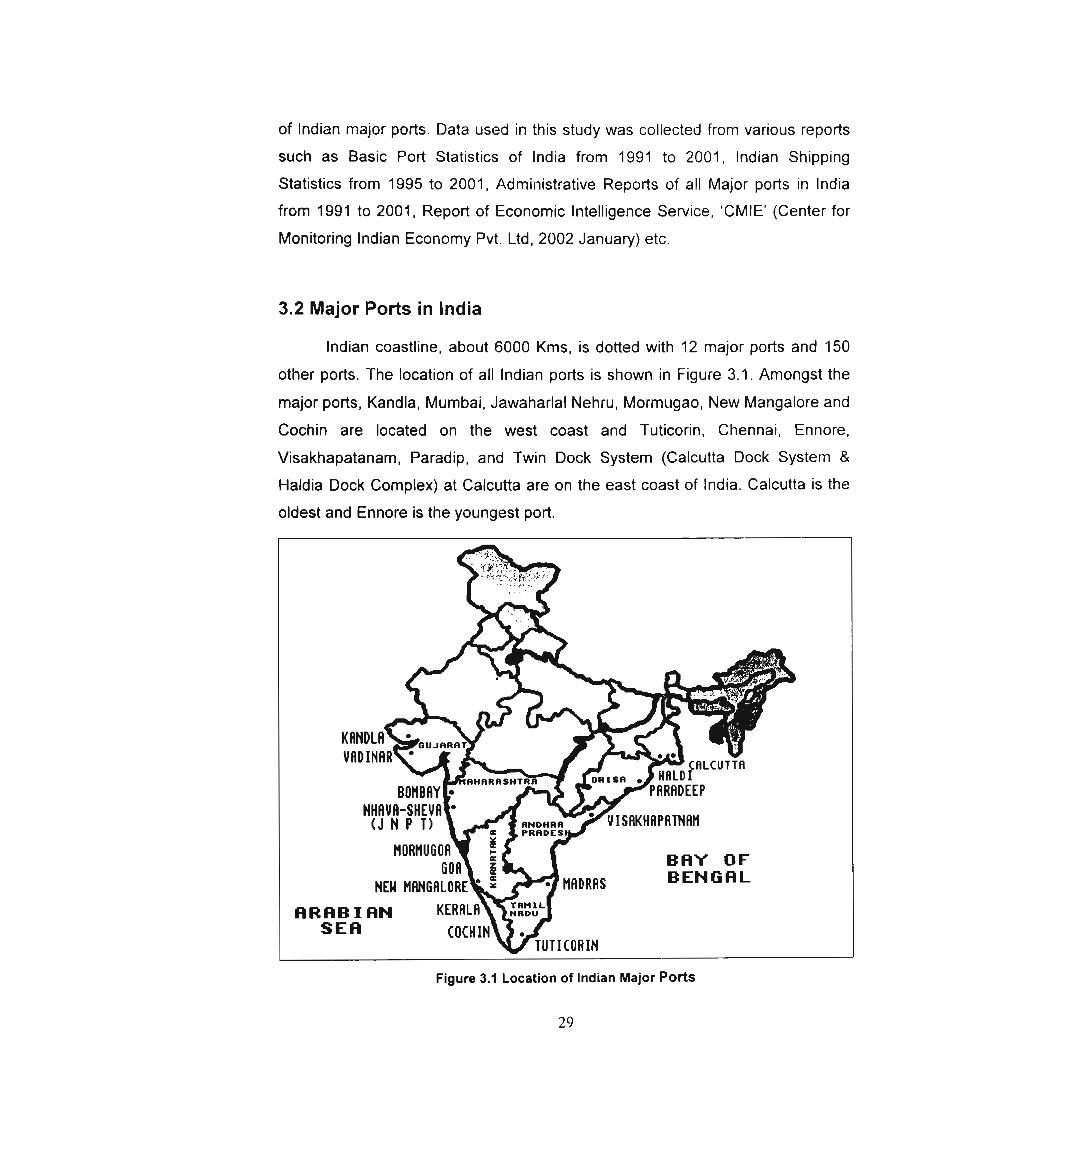
Indian coastline, about 6000 Kms, is dotted with 12 major ports and 150
other ports. The location of all Indian ports is shown in Figure 3.1. Amongst the
major ports, Kandla, Mumbai, Jawaharlal Nehru, Mormugao, New Mangalore and
Cochin are located on the west coast and Tuticorin, Chennai, Ennore,Visakhapatanam, Paradip, and Twin Dock System (Calcutta Dock System &
Haldia Dock Complex) at Calcutta are on the east coast of India. Calcutta is the
oldest and Ennore is the youngest port.
CHLCUTTHonxsn . HHLDI
PHRHDEEP
mo...“ UISHKHFIPHTNHI1PRRDES
NHIWH-SHEUH ‘(J N P T)
2nonnuaon c6°" é 3'E}f.'a‘.?.[NEN HHNGHLURE f 5 NHDRHS
HRHBIHH KflmflS E H CIJCHIN
TUTICURIN
Figure 3.1 Location of Indian Major Ports
29
luv lIII.4J\Jl rJ\lI|.\J L-Ix; \.lII\J\.al Llll; GUIIIEIIIOLIGLIVC \.a|JlILl\JI UI LIIC IVIIIIIOLIY Ll
Surface Transport (MOST) of the Government of India and are administerec
through Board of Trustees constituted by the Government. The other ports are
under the control of the respective maritime State Government of GujaratMaharashtra, Goa, Karnataka, Kerala, Tamilnadu, Andhra Pradhesh, Orissa anc
West Bengal and Andaman and Nicobar Islands Administration.
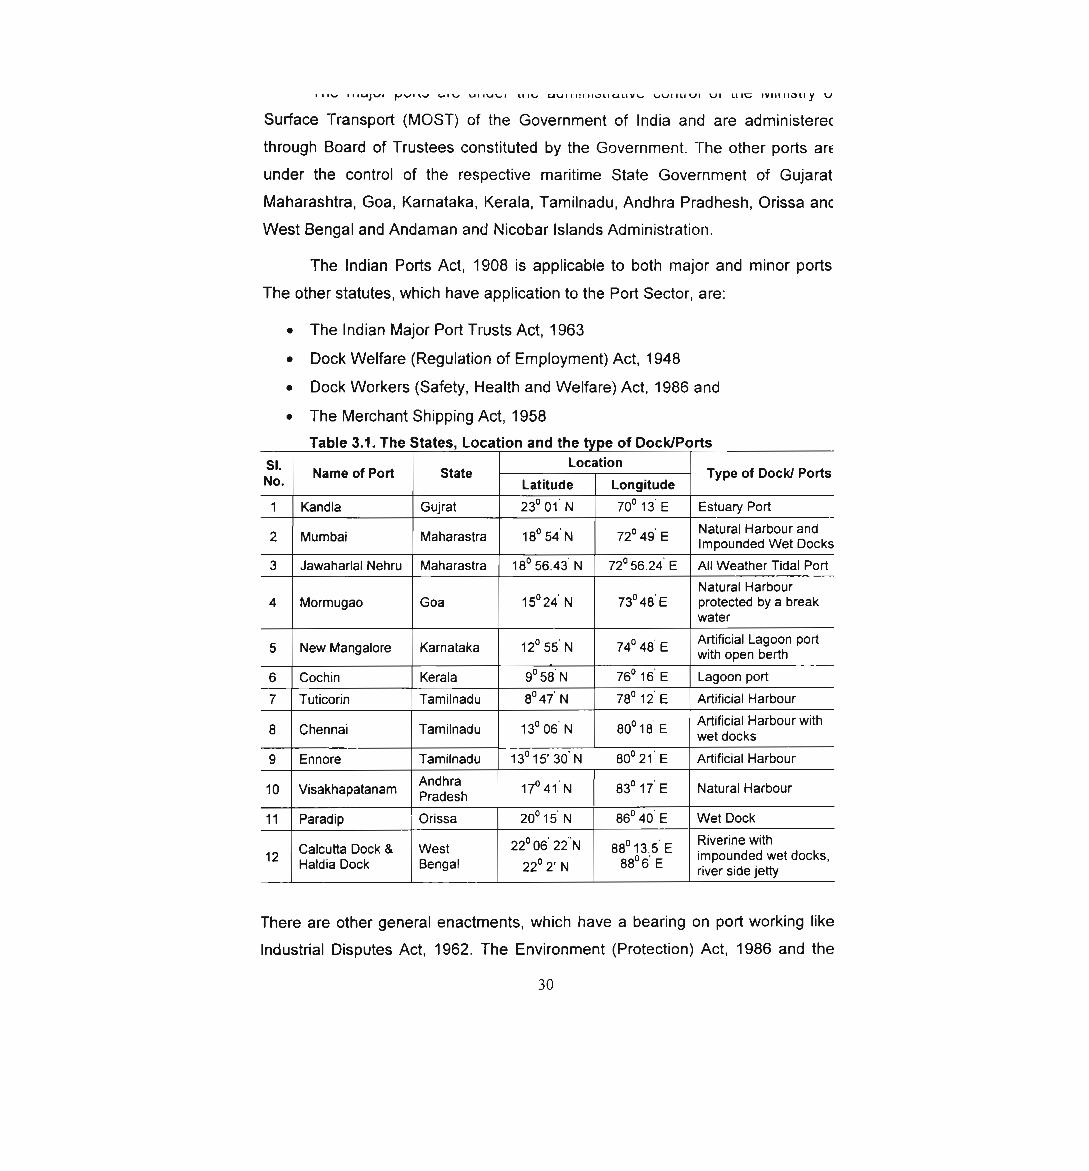
The Indian Ports Act, 1908 is applicable to both major and minor ports
The other statutes, which have application to the Port Sector, are:
The Indian Major Port Tiusts Act, 1963
Dock Welfare (Regulation of Employment) Act, 1948
Dock Workers (Safety, Health and Welfare) Act, 1986 and
The Merchant Shipping Act, 1958
Table 3.1. The States, Location and the type of DocklPortsLocationName of Port State _ _ Type of Dockl PortsN°- Latitude Longitude
1 Kandla Gujrat 23° 01' N 70° 13' E Estuary Port
2 Mumbai Maharastra 18° 54' N 72° 49' E |"::;‘$’r'K',*ead’ ggdcks3 Jawaharlal Nehru Maharastra 18° 56.43‘ N 72° 56.24’ E All Weather Tidal Port
1 _ Natural Harbour4 Mormugao Goa 15°24 N 73°43 E protected by a break
water
0 - o 1 Artificial Lagoon port5 New Mangalore Karnataka 12 55 N 74 48 E with open berth6 Cochin Kerala 9° 53' N 76° 15' E Lagoon port7 Tuticorin Tamilnadu 8° 47' N 78° 12' E Artificial Harbour
. . o - o - Artificial Harbour with8 Chennai Tamilnadu 13 06 N 80 18 E wet docks9 Ennore Tamilnadu 13° 15' 30' N 30° 21' E Artificial Harbour
10 Visakhapatanam éfgdhégh 17° 41' N 33° 17' E Natural Harbour11 Paradip Orissa 20° 15' N 86° 40' E Wet Dock
Calcutta Dock & West 22° 06' 22"N aa°13.5' E .R"’°"”° “""‘12 Haldia Dock Ben ai 0 1 8e°6' E '"“°°“”ded ""e‘d°°"5'9 22 2 N river side jetty
There are other general enactments, which have a bearing on port working like
Industrial Disputes Act, 1962. The Environment (Protection) Act, 1986 and the
30
rules and regulations framed there under are relevant to port development anc
operations as well.
The State, location, and the type of Dock/Port are shown in Table 3.1. A
brief introduction of all Major ports in India is given in the following paragraphs.
3.2.1 Kandla Port
Kandla port was founded in 1952 and declared as a major port in 1955
The Port is situated on the western shores of Kandla creek, which runs into the
Gulf of Kutch at a point about 90 nautical miles from the Arabian Sea. It is al
weather natural Port, its dry weather 8. mild monsoon minimizes loss of man
days as well as damage to cargo. Consistent, enlightened policies have enablec
it to efficiently handle trade created by a hinterland that covers over a million sq
km. from the North and North-West of India. This covers the highly productive
granary and industrial belt stretching across Jammu 8. Kashmir, Punjab.Himachal Pradesh, Haryana, Rajasthan and Gujarat.
The contour depth along the shipping channel is around 10 meters. The
total approach channel is 23 kms. The width of the channel varies between 20C
and 1000 meters. Kandla is an all weather Port, well sheltered from the South
West Monsoon. Necessary navigational aids are provided to facilitate day and
night navigation. Night navigation is restricted to vessels of LOA 189 meters and
draft up to 8.23 meters. Tankers for oil jetties are handled during daylight hours
only. Ships having speed of less than 9 knots will not be moved in & out of Port
during hours of darkness.
Vessels can anchor 1 mile South West of the position given under"Pilotage". Inside the harbour, Port Authorities allot anchorage. Vessels can
however anchor more than 2 miles from Fainrvay Buoy but must pick up the Pilot,
within 2 miles of Outer Tuna Buoy. Pilot boards vessel at Tuna Buoy at the
mouth of Kandla Creek about 22 Km. from the signal station at the Kandla PortTower.
31
The Port is directly connected to the National Highway No. 8—A. It is well
connected with its hinterland comprising Northern Indian states by Meter Gauge
as well as Broad Gauge railway system.
3.2.2 Mumbai Port
The Premier Port of Mumbai is strategically situated mid-way on west
coast. It is gifted with a natural deep water Harbour of about 400 squarekilometers protected by the mainland of Konkan on its East and Island of Mumbai
on its West. The deep waters in Harbour provide ample shelter for shipping
throughout the year.
As early as the beginning of the Seventeenth Century, in spite of anegligible trade, the natural advantage of Mumbai Harbour as a maritime base
and haven for shipping on the western seaboard of India was realized. There
was considerable maneuverings for its occupation. In 1652, the Surat Council of
the East India Company, realizing the geographical advantage of the Port, urged
its purchase from the Portuguese. Their wish was gratified nine years later when,
under the Marriage Treaty between Charles II of Great Britain and the Infant
Catherine of Portugal, the "Port and Island of Mumbai" were transferred to the
King of Great Britain. After the transfer of the Port and Island to the East India
Company by Royal Charter in 1668, development of the Port started. Various
measures such as construction of a Custom House, a warehouse, dry docks, etc.
were taken up by the Company to encourage trade. In 1813, an act of the British
Parliament ended the Company's commercial monopoly. This resulted in a great
spurt in the trade of that Port. The year 1858 witnessed the exit of East India
Company and passing of Mumbai under the direct rule of the British Crown. In
1873, the present statutory autonomous Port Trust was set up for administering
the affairs of the Mumbai Port. The opening of the Suez Canal in 1869 was the
most decisive landmark in its growth. It shifted the whole trade scenario from the
East Coast of India to the West to make Mumbai the commercial gateway of
India besides the principal gateway of India that it already had become. Though
traditionally designed to handle general cargo, over the years, the port has

adapted to changing shipping trends and cargo packaging from break bulk to
unitization/ palletization and containerization. It has also developed specialized
berths for handling POL and chemicals
Round the clock navigation is allowed at the port. The main navigational
Harbour Channel is, for the great part, a natural deep-water fairway. TheChannel has been deepened to 11 meters. With a mean high water neap tide of
3.3 meters the Channel is adequate to meet the requirements of a large number
of cargo vessels, passenger ships and deep drafted tankers. The approaches to
the Harbour are well lit with the Outer Light Vessel (Mumbai Floating Light),
visible 16 kilometers, the Prongs Lighthouse to the North, visible 27 kilometers
and the Kennery Lighthouse to the South visible 29 kms.
The entrance of the Harbour, which has approaches from the Southwest,
is between Prongs Reef and the Thull Reef lying off the mainland to theSoutheast, a distance of about 9 kilometers. Kennery Lighthouse, which marks
the Southern Boundary of the Port limits, is a light of the first order dioptric, group
flashing white, and shows groups of two flashes with a visibility up to 25 kms in
clear weather. The name of this lighthouse has now been changed to Kanhoji
Angre Light House. Prongs Lighthouse marks a reef Southwards from Colaba
Point and dangerous ground which extends for a distance of 1.6 kms from it. The
light is of the first order dioptric and exhibits at night, every 10 seconds, and a
white flashlight with a visibility up to 27 kms. There are three light buoys moored
South-East of prongs Lighthouse, one flashing a green light every five seconds,
the other flashing red light every 10 seconds and the third flashing red every 5
seconds. Prongs reef buoy is fitted with a radar reflector. Sunk Rock Lighthouse
is about 3.2 km ENE off prongs Lighthouse. It is unattended and shows red light
with white rays flashing every 6 seconds. There are other important subsidiary
light including the Dolphin Rock Light and Tucker Beacon Light. Control Station
and Port Signal Station, situated on the top of the tower at the Ballard Pier,
monitor and control all ships that move in the harbour. It also hoists storm
warnings. These stations are also equipped with VHF Radio sets on international
frequency (Channel 12, 14 and 16). Four Lighted floating buoys to mark the
approach channel, two jetty end beacons at mooring dolphins 1 and 4 and two
33
leading lights have been provided for night navigation. In addition the Elephanta
patch beacon has been upgraded to improve its range. Vessel TrafficManagement System (VTMS), which also caters to JNPT.
Pilotage in and out of the harbour is compulsory for ships of 100 tons net
and upward. The pilotage limits outward being delimited by a line drew East
West through the Prongs Light House.
3.2.3 Jawaharlal Nehru Port (JNPT)
Jawaharlal Nehru Port is situated along the eastern shore of the Mumbai
Harbour, South East of Elephanta Island and approximately 10 nautical miles
from the Gateway of India. JNPT shares a common channel with the Mumbai
Port up to the point of entry of the South Elephanta Channel. This port was
constructed and commissioned in May 1989. JNPT is the most modern port of
India. It was planned with a view to decongesting Mumbai and serve as a hub
port for this region. A common Vessel Traffic Management System (VTMS) is
used for JNPT and Mumbai Port. Twenty four hour navigation ispossible and
pilotage is compulsory for all vessels above 100 N.R.T. All vessel movement is
regulated by VTMS.
3.2.4 Mormugao Port
Mormugao Port is situated on the west coast of India at the mouth of river
Zuari. The Port is approximately 370 km. South of Bombay and 575 km. North of
Kochi. It is an open type harbour protected by a breakwater and a mole running
parallel to the quay. The harbour is also protected from the southwest monsoon
as it has been constructed on the leeward side of Mormugao Headland. It is the
premier iron ore exporting Port of India with an annual throughput of around 16
million tons. The Port accounts for about 50% of India's iron ore export and ranks
among the top 10 iron ore exporting Ports of the world. Though iron ore is the
predominant cargo there has been an increase in liquid bulk and general cargo
traffic since it was declared a Major Port on 2"“ December 1963. Container traffic
has also grown at quick pace.
Pilotage is compulsory for inward and outward movement of ships and
between berths and moorings within the harbour. Pilotage services are provided
round the clock with prior advice to the Harbour Master through agents.
3.2.5 New Mangalore Port
The Beautiful Coastal city of Mangalore has references in history and
legend. Mangalore is mentioned in the manuscripts of the Great library at
Alexandria, Egypt. Roman history describes it as a port on the mouth of the river
Nitras (Netravathi). Ptolemy, a famous astronomer and explorer of the second
century AD makes a mention of Mangalore in his journey record. Greek drama
also alludes to the West Coast of India, in particular Udyavara and Mangalore
(described as Mangala). During the time of the Vijayanagar Empire, Arab traders
established a brisk trade route for silk and spices between Mangalore and West
Asia. Tipu Sultan established an army attachment now known as Sultan Battery.
Over the years Mangalore has grown rapidly into a rich industrial zone. The old
port was unable to match the growing demands of modernization in the shipping
industry; especially after the commencement of the five-year plans afterindependence. Therefore the necessity for a new port was felt and NewMangalore Port was formed.
The New Mangalore Port is situated on the West Coast of India in the
state of Karnataka almost midway between the Major Ports of Mormugao and
Kochi. The Port is 170 nautical miles south of Mormugao Port. and 191 nautical
miles north of Kochi Port.
The Port is provided with Railway sidings connected to trunk railways with
adequate storage space and approach roads. The Port Users are directlycontacting the Indian Railways for their requirement of wagons. New Mangalore
Port is connected through the Konkan Railway to Maharashtra/ Goa andKarnataka. Tamil Nadu is also connected by Broad Gauge. Most of the Medium
Gauge to Bangalore has been converted to Broad Gauge. With this NewMangalore Port will be directly connected to the ICD at Bangalore and the
present container traffic to Chennai and Kochi will be routed through New
35
Mangalore Port. The National Highway 17' (NH 17) passes just outside the Port,
thus making the Port easily accessible and linking it to large cities like Bangalore.
Other Highways link it to Goa and Mumbai (Bombay) in the North, Calicut and
Cochin in the South and to the main coffee and spice growing plantation areas of
the hinterland. The nearest Airport, Bajpe (Mangalore Airport) is just 18 Kms.from the Port.
Twenty-four hours navigation is possible. Transit towers and buoys are all
provided with lights for night navigation. Pilotage is compulsory for all vessels.
Pilot station is located half mile off fairway buoy.
The Port is specialized in handling various types of chemicals like
Phosphoric acid, Liquid ammonia, Styrene Monomer, Benzene, Cumene,Orthoxylene, Ethyl Dichloride, Cyclohexanone, Phenol, Acetone, Xylene etc. The
Port has five separate tank farms for storage of chemicals, hazardous liquid
cargoes, edible oil, molasses, POL products & LPG. The port has provided
facilities to handle general cargo namely granite stones, wooden logs, sugar,
plywood, wood pulp, machinery etc. It is also has facilities to handle the bulk
commodities like iron ore concentrates, Iron ore pellets, finished fertilizers, raw
materials for fertilizers, iron scrap, sponge iron, coal, and food grains.
The port has water spread area of 320 Acres, and land area of 2030 Acres
comprising of a total area of 2350 Acres.
3.2.6 Cochin Port
The year 1341 saw the gigantic forces of nature culminate in the birth of a
natural harbour. Centuries later the pioneering efforts of Sir Robert Bristowresulted in the modern Port of Cochin. The administration of the Port was vested
with the Board of Trustees under the Major port Trust's Act, 1963. Kochi Port as it
is now called, introduced containerized cargo handling way back in 1973. The
introduction of house stuffing in 1992 and commissioning of the Rajiv Gandhi
Container Terminal 1995 greatly contributed to its growth. This all weather port is
strategically located to exploit the massive East-West ocean trade. There is only
just 10 nautical miles from the direct sea route to Australia and the Far East from36
Europe. This makes it the closest lndian Port to the maritime highway. Its
proximity to the Kochi Airport and Railway Terminus gives it instant access to the
world. The establishment of inland Container Depots at different centers and the
growth of containerization have stretched the hinterland of Kochi port to thewhole of Southern India.
Pilotage is compulsory for all ships. 24 Hour navigation facilities are
available in this port. Pilot boards vessel near Fain/vay Light Buoy. More details
are included in chapter 5.
3.2.7 Tuticorin Port
Tuticorin was a small town with a rich maritime history. It was the center
for maritime trade and pearl fishery. It was ruled by various dynasties like the
Pandyas and Cholas, and then fell into the hands of the Portuguese and Dutch
before finally coming under the administration of the British. The natural harbourand rich hinterland of Tuticorin Port prompted the East India Company to plan the
development of the harbour. The lighthouse built in 1842 marked the beginning
of the history of Tuticorin Harbour Development. On the 11 July 1974, Tuticorin
Port was declared as the 10th Indian Major Port. On the 1st April 1979, the
erstwhile Anchorage Port / Minor Port and the newly constructed harbour were
merged into an Integrated Port Trust under the Major Port Trust Act 1963. From
then on, Tuticorin Port has had two operational wings:
0 Zone 'A' comprising of the new Major Port and
o Zone 'B' representing the old Anchorage or Minor Port.
Tuticorin Port is situated on the East Cost of India about 540 kmsouthwest of Chennai. It is located in the Gulf of Mannar, with Sri Lanka on the
South East and the large landmass of India on the West. The major Port ofTuticorin is created within a breakwater system jutting into the sea for about 4
km, one of the longest in the world. The Port was designed and executed entirely
through indigenous efforts. Tuticorin Port is well sheltered from the fury of storms
and cyclonic winds. It is strategically located very close to the major International
37
sea routes. Navigation restricted to day light hours only. Pilotage is compulsoryto all vessels.
Tuticorin Port is well connected to various trading centers within Tamil
Nadu and the neighbouring states of Kerala, Karnataka and AP by National /
State Highways. Regular bus sen/ices are available to several major cities
throughout South India. The Port is linked to the broad-gauge railway system of
the country. There is a daily express train service between Tuticorin and Madras
and other connecting trains to Madurai. Tuticorin is connected by air to other
major cities via. Madurai and Trivandrum. Journey by road from Tuticorin to
Madurai takes 3 hours and Trivandrum 4 hours. Tuticorin is expected to be air
linked after the newly commissioned Air Port is served by regular flight service.
The area of the water spread of Zone A is 960 Acres and of Zone B is36.31 Acres. The land area is 2150 Acres and 365.88 Acres for Zone A and Zone
B respectively. The total area of the port is 3512.19 Acres.
3.2.8 Chennai Port
Chennai Port is an artificial harbour on the Coramandal Coast in southeast
India. The earliest recorded event in its creation was in 1639 when M/s. Cogan
and Day founded a trading settlement on the site of the little fishing village,
Chennaipattnam. The East India Company then started conducting all their
maritime activities on this coast from here. Development of trade transformed the
small fishing village to a modern port. The Capital of the state of Tamilnadu,
Chennai as it was rechristened from the old name Madras is well linked 8. easily
accessible by road, rail, water and air. Its climate is tropical with temperature
ranging between 18° C-30° C.
Chennai Port is divided into 3 distinct zones namely:
1. Dr. Ambedkar Dock. (Inner harbour to handle passenger, general cargo &
containers)
2. Jawahar Dock. (To handle coal, fertilizer other bulk and break bulk cargo)
3. Bharathi dock. (Outer harbour accommodates ore and oil handling system
and a modern container terminal)38
Chennai port railway is a member of the Indian Railway Conference
Association and it is defined as a terminal shunting yard with abbreviation 'HOM'.
Goods landed from vessels meant for dispatch to hinterland are taken by rail
directly from the port and the goods to be shipped are brought from the various
parts of the country to the railhead of the port.
In post-Independence period, the Port has developed into one of the most
modern Ports, trying to match international standards, especially in container
handling. The first modern container terminal in India was established at Port ofChennai in 1983.
Round the clock communication on Marine VHF channels is available. The
Signal Station maintains continuous watch on Channel 16 at North Quay. VHF
channels 12 & 14 are reserved for pilotage operations; channel 10 is available for
communication with ships. A number of private launches ply day & night between
the ships at anchorage and Shore.
The approach channel to the port has two sections:
1. The entrance channel within the protection of outer arm
2. The outer channel beyond the protection of outer arm.
The pilotage is round the clock and compulsory. Pilot boarding area 1 is
about 2 Km. Northeast of breakwater for ships up to 230 meters in length and
boarding area 2 is about 8 Km. Northeast of breakwater for ships over 230
meters in length. The anchorage is situated ‘North Eastward' of the harbour in
depths of 8 to 9 fathoms. The holding ground is good with coarse sand bottom.
There is no limit on the number of ships that can be anchored. Vessels carrying
explosives (which are of such nature that are permitted to enter the harbour)
must anchor in the explosives anchorage eastward of the harbour. Such vessels
should display Red Flag and Red Light by night.
The inner harbour water spread area is 220 Acres and the corresponding
land area is 441 Acres. The water-spread area of the outer harbour is 200 Acresand its land area is 145.96 Acres.
39
3.2.9 Ennore Port
Ennore is situated on the Coromandal coast, north of Chennai in the state
of Tamil Nadu. Ennore port, the 12"‘ Major Port in the country is located at a
distance of 24 km from Chennai port. Ennore Port was originally conceived as a
satellite port to the Chennai Port, primarily to handle and meet the requirements
of Tamil Nadu Electricity Board. The scope was widened, taking into account
subsequent development plans of the Government of Tamil Nadu to set up:
1) An 1880 MW LNG power project in association with a private consortium
2) A Petro-Chem Park
3) A Naphtha Cracker Plant.
Ennore Port has been endowed with large chunks of land. The port has
about 3500 acres of land its own. The port can provide all the infrastructure
facilities required viz... water supply, electricity, transmission corridor, fire fighting
services and environmental protection measures to the users of its facilities. The
cost of Phase I of Ennore port has been estimated at Rs. 1058 crores.Government of India and Chennai Port Trust have contributed the equity capital
of Rs. 300 crores and the balance dept portion is a loan met by Government of
India and Chennai Port Trust. ADB has given a loan of USD 115 million to
Ennore Port through Government of India.
The development of phase I of Ennore Port has been completed. The port
was inaugurated and dedicated to the Nation by the Hon'ble prime Minister of
India on 1.2.2001. Commercial operations were commenced with geared
handymax vessels on 22.6.2001. Full fledged operations with deployment of self
unloading/gearless vessels of 65000/77000 DWT and shore based mechanical
unloaders were started functioning very recently.
Ennore Port Limited (EPL) is the first corporatised port in the country. EPL
as a landlord port would retain the port infrastructure and fulfill its regulatory
function and envisages private sector to provide all other services. Development,
operations and management of specialized terminals for dry/liquid bulk cargo
would be concessioned to captive/private terminal operators for medium/long
term durations based on capital investments. Operators would be required to40
construct berths, install topside and storage facilities at their cost. Also EPL
would privatize marine services, maintenance dredging, bunkering services,
container terminals, operation of bulk, warehouses, container freight stations,
tank farm, cranage/handling equipment, dry dock and ship repair facilities.
3.2.10. Visakhapatanam Port
Visakhapatanam Port has played a prominent role in fostering accelerated
growth in the region and significantly contributing to the country's trade &
development. The Port was originally conceived in 1933 as an outlet forManganese Ore exports. It progressed through planned infrastructuredevelopment in successive five—year plans and evolved itself to the ever
changing requirements of sea transportation systems. The Port comprises (i)
Inner Harbour with 15 berths, (ii) Outer Harbour with 7 berths to accommodate
deep draft vessels. One finger type jetty OB-1, OB—2 for ore carriers of size 1.50
lakh DWT, a general cum bulk cargo berth to accommodate vessels of size up to
one lakh DWT and 14.9 m draft on Off—Shore oil Tanker Terminal (OSTT) to
accommodate tanker of size up to 1.50 Iakh DWT with direct discharge facility
from the ship to refinery tanks and oil mooring facility for transshipments of crude
oil from the mother tanker to daughter tanker, an exclusive jetty for LPG, a deep
draft berth to accommodate post Panamax container vessels are the other
service centers provided at Outer Harbour.
Visakhapatanam Port is strategically located between Calcutta andMadras on the East Coast of India in the state of Andhra Pradesh. A natural
phenomena in the form of two massive rock hills; Do|phin's Nose on the south
and Ross Hill on its North protect the Port from the regular cyclones that strike
the East Coast of India. These two hills shelter a bay, which possess sufficient
depth for ocean going vessels.
Pilotage is compulsory and round the clock navigation of vessels ispossible. Embarkation Position is at roads about 1 nautical mile south east of fair
way buoys. In respect of every vessel desiring to enter the Port, an application
shall be made in advance in the form prescribed by the board, to Dy.
41
Conservator and Traffic Manager by the Master, Owner or Agent, stating the
name of the vessel, cargo carried, or whether in ballast etc.
The total port area is 4369 hectares, of which 300 hectares are water
spread area, 3882 hectares are total land area and 537 hectares are total
reclaimed area. The Outer Harbour has a protected basin of about 200 hectares
encompassed by a set of Break waters: North, South and East break-waters are
412 m., 1543 m., and 1070 m., respectively.
3.2.11 Paradip Port
Pandit Jawaharlal Nehru laid the foundation stone of the Port on 3"’
January 1962. Construction work commenced in 19 November 1962 and
dredging operations from 15"‘ March 1964. During this period the Port was in the
control of the Government of Orissa. The management was formally handed over
to the Government of India on 15‘ June 1965. The Port was declared the eighth
Major Port on 18"‘ April 1966 making it the first Major Port in the East Coast
commissioned in Independent India. The Port was opened to traffic in 1966. The
main cargo handled was Iron Ore. Since then its cargo profile has greatly
increased and from 1991, containers and transshipment of petroleum productswere handled. It is located at 210 Nautical miles south of Calcutta and 260
nautical miles north of Visakhapatanam. The Port is connected with Broad
Gauge Railway System of the South Eastern Railway. The Port is served by
National highway No.5-A.
Pilotage is compulsory. ETA has to be given to Harbour Master not less
than 24 hours before arrival of ships. Pilot boards vessel outside the breakwater
SE of Fain/vay Buoy. No night navigation facilities available.
The Port has an artificial lagoon type harbour protected by two rubble
mound "Break waters" and approached by the dredged channel. The North
breakwater is 538 m. long on the North Eastern side of the Port and the South
Break water is 1217 m. long on the South Eastern side.
42
3.2.12 Calcutta and Haldia Port
In 1690 the British anchored for the first time in the reach of the Hoogly
River near the present day Kolkata. With the grant of trading rights to the British
Settlement in Eastern India by the Mughal Emperor Aurangzeb, the city grew to
become the premier port in British India. Its administration passed from the East
India Company to the British Crown to be brought under the administrative
control of the Government on 17"‘ October 1870 with the appointment of a Port
Commission under the Kolkata Port Act. By then the Kolkata jetties were fully
operational. In 1886 a separate oil wharf was set up at Baj Baj. The impounded
dock at Kidderpore (KPD) became operational in 1893. In 1925 four riverside
jetties and a coal jetty were constructed at Garden Reach. In 1928 the second
dock system, King George's Dock later renamed Netaji Subhash Dock (NSD)
came up in the same area. The Port services the vast hinterland comprising the
entire Eastern India including Bihar and Eastern Uttar Pradesh and the two land
locked Himalayan Kingdoms of Nepal and Bhutan. The Commissioners for the
Port of Kolkata ran the port till January 1975 when Major Port Trusts Act, 1963,came into force.
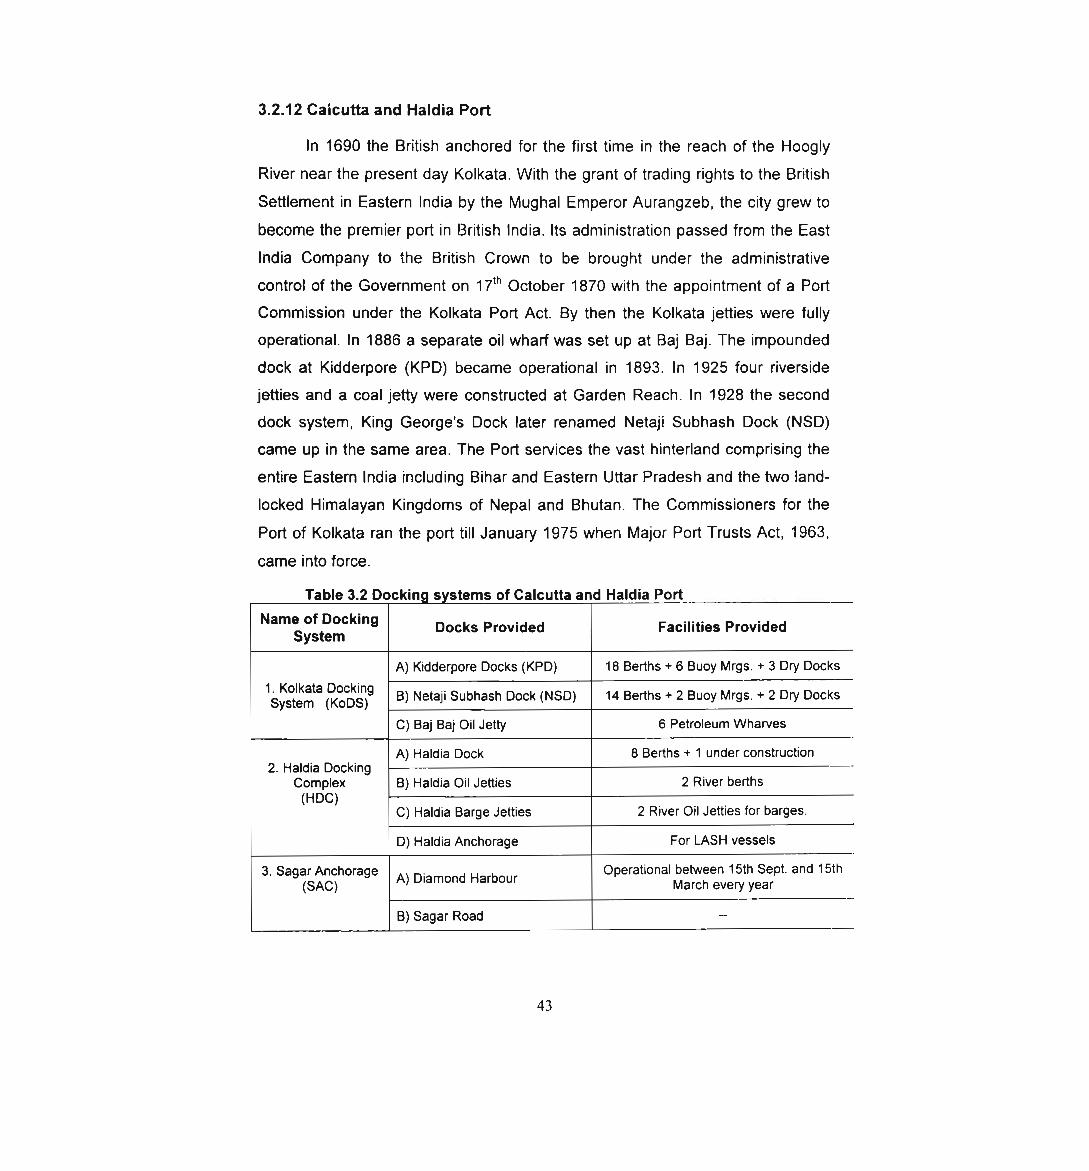
Table 3.2 Docking systems of Calcutta and Haldia PortName of Docking Docks Provided Facilities Provided
System
A) Kidderpore Docks (KPD) 18 Berths + 6 Buoy Mrgs. + 3 Dry Docks1. Kolkata DockingSystem (KODS) B) Netaji Subhash Dock (NSD) 14 Berths + 2 Buoy Mrgs. + 2 Dry Docks
C) Baj Baj Oil Jetty 6 Petroleum WharvesA) Haldia Dock 8 Berths + 1 under construction
2. Haldia DockingComplex B) Haldia Oil Jetties 2 River berths(HDC) _ _ IC) Haldia Barge Jetties 2 River OII Jetties for barges.
D) Haldia Anchorage For LASH vesselsOperational between 15th Sept. and 15th
March every year3. Sagar Anchorage
(SAC) A) Diamond Harbour
B) Sagar Road -
43
Kolkata port is the India's only riverine port has facilities developed over a
stretch of 150 Km. of the Hoogly River. It comprises three major systems as
shown in Table 3.2. All Docks are Impounded Docks System with Locks from
River. 10 ship breaking berths are also available at CDS (KPD & NSD) subject to
restrictions of length and beam.
The Kolkata Dock System is situated on the left bank of the river Hoogly,
145 Kms above the entrance to the river from the estuary off Sagar Island in the
Bay of Bengal. The Haldia Dock System is situated 130 km. from pilotage stationat Sandheads and at Latitude of 22° 02'.
The navigation channel leading to Kolkata and the river Hoogly can be
divided into two parts:
1. Kolkata to Diamond Harbour, about 75Kms downstream of Kolkata.
2. Diamond Harbour to the Eastern Channel Light Vessel atSandheads, about 157 Kms downstream of Diamond Harbour.
The maintenance of a navigational channel in a river with 17 sand bars is
a challenging job. Vessel Traffic Management System (VTMS) was installed
completely in April 1996 with a view to providing more effective and safer
guidance to ship through radar surveillance. It has been taken up from theSandheads to Haldia in the first phase and will be gradually extended up toKolkata. The VTM system at Haldia acts as the main control station. The system
at present is operational round the clock. Navigational aids like lighthouse,
Automatic Tide Gauges, Semaphores, River Marks, Syledis Chain System and
DGPS are provided.
Pilotage is compulsory for all vessels of over 200 NRT. The pilotage
distance is 166 km. comprising 145 km. of river and 21 km of sea pilotage. The
Pilot vessel always cruises on duty at Sandheads. She remains in the vicinity of
the Eastern Channel Light vessel that marks the beginning of the inward pilotage.
The river pilot embarks the inward bound vessels at Sandheads and proceeds up
the river. On arrival at Kolkata (Garden Reach), the River pilot is relieved by a
Harbour pilot who takes the vessel inside the lock at KPD or NSD or the river
44
mooring as required. A Berthing Master guides the vessel to the nominated berth
from the lock. For outward passage the process is reversed.
The handling of containers at 7 NSD (Netaji Subhash Dock) is fullycomputerized on on-line basis. For this purpose 20 modules are in operation.
The Cargo Account System (CAS) for the remaining berths of NSD is ready for
operation. Similar computerization schemes have been initiated for theKidderpore Docks and at Haldia Dock Complex. Kolkata Port Trust is linked
through Internet and NICNET. Implementation of EDI in CDS is in progress.
Anchorages are available for vessels in transit at Sagar Roads, Kalpi,
Diamond Harbour, Royapur, Moyapur, Haldia, Uluberia and Garden Reach. The
river mooring with capacity to accommodate 23 ships under favourableconditions of weather, tide, etc. extend from Howrah Bridge to Metiabruz. The
length and draft for moorings and jetties vary subject to following restrictions:
1. During bore-tide periods no vessel over 152 meters is allowed to
remain in the moorings in Kolkata and the draft is restricted to 5.5meters.
2. At Baj Baj no vessel over 160 meters is allowed to remain in themoorings and the draft is restricted to 6 meters
3.3 Comparison of Indian major ports
A comparative study of all major ports has been conducted using the data
collected from 1992 to 2001. The trend and the values of each performance
indicators of all major ports are studied and compared with all the ports. The
operational performance indicators, the financial performance indicators,
Physical facilities available, manpower and its utilizations are analyzed and
compared for all major ports. The performance of container terminals of the ports
has also been compared with each other. Economic Intelligence Service ‘CMlE',
2002 January and Basic Port Statistics of India 2001-02 were the main source of
the secondary data used by us in this comparative study.
45
Weighted score method is used to compare the performance of each port.
The four factors mentioned in the paragraph above are considered in thisanalysis. Each of the factors has sub—factors also. Scores are calculated based
on the current values (data collected) of each factor mentioned above such that
the best performance port gets score of 100 units and the worst port on that
factor gets score of 0 units. This is done for all factors. Applying different weights
to each factor consolidates the scores obtained by a port on different factors. The
weights were determined by personal discussions and interview with experts of
Cochin port. Now the weighted total score is obtained for all ports. The ranking is
done based on decreasing order of the final score of each port.
3.3.1 Comparison of Operational performance Indicators of Major ports
The values of each operational performance indicator from 1994 to 2001
are collected and its trend is shown in Table 3.3. Straight lines with arrowheads
in the table represent the trend. Curved lines represent approximately thefluctuation over the years. The value of each indicator for the year 2001 is also
shown in the table. The following important operational performance indicators
are considered for comparing the operational performance of each port. The
value of operational performance indicators of each port for the year 2001 is
used for this. The weights assigned for each factor is given in bracket. The
operational performance indicators of Calcutta and Haldia are taken together, as
it is being considered as a single major port.
Average turn around time (1),
Average pre-berthing time (1),
Average idle time of ships at berth (2),
Average output per ship berth day (3),
Capacity utilization of ports (2).
Average berth occupancy (3) and.".°°.°‘:”‘F'°."’.-‘ Volume of cargo handled (1).
From the trend lines in Table 3.3, it is seen that the average turn around
time of all major ports have improved. The turn around time of New Mangalore
46
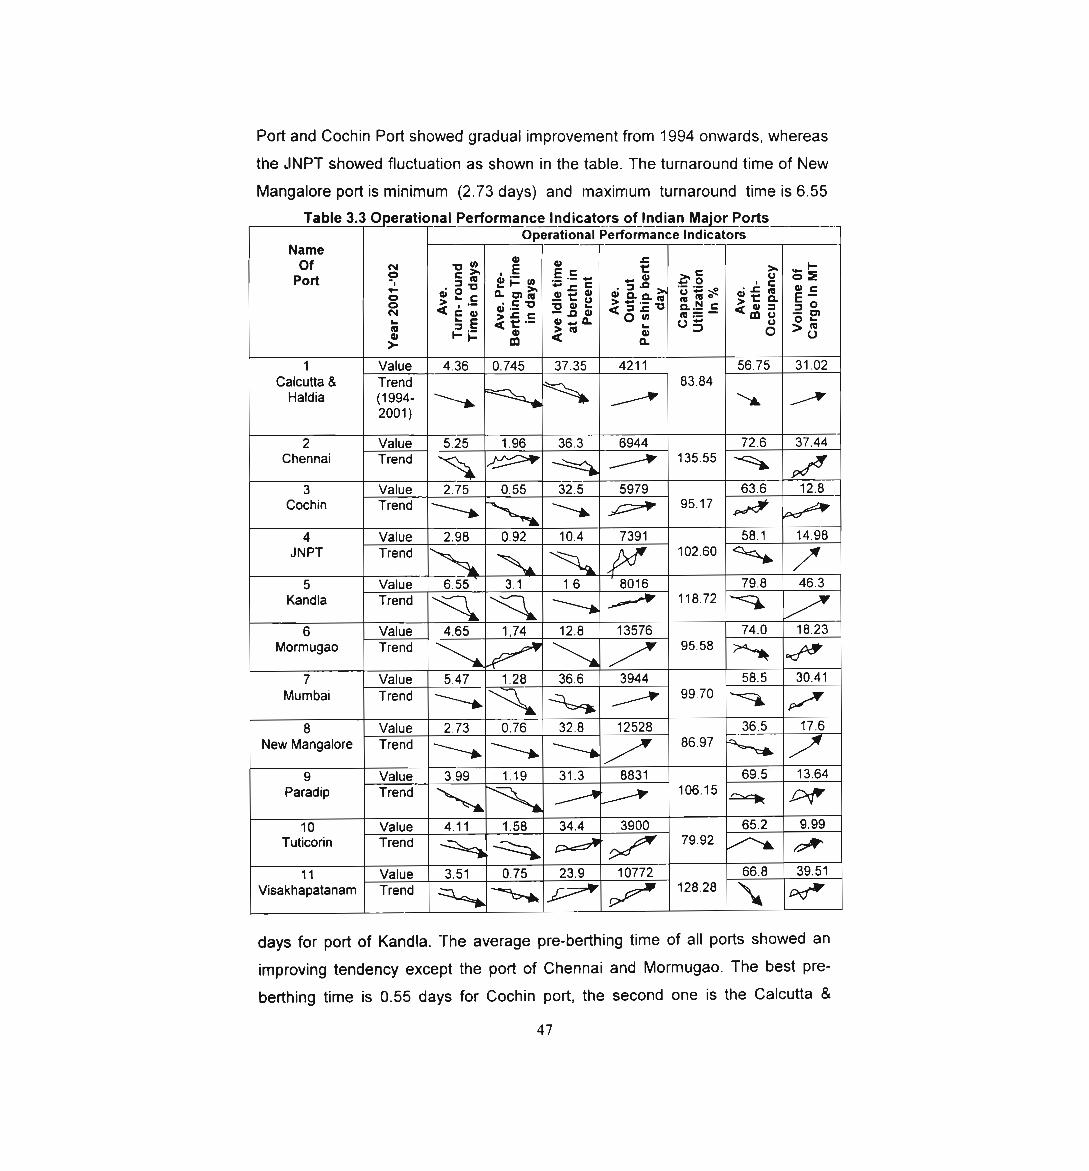
Port and Cochin Port showed gradual improvement from 1994 onwards, whereas
the JNPT showed fluctuation as shown in the table. The turnaround time of New
Mangalore port is minimum (2.73 days) and maximum turnaround time is 6.55
Table 3.3 Operational Performance Indicators of Indian Major PortsOperational Performance Indicators
Ngye N ‘D g E Q g >. ,_ PPOI1 9 Sg ¢')i:¢n 053 3% .2 OE.- - '- >. "' 4: - -- -5 . - ; o :2 ">’?-E “-.2’: %s§ 3%-as tsé 2:N < i: o "’ - .9 0 < -5 — — < .. u;; SE 2%-5 out °2 3% “"3 °:a513 l-- 5: 3 E ” '1’ O > U
1 Value 4.36 0.745 37.35 4211 56.75 31.02Calcutta & Trend 83.84Haldia (1994- 1‘ Z7 \‘_ XV2001)
2 Value 5.25 1.96 36.3 6944 72.6 37.44Chennai Trend yr 27 135.553 Value 2.75 0.55 32.5 5979 63.6 12.8
Cochin Trend \ -\‘ X‘ )7 95.17 Ha Pg,4 Value 2.98 0.92 10.4 7391 58.1 14.98JNPT Trend “A N WV 102.60 k‘5 Value 6.55 3.1 1.6 ' 8016 79.8 46.3Kandla Trend R R 3‘ 2.’? 118.72 ‘§6 Value 4.65 1,74 12.8 13576 74.0 18.23Mormugao Trend 95.587 Value 5.47 1.28 36.6 3944 58.5 30.41‘ 99.70Mumbai Trend \\‘ K‘ it‘ Z7 ‘§ P/V8 Value 2.73 0.76 32.8 12528 36.5 17.6
New Mangalore Trend 3‘ 3‘ 3‘ /V 86.97 %-R /9 Value 3.99 1.19 31.3 8831 69.5 13.64' 10 .15Paradip Trend 2727 5 Dc. pvv10 Value 4.11 1.58 34.4 3900 65.2 9.99Tuticorin Trend 5 4 9,57 9/7 79.92 /\ 0*
11 Value 3.51 0.75 23.9 10772 66.8 39.51Visakhapatanam Trend q_%‘ *5‘ 57 P7’ 123-23 \ pd’
days for port of Kandla. The average pre—berthing time of all ports showed an
improving tendency except the port of Chennai and Mormugao. The best pre
berthing time is 0.55 days for Cochin port, the second one is the Calcutta 8.
47
Haldia port (0.745 days) and Visakhapatanam port is in third position (0.75 days).
At the same time, there is high fluctuation of this value year by year for most of
the ports. Average idle time at berth also showed improvement except the port of
Paradip, Tuticorin and Visakhapatanam. JNPT, Mormugao and Kandla ports are
first, second and third position respectively when the average idle time isconcerned. All major ports showed improvement when the average output per
ship berth day is considered. The highest output per ship berth day is 13576 tons
for the port of Mormugao, and the port of New Mangalore is in the second
position and the port of Visakhapatanam is in the third position. Six ports showed
gradual improvement in average output per ship berth day over the yearswhereas the other five ports showed fluctuation in this value. Port of Chennai has
maximum capacity utilization at the rate of 135.55 percent and port of Tuticorin
has minimum capacity utilization of 79.92 percent. From the Table, it is very clear
that the ports of Chennai, Visakhapatanam, Kandla, Paradip and JNPT have
over utilized their capacity and other ports have under utilized their capacity.
Hence necessary steps must be taken to increase the capacity of Ports ofChennai, Visakhapatanam, Kandla, Paradip and JNPT to reduce the congestion.
The trends of berth occupancy of all ports from 1992 to 2000 have been
analyzed. The port of Cochin has shown an increasing trend in average berth
occupancy from 1992 to 2000. All other ports showed a decreasing tendency of
the average berth occupancy. There is high variability in average berthoccupancy of all ports except Calcutta and Haldia over the years. Port of New
Mangalore has lowest berth occupancy, followed by Calcutta and Haldia and
JNPT. Kandla port has longest berth occupancy. The trend of the volume of total
cargo handled in each port from 1993 to 1999 was studied. From the Table, it is
understood that the volume of cargo handled through all ports have increased
from 1993. But the variation is different for each port. Calcutta and Haldia, JNPT
and Kandla showed gradual increase in volume of cargo over the years. All other
ports showed fluctuation in volume of cargo handled. Port of Kandla handled
maximum volume of cargo in 1999 followed by Visakhapatanam in second
position and Chennai in third position. The port of Tuticorin and Cochin handled
the minimum volume of cargo.
48
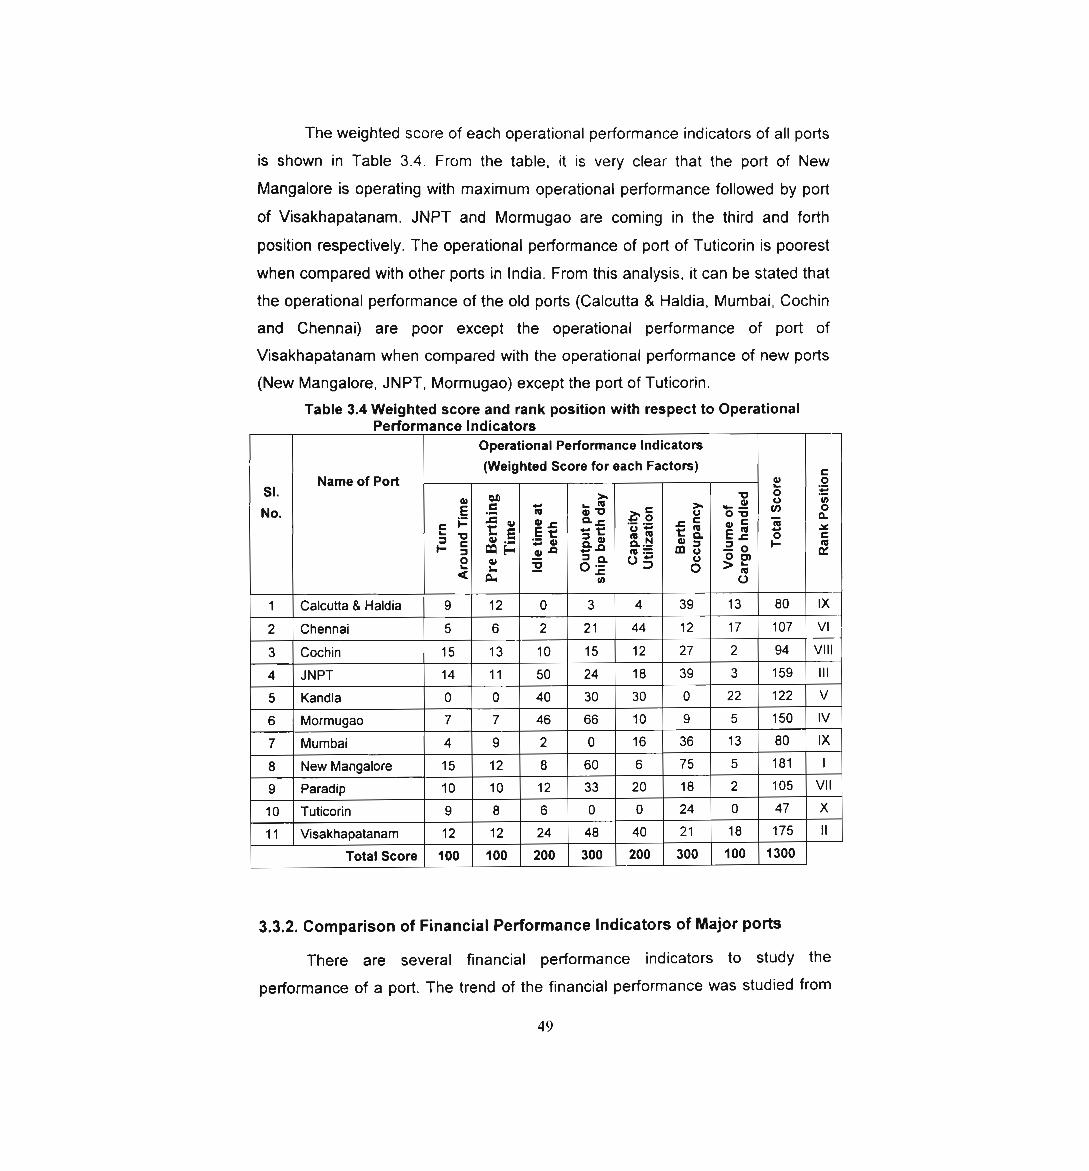
The weighted score of each operational performance indicators of all ports
is shown in Table 3.4. From the table, it is very clear that the port of New
Mangalore is operating with maximum operational performance followed by port
of Visakhapatanam. JNPT and Mormugao are coming in the third and forth
position respectively. The operational performance of port of Tuticorin is poorest
when compared with other ports in India. From this analysis, it can be stated that
the operational performance of the old ports (Calcutta & Haldia, Mumbai, Cochin
and Chennai) are poor except the operational performance of port ofVisakhapatanam when compared with the operational performance of new ports
(New Mangalore, JNPT, Mormugao) except the port of Tuticorin.
Table 3.4 Weighted score and rank position with respect to OperationalPerformance Indicators
Operational Performance Indicators
(Weighted Score for each Factors) C5' Name of Port 2 ,9. -0 O 3:No. '5 5 E 3 g 3 '5 3 ii §c |— -‘E 0 0 3 3-: -5 -5 .1: E o 5 3 x5 '0 0 .§ 5 :1 E a 3 E a. E .: o 5r— S no {-1 3',’ n 5-0 35 an 3 3 o "' n:2 ~ 5 3 .9 0 5 3 :9 9’< 1:’: ‘ 5 81 Calcutta 8. Haldia 9 12 O 3 4 39 13 80 IX2 Chennai 5 6 2 21 44 12 17 107 VI3 Cochin 15 13 10 15 12 27 2 94 VIII4 JNPT 14 11 50 24 18 39 3 159 Ill5 Kandla O 0 40 30 30 0 22 122 V6 Mormugao 7 7 46 66 10 9 5 150 IV7 Mumbai 4 9 2 0 16 36 13 80 IX8 New Mangalore 15 12 8 60 6 75 5 181 l9 Paradip 10 10 12 33 20 18 2 105 VII10 Tuticorin 9 8 6 0 O 24 0 47 X11 Visakhapatanam 12 12 24 48 40 21 18 175 ll
Total Score 100 100 200 300 200 300 100 1300
3.3.2. Comparison of Financial Performance Indicators of Major ports
There are several financial performance indicators to study theperformance of a port. The trend of the financial performance was studied from
49
the data collected from 1990 to 2001. Trend and fluctuations are indicated here
also as done earlier in Table 3.3. The amount of operating income and operating
surplus, operating ratio and ratio of net capital employed to the net surplus are
the sub—factors used in determining the financial performance of the ports for the
year 2001 The same is shown in Table 3.5.
From the table, it is seen that the operating income of all ports has shown
a gradual increasing tendency from 1990 onwards. The ports of Chennai, Kandla
and Mumbai have shown fluctuation in operating income over the years. The
maximum operating income was generated by Calcutta and Haldia at Rs.1146.93 million in 2001. The ports of Mumbai and Visakhapatanam have come in
the second and third position respectively. The port of Tuticorin is in the last
position; the operating income is only Rs.117.05 million in 2001. The operating
surplus has also increased over the years except the ports of Chennai and
Mumbai. High fluctuation is seen in all ports except the port of Calcutta and
Haldia. From this, it is very clear that the operating expenditure is varying very
much from year to year. The port of Calcutta and Haldia is in the first position
(Rs. 449.87 million) and JNPT and Visakhapatanam are in the second and third
position respectively, as far as operating income is concerned. The ports of
Mumbai and Cochin are in eleventh and tenth position respectively. Theoperating surplus is only Rs. 17.16 million for Mumbai port and Rs. 31.33 million
for Cochin port in 2001.The operating ratio of all ports exceed 50 percent except
two ports viz. ports of JNPT and Tuticorin. These two ports are newly developed
ports and have private participation in most of the operations in the ports. Port of
Chennai, Cochin, Kandla and Mumbai have shown an increasing tendency of
operating ratio. This is a serious matter that needs to be checked and controlled.
Thus, it is very clear that the operating expenditure is very high for all old ports in
India. Port of Chennai, Cochin and Mumbai are in ninth, tenth and eleventh
position respectively in case of operating ratio is concerned. The ratio of net
capital employed to the net surplus indicates the financial strength of the port.
Table 3.5 also shows the ratio of net capital employed to the net surplus for the
year 2001. The port of JNPT has minimum ratio (only 9), which indicates that the
net surplus is maximum, and so the port of JNPT is financially stable. Port of
50
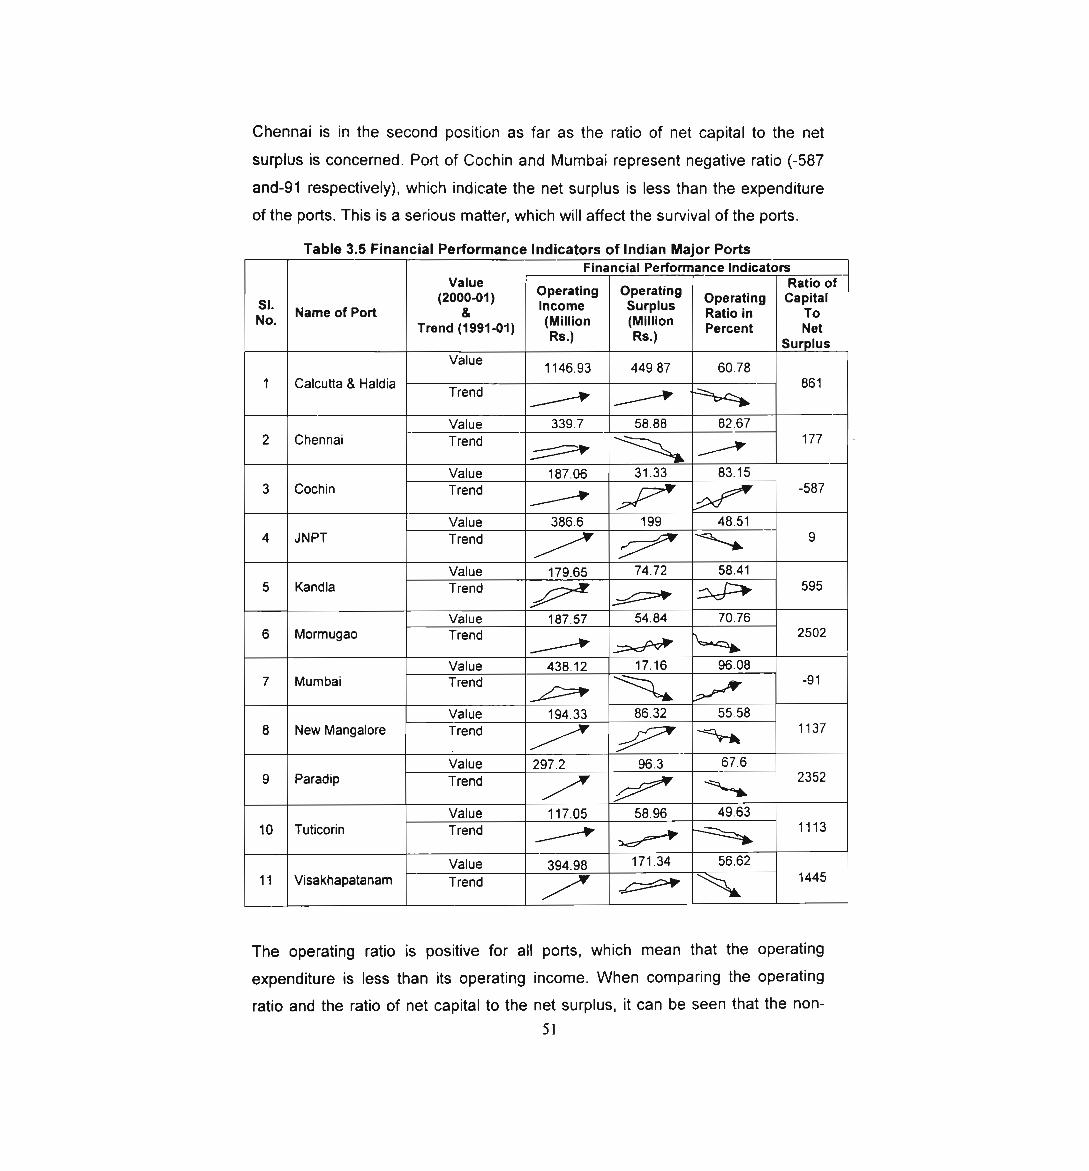
Chennai is in the second position as far as the ratio of net capital to the net
surplus is concerned. Port of Cochin and Mumbai represent negative ratio (-587
and-91 respectively). which indicate the net surplus is less than the expenditure
of the ports. This is a serious matter, which will affect the survival of the ports.
Table 3.5 Financial Performance Indicators of Indian Major PortsFinancial Performance Indicators
Value O t." 0 ram‘ Ratio of(2000-01) 9°” ' 9 9° 9 Operating CapitalSI Income SurplusNo’ Name of Port & (Minion (Minion Ratio in To' Trend (1991-01) Percent NotRs.) Rs.) SurplusV"“'“° 1146.93 449.87 60.78" 11 Calcutta 8. Haldia Trend J J _ 86Value 339.7 58.88 82.672 Chennai Trend 177jv 7*; Z’Value 187.06 31.33 83.15
3 Cochin Trend J 2?‘? JV -587Value 386.6 199 48.514 JNPT Trend / iv K‘ 9Value 179.65 74.72 58.415 Kandla Trend /I 39 59527Value 187.57 54.84 70.766 Mormugao Trend 25022' pee»? ‘weeValue 43812 17.16 96.087 Mumbai Trend ‘91Value 194.33 86.32 55.58
8 New Mangalore Trend /7 /V \—-\?_~ 1137value 297.2 96.3 67.6 23529 Paradip Trend /V / ekfiValue 117.05 58.96 49-53
10 Tuticorin Trend {V 3],, e‘ 1113Va|ue 394.98 171.34 56.62
11 Visakhapatanam Trend / fy \ 1445
The operating ratio is positive for all ports, which mean that the operating
expenditure is less than its operating income. When comparing the operating
ratio and the ratio of net capital to the net surplus, it can be seen that the non51
operating expenditure (indirect expenditure) is very high for the ports of Cochin
and Mumbai. So the real culprit is the non-productive expenditure, which has to
be contained in the case of Cochin and Mumbai. All ports except the port of
JNPT and Chennai show that the financial position is not good enough for the
future growth and development of the port. This is mainly due to the highexpenditure incurred by the ports.
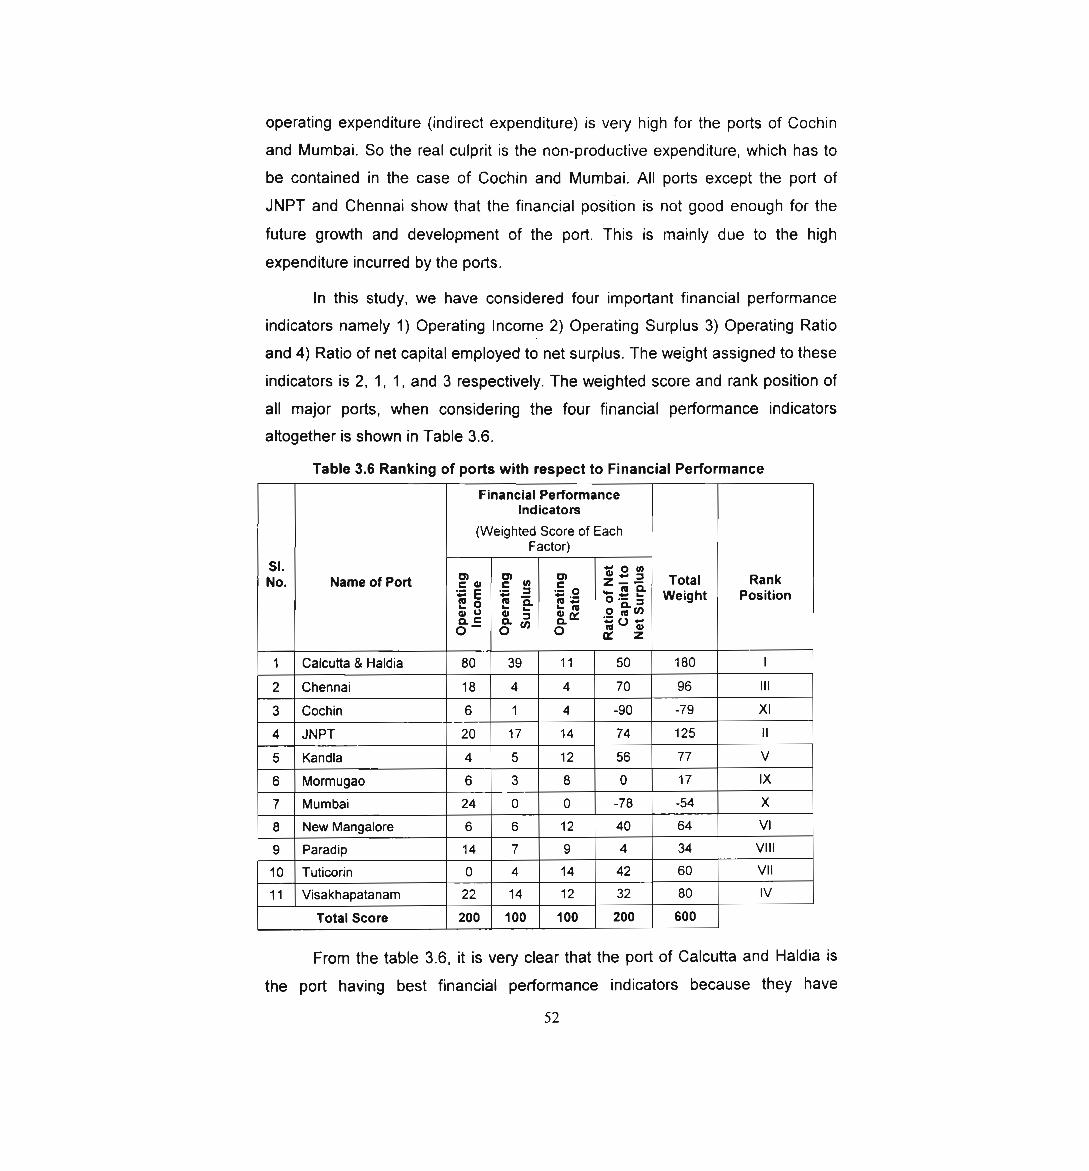
In this study, we have considered four important financial performance
indicators namely 1) Operating Income 2) Operating Surplus 3) Operating Ratio
and 4) Ratio of net capital employed to net surplus. The weight assigned to these
indicators is 2, 1, 1 , and 3 respectively. The weighted score and rank position of
all major ports, when considering the four financial performance indicatorsaltogether is shown in Table 3.6.
Table 3.6 Ranking of ports with respect to Financial PerformanceFinancial Performance
Indicators
(Weighted Score of EachFactor)SI. *5 3 in
No. Name of Port E’ 0 E’ 3 E’ O z 3 -g_ Total Rank:5 E E E E -_—_ *5 vi -5 Weight Position0 U 0 5 cu & ,9 cu ‘/30.5 n. U, o. o-- 0 «o o o g 1,’
1 Calcutta & Haldia 80 39 11 50 180 I2 Chennai 18 4 4 70 96 III3 Cochin 6 1 4 -90 -79 XI4 JNPT 20 17 14 74 125 ll5 Kandla 4 5 12 56 77 V6 Mormugao 3 0 17 IX7 Mumbai 24 0 0 -78 -54 X8 New Mangalore 6 6 12 40 64 VI9 Paradip 14 7 9 4 34 VIII10 Tuticorin 0 4 14 42 60 VII11 Visakhapatanam 22 14 12 32 80 IV
Total Score 200 100 100 200 600
From the table 3.6, it is very clear that the port of Calcutta and Haldia is
the port having best financial performance indicators because they have
52
generated maximum operating income and have maximum operating surplus
when compared with other ports in India. JNPT has best operating ratio and best
ratio of net capital employed to the net surplus. Hence, it can be said that the
total expenditure (both operating and Non—operating) of JNPT is under their
control. Chennai came in the third position as for as the financial performance
indicators are concerned. The financial performance indicators of Cochin and
Mumbai ports are in the last two positions (tenth and eleventh) respectively.
From this study, it can be stated that the financial position of these ports became
very poor because they have minimum operating income, operating surplus,
operating ratio and ratio of net capital employed to the net surplus generated.
This may be due to the cargo has shifted from Cochin to the nearby port ofTuticorin, and from Mumbai to its nearby port of JNPT. Cochin and Mumbai ports
being the old ports, its operating and non—operating expenditures are very high,
resulted bad financial position. Hence its operational efficiency has to be
increased to compete with its nearby ports.
3.3.3 Comparison of Facilities available in Ports
A comparative study of all facilities available in each port has been done
to rank the ports in India on this basis. For this purpose, the facilities available in
the ports are classified into four groups:
0 Berthing facilities
o Storage facilities
o Cargo handling facilities
o Capacity available to handle major commodity
These facilities are separately studied and the rank positions are determined by
providing weight to each group.
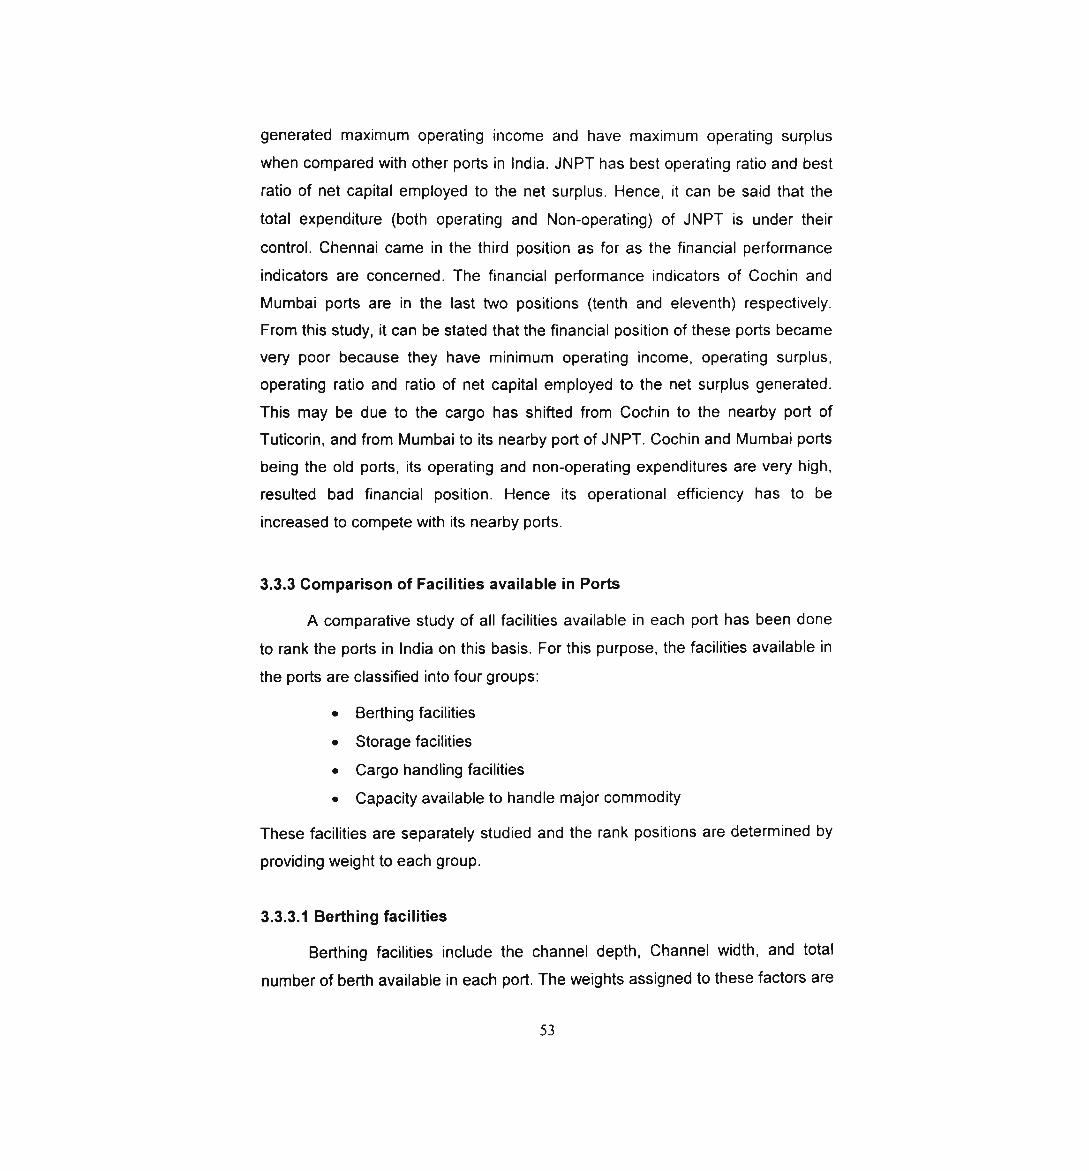
3.3.3.1 Berthing facilities
Berthing facilities include the channel depth, Channel width, and total
number of berth available in each port. The weights assigned to these factors are
53
2, 1, and 3 respectively. These factors are scaled and compared with other ports.The actual values of the factors are shown in Table 3.7.
From the table, it is very clear that the port of Chennai has maximum
channel depth and Port of Calcutta and Haldia has minimum channel depth. The
port of Calcutta and Haldia has maximum channel width and Cochin has a
minimum channel width of 185 meters. The old ports have large number of
berthing facilities. Port of Mumbai has 46 berths, Calcutta and Haldia together
has 45 berths, Chennai has 20 berths, Visakhapatanam has 19 berths, Kandla
has 15 berths and Cochin 14 berths whereas Mormugao has only 4 berths.
Table 3.7 Berth Facilities available in Major ports
it Name of Port Channel Depth Channel Width Total Berth(m) (m) (N0)1 Calcutta & Haldia 3+7 200+ 467 33+122 Chennai 19 244 203 Cochin 12 185 144 Jawaharlal Nehru (JNPT) 11 350 155 Kandla 5 200 156 Mormgao 13 250 47 Mumbai 11 366 468 New Mangalore 15 160 99 Paradip 13 160 910 Tuticorin 10 162 1011 Visakhapatanam 10.7 122 19
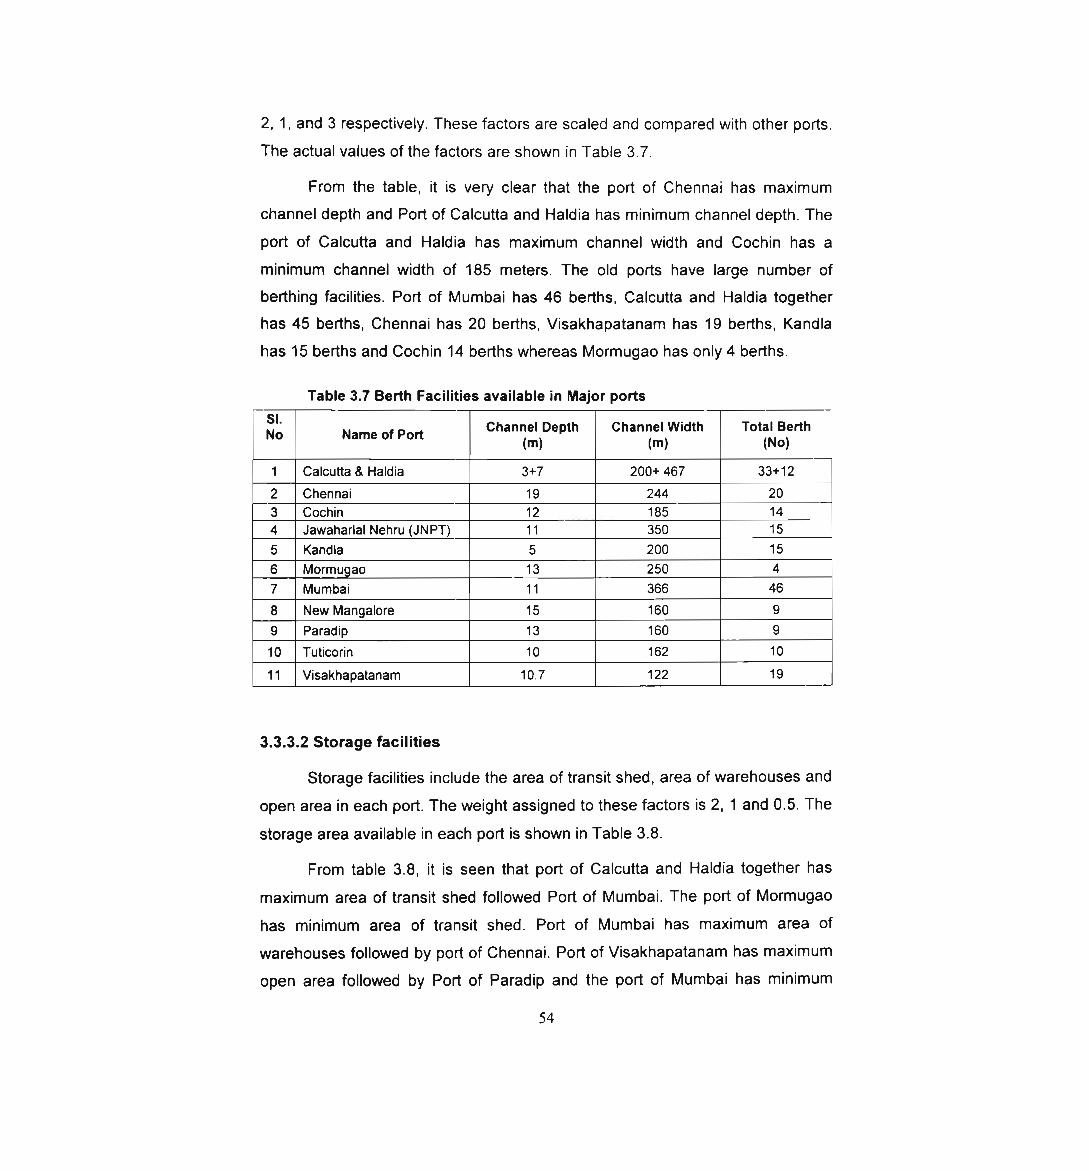
3.3.3.2 Storage facilities
Storage facilities include the area of transit shed, area of warehouses and
open area in each port. The weight assigned to these factors is 2, 1 and 0.5. The
storage area available in each port is shown in Table 3.8.
From table 3.8, it is seen that port of Calcutta and Haldia together has
maximum area of transit shed followed Port of Mumbai. The port of Mormugao
has minimum area of transit shed. Port of Mumbai has maximum area of
warehouses followed by port of Chennai. Port of Visakhapatanam has maximum
open area followed by Port of Paradip and the port of Mumbai has minimum
54
open area available. In general, we can see that the old ports have good storage
facilities than port developed after independence of the country and the storage
facilities provided for the newly developed ports are much lesser.
Table 3.8 Storage Area available in ports
Name of Port Area of tragtsit Area of warze open Area (ma)shed (m ) Houses (m )
1 Calcutta 3. Haldia 178466 500007 184752 Chennai 36000 65686 + 12600 3250003 Cochin 28263 16356 + 10732 25000‘4 Jawaharlal Nehru (JNPT) 100630 75000‘ 6300005 Kandla 17567 44622 5780206 Mormugao 7700 17096 1315327 Mumbai 133135 124951 256478 New Mangalore 23634 4380 578179 Paradip 1 1200 7504 65000010 Tuticorin 10800 15060 7200011 Visakhapatanam 25935 10482 1001663i
Data collected from the respective ports through telephone.
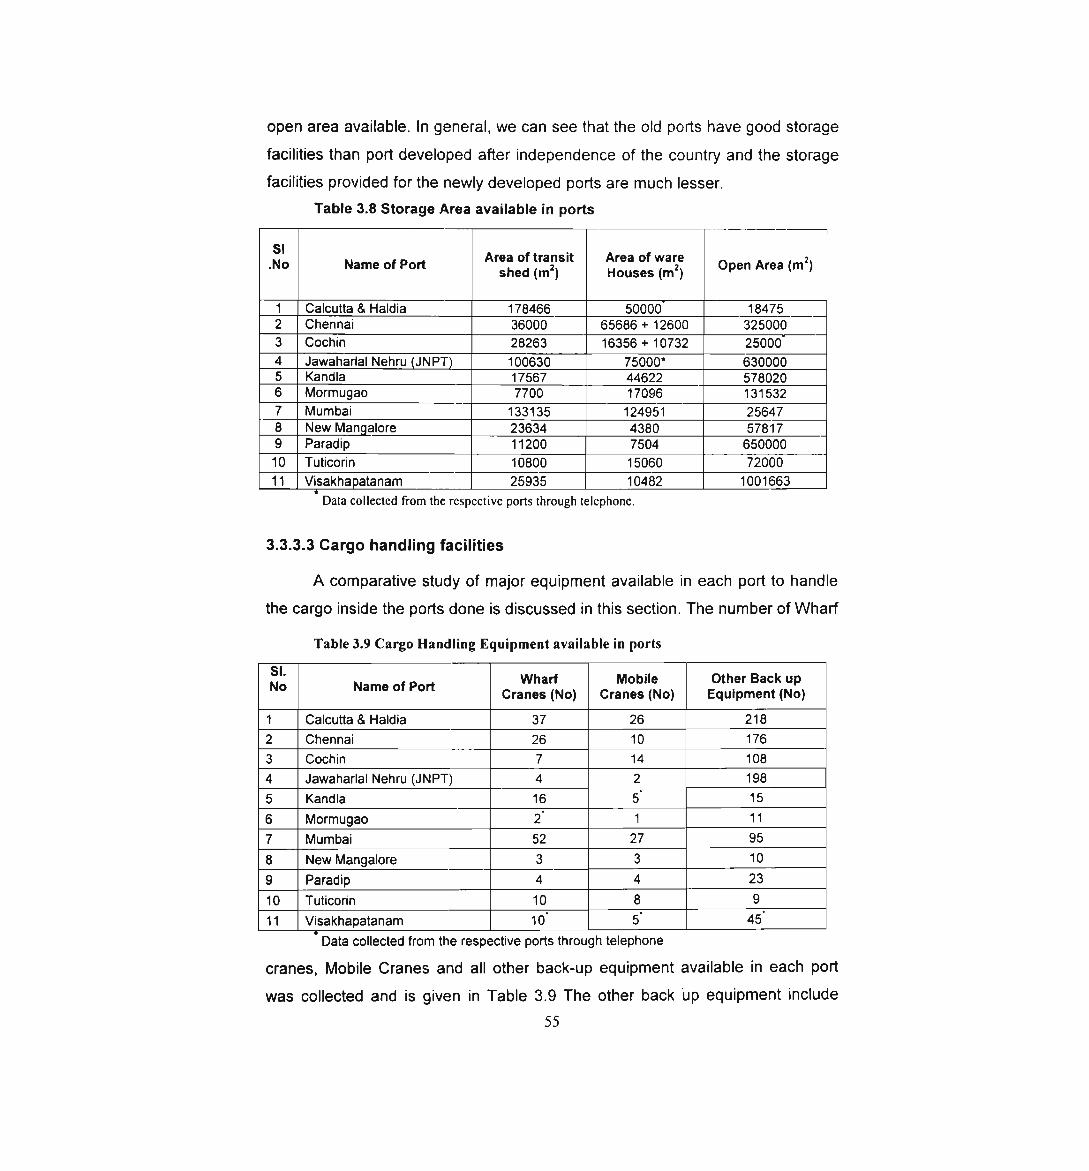
3.3.3.3 Cargo handling facilities
A comparative study of major equipment available in each port to handle
the cargo inside the ports done is discussed in this section. The number of Wharf
Table 3.9 Cargo Handling Equipment available in ports
No Name of Port Cravr‘1,::r(fNo) Crxtggllglo) E(?1titi1i:rrr1B¢aanctk(r|\|JtF'>’)1 Calcutta 8 Haldia 37 26 2182 Chennai 26 10 1763 Cochin 7 14 1084 Jawaharlal Nehru (JNPT) 4 2 1985 Kandla 16 5' 156 Mormugao 2' 1 117 Mumbai 52 27 958 New Mangalore 3 3 109 Paradip 4 4 2310 Tuticorin 10 8 911 Visakhapatanam 10' 5' 45'
' Data collected from the respective ports through telephone
cranes, Mobile Cranes and all other back-up equipment available in each port
was collected and is given in Table 3.9 The other back "up equipment include55
Forklift Trucks, Pay Loaders and Shovel Dozers, Tractors, Trailers, locomotives
etc. The weight assigned in each category of equipment is 2, 1.5 and 1 for wharf
cranes, mobile cranes and other backup equipment respectively.
From the table 3.9, it is seen that port of Mumbai has maximum number of
wharf cranes and mobile cranes followed by port of Calcutta and Haldia together
where as port of Mormugao has only 2 wharf cranes and 1 mobile crane. But the
port of Calcutta and Haldia has maximum number of other back-up equipment
followed by port of JNPT. The port of Tuticorin has only nine number of other
back-up equipment. Again, we can see that the old ports have more handling
facilities than port developed after independence of the country ‘and the handling
facilities provided for the newly developed ports are not sufficient.
3.3.3.4 Capacity available to handle major commodity
Another analysis was done based on the capacity available in each port to
handle different types of commodities. The capacities of major commodity
considered in this study are: Container Cargo Handling, Petroleum Oil and
Lubricants, Fertilizer Cargo handling and Iron Ore Handling. The capacityavailable to handle the above four commodities for each port is shown in Table
3.10. Blank cells in the table indicate that no separate capacity is provided to
handle the corresponding category of cargo. Equal weight of 1 unit is assigned to
each factor for comparison purpose.
From table 3.10, considering container handling, JNPT, Mumbai and
Calcutta and Haldia in the first, second and third position respectively. Kandla,
Mormugao, New Mangalore, and Visakhapatanam ports have only negligible
capacity to handle containerized cargo because these ports were not constructed
and developed to handle containerized cargo. Port of Kandla has maximum
capacity to handle POL cargo. Mumbai and Calcutta and Haldia are in the
second and third position. POL handling capacity is not provided in JNPT.
Mormugao and Paradip have only very limited capacity to handle POL cargo.
Only four ports have capacity to handle fertilizer cargo. They are JNPT. Paradip.
Cochin and Visakhapatanam. Similarly Iron ore handling capacity is provided in
56
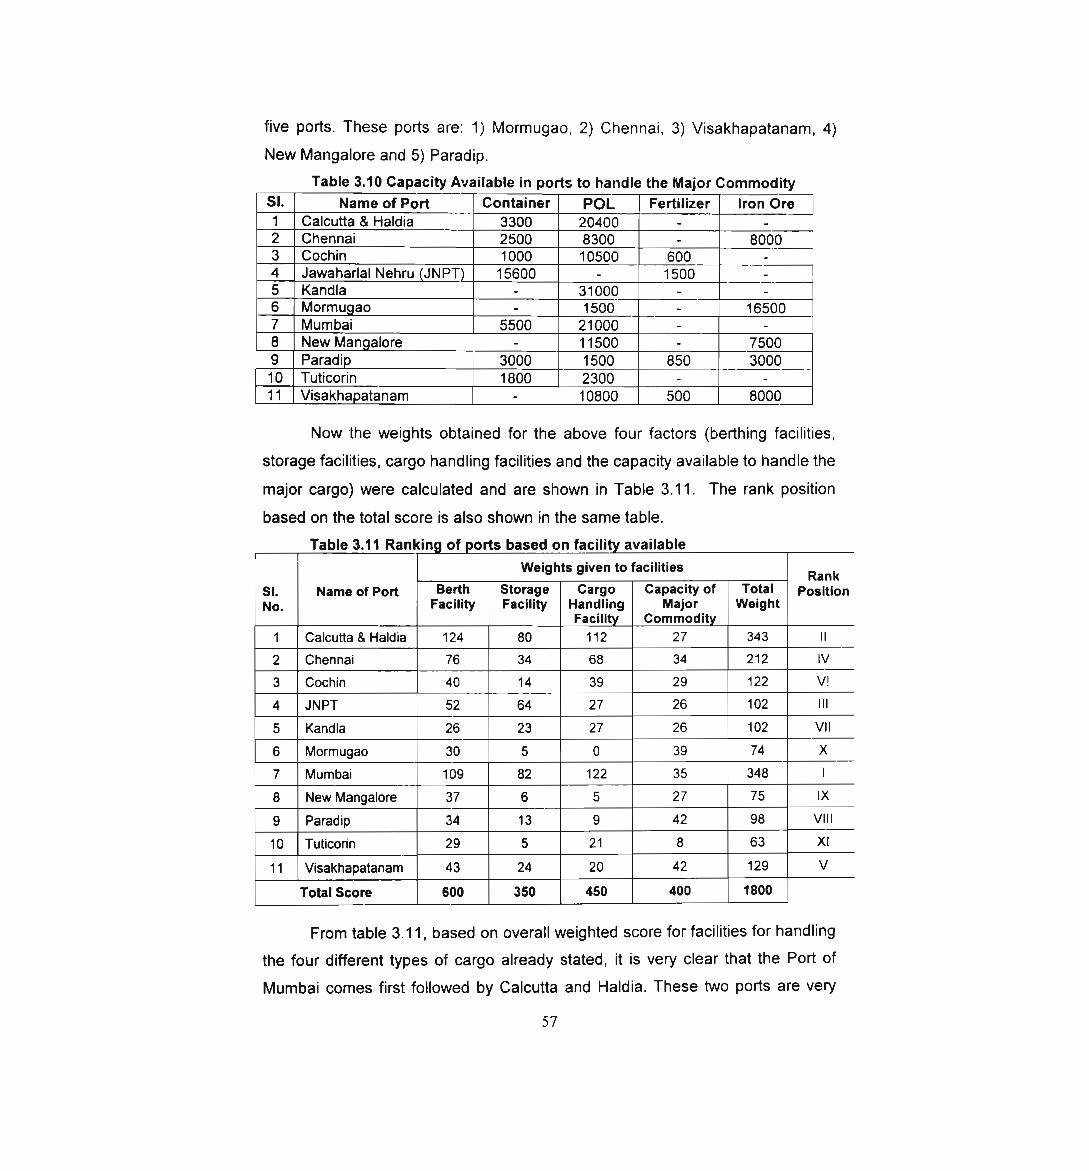
five ports. These ports are: 1) Mormugao, 2) Chennai, 3) Visakhapatanam, 4)
New Mangalore and 5) Paradip.
Table 3.10 Capacity Available in ports to handle the Major CommoditySI. Name of Port Container POL Fertilizer Iron Ore1 Calcutta & Haldia 3300 20400 - 2 Chennai 2500 8300 - 80003 Cochin 1000 10500 600 4 Jawaharlal Nehru (JNPT) 15600 - 1500 5 Kandla - 31000 - 6 Mormugao - 1500 - 165007 Mumbai 5500 21000 - 8 New Mangalore - 11500 - 75009 Paradip 3000 1500 850 300010 Tuticorin 1800 2300 - 11 Visakhapatanam - 10800 500 8000
Now the weights obtained for the above four factors (berthing facilities,
storage facilities, cargo handling facilities and the capacity available to handle the
major cargo) were calculated and are shown in Table 3.11. The rank positionbased on the total score is also shown in the same table.
Table 3.11 Ranking of ports based on facility available
Weights given to facilities Ranks|_ Namg of port Berth Storage Cargo Capacity of Total positionNo Facility Facility Handling Major Weight
Facility Commodity1 Calcutta 8. Haldia 124 80 112 27 343 II2 Chennai 76 34 68 34 212 IV3 Cochin 40 14 39 29 122 V!4 JNPT 52 64 27 26 102 Ill5 Kandla 26 23 27 26 102 VII6 Mormugao 30 5 0 39 74 X7 Mumbai 109 82 122 35 348 I8 New Mangalore 37 6 5 27 75 IX9 Paradip 34 13 9 42 98 VIII10 Tuticorin 29 5 21 8 63 XI11 Visakhapatanam 43 24 20 42 129 V
Total Score 600 350 450 400 1800From table 3.11, based on overall weighted score for facilities for handling
the four different types of cargo already stated, it is very clear that the Port of
Mumbai comes first followed by Calcutta and Haldia. These two ports are very
57
old ports in lndia. JNPT and Chennai ports have moderate facilities. Tuticorin_
Mormugao and New Mangalore, which were developed after independence,
come in the end based on facility criteria.
3.3.4 Comparison of Manpower available and its utilization in major ports
The trend of manpower in each port from 1990 to 2001 has been studied.
The trend of change in manpower available and the value of manpower and the
productivity are shown in Table 3.12. The manpower productivity was measured
using the ratio of operating income to the total manpower available (operating
income per man) and the ratio of volume of cargo handled to the manpower (tons
per man) available. Hence the number of manpower available, operating income
per man and tonnage per man has been considered for comparing themanpower productivity of ports. The weight assigned to these factors is 1,2 and 2
respectively.
From the table, it is clear that all ports have taken steps to reduce the
manpower from 1990 except the port of JNPT and New Mangalore. But the rate
of decrease is different for each port. Mormugao has almost steady staff strength
during this period. JNPT has least manpower followed by New Mangalore and
Tuticorin. All old ports have higher staff strength because, port sector wasconsidered as an important employment sector after independence. Now the
situation has totally changed. So the latest developed ports have less staffstrength due to change in technology of material handling system. Old ports are
now changing the technology towards automation. So it is very difficult to reduce
their staff strength all on a sudden due to the resistance from all corners. Hence
the rate of reduction of staff strength is very slow as shown in the table.
Class wise analysis of the staff strength has also been done. There are
77562 employees of all category in Indian Ports on 31—12— 2001. It is very
interesting to see that in almost all ports, the number of Class I officers are more
than the number of Class ll officers except in the ports of Cochin, NewMangalore and Paradip. So the Class I officers are underutilized. Class ll officers
are over burdened due to their high span of control. The staff strength of Class IV
58
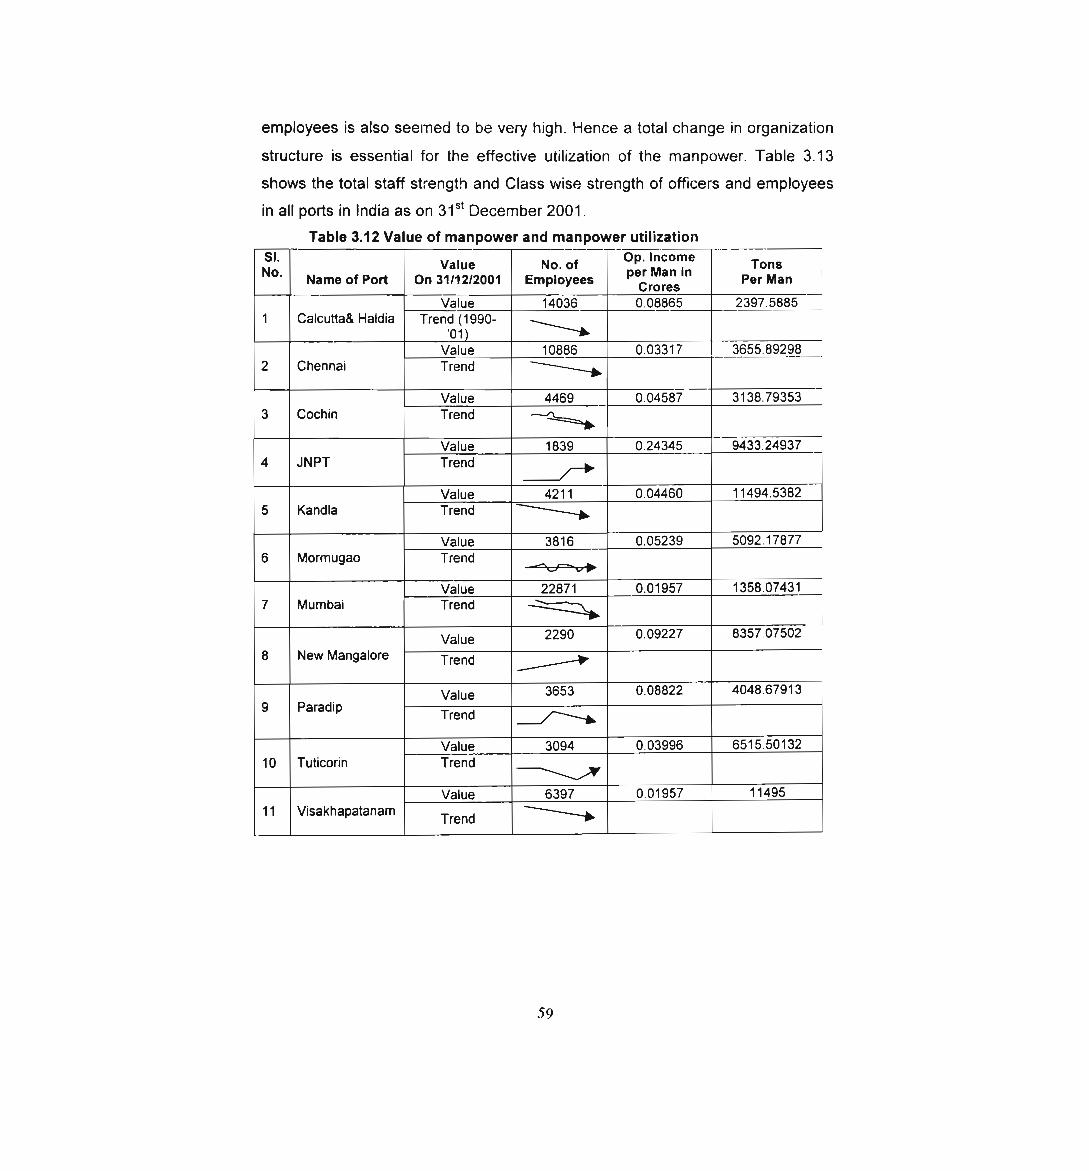
employees is also seemed to be very high. Hence a total change in organization
structure is essential for the effective utilization of the manpower. Table 3.13
shows the total staff strength and Class wise strength of officers and employees
in all ports in India as on 315‘ December 2001.
Table 3.12 Value of manpower and manpower utilization
Value No. of °:'r Tons' Name of Port On 31/12/2001 Employees P crows Per Man
Value 14036 0.08865 2397.58851 Calcutta& Haldia Trend (1990'01) *5Value 10886 0.03317 3655.892982 Chennai Trend L.
Value 4469 0.04587 3138.793533 Cochin Trend 3’
Value 1839 0.24345 9433249374 JNPT Trend ,Value 4211 0.04460 11494.53825 Kandla Trend 6,Value 3816 0.05239 5092.17877
6 Mormugao TrendValue 22871 0.01957 1358.07431
7 Mumbai Trend LValue 2290 0.09227 8357.07502
8 New Mangalore Trend J_ Value 3653 0.08822 4048.679139 Paradip Trend J‘
Value 3094 0.03996 6515.5013210 Tuticorin Trend W
Value 6397 0.01957 1149511 Visakhapatanam Trend L,
5 9
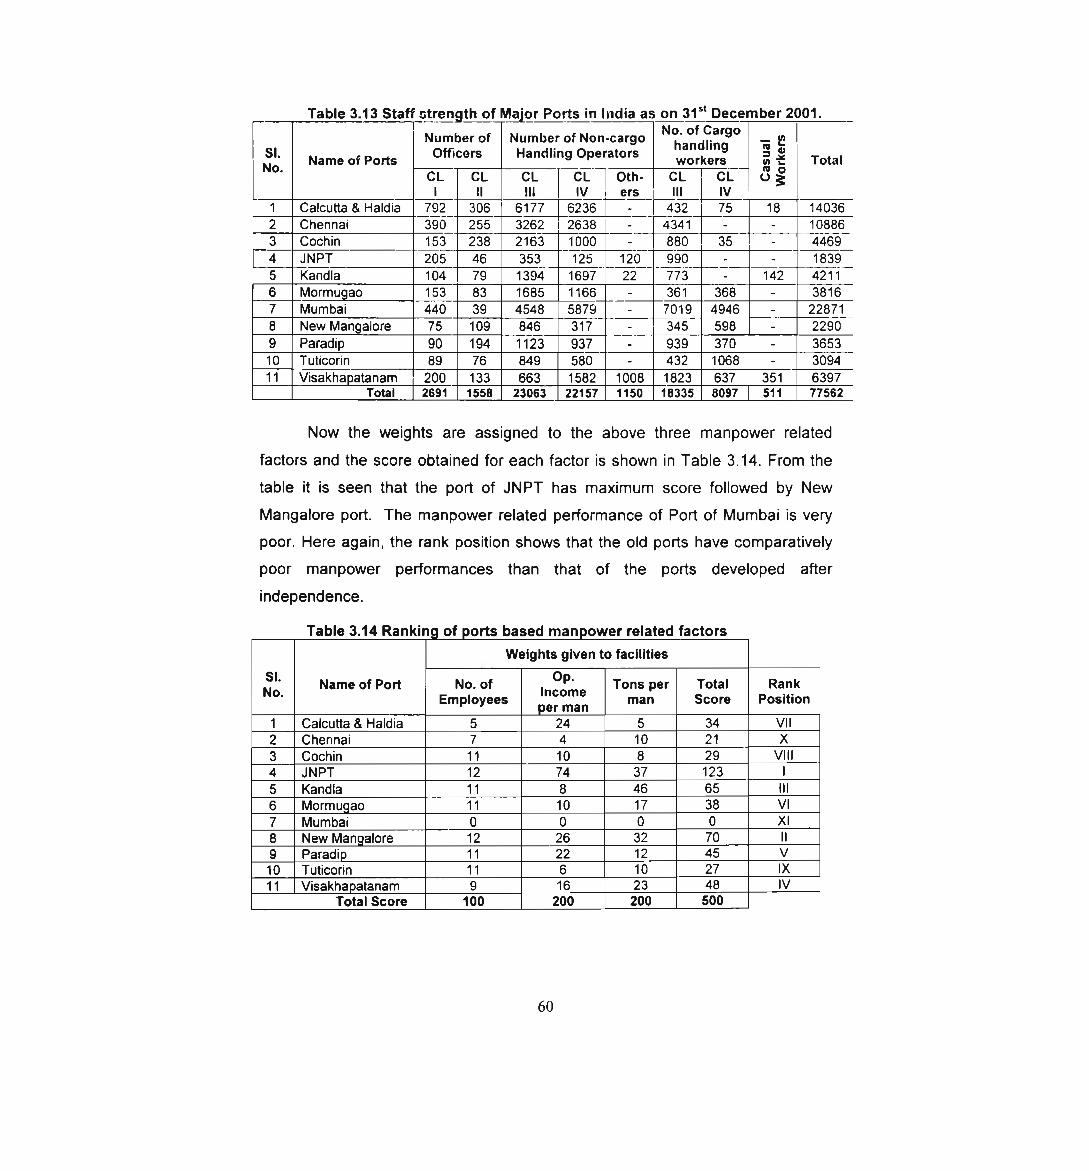
Table 3.13 Staff strength of Major Ports in India as on 315' December 2001.
Number of Number of Non-cargo Nc|:'ac:‘fd(|:rgg° E 5 |3:’. Name of Ports Officers Handling Operators workers 2 E Total' CL CL CL CL Oth- CL CL 0 gI ll lll lV ers III IV1 Calcutta 8 Haldia 792 306 6177 6236 - 432 75 18 140362 Chennai 390 255 3262 2638 - 4341 - - 108863 Cochin 153 238 2163 1000 - 880 35 — 44694 JNPT 205 46 353 125 120 990 — - 18395 Kandla 104 79 1394 1697 22 773 - 142 42116 Mormugao 153 83 1685 1166 - 361 368 - 38167 Mumbai 440 39 4548 5879 - 7019 4946 - 228718 New Mangalore 75 109 846 317 - 345 598 - 22909 Paradip 90 194 1123 937 - 939 370 - 365310 Tuticorin 89 76 849 580 - 432 1068 - 309411 Visakhapatanam 200 133 663 1582 1008 1823 637 351 6397
Total 2691 1558 23063 22157 1150 18335 8097 511 77562
Now the weights are assigned to the above three manpower relatedfactors and the score obtained for each factor is shown in Table 3.14. From the
table it is seen that the port of JNPT has maximum score followed by New
Mangalore port. The manpower related performance of Port of Mumbai is very
poor. Here again, the rank position shows that the old ports have comparatively
poor manpower performances than that of the ports developed afterindependence.
Table 3.14 Rankinlof ports based manpower related factorsWeights given to facilitiesSI. N Op.N°_ ame of Port No. of Income Tons per Total RankEmployees man Score Positionper man1 Calcutta 8. Haldia 5 24 5 34 VII2 Chennai 7 4 10 21 X3 Cochin 11 10 8 29 VIII4 JNPT 12 74 37 123 I5 Kandla 11 8 46 65 Ill6 Mormugao 11 10 17 38 VI7 Mumbai 0 0 0 0 XI8 New Mangalore 12 26 32 70 ll9 Paradip 11 22 12 45 V10 Tuticorin 11 6 10 27 IX11 Visakhapatanam 9 16 23 48 IVTotal Score 100 200 200 500
60
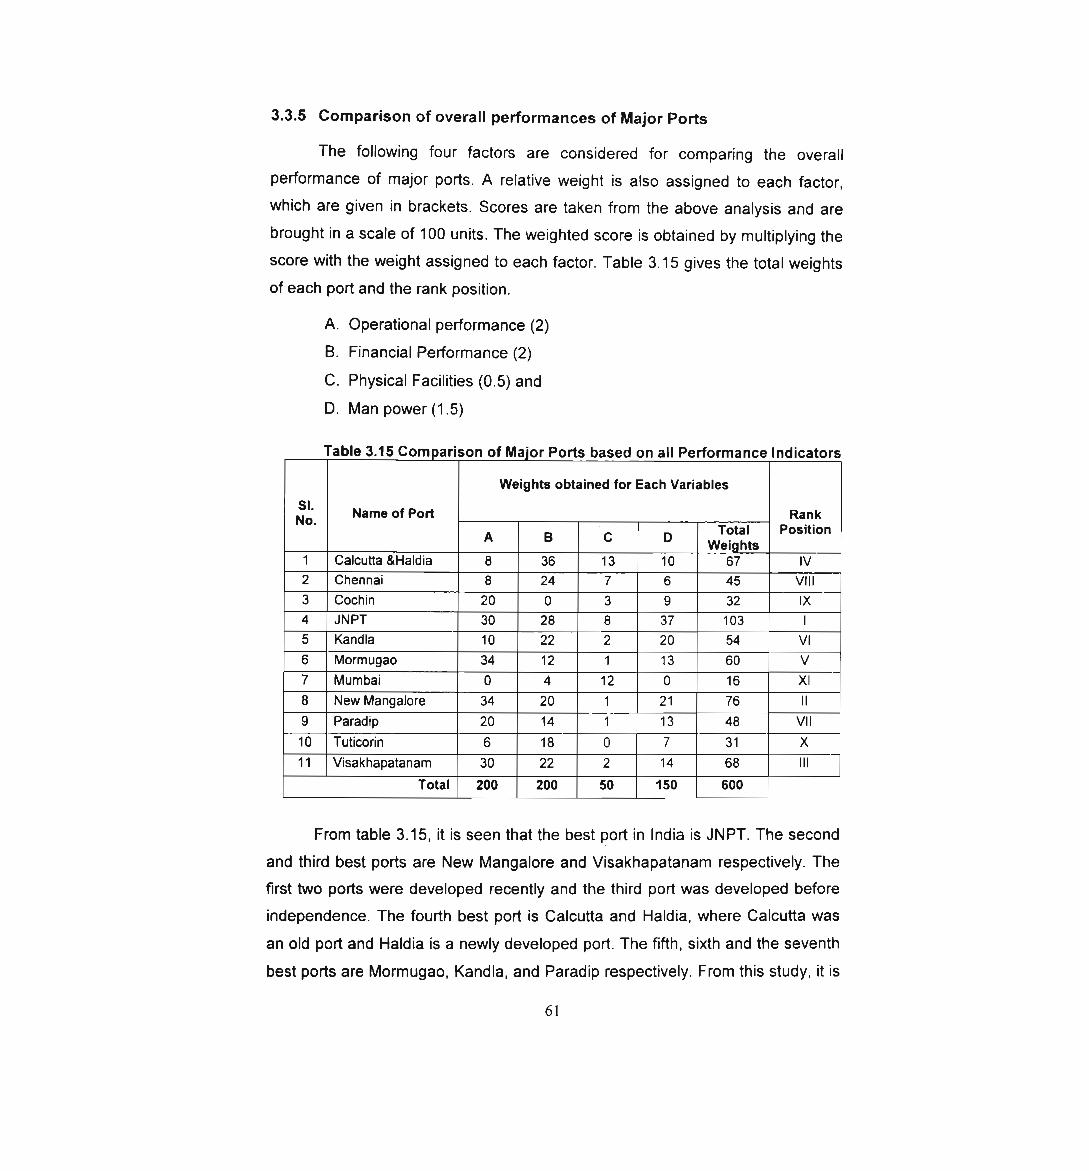
3.3.5 Comparison of overall performances of Major Ports
The following four factors are considered for comparing the overallperformance of major ports. A relative weight is also assigned to each factor,
which are given in brackets. Scores are taken from the above analysis and are
brought in a scale of 100 units. The weighted score is obtained by multiplying the
score with the weight assigned to each factor. Table 3.15 gives the total weights
of each port and the rank position.
A. Operational performance (2)
B. Financial Performance (2)
C. Physical Facilities (0.5) and
D. Man power(1.5)
Table 3.15 Comparison of Major Ports based on all Performance Indicators
Weights obtained for Each Variables
3;‘. Name of Port Ra_n_kA B ' C D Total PositionWeights1 Calcutta &Ha|dia 8 36 13 10 67 IV2 Chennai 8 24 7 6 45 VIII3 Cochin 20 0 3 9 32 IX4 JNPT 30 28 8 37 103 I5 Kandla 10 22 2 20 54 VI6 Mormugao 34 12 1 13 60 V7 Mumbai 0 4 12 0 16 XI
8 New Mangalore 34 20 1 21 76 ll9 Paradip 20 14 1 13 48 VII10 Tuticorin 6 18 0 7 31 X11 Visakhapatanam 30 22 2 14 68 Ill
Total 200 200 50 150 600
From table 3.15, it is seen that the best port in India is JNPT. The secondand third best ports are New Mangalore and Visakhapatanam respectively. The
first two ports were developed recently and the third port was developed before
independence. The fourth best port is Calcutta and Haldia, where Calcutta was
an old port and Haldia is a newly developed port. The fifth, sixth and the seventh
best ports are Mormugao, Kandla, and Paradip respectively. From this study, it is
61
also noted that the worst port is Mumbai, which is the oldest port in India. The
recently developed port— the port of Tuticorin— is in the tenth position. Another
very old port is Cochin, which is very poor in its overall performance and its rank
is in the ninth position. Port of Chennai is another old port, whose position is in
the eighth position. Cochin and Tuticorin are very close to each other; the
competition between them is very high. Hence proper planning and development
schemes must be evolved for success of the port of Cochin and Tuticorin. At the
same time, a satellite port of Chennai called Ennore port started very close to
Chennai port. This will be a major challenge to the existence of Chennai port in
future. The overall performance of Mumbai port is very poor due to theemergence of JNPT very near to Mumbai with all modern technologies and
facilities. Port of Calcutta could survive because of the timely decision ofdevelopment of a new port; Haldia which is more convenient to the customers. It
is seen that slowly the activities of Calcutta will come down and Port of Haldia will
go up. Calcutta and Haldia and Kandla have the advantages of large area of port
hinterland where most of the industries are developed and a good percentage of
agricultural products are produced from here. Hence their position is very safe in
the present condition. From this analysis, we can conclude that the overall
performance of ports developed after independence of India is comparatively
better than the port developed before independence. But the port ofVisakhapatanam is an exceptional case.
3.3.6 Comparison of the performance of Container terminals of Major Ports
Container terminals being the trend in ports today, it was thought proper
to compare these for different major ports of India. There are six major ports in
India that has facilities to handle containers. The following five performance
indicators are considered to compare the overall performance of container
terminals. The weight assigned to each factor is also given in brackets below.
E) Volume of Container cargo handled (1)
F) Capacity of the Terminal (1)
G) Ratio of volume to capacity (2)
H) Availability of Equipment (1), and62
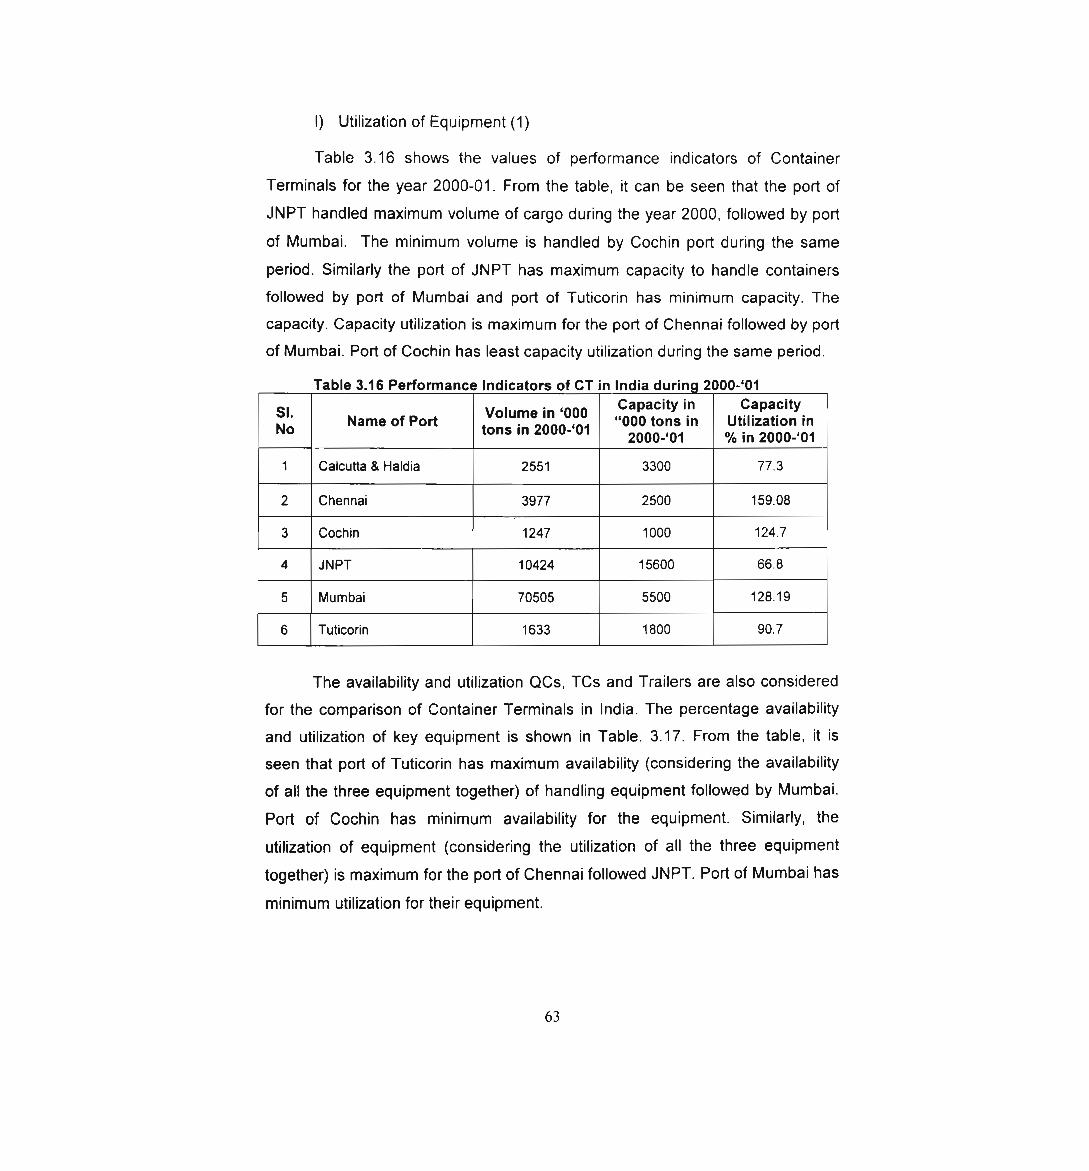
I) Utilization of Equipment (1)
Table 3.16 shows the values of performance indicators of Container
Terminals for the year 2000-01. From the table, it can be seen that the port of
JNPT handled maximum volume of cargo during the year 2000, followed by port
of Mumbai. The minimum volume is handled by Cochin port during the same
period. Similarly the port of JNPT has maximum capacity to handle containers
followed by port of Mumbai and port of Tuticorin has minimum capacity. The
capacity. Capacity utilization is maximum for the port of Chennai followed by port
of Mumbai. Port of Cochin has least capacity utilization during the same period.
Table 3.16 Performance Indicators of CT in India duringy2000-‘O1
3; Name of pan tgg;u;ge2;;;,;,<33,<; ««‘i.?.'3°.‘iff.’s'lI. u.fi;"z':.‘:l‘iI§.’l..2000-‘O1 % In 2000-‘O1
1 Calcutta & Haldia 2551 3300 77.32 Chennai 3977 2500 159.083 Cochin I 1247 1000 124.74 JNPT 10424 15600 66.85 Mumbai 70505 5500 128.196 Tuticorin 1633 1800 90.7
The availability and utilization QCs, TCs and Trailers are also considered
for the comparison of Container Terminals in India. The percentage availability
and utilization of key equipment is shown in Table. 3.17. From the table, it is
seen that port of Tuticorin has maximum availability (considering the availability
of all the three equipment together) of handling equipment followed by Mumbai.
Port of Cochin has minimum availability for the equipment. Similarly, the
utilization of equipment (considering the utilization of all the three equipment
together) is maximum for the port of Chennai followed JNPT. Port of Mumbai has
minimum utilization for their equipment.
63
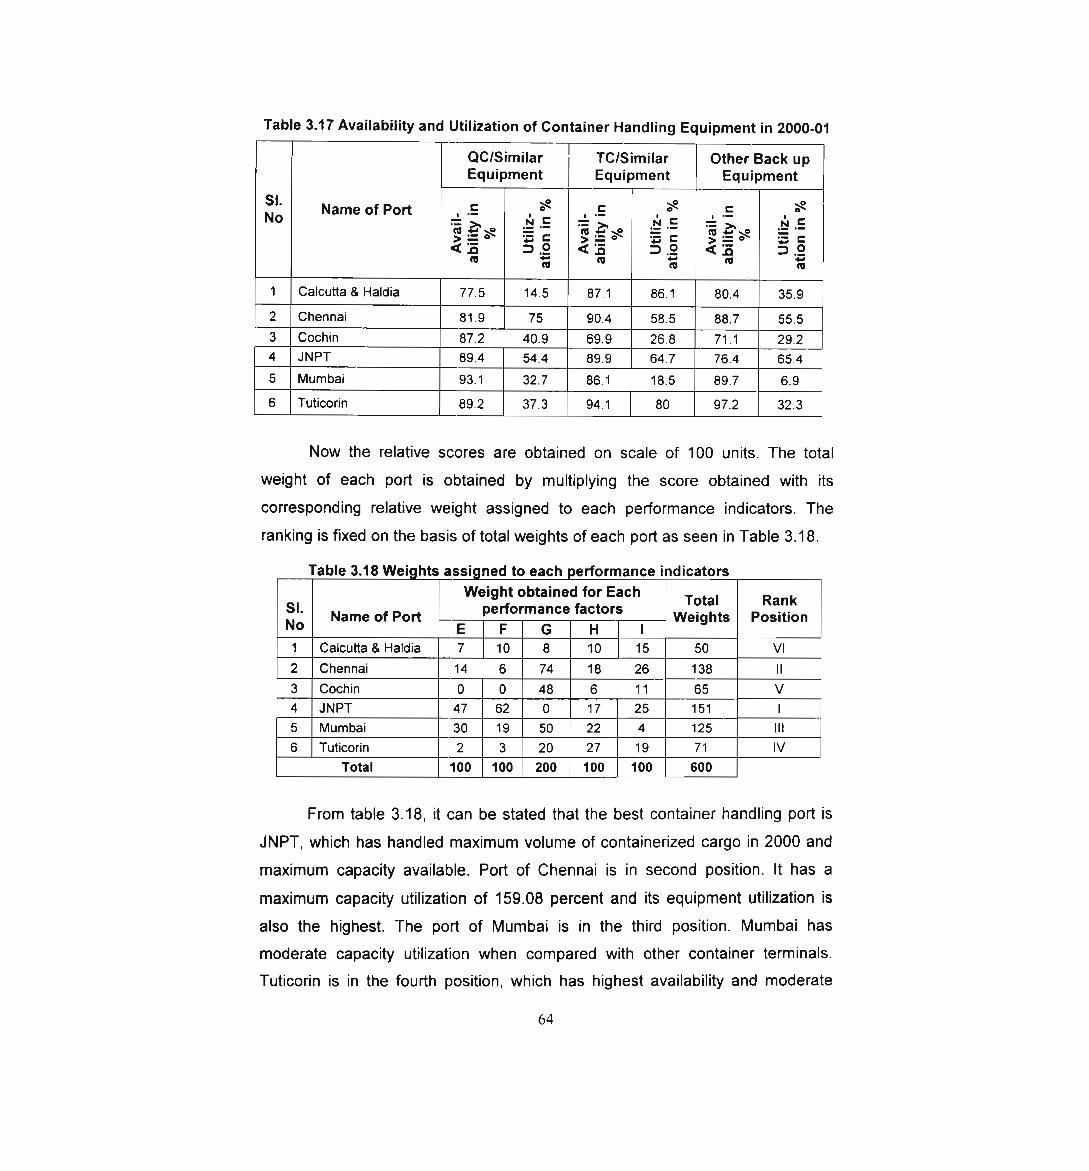
Table 3.17 Availability and Utilization of Container Handling Equipment in 2000-01
QC/Similar TClSimilar Other Back upEquipment Equipment Equipment
3'' Name of Port , E , 3 , E , ‘'\° 5 °\°N0 = 3, N 5 .-: N = :1 >, :1: I:g - g E C to E: :5 ‘ as 2 \° 5 '= M > = u C > — ° and C< .0 D 2 < .0 D 2 < 5 D 9“ '5 ‘° ‘:6 “’ ‘ii’1 Calcutta 8. Haldia 77 5 14 5 87.1 86 1 80 4 35.92 Chennai 81.9 75 90.4 58.5 88.7 55.53 Cochin 87.2 40.9 69.9 26.8 71.1 29.24 JNPT 89.4 54.4 89.9 64.7 76.4 65.45 Mumbai 93.1 32.7 86.1 18.5 89.7 6.96 Tuticorin 89.2 37.3 94.1 80 97.2 32.3
Now the relative scores are obtained on scale of 100 units. The total
weight of each port is obtained by multiplying the score obtained with its
corresponding relative weight assigned to each performance indicators. The
ranking is fixed on the basis of total weights of each port as seen in Table 3.18.
Table 3.18 Weights asiigned to each performance indicators
3.. ""°.1§1‘i‘..?.'i’.‘§'J.2i‘LIi’{o'§2°“ T9*=' Ra.-1*Name of Port Weights PositionN0 E F G H l1 Calcutta 8. Haldia 7 10 8 10 15 50 VI2 Chennai 14 6 74 18 26 138 ll3 Cochin 0 0 48 6 11 65 V4 JNPT 47 62 0 17 25 151 I5 Mumbai 30 19 50 22 4 125 Ill6 Tuticorin 2 3 20 27 19 71 IV
Total 100 100 200 100 100 600
From table 3.18, it can be stated that the best container handling port is
JNPT, which has handled maximum volume of containerized cargo in 2000 and
maximum capacity available. Port of Chennai is in second position. It has a
maximum capacity utilization of 159.08 percent and its equipment utilization is
also the highest. The port of Mumbai is in the third position. Mumbai hasmoderate capacity utilization when compared with other container terminals.
Tuticorin is in the fourth position, which has highest availability and moderate
64
utilization of equipment. Port of Cochin is in the fifth position, which has handled
minimum volume of containerized cargo, minimum capacity available and
minimum availability of handling equipment, but its capacity utilization is
moderate. Calcutta & Haldia is in the last position, whose volume of cargo
handled is not good, considering its capacity and the availability of number of
equipment provided in the Container Terminal. Its capacity utilization and
availability and utilization of equipment are very poor when compared with other
container terminals in India. The volume of containerized cargo handled in JNPT
is very appreciable when considering its limited number of equipment availability.
Since port of Tuticorin and Chennai- are nearby ports of Cochin- have good
equipment, there is high possibility of shifting of containers from Cochin to these
ports. This is a new challenge to the port of Cochin. Same situation is there in the
case of Mumbai port. Hence, immediate steps are necessary to improve the
operational performance of Container terminals of Cochin and Mumbai.
3.3.7 Study of Multi-commodity Handling Flexibility
Most ports in India have facilities to handle multiple commodities. This
capability will also vary from port to port. In this section, we discuss the flexibility
of different ports to handle various types of cargos. The trends in handling
different types of cargo also studied and are discussed in the following sections.
3.3.7.1 Volume of Overseas versus Coastal Cargo
Analysis based on the volume of overseas cargo and coastal cargo wasdone to understand the trend of overseas and coastal movement from each port.
The trend and the volume of cargo handled in 1999-‘O0 are shown in Table 3.19.
From the table it is seen that there is a wide gap between the volume of overseas
and coastal cargo handled in the year 1999 for all ports. The trend shows that the
volume of overseas cargo has increased from 1991 for all ports. But some
fluctuations in volume of both overseas and costal cargo are also to be seen. The
same trend was seen in the case of coastal cargo also except the port ofMumbai. In the case of Port of Mumbai, volume of coastal cargo has reduced
steeply from 117.41 MMT in 1991 to 89.8 MMT in 1999. From the table, it is also65
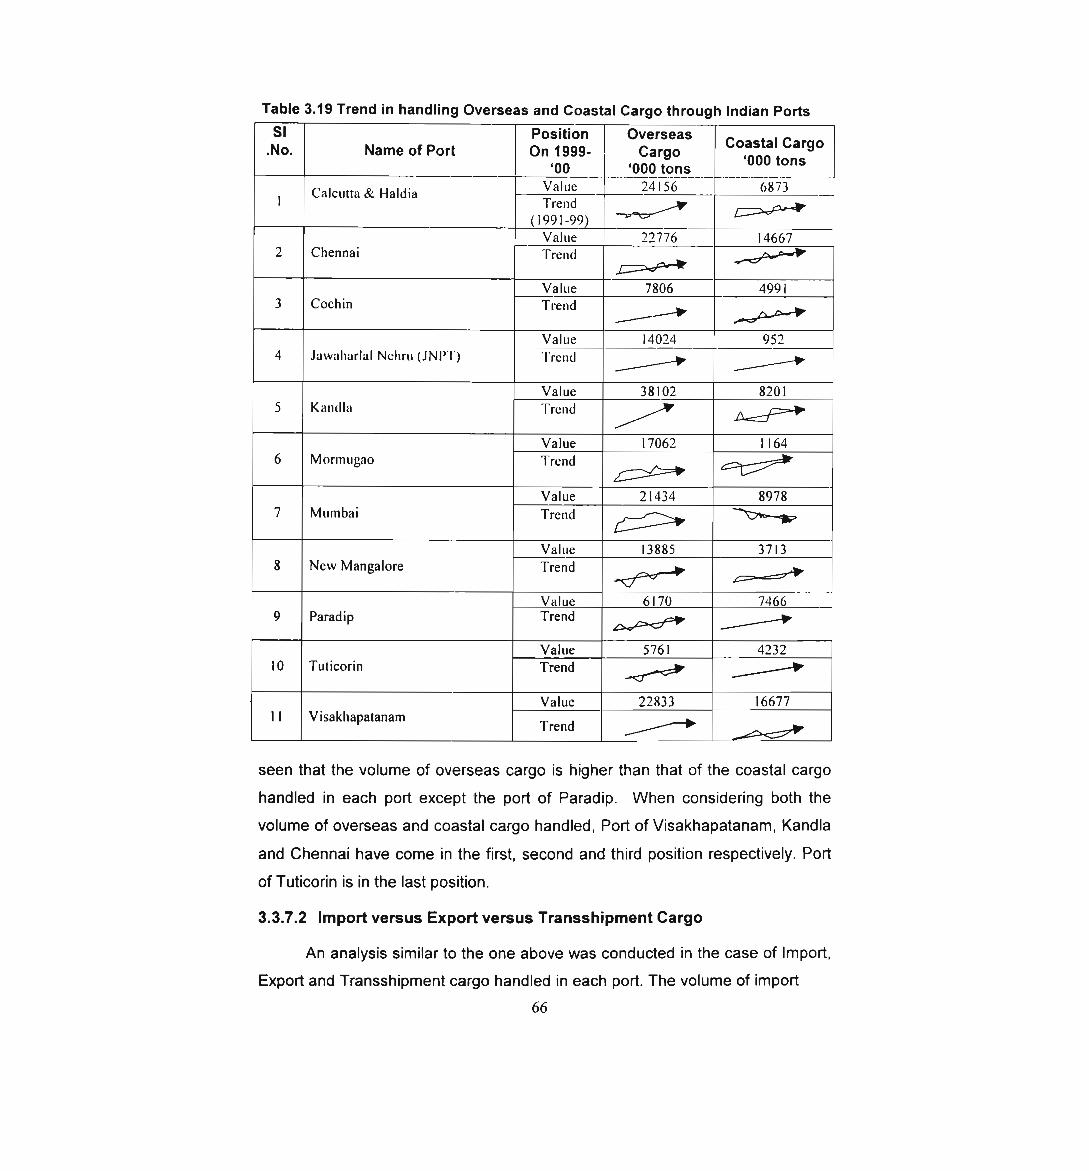
Table 3.19 Trend in handling Overseas and Coastal Cargo through Indian PortsS! - .No. Name of Port 33‘1'3'§’$'. °E‘Z.'.Z°§" °°a=*a' °='9°‘co ‘ooo tons '°°° ‘°"‘
I Calcutta & Haldia fig 6873(1991-99) “’ :Value 22776 146672 Chennai Trend #_%.;>-JWValue 7806 49913 Cochin Trend /22’ #60)»
Value 14024 9524 Jawahurlal Nehru (JNl"l‘) Trend gr J
Value 38102 82015 Kandla Trend /7 Ag)Value 17062 1 1646 Mormugao Trend $67»?Value 21434 39787 Mumbai Trend 9 WValue 13885 3713
8 New Mangalore Trend ff’ 9.4%?Value 6170 74669 Paradip Trend A2697 grValue 5761 4232
10 Tuticorin Trend __q’& /Z/V_ Value 22833 16677
1 1 Vlsakhapatanam Trend {_>seen that the volume of overseas cargo is higher than that of the coastal cargo
handled in each port except the port of Paradip. When considering both the
volume of overseas and coastal cargo handled, Port of Visakhapatanam, Kandla
and Chennai have come in the first, second and third position respectively. Port
of Tuticorin is in the last position.
3.3.7.2 Import versus Export versus Transshipment Cargo
An analysis similar to the one above was conducted in the case of Import,
Export and Transshipment cargo handled in each port. The volume of import66
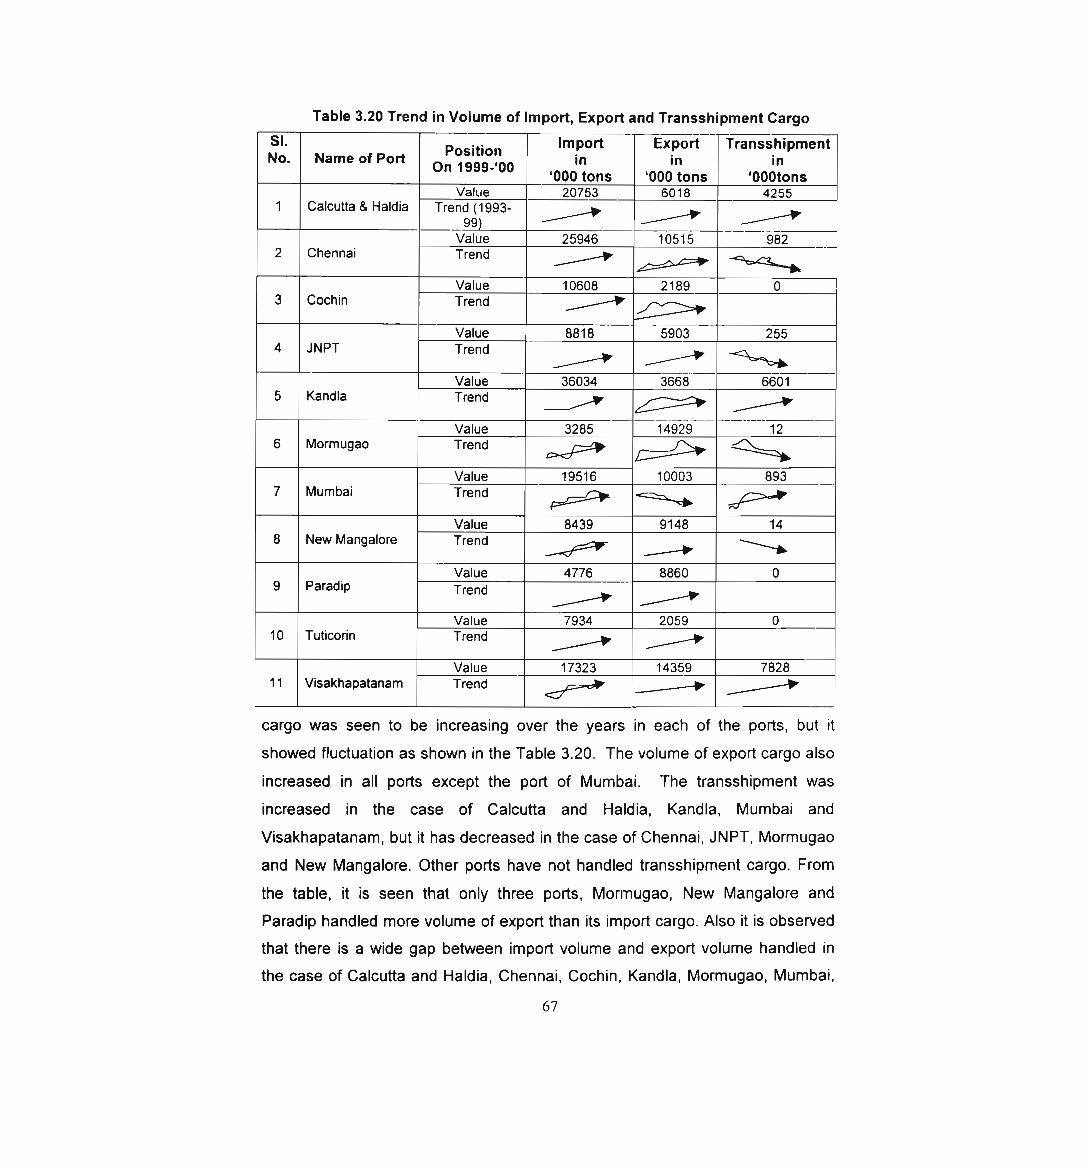
Table 3.20 Trend in Volume of Import, Export and Transshipment Cargo
SI. . . Import Export TransshipmentNo. Name of Port 0:‘:‘°E','S‘,'9"_{‘0o in in in‘000 tons ‘000 tons ‘O00tonsValue 20753 6018 42551 Calcutta 8. Haldia Trend (199399) {V {V {/7Value 25946 10515 9822 Chennai Trend {V fig, Value 10608 2189 03 Cochin Trend (V P’Value 8818 5903 2554 JNPT Trend
Value 36034 3668 66015 Kandla Trend J 4 {VValue 3285 14929 126 Mormugao Trend 96;) 7 >, %
Value 19516 10003 8937 Mumbai Trend my Tb £7; ‘ 'Value 8439 9148 148 New Mangalore Trend 2% ..,—> ‘L9 Value 4776 8860 0Paradip Trend / /'Value 7934 2059 010 Tuticorin Trend / {p
Value 17323 14359 782811 Visakhapatanam Trend [av ____,,,.—> {/7
cargo was seen to be increasing over the years in each of the ports, but itshowed fluctuation as shown in the Table 3.20. The volume of export cargo also
increased in all ports except the port of Mumbai.increased in the case of Calcutta and Haldia, Kandla, MumbaiVisakhapatanam, but it has decreased in the case of Chennai, JNPT, Mormugao
and New Mangalore. Other ports have not handled transshipment cargo. From
the table, it is seen that only three ports, Mormugao, New Mangalore and
Paradip handled more volume of export than its import cargo. Also it is observed
that there is a wide gap between import volume and export volume handled in
the case of Calcutta and Haldia, Chennai, Cochin, Kandla, Mormugao, Mumbai,
67
The transshipment wasand
Paradip, and Tuticorin. This is not good to the ports because the vessels will be
empty either in the forward or return trip. There must be a balance between
export and import volume for better earnings to the port. When considering the
combined effect of import, export and transshipment volume of cargo together,
Port of Visakhapatanam, Chennai and Kandla came in the first, second and the
third position. Port of Paradip is in the last position.
3.3.7.3 Break Bulk versus Conventional Dry Bulk versus Liquid Bulk
Versus Mechanical Dry Bulk versus Container Cargo
A similar analysis has been done in the case of Break Bulk, Conventional
dry bulk, Mechanical dry bulk and Container cargo handled in each port. The
result is shown in Table 3.21. Break bulk cargo has increased in all ports except
in the port of Chennai and Visakhapatanam. The increase in volume is fluctuating
in most of the cases. The conventional break bulk cargo has also increased in all
ports except in the port of Mumbai. In this case, the volume has increased
steadily in most of the ports. The volume of containerized cargo movement has
increased gradually in all ports. The movement of containerized cargo isnegligible or absolutely nil from the port of Mormugao, Visakhapatanam, New
Mangalore and Paradip. Volume of liquid bulk has increased in all ports except in
the case of Mumbai port. Similarly the volume of mechanical dry bulk has also
showed increasing tendency in all ports except from the port of Cochin and New
Mangalore. Kandla and Mumbai have not handled the mechanical dry bulk cargo
during this period. Mormugao has showed almost constant volume movement of
cargo over the period. When considering all the different varieties of cargomovement, Calcutta and Haldia, Chennai, and Visakhapatanam are in a position
of strength, followed by Mumbai and Kandla. Paradip and then Cochin have
handled the least volume. Here again the old ports in India have handledmaximum volume of the important cargo.
68
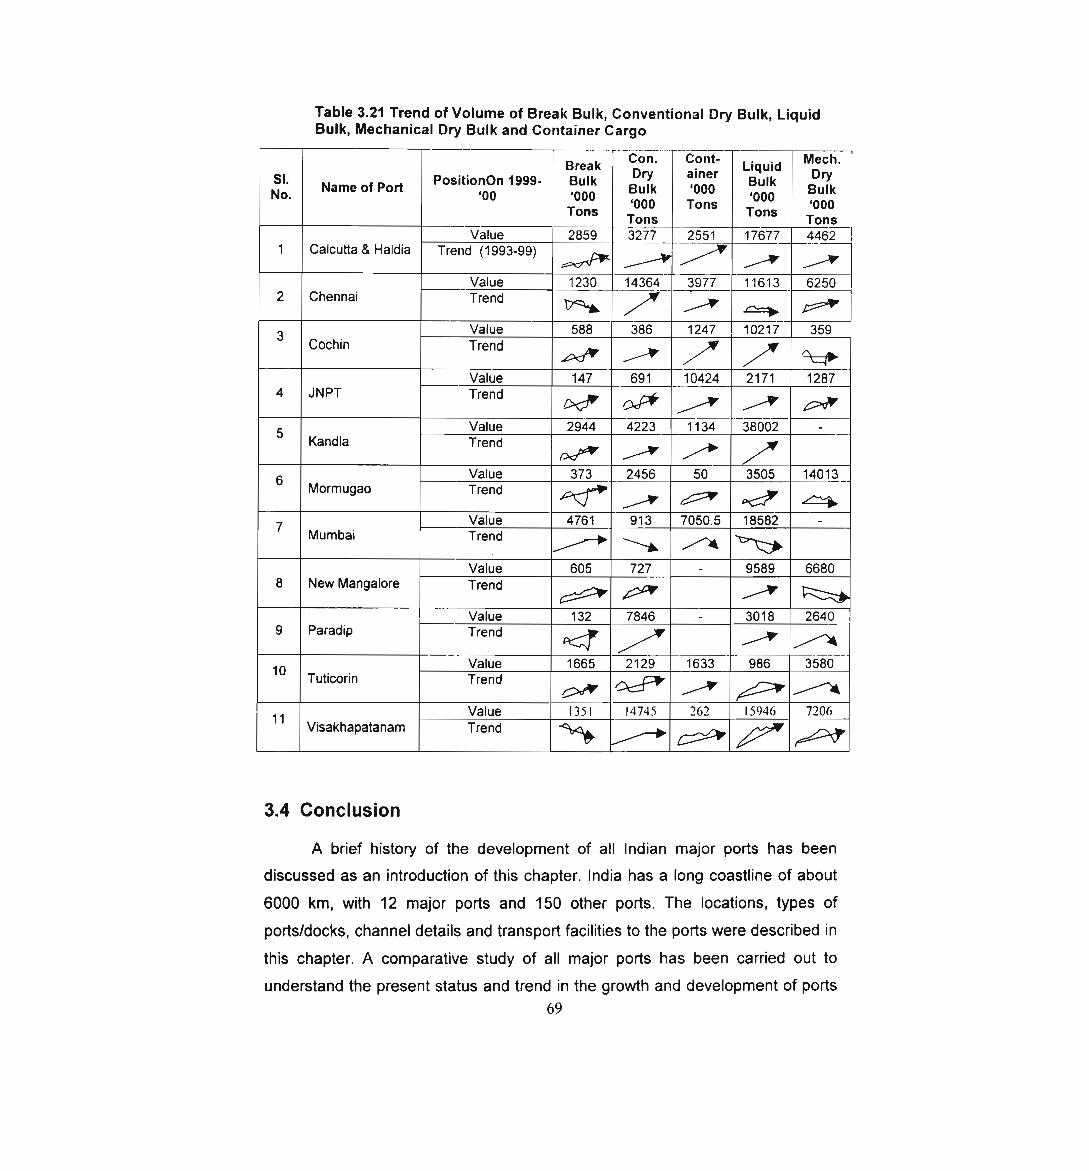
Table 3.21 Trend of Volume of Break Bulk, Conventional Dry Bulk, LiquidBulk, Mechanical Dry Bulk and Container Cargo
. _ Break °D°r';' Liquid MI§r°y"'SI. Name of Port Positionon 1999- Bulk Bulk .000 Bulk BulkN°' W 3:21‘; 'ooo Tons .}%‘:“; ‘oooTons Tons
Value 2859 3277 2551 17677 44621 Calcutta&Haldia Trend (1993-99)
Value 1230 14364 3977 11613 62502 Ch ' T d 'ennai ren pg‘ / Z7 21’ ;'Value 588 386 1247 10217 359
3 Cochin Trend 7 /V /Value 147 691 10424 2171 12874 JNPT Trend 96;‘Value 2944 4223 1134 38002
5 Kandla Trend ad?’ 2' /> /6 Value 373 2456 50 3505 14013Mormu ao T d9 ren pv-V / 6 DJ 17 Value 4761 913 7050 5 18582 M b‘ Tum an rend 2% X‘ /‘ W
Value 605 727 - 9589 66808 New Mangalore Trend 6 § ' 2' 3Value 132 7846 - 3018 26409 Paradip Trend ‘d /V / /x10 Value 1665 2129 1633 986 3580Tuticorin T dren W w / % fl11 Value 135! M745 2622 I5946 7206
Visakhapatanam Trend 4&9 /—> yr f’ gy
3.4 Conclusion
A brief history of the development of all Indian major ports has beendiscussed as an introduction of this chapter. India has a long coastline of about
6000 km, with 12 major ports and 150 other ports. The locations, types of
ports/docks, channel details and transport facilities to the ports were described in
this chapter. A comparative study of all major ports has been carried out to
understand the present status and trend in the growth and development of ports69
in India. The comparison between all major ports were done by making use of
many variables related to port operations such as operational performanceindicators, financial performance indicators, physical facilities available, and
manpower available and its utilization. Weighted score method was used to rank
major ports. The trend in growth and development of major ports over the last 10
years from 1991 to 2000 was also presented.
The main operational performance indicators considered in this study
were the average turn around time of ships, average pre-berthing time, average
idle time of berths in ports, average output per ship—berth day, percentage
utilization of ports, berth occupancy and volume of cargo handled in ports. Ports
of New Mangalore and Visakhapatanam have shown best operationalperformance indicators followed by JNPT and then Mormugao. The majorfinancial performance indicators such as operating income, operating surplus.
operating ratio and ratio of net capital employed to net surplus were taken to
compare the major ports in India. From the study, it was seen that the port of
Calcutta and Haldia had best financial performance. The port of JNPT and
Chennai were in second and third positions respectively.
The physical facilities available in ports were classified into four groups a)
berthing facilities, b) storage facilities, c) cargo handling facilities and d) capacity
available to handle major commodities of each port. The channel depth, channel
width, and number of berths available in ports were considered to compare the
berthing facilities. The area of transit shed, area of warehouses and open area
available in each port were used to compare the storage facilities. Number of
wharf cranes, number of mobile cranes and all other back—up equipment were
taken to compare the cargo handling facilities of all ports. The capacity available
to handle the major commodities such as container cargo, POL, fertilizers and
iron ore were considered to compare the availability of capacity of each port.
From this study, it was seen that the best physical facilities are available in port
of Mumbai followed by Calcutta & Haldia and JNPT.
In a comparative analysis of manpower and productivity of manpower,
three factors were considered, which were number of employees, operating
70
income per man and volume of cargo handled per man. Comparison based on
the manpower available in all ports as on 315‘ December 2001 showed that the
port of JNPT has minimum manpower performance, followed by New Mangalore
and then Tuticorin. It was seen that the staff strength of all old ports was very
high when compared with new ports. All ports have taken steps to reduce the
staff strength due to new policy of Govt. of India. A class wise analysis of staff
strength was also done. From the analysis, it is seen that the organizationstructure has to be changed for the efficient and effective utilization of the
available manpower in ports. From the comparative study of manpower and their
productivity, it was seen that the port of JNPT has best manpower productivity
followed by New Mangalore and then Kandla.
Finally, all the above four performance indicators were consolidated for all
major ports to know the present status. The analysis showed that the port JNPT
is the best port in India among the eleven major ports. The port of NewMangalore is the second best and Visakhapatanam is the third best port in India.
One of the oldest ports, Mumbai is in the last position. Similarly, the six Container
Terminals were also compared using five important performance parameters,
namely volume of cargo handled, capacity available, capacity utilization of the
terminal, availability and utilization of container handling equipment during the
year 2000-'01. This study showed that the JNPT was the best container terminalin India. Port of Chennai was the second best and Port of Mumbai came in third
position. Among the six Container Terminals, RGCT associated with port of
Cochin is in the fifth position. Port of Calcutta & Haldia was the last rankingcontainer terminal in India.
When comparing the multi commodity handling flexibility of Indian Ports, it
was seen that the old ports have better flexibility in handling multi-commodities
like break bulk, conventional dry bulk, container, liquid bulk and mechanical dry
bulk, import cargo, export cargo and transshipment cargo etc. The total volume
of all types cargo have showed an increasing tendency from 1991, but there is
fluctuation in volume over the years and from port to port. The trend also showed
that the rate of increase of containerized cargo and liquid bulk cargo is more than
that of other types of cargo. Hence, the newly developed ports like JNPT and71
Tuticorin have more flexibility in handling containerized cargo than other cargo.
The ports of Cochin and Chennai have planned to provide more facilities to
handle liquid bulk and containerized cargo than to handle other type of cargo. As
a result, Port of Cochin has developed the Cochin Oil Terminal (COT) to handle
the liquid bulk cargo, and RGCT for handling containers; Chennai has increased
their liquid bulk handling facilities and commissioned a new Container Terminal
very recently.
The next chapter discusses the implementation of the five—year plans in
India after independence with reference to port planning and development and
tries to highlight the problems that occurred in the port sector while implementing
the five—year plans.
***