(A comparative study of Agriculture Development Bank ...
89
Investment Policy of Commercial Banks in Nepal (A comparative study of Agriculture Development Bank, Nepal Bangladesh Bank Ltd. & Himalayan Bank Ltd.) By: Sanjay Kumar Shrestha Shanker Dev Campus Campus Roll No: - 1197/060 T.U. Regd. No: - 7-3-39-531-2003 First Year Symbol No: 8399/2062 A Thesis Submitted to: Office of the Dean Faculty of Management Tribhuvan University In the partial fulfillment of the requirements for the degree of Masters of Business Studies (MBS) Kathmandu, Nepal April, 2010
Transcript of (A comparative study of Agriculture Development Bank ...

Investment Policy of
Commercial Banks in Nepal
(A comparative study of Agriculture Development Bank,
Nepal Bangladesh Bank Ltd. & Himalayan Bank Ltd.)
By:
Sanjay Kumar Shrestha
Shanker Dev Campus
Campus Roll No: - 1197/060
T.U. Regd. No: - 7-3-39-531-2003
First Year Symbol No: 8399/2062
A Thesis Submitted to:
Office of the Dean
Faculty of Management
Tribhuvan University
In the partial fulfillment of the requirements for the degree of
Masters of Business Studies (MBS)
Kathmandu, Nepal
April, 2010

RECOMMENDATION
This is to certify that the thesis submitted by Mr. Sanjay Kumar Shrestha entitled
“Investment policy of Commercial Banks in Nepal (A comparative
study of Agriculture Development Bank, Nepal Bangladesh Bank Ltd.
& Himalayan Bank Ltd.)” has been prepared as approved in the prescribed format
of the Faculty of Management. This thesis is forwarded to Examination Committee for its
evaluation and acceptance.
Date: ………………………..
……………………. Prof. Dr. Kamal Das
Manandhar
Supervisor
……………………… Prof. Bisheshwor Man
Shrestha
Head, Research Department
…………………… Prof. Dr. Kamal Deep
Dhakal
Campus Chief
……………………. Kiran Thapa Supervisor

VIVA- VOCE SHEET
We have conducted the viva-voce examination of the thesis presented by Mr. Sanjay
Kumar Shrestha entitled “Investment policy of Commercial Banks in Nepal
(A comparative study of Agriculture Development Bank, Nepal
Bangladesh Bank Ltd. & Himalayan Bank Ltd.)” and found to be the original
work of the student and written according to the prescribed format. We recommend the
thesis to be accepted, evaluated and approved by the Viva-Voce Committee as a partial
fulfillment of the requirements for the Master’s Degree in Business Studies (MBS).
Viva- Voce Committee:
Member (Thesis Supervisor): ………………………………………
Member (Thesis Supervisor): ………………………………………
Chairperson (Research Committee): ……………………………………..
Member (External Expert): …………………………………………
Date:…………………..

TRIBHUVAN UNIVERSITY
Faculty of Management
Shanker Dev Campus
DECLARATION
I hereby declare that the work reported in thesis entitled “Investment policy of
Commercial Banks in Nepal (A comparative study of Agriculture
Development Bank, Nepal Bangladesh Bank Ltd. & Himalayan Bank
Ltd.)” submitted to Office of the Dean, Faculty of Management, Tribhuvan University,
is my original work done in the form of partial fulfillment of requirement for the Master’s
Degree in Business Study (M.B.S.) under the supervision of Prof. Dr. Kamal Das
Manandhar and Mr. Kiran Thapa of Shanker Dev Campus.
…………………………………………
Sanjay Kumar Shrestha
Researcher
T.U. Regd. No.: 7-3-39-531-2003
Campus Roll No. : 1197/060

ACKNOWLEDGEMENT
I would like to thank my thesis supervisors Prof. Dr. Kamal Das Manandhar and Mr.
Kiran Thapa for his constant guidance and encouraging advice. It is with his timely
feedback and support that I have been able to bring this thesis to its final form.
I owe a great deal to the staffs of library of Shanker Dev Campus, the staffs of
Agriculture Development Bank, Central office Kathmandu, the staffs of Nepal
Bangaladesh Bank of Bijulibazar Kathmandu and the staffs of Himalayan Bank of
Thamel Kathmandu for bearing with me during the period of my data collection.
I am thankful to those individuals and institutions whose work I shared as a reference to
prepare this thesis.
Finally I would like to offer my profound gratitude to my friends, Ratish Raj Guragain,
Santosh Lamichhane and Indra Bahadur Raut for their kind advice, Support and
motivation to finish this thesis.
Sanjay Kumar Shrestha
Researcher
T.U. Regd. No.: 7-3-39-531-2003
Campus Roll No. : 1197/060

TABLE OF CONTENTS
RECOMMENDATION
VIVA- VOCE SHEET
DECLARATION
ACKNOWLEDGEMENT
TABLE OF CONTENTS
LIST OF TABLES
LIST OF FIGURES
ABBREVIATIONS
INTRODUCTION ..................................................................................................................... 1
1.1. Historical background of banking in Nepal ........................................................... 1
1.2. Profile of concerned banks....................................................................................... 3
1.2.1. Agriculture Development Bank Ltd. (ADBN) .................................................... 3
1.2.2. Nepal Bangladesh Bank Limited (NBBL) .......................................................... 5
1.2.3. Himalayan Bank Ltd. (HBL) ............................................................................... 7
1.3. Focus of the study ..................................................................................................... 8
1.4. Statement of the problem ......................................................................................... 8
1.5. Objectives of this study ............................................................................................ 9
1.6. Importance of the study ........................................................................................... 9
1.7. Limitation of the study ............................................................................................. 9
1.8. Chapter plan ........................................................................................................... 10
REVIEW OF LITRETURE .................................................................................................... 12
2.1 Concept .................................................................................................................... 12
2.2 Characteristics of good investment policy: .......................................................... 14
2.3 Review of books ...................................................................................................... 15
2.4 Review of articles .................................................................................................... 16
2.5 Review of theses ...................................................................................................... 20
2.6 Review of legislative provisions ............................................................................. 21
2.6.1 Functions of banks: ................................................................................................ 22
2.6.2 Other provisions regarding investment of banks.................................................... 22
2.6.3 NRB Directives regarding investment ................................................................... 24
RESEARCH METHODOLOGY ............................................................................................ 26

3.1 Introduction ............................................................................................................ 26
3.2 Research design: ..................................................................................................... 26
3.3 Sources of data: ....................................................................................................... 26
3.4 Population and sample: .......................................................................................... 27
3.5 Analysis of data: ..................................................................................................... 28
3.5.1 Financial Tools: ...................................................................................................... 28
3.5.2 Statistical tools ....................................................................................................... 35
PRESENTATION & ANALYSIS OF DATA ........................................................................ 37
4.1 Financial tools ......................................................................................................... 37
4.1.1 Ratio Analysis ................................................................................................... 37
4.2 Statistical analysis ................................................................................................... 47
4.2.1 Trend analysis ........................................................................................................ 47
4.2.2 Test of Hypotheses ................................................................................................. 52
4.3 Major findings of the study ................................................................................... 53
SUMMARY, CONCLUSION & RECOMMENDATION ..................................................... 57
5.1 Summary ................................................................................................................. 57
5.2 Conclusion ............................................................................................................... 59
5.3 Recommendation .................................................................................................... 60
BIBLIOGRAPHY ................................................................................................................... 62
APPENDICES ......................................................................................................................... 64
Appendix A: Calculation of Financial Ratios ................................................................. 64
Appendix B: Calculation of Trend Values ...................................................................... 74
Appendix C: Testing of Hypotheses ................................................................................ 77

LIST OF TABLES
Table No. Particulars Page No.
1.1: No. of Licensed Financial Institutions in Nepal 2
3.1: A-Class Licensed Financial Institutions in Nepal 27
4.1: Current Ratio 37
4.2: Cash and Bank Balance to Total Deposit Ratio 38
4.3: Cash and Bank Balance to Current Assets Ratio 38
4.4: Investment on Government Securities to Current Assets Ratio 39
4.5: Loan and Advance to Total Deposit Ratio 39
4.6: Total Investment to Total Deposit Ratio 40
4.7: Loans and Advances to Working Fund Ratio 40
4.8: Investment on Govt. Securities to Total Working Fund Ratio 41
4.9: Investment on Govt. Securities to Total Domestic Deposit Ratio 41
4.10: Investment on Shares and Debenture to Total Working Fund Ratio 42
4.11: Provision for Loan Loss Ratio 42
4.12: Return on Loan and Advance Ratio 43
4.13: Return on Total Working Fund Ratio 43
4.14: Return on Equity 44
4.15: Total Interest Earned to Total Outside Assets Ratio 44
4.16: Total Interest Earned to Total Working Fund Ratio 45
4.17: Total Interest Earned to Total Operating Income Ratio 45
4.18: Credit Risk Ratio 46
4.19: Interest Risk Ratio 46
4.20: Trend of Total Deposit 47
4.21: Trend of Loan and Advance 48
4.22: Trend of Total Investment 49
4.23: Trend of Total Profit 50
4.24: ANOVA Table of Loan and Advances to Total Deposit Ratio 52
4.25: ANOVA table of Return on loans and Advances Ratio 52
4.26: ANOVA table of Total interest earned to total outside asset Ratio 53

LIST OF FIGURES
Figure No. Particulars Page No.
4.1: Trend Value of Total Deposit of NBBL, HBL and ADBN 48
4.2: Trend Value of Loan and Advances of NBBL, HBL and ADBN 49
4.3: Trend Value of Total Investment of NBBL, HBL and ADBN 50
4.3: Trend Value of Net Profit of NBBL, HBL and ADBN 51

ABBREVIATIONS
ABBS = Any Branch Banking Service
ADBN = Agriculture Development Bank Nepal
ATM = Automated Teller Machine
B.S. = Bikram Sambat
BAFIA = Banks and Financial Institutions Act
CB = Commercial Bank
CV = Coefficient of Variation
FY = Fiscal Year
GDP = Gross Domestic Product
GoN = Government of Nepal
Govt. = Government
HBL = Himalayan Bank Limited
JVBs = Joint Venture Banks
NBL = Nepal Bank Ltd.
NBBL = Nepal Bangladesh Bank Ltd.
NGO = Non Government Organizations
NIDC = Nepal Industrial Development Corporation
No. = Number
NRB = Nepal Rastra Bank
RBB = Rastra Banijya Bank
ROE = Return on Equity
Rs. = Nepalese Rupees
SD = Standard Deviation
T.U. = Tribhuvan University
US = United States

1
CHAPTER I
INTRODUCTION
1.1. Historical background of banking in Nepal
Nepal is ranked one of the poorest countries in the world which has yearly per capita income
GDP of US $ 470 and GDP growth rate of 5.6 percent & population growth rate 2.27 percent.
As per the World Development Indicators Database of World Bank, on the basis of GDP,
Nepal is at the 113th position (US Dollars 12,615 Million). However on the basis of GNI per
capita, Nepal is ranked at 195th on Atlas Method (US Dollars 400 per capita) and 193th on
Purchasing Power Parity Method (International Dollars 1120 per capita).
The development of country is always measured by its economic indices. Nepalese economy
is distinctly different in its character from the regional economies. The Nepalese Economy is
characterized by poverty, less developed geographical situation, technological backwardness,
land-locked and dominated by two large economies India and China, etc. Most of the
population of the country live in rural areas, where there is no access of banking facilities.
From the beginning of the 1970 A.D. some programs were introduced focused to poverty
alleviation but did not achieve significant result in that purpose. Still 38 percent population is
under poverty line & targeted 32 percent by the end of the 10th plan.
Nepal is one of the agro-based economy countries. In order to develop country rapidly the
industrial sector must be developed. Hence investment on both agriculture & industrial sector
is needed. To make investment, savings must be collected from the different masses. For this
purpose various banks & financial institutions are established on different sector like
commercial, industrial, and development etc. on both urban and remote areas. They collect
deposits from different sectors and make huge amount, then invest in various sectors.
The established financial system in Nepal has more history than other countries of the world.
In Nepal, the introduction of modern banking activities and system had been traced back to
the year 1937 when the Nepal Bank Act 1937 was first promulgated, during the period of
Rana Prime Minister Juddha Samsher. A Govt. institution called ‘Tejarath Adda,’ at the
period of Ranodip singh who is called the father of modern banking, was established. The

2
Tejarath Adda helped the public by provided credit at 5 percent interest rate on the security
of gold and silver ornaments and mobilized the resources.
At the developing process of financial institution to help the growing economic activities the
need of Banking has been increasingly realized and established a system. In 1994 B.S. the
first bank of Nepal, Nepal bank limited was established as the central bank of Nepal except
the work of issue of note. Similarly Nepal Rastra Bank was established as a central bank of
Nepal in 2013 B.S. to regulate the banking management system of country. The second
commercial bank is Rastriya Banijya Bank established in 2022 B.S. in full ownership of the
Government of Nepal. Co-operative Bank (later renamed as Agriculture Development Bank)
was established in 2024 B.S. for providing capital & technical assistance for the development
of agriculture sector in Nepal. The Government of Nepal kept on liberalizing the economical
policies; as a result various banks were established in public and private sector in joint
venture of capital & support for the economic development of country.
After the liberalization of financial sector in mid eighties by the Government of Nepal, the
number of private sector in collaboration with foreign partners invested in CBs. After the
implementation of the liberal economic policy, foreign and private internal investment has
increased and currently many banks have come into existence one after another. As a result,
many CBs were established. As per latest data of NRB, the number of licensed financial
institutions operating as at end of Ashad 2066 (Mid July 2009) are as follows.
Table 1.1: No. of Licensed Financial institutions in Nepal
Commercial Banks (CB) 26
Development Banks 63
Finance Companies 77
Micro-credit Development Banks 15
Saving & Credit Co-operatives Limited (Banking Activities)
16
NGOs (Financial Intermediaries) 45
Total 242
For the purpose of this study, the following three banks are taken into consideration.
1) Agriculture Development Bank Ltd. (ADBN)
2) Nepal Bangladesh Bank Ltd. (NBBL)
3) Himalayan Bank Ltd. (HBL)

3
1.2. Profile of concerned banks
In this chapter it has been discussed about the profiles of concerned banks. These profiles are
related to the establishment, objectives, development, capital structure, investment policy &
sector and the facilities granted by the concerned banks.
1.2.1. Agriculture Development Bank Ltd. (ADBN)
� Establishment
Agriculture Development Bank, Nepal (ADBN) was established in 1968 under Agricultural
Development Bank Act 1967 with the main objective of providing institutional credit for
enhancing the production and productivity of the agricultural sector in the country. The bank
inherited the assets and liabilities of the Co-operative Bank, which was previously
established in 1963. In 1973 the Land Reform Savings Corporation, a similar institution
established in 1966, was merged with the bank.
Agricultural Development Bank (ADBN) Act is an autonomous organization under the
supervision of the Ministry of Finance of Government of Nepal, and the bank has been
working as the premier rural credit institution since last three decades contributing
substantially in meeting institutional credit needs in Nepal. AT present ADBN has been
operating 86 banking offices in Nepal.
The enactment of Bank and Financial Institution Act (BAFIA) 2063 abolished all Acts
related to financial institutions including the ADBN Act, 1967. In line with the BAFIA,
ADBN has been incorporated as a public limited company on July 14, 2005. Thus, ADBN
operates as "A" category financial Institution under the legal framework of BAFIA 2063 and
the Company Act, 2063.
� Objective
Under the ADBN Act, the bank is entrusted with the responsibilities of initiating effective
approaches for the development of agriculture. The bank is committed to raise the economic
condition of farmers by availing credit and capital inputs in easy and smooth manner.
The subsequent amendments of the act empowered the bank to finance small farmers on
group liability and expand its scope of financing to promote cottage industries. The
4
amendments of BAFIA also permitted the bank to engage in Banking activities for the
mobilization of domestic resources.
The objective of the banks has been defined as
• To provide quality banking and financial services to clients adopting market driven
strategy delivering sustained and competitive return on investment.
� Functions
The main functions of the bank are to
• Provide short, medium and long term agricultural loans to individual farmers, group
of farmers, corporate bodies and village committees.
• Provide loans and technical services for the purchase of inputs and capital items such
as fertilizers, insecticides, feed, farm machinery, irrigation equipment, canal
construction, boring of pump-sets and sprinklers.
• Provide loans for the purchase of livestock.
• Finance for cottage small-scale industries.
• Finance for cold store, warehousing and other marketing facilities.
• Finance for the capital goods necessary for the development of alternative sources of
energy.
• Supervise small farmers Development programme to uplift the socio-economic status
of small farmers.
• Undertake banking function to generate resources.
• Provide training to the beneficiaries and the bank staff.
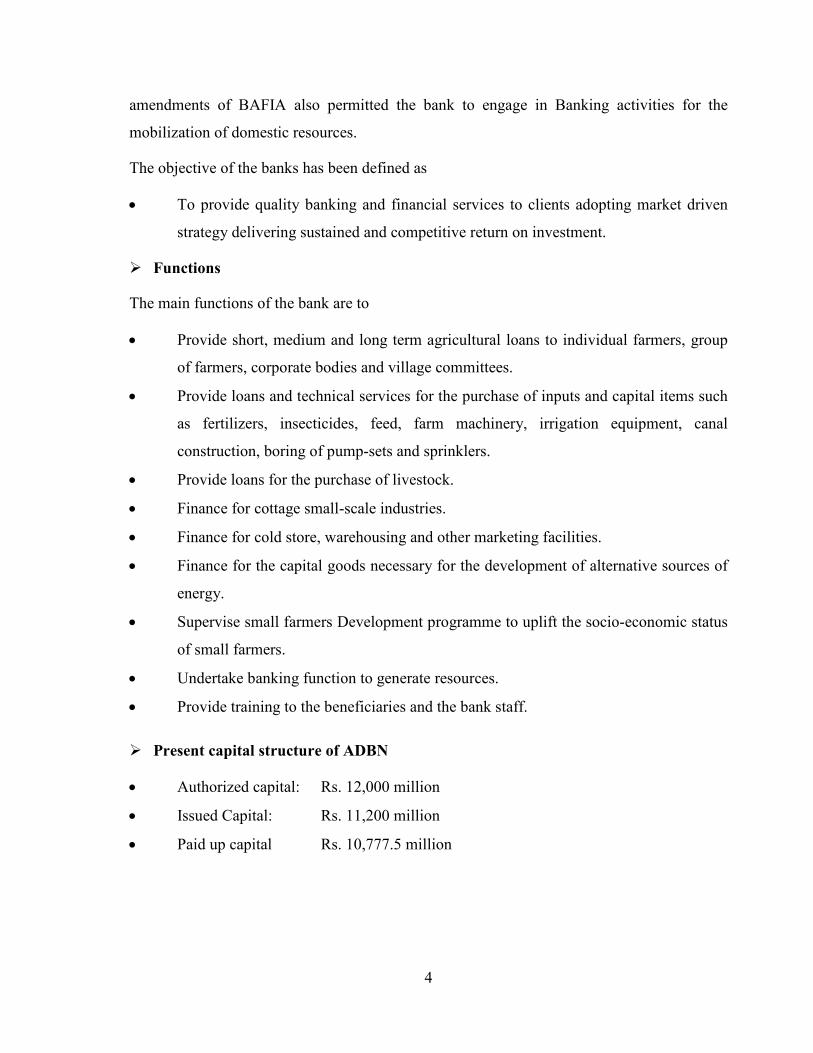
� Present capital structure of ADBN
• Authorized capital: Rs. 12,000 million
• Issued Capital: Rs. 11,200 million
• Paid up capital Rs. 10,777.5 million

5
� Facilities granted by ADBN
ADBN facilitate providing loan for various sector as term of time and also services of
banking activities:
• Food crops loan for 12 months more.
• Cash crops loan for 18 months more
• Special crops loan for 24 months more
• Marketing of agro-material & agricultural products loan for 12 months more
• Agricultural machinery loan for 3 to 4 years
• Irrigation loan for 5 years
• Biogas loan for 3 to 5 years
• Purchase of tenant land, residence& land develop loan for 2 to 10 years
• Agriculture & small- scale cottage industry loan for 1 to 5 years
• Cold storage & warehousing loan for up to 10 years
• Live stock loan for 2 to 5 years
• Non-agricultural loan for up to 2 years
In order to generate its resources for the bank’s ever expanding lending programme, the bank
started banking activities since 1984.Now-a-days ADB also provide following facilities for
banking services:
• Accept deposit from different accounts like: saving; current & fixed deposit
• Provide guarantee for safe & give interest as banking policy
• Tele-banking facilities like faxing system and other banking facilities.
• Remittance services
1.2.2. Nepal Bangladesh Bank Limited (NBBL)
� Establishment, Objective &Function
Nepal Bangladesh Bank Limited (NBBL), a joint venture bank with I.F.I.C. Bank Ltd .of
Bangladesh, was established 1993 under the Company Act, 1964.The main objective of the
bank is to carry out Banking activities under the Bank Act, 1974.

6
At present I.F.I.C and Bank Asia Ltd. hold 9.92% and 14.88% of the total paid up capital of
the Bank. I.F.I.C. Bank Ltd., Bangladesh manages the Bank in accordance within the venture
and technical services agreement between it and Nepali promoters I.F.I.C. has 50% share
capital, Nepali promoters have 20% share and the public shareholders have 30%share capital.
The bank has altogether 17 branches with four branches in capital.
On 2063/7/26, NBBL was declared by NRB in the crucial stage and the Board of Directors
was suspended under section 86C (1) of NRB Act. Since then NRB had taken in control the
management of NBBL. Recently on Poush 29, 2066 Annual general Meeting (AGM) of the
shareholders was held and the management of NBBL has been handed over to the new Board
of Management appointed by the AGM of NBBL.
� Present capital structure of NBBL
• Authorized equity capital: Rs. 3,000 million
• Issued equity capital: Rs. 2,000 million
• Paid up equity capital: Rs. 1,860.3 million
� Facilities granting by NBBL
The following facilities are provided by the bank:
• Working Capital Loan, term loan, demand loan
• Trade finances
• Letter of Credit
• Consortium loan
• Customer Banking: (Hire purchase loan; Educational loan; Housing loan.)
• International Traders and Bank Guarantee
• Remittances services
• Locker facilities
• Credit card and ATM facilities
• ABBS (Any Branch Banking system)
• SMS banking
7
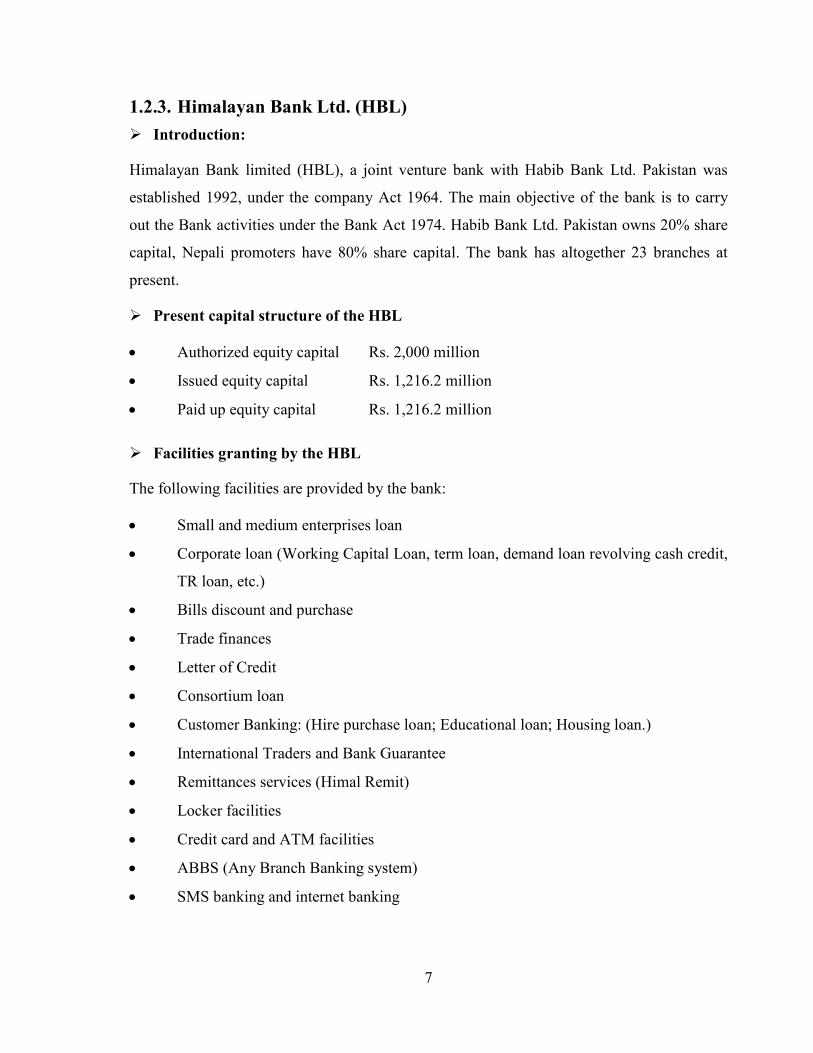
1.2.3. Himalayan Bank Ltd. (HBL)
� Introduction:
Himalayan Bank limited (HBL), a joint venture bank with Habib Bank Ltd. Pakistan was
established 1992, under the company Act 1964. The main objective of the bank is to carry
out the Bank activities under the Bank Act 1974. Habib Bank Ltd. Pakistan owns 20% share
capital, Nepali promoters have 80% share capital. The bank has altogether 23 branches at
present.
� Present capital structure of the HBL
• Authorized equity capital Rs. 2,000 million
• Issued equity capital Rs. 1,216.2 million
• Paid up equity capital Rs. 1,216.2 million
� Facilities granting by the HBL
The following facilities are provided by the bank:
• Small and medium enterprises loan
• Corporate loan (Working Capital Loan, term loan, demand loan revolving cash credit,
TR loan, etc.)
• Bills discount and purchase
• Trade finances
• Letter of Credit
• Consortium loan
• Customer Banking: (Hire purchase loan; Educational loan; Housing loan.)
• International Traders and Bank Guarantee
• Remittances services (Himal Remit)
• Locker facilities
• Credit card and ATM facilities
• ABBS (Any Branch Banking system)
• SMS banking and internet banking
8
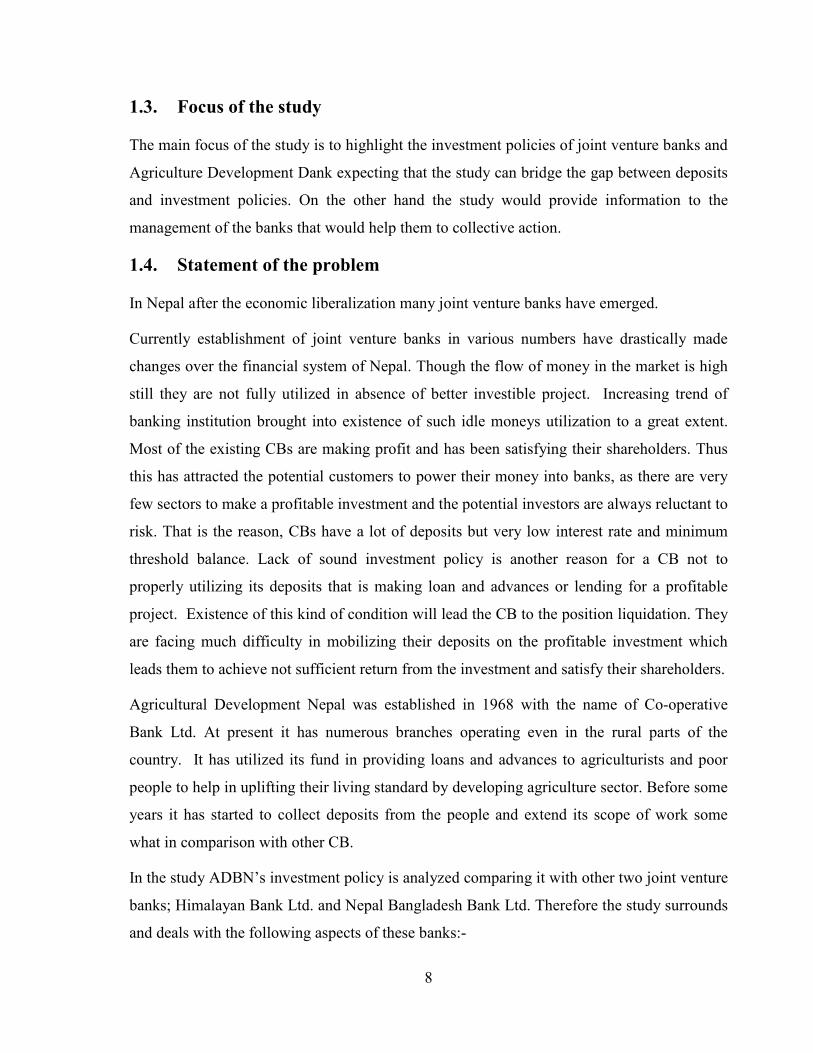
1.3. Focus of the study
The main focus of the study is to highlight the investment policies of joint venture banks and
Agriculture Development Dank expecting that the study can bridge the gap between deposits
and investment policies. On the other hand the study would provide information to the
management of the banks that would help them to collective action.
1.4. Statement of the problem
In Nepal after the economic liberalization many joint venture banks have emerged.
Currently establishment of joint venture banks in various numbers have drastically made
changes over the financial system of Nepal. Though the flow of money in the market is high
still they are not fully utilized in absence of better investible project. Increasing trend of
banking institution brought into existence of such idle moneys utilization to a great extent.
Most of the existing CBs are making profit and has been satisfying their shareholders. Thus
this has attracted the potential customers to power their money into banks, as there are very
few sectors to make a profitable investment and the potential investors are always reluctant to
risk. That is the reason, CBs have a lot of deposits but very low interest rate and minimum
threshold balance. Lack of sound investment policy is another reason for a CB not to
properly utilizing its deposits that is making loan and advances or lending for a profitable
project. Existence of this kind of condition will lead the CB to the position liquidation. They
are facing much difficulty in mobilizing their deposits on the profitable investment which
leads them to achieve not sufficient return from the investment and satisfy their shareholders.
Agricultural Development Nepal was established in 1968 with the name of Co-operative
Bank Ltd. At present it has numerous branches operating even in the rural parts of the
country. It has utilized its fund in providing loans and advances to agriculturists and poor
people to help in uplifting their living standard by developing agriculture sector. Before some
years it has started to collect deposits from the people and extend its scope of work some
what in comparison with other CB.
In the study ADBN’s investment policy is analyzed comparing it with other two joint venture
banks; Himalayan Bank Ltd. and Nepal Bangladesh Bank Ltd. Therefore the study surrounds
and deals with the following aspects of these banks:-

9
• Relationship between investment and loans and advances with total deposits and total
net profit.
• Effectiveness of fund mobilization and applied investment policy.
• Effect of the investment decision to the total earning of the bank.
• Proper utilization of the available fund.
1.5. Objectives of this study
The main focus of this study is to analyze investment policy of ADBN in comparison to
NBBL & HBL. Other specific objectives are as follows:
• To analyze the investment policy of these banks
• To examine the investment priority of ADBN, NBBL and HBL
• To analyze and evaluate the financial position
• To provide suggestions & recommendation
1.6. Importance of the study
It is fact that the banks affect the economic condition of whole country. In the absence of
study and research it is difficult to know what the exact economic condition is and how to
take decision about it.
For provided exact information & data to concern institution, bank, shareholders, and persons
and also get information for take decision for various ways. In conclusion the importance of
the study focuses at following points:
• It will be helpful to concern financial institutions
• It will be valuable property for decision making
• It provides various information & data to required persons, readers, shareholders,
decision-makers, traders, investors, economic planners etc.
• By the above points it helps to study all economic condition of nation.
1.7. Limitation of the study
Although this research will be helpful to know the economic condition of nation but it is not
covered whole sector due to lack of resources, finance, & time constraints etc. it has covered

10
mini data of only investment policy of concern bank. Absence of current data, information &
other required resources it can’t fulfill every aspects of country. Generally the limitation of
this study is as follows:
• For completion the study the researcher has the boundary of limit time
• Required data & information may not be able to be collected from different sources
due to lack of resources. The financial statements of ADBN have not been published
for some years. These data have to be collected from secondary sources.
• The research is based on the data obtained covering the period of five years only.
• Out of various banks & finance institutions the study is based upon only three banks.
The result may differ if the study covers some more banks in the sample.
1.8. Chapter plan
The whole study report is divided into six chapters. The chapters are divided to the following
aspects:
First chapter explains with introduction, which includes:
1.1 Background
1.2 Profile of concern bank
1.3 Focus of the study
1.4 Statement of the problem
1.5 Objective of the study
1.6 Importance of the study
1.7 Limitation of the study
1.8 Chapter plan of the study
Second chapter explains review of literature which includes:
2.1 Concept
2.2 Characteristics of Investment policy
2.2.1 Liquidity
2.2.2 Profitability
2.2.3 Safety and security

11
2.2.4 Suitability
2.2.5 Dispersal
2.3 Review of Books
2.4 Review of article
2.5 Review of thesis
2.6 Review of legislative provisions.
Third chapter explains research methodology which includes:
3.1 Introduction
3.2 Research design
3.3 Sources of data
3.4 Population & sample
3.5 Method of analysis
Fourth chapter is the analyzing chapter concerned with the analysis of different financial
ratios and statistical tools related to the analysis of investment policy of the banks.
Fifth chapter associates with the main findings, recommendations & suggestions.
The bibliography & appendices and other reference materials are included in the sixth
chapter.

12
CHAPTER II
REVIEW OF LITRETURE
In this chapter it has been discussed on the matters related to the investment policy. This
chapter summarizes the review of those books, reports, articles, thesis, and relevant research
papers, legislative provisions etc. which had already been explained. Every study is based on
past knowledge which gives the knowledge on different subject matters it provides
foundation to the present study. Therefore, this chapter has its own importance in this study.
The present chapter is categorized into following parts:
2.1 Concept
2.2 Characteristics of investment policy
2.3 Review of books
2.4 Review of articles
2.5 Review of thesis
2.6 Review of Legislative provisions
2.1 Concept
The banks are such types of institutions. It receives unused capital from different sources and
giving loans against securities. They provide working capital needs to trade, industry and
even to agricultural sectors. It provides also technical and administrative existence to
industries, traders and business enterprises.
According to new Encyclopedia Britannia, 1985, vol.14, “Banker is a dealer in money, such
as cheque or bill of exchange. He also provides a variety of financial services.”
According to the Encyclopedia American 1984,vol.3 “A bank is a business organization that
receives and holds deposits of funds from others, makes loans or extends credits and transfer
funds by written order of depositors.”
According to Commercial Bank Act 2031 “A Bank is one which exchange money deposits
money, accepts deposits, grants loans and performs Banking functions and which is not a
13
bank meant for co-operative, agriculture industries or for specific purpose.” Now all Acts
related to banks & financial institution except NRB Act have been merged under ‘Bank and
Financial Institution Act, 2063”where Banks means a corporate body established to conduct
financial transactions as mentioned under:
• Accept and payment of deposits with or without of interest and refund such deposits.
• Provide loan under the provision of NRB
• Perform foreign exchange transaction under the provision of Law
• Provide loan for hire purchase, hypothecation, leasing, and housing
• Perform Merchant banking transaction under the directing of NRB
• Provide loan with security of bank of internal or external
• Issue, accept, payment, discounting and marketing of Letter of credit, Bill of exchange,
cheque, Travelers cheque, Draft or other financial instruments
• Accept deposits, make payments and transfer of amount under the rule granting by NRB
with the use of electronic equipment like telephone, telex, fax, computer or magnetic tape
• Issuing, Accepting, of credit card, debit card & charge card under the rules accordance by
NRB
• Accept deposits, paid loan and make payments under the automated Taylor machine and
cash dispensing machine
• Provide overdraft loan
• Perform Govt. and other transactions under the rules granting by NRB as appointed agent
of GoN
• Marketing of debentures issued by GoN or NRB
• Provide safe deposit vault
• Provide loan security of individual or group promise for economic development of
poorest class, lower income class, victims of natural disaster
• Perform other works as per the rules of NRB.

14
2.2 Characteristics of good investment policy:
There are some of the main characteristics of good investment policy, which are as follows:
2.2.1 Liquidity:
Liquidity refers to the capacity of the bank to pay cash against deposits. Having confidence
that the bank will repay their money whenever it is needed people deposits money at the bank
in different accounts. In order to maintain the confidence to the depositors, bank must be
prepared with sufficient degree of liquidity of its assets. Once the confidence is lost in view
of depositors, they may withdraw all their deposits within a brief period without giving any
chance the bank to manage. So, to maintain the confidence of the depositors, the bank must
keep this point while investing its excess fund in different securities or at the time of
investing as that it can meet the readily demands for cash made by customers.
2.2.2 Profitability:
Bank should invest their fund where they earn maximum profit. Banks build up their capital
by accepting deposits from depositors and issuing share and debenture to shareholders who
receive interest and dividend. The profit of banks mainly depends on the interest rate, volume
of loan, time period and nature of investment in different securities.
2.2.3 Safety and security:
Banks should always consider the safety of the money of the deposit holders and the public,
as well as of the shareholders and other equity holders. While investing its funds the bank
should recognize those persons who are speculative businessman, who may be bankrupt at
once and who may earn million in a minute also. The bank must not finance its fund to those
people at all. Only commercial, durable, marketable and high market valued securities should
be accepted. The bank should never invest its fund in those securities that are too volatile
since a little difference may cause the great loss.
2.2.4 Suitability:
Bank should know that why a customer needs loan or it is for appropriate purpose or not. If
the borrower misuse the loan granted by bank, he will never to be able to repay the loan
which posses’ heavy bad debts to bank. In order to avoid such situation advances should be
allowed to selected and suitable borrowers and necessary all detailed information about the
15
scheme of project or activities should be demanded and it should be examined before
investing. Therefore suitability is the important factors for investment.
2.2.5 Diversification:
There is a saying “Don’t put all the eggs in the single basket.” Banks should introduce a
sufficient variety of services. A proper and planned diversification of services and products
always provide a ground for minimum effect of a failure of some specific product or services.
If the services are properly diversified, the loss from the failure of one product or service
would be compensated by the success of some other product or services. This can minimize
the loss. So, in order to minimize risk a bank must diversify its investment on different
sectors. Banks should not concentrate on a single client or sector or service.
2.3 Review of books
According to William J. Sharp and Alexander J. Gordon “Investment in the board sense,
means the sacrifice of current dollars. Two different attributes are generally involved: time &
risk. The sacrifice takes place in the present and is certain. The reward comes later, and the
magnitude is generally uncertain. In some cases the element of time predominates (for
example, Govt. bond). In other cases risk is the dominant attribute (for example call option
on common stock). Yet both time and risk are important.”
Cheney and Moses said “the investment objective is to increase systematically the individual
wealth, defined as assets minus liabilities. The higher the level of desired wealth the higher
must be received. An investor seeking higher return must be willing to face level of risk”.
Charles P.Jones has defined that "Investment as the commitment of funds to one or more
assets that will be held over some future time period. Investment is concerted with the
management of an investor's wealth, which is the sum of current income and present value of
all income”
Francis has defined that "Investing involves making a current commitment of funds in to
obtain an uncertain future return. It is a risky business that demands information. To process
information effectively and select the best investments requires goals that are clear-cut and
realistic."(Francis, 1988).
16
Preeti Singh defined investment in this way "Investment is the employment of funds with the
aim of achieving additional income or growth in value. The essential quality of an investment
is that it involves "waiting" for a reward. It involves the commitment of resources, which
have been saved or put away from current consumption in the hope that some benefits will
accrue in future."(Singh, 1991).
In this way it is clear that an investment means to trade a known rupee amount today for
some expected future stream of payments or benefits that will exceed the current outlay by an
amount that will exceed the current outlay by an amount that will compensate the investor for
the time the funds are committed for the expected changes of prices during the period and for
the uncertainty involved in expected future cash flow. Thus investment is the most important
function of banks. It is long-term commitment of banks in the uncertain and risky
atmosphere. It is very challenging task for any banks. So a bank has to be take pre-caution
while investing their funds in various sectors.
2.4 Review of articles
Dr. Govinda Bahadur Thapa has expressed his views in his article "Financial system of
Nepal" (Thapa, 1994,) that the Banks including foreign joint venture banks seem to be doing
pretty well in mobilizing deposits. Similarly, loans and advances of these banks are also
increasing. But compared to the huge credit needs particularly by the newly emerging
industries, the banks still seem to lack adequate funds. The banks are increasing their lending
to non-traditional sectors along with the traditional sectors.
Banks (NBL and RBB) are operating with a nominal profit, the later turning towards
negative from time to time. Because of non-recovery of accrued interest, the margin between
interest income and interest expenses is declining. Because of concentration of these two
local banks, in traditional off-balance sheet operation, these banks have not been able to
increase their income from commission and discount. On the contrary, they have got heavy
burden of personnel and administrative overheads. Accumulated overdue and defaulting
loans, have also added to effect profit position of these banks. But, the foreign joint venture
banks have been functioning in an extremely efficient way. They are success in making a big
amount of profits yearly and also success to distribute large amount of bonus and dividends
to its employee’s and shareholders. Because of their effective persuasion for loan recovery,

17
overdue and defaulting loans have been limited resulting in high margin between interest
income and interest expenses.
Sunity Shrestha in her article "leading operation of Banks of Nepal and its impact on GDP"
(Shrestha, 2055,) has presented with the objectives to make or analysis of contribution of
Banks lending to the Gross Domestic Product (GDP) of Nepal. She has set hypothesis that
there has been positive impact of lending of Banks to the GDP. In research methodology, she
has considered GDP as the dependent variable and various sectors of lending viz. agriculture,
industrial, commercial, service and general and social sector as independent variables. A
multiple regression technique has been applied to analyze the contribution.
The multiple analyses have shown that all the variables except service sector lending have
positive impact on GDP. Thus, in conclusion she has accepted the hypothesis i.e. there has
been positive impact on GDP. In Conclusion, she has accepted the hypothesis i.e. there has
been positive impact by the lending of Banks in various sector of economy except service
sector investment.
Mr. Shiva Raj Shrestha in his article, "Portfolio Management in Bank Theory and Practices"
(Shrestha, 1998,) has highlighted the following issues
In case of investors having lower income, portfolio management may be limited to small
saving incomes. But, on the other hand, portfolio management means to invest funds in
various schemes of mutual funds like deposits, shares and debentures for the investors with
surplus income. Therefore, portfolio management becomes very important both for
individuals as well as institutional investors. Large investors would like to select a best mix
of investment assets subject to the following aspects:
• Higher return which is comparable with alternative opportunities available according to
the risk class of investors.
• Good liquidity with adequate safety of investor.
• Certain capital gains.
• Maximum tax concession.
• Flexible investment.
• Economic efficient and efficient investment mix.

18
In the view of these aspects, investors are expected to develop following strategy;
• Do not hold any single security. Try to have a portfolio of different securities
• Do not put all the eggs in one basket.
• Choose such a portfolio of securities that ensure maximum return with minimum risk or
lower of return but with added objective of wealth maximization.
In this regard the portfolio management becomes very important both for individuals as well
as institutional individuals.
The portfolio structure depends upon client's need, market conditions and banks own
expertise sometimes the banks themselves float various financial instruments and invite
clients to subscribe.
These instruments could be of many types viz: open ended, close ended, interest income
generating or capital appreciation or a combination of both. However, following approach
may be adopted for designing a good portfolio and its management:
1. To find out the investible assets (generally securities) having scope for better return
depending upon individual characteristics like age, health, need, disposition, liquidity,
tax, liability etc.
2. To find out the risk of securities depending upon the risk of securities depending upon
the attitude of the investor towards risk.
3. To develop alternative investment strategies for selecting a better portfolio which will
ensure a trade-off between risk, and return so as to attain the primary objective of
wealth maximization at lowest risk?
4. To identify variety of securities for investment to refuse volatility of returns and risk.
By and large, portfolio management considered in the context of selecting following
securities:
1. Equity
2. Debenture and Bonds
3. Other money and capital market instrument.
But the bank having international network can also offer access to global financial for
equities, debentures and bonds. On the other hand, the wealthy clients go for customized
19
portfolio management, where detailed discussions take place between bank and client for
evolving proper guidelines.
Investment analysis for the selection of equity shares could be done with the help of either
fundamental analysis or Technical Analysis. He also has suggested that in order to get
success in portfolio management and customer's confidence the bank should possess skilled
manpower and strong research and analysis team and proper management information
system.
Besides Mr. Bodhi B. Bajracharya in his article "Monetary policy and Deposit mobilization
in Nepal" (Bajracharya, 1990) has mentioned that mobilization of domestic saving is one of
the prime objectives of the monetary policy in Nepal and Banks and the most active financial
intermediary for generating resources in the form of deposit of private sector and providing
credit to the investor in different sectors of the economy.
Likewise, Mr. K. Pradhan, in his article "Nepalma Banijya Bank – Upalabdhi tatha
Chunauti" (Pradhan, 1991,) concluded some major issue in local Banks in comparison of
recently established joint venture banks. The study deals with the whole Banking system of
Nepal in respect of their performance and profitability. Some of his finding relevant to this
study is given as:
• The deposit collection rate of local banks is very poor in comparisons to joint venture
banks.
• The patterns of deposit are also different between these banks. The ratio of current
deposit in local banks is 9.34% only where the same as the joint venture banks is 52.5%.
But the fixed deposit ratio is very high in local banks.
Mr. Bhagat Bista in his article "Issues in banking reform"(Bista, 2001), the Banks are main
vehicles in transferring currency from one country to another. Banks deal heavily in foreign
exchange transactions.
Mr. Pravakar Ghimire has mentioned in his article "Banijya Bankharu Prathamikta Chhetrama
lagani garna bhanda harjana tirna tayar.” (Ghimire, 1999) that most of Banks of Nepal are ready
to pay the penalty in spite of investing on rural, priority sector, poverty stricken and deprived
areas. In the directives of NRB it is clearly mentioned and directed that all the Banks (under

20
NRB) should invest 12% of its total investments to the priority sectors. Out of this 12%, they
should invest 3% to the lower level class of countrymen. However, these Banks are unable to
meet the requirement of NRB.
In the light of above foreign joint venture banks use to justify that they don't have any
network among these priority areas. If investment will be made in these areas, operation cost
will be very high and the cost exceeds the penalty if investment is not made in the sector.
That is why they are interested in paying penalty than investing in priority sectors.
In the light of this controversial situation, the member of National Planning Commission and
former Governor of NRB Mr. Hari Shanker Tripathi added that investing on priority sectors
means taking the risk of loss because operation cost will be very high in comparison of
profit. Thee joint venture banks don't have any branch network in these areas and performing
duties through limited personnel are the main reasons of this" controversial situation. He,
further, added that government doesn't expect that these joint venture banks will invest in
priority sectors because they are interested to pay penalty due to the above mentioned
reasons.
2.5 Review of theses
Mr. Panta U.R. (2033) in his thesis paper, "A study of Banks Deposits and its utilization" has
tried to make an attempt to highlight the discrepancy between resource collection and its
utilization. He concluded that, due to their lending confined for short-term only, Banks are
failure in resource utilization. So, he recommended that Banks should give emphasis on long
term lending too, for sound utilization of the deposits.
Mrs. Bhattarai R. (1978) in her thesis paper, "Lending policy of Banks in Nepal" has tried to
examine the lending policy of Banks in Nepal, She has concluded that efficient utilization of
resources is more important than collection of the same. Lower investment means lower
capital formation that hampers economic development of the people and the country too. So,
she has suggested that banks should give emphasis on efficient utilization of resources.
Miss Ojha (1997) in her thesis paper: A study on priority sector investment in Banks (with
special reference to RBB)" has mentioned that the banks are unable to meet the requirement
of 12 percent lending in priority sectors as set under NRB directives. As her 5 years' study
21
period she has further found that there was low interest rate in priority sector but increasing
trend of overdue and its misutilization. She has pointed out as main recommendation of the
research to give more emphasis on the improvement of sound supervision, evaluation of
borrower's paying capacity and reduction of overdue through integrated program of priority
sector loan.
Mr. Pradhan N.M. (1980) in his thesis, "A study on Investment policy of Nepal Bank Ltd."
has concluded that sound relationship should be maintained between deposits and loan and
advances. In his 6 years' period study i.e., from 1972 to 1977, he concluded that through loan
and advances as well as deposits are increasing by the pace of each year, however their
increase is not in a proportionate manner. Immense increase in the deposits had leaded to
little increase in loans and advances. His recommendation was to grant the loan and advances
without its lengthy process and also suggested for extending banking transaction towards
rural sectors of the kingdom.
Mr. Khadka (1998) in his thesis, "A study on investment policy of NABIL Bank; in
comparison to other joint venture banks of Nepal" has suggested the JVBs to be careful in
increasing profit in real sense to maintain the confidence of shareholders depositors and
customers. He has strongly recommended NABIL to utilize its risks assets and shareholders
fund to gain highest profit margin and reduce its expenses and collect cheaper fund for more
profitability. He has recommended investing its fund in different sectors of investment and
administering various deposits schemes to collect fund such as cumulative deposit scheme
etc. He has recommended that to be success in competitive banking environment, depositor's
money should be utilized as loans and advances. Since, the target item of the bank in assets
side is loan and advances, negligence in administering this asset could be the main course of
a liquidity crisis in the bank and one of the main reasons of a bank failure.
2.6 Review of legislative provisions
Currently all the Banks in Nepal are bound to operate under ‘Banks and Financial Institutions
Act 2063’. The Act has classified all the banks and financial institutions in the four
Categories: A, B, C and D. As per this classification ADBN, NBBL and HBL fall under ‘A’
class financial institution.

22
The Investment policies of Banks may be affected by the following relevant provisions
which have been discussed as follows
2.6.1 Functions of banks:
Under Section 47 (1) of the BAFIA, ‘A’ class financial institutions can perform the following
transactions:
• Accept and payment of deposits with or without of interest and refund such deposits.
• Provide loan under the provision of NRB
• Perform foreign exchange transaction under the provision of Law
• Provide loan for hire purchase, hypothecation, leasing, and housing
• Perform Merchant banking transaction under the directing of NRB
• Provide loan with security of bank of internal or external
• Issue, accept, payment, discounting and marketing of Letter of credit, Bill of exchange,
cheque, Travelers cheque, Draft or other financial instruments
• Accept deposits, make payments and transfer of amount under the rule granting by NRB
with the use of electronic equipment like telephone, telex, fax, computer or magnetic tape
• Issuing, Accepting, of credit card, debit card & charge card under the rules accordance by
NRB
• Accept deposits, paid loan and make payments under the automated Taylor machine and
cash dispensing machine
• Provide overdraft loan
• Perform Govt. and other transactions under the rules granting by NRB as appointed agent
of GoN
• Marketing of debentures issued by GoN or NRB
• Provide safe deposit vault
• Provide loan security of individual or group promise for economic development of
poorest class, lower income class, victims of natural disaster
• Perform other works under the rules of NRB.
2.6.2 Other provisions regarding investment of banks
Under Section 48 (1) a bank must not perform the following functions:
23
• Purchase or sell goods with commercial motives or purchase any immovable assets
except when it is required to do so for its own use.
• Advance loan against the securities of its own Shares.
• Advance loan or provide any facility to promoters, Directors, person who have
subscribed to one percent or more of its shares, the Executive Chief, or member of the
family of the such persons, or firms, companies, or institutions entitled to appoint or
nominate Directors.
• Advance loan or provide facility of any kind to any firm, company, or institutions in
which any promoter, director person holding one percent or more of its share, the
executive chief of any member of the family of any such person working as the director
or managing agent or entitled to nominate a director or has any financial interest.
• Supply loan or provide facilities worth an amount exceeding one percent of its capital
fund prescribed by NRB to a single person or firms or companies or partnerships
belonging to single group.
• Supply loans against the personal Guarantee provided by the promoter, any Director, or
Executive Chief.
• Invest in the Securities of Other financial institutions and Banks.
• Invest in the Share Capital of any other institutions in the amount exceeding the limit
prescribed by NRB.
Under Section 50, it shall be the duty of Banks to comply with the Directives Issued by NRB
from time to time in relation to banking or financial system, currency and credits. This
implies that BAFIA has granted NRB the authority to control and monitor the investment
policies of any Bank.
Under Section 51 (1), the rate of interest to be paid on the deposits and to be charged on the
credits provided by banks shall be prescribed by NRB. However, the power to fix the interest
rates may be delegated to the respective banks under Section 50 (2), if it so deems necessary.

24
2.6.3 NRB Directives regarding investment
NRB has been vested with the authority to issue directives regarding the investments of
banks and financial institutions. These directives have direct and indirect impact on the
investment policies of CBs also. Some important ones have been summarized as under
a) Investment in deprived sector:
According to the directives of NRB, all CBs should invest a certain percentage (at least 3%)
of its total investment in the deprived sector organisations. This helps in the promotion of the
deprived sector organisations.
b) Investment in productive sector
NRB has directed Banks to extend a certain percentage of their total credit to the productive
sector. Productive sector includes Loans priority Sector, Agricultural Sector, Industrial
Sectors.
c) Cash reserve requirement (CRR)
The quantum of liquidity in the Banks depends on the Cash Reserve Requirement fixed by
NRB. With the increase in CRR, the liquidity in the banks decreases and vice versa. As per
the latest directive issued by NRB, “A” class financial institutions should maintain in NRB
5.5% of its total deposit as CRR
d) Fixation of interest rate spread
Interest Rate Spread is the difference between the rate of interest charged on the credits
provided by the banks and the rate of interest paid to the depositors. At present, “A” class
financial institutions are free to determine the rate of interest to be provided to the depositors,
as well as the rate of interest to be charged to the loans and advances. The details of rate of
interest to be provided and to be charged should be provided to NRB within seven days of
each quarter end or seven days from the date of any revision of the interest rate.
e) Investment in housing and real estate
Any licensed financial institution should not invest in real estate loan more than 25% of the
total credit forwarded by the institution and combined investment in real estate loan and
residential loan should not exceed 40% of the total credit forwarded by the institution.
25
Further financial institutions should limit the investment in real estate loan to 15% and 10%
of the total credit by the end of Ashad 2067 and Ashad 2068 respectively. Similarly, financial
institutions should limit the total investment in real estate loan and residential loan to 30%
and 25% of the total credit by the end of Ashad 2067 and Ashad 2068 respectively.
f) Total loan and advances to deposit ratio
Total credit provided by a financial institution should not exceed 80% of the total of
Domestic Deposits and Primary Capital of the institution.
Those financial institutions, which have exceeded the above limit before the implementation
of the above directive, should limit the total credit to 95% by the end of Ashad 2067, 85% by
the end of Ashad 2068 and finally 80% by the end of Poush 2068.
g) Statutory liquidity ratio
A-Class Financial institutions should invest in Govt. securities at least 6% of total domestic
deposit by the end of Poush 2066. Further the ratio should be increased to 8% by the end of
Ashad 2067.

26
CHAPTER III
RESEARCH METHODOLOGY
This chapter contains the discussed about the methods and processes that has been used for
the study and analysis of the investment strategy of given Banks.
3.1. Introduction
3.2. Research design
3.3. Sources of data
3.4. Population & sample
3.5. Analysis of data
3.1 Introduction
This study basically helps us to conclude the real position of Agriculture Development Bank
Ltd. (ADBN) and make a comparison with respect to two JVBs viz. Himalayan Bank Ltd.
(HBL) & Nepal Bangladesh Bank Ltd. (NBBL) to accomplish the study following research
methodology described in this chapter.
3.2 Research design:
A research design is the arrangement of conditions for collecting and analysis of data. It is
the plan, structure, and strategy of investment from which answer of relating research
question and to control variances are obtained.
The study is based on the descriptive and analytical research Design.
3.3 Sources of data:
In this study conducted on the basis of data collected from the respective banks and some
secondary data. The data required for the analysis are directly obtained from the Balance
Sheet and the Profit and Loss a/c of concerned banks’ annual reports and relevant
publications of NEPSE. Supplementary data and information are collected from number of
institutions and authorities like NRB, security exchange board, Nepal Stock Exchange Ltd.,

27
Ministry of Finance, budget speech of different fiscal years, economic survey. All the
secondary data are complied, processed and tabulated in the time as per need and objectives.
3.4 Population and sample:
There are altogether 26 CBs functioning all over the kingdom and most of their stocks are
traded actively in the stock market. The CBs licensed by NRB till the end of Ashad 2066
have been listed as follows.
Table 3.1: A- Class Financial institutions in Nepal S.N. Name of Bank Established
Date
Remark
1. Nepal Bank Limited 1937
2. Rastriya Banijya Bank 1966
3. Nabil Bank Limited 1984
4. Nepal Investment Bank Limited 1986
5. Standard Chartered Bank Nepal Limited 1987
6. Himalayan Bank Limited 1993
7. Nepal SBI Bank Limited 1993
8. Nepal Bangladesh Bank Limited 1994
9. Everest Bank Limited 1994
10. Bank of Kathmandu Limited 1995
11. Nepal Credit and Commerce Bank Limited 1996
12. Lumbini Bank Limited 1998
13. Nepal Industrial and Commercial Bank Ltd.
1998
14. Machhapuchhre Bank Limited 2000
15. Kumari Bank Limited 2001
16. Laxmi Bank Limited 2002
17. Siddhartha Bank Limited 2002
18. Agriculture Development Bank 2006 Prior to the enactment of BAFIA, operated under ADBN Act
19. Global Bank Limited 2007
20. Citizens Bank International Limited 2007
21. Prime Commercial Bank Limited 2007
22. Bank of Asia Nepal Limited 2007
23. Sunrise Bank Limited 2007
24. DCBL Bank Limited 2008 Promoted to “A” class financial institution from “B” Class financial institution
25. NMB Bank Limited 2008
26. KIST Bank 2009
Source: NRB
In this investment policy of Nepal Agriculture Development Bank is compared with the two
other leading J/V Banks, which are selected as the sample banks.
The sample size represents around 11.54 percent of the total population.
28
The data have been collected for the period of five fiscal years, i.e. from FY 2061/62 to the
FY 2065/66.
3.5 Analysis of data:
In this study various financial, statistical and accounting tools have been used to achieve of
study. The analysis of data is according to the available of data.
The various tools applied in this study are presented as follows:
3.5.1 Financial Tools:
It is used to analysis financial strength and weakness of bank for these purpose financial tools
like ratio analysis has been used.
3.5.1.1 Ratio Analysis
Ratio is the mathematical relationship between two accounting figures. According to Kothari
1984,”Ratio analysis is a part of the whole process of analysis of financial statements of any
business or industrial concern especially to take output and credit decisions.” Therefore Ratio
analysis is comparing a firm’s financial performance and status to that other firm’s or to itself
of different time. Also qualitative judgment of a firm can be done with the help of ratio
analysis.
There are many ratios to compare of firm’s financial performance and status but have only
these ratios have been covered which are related to investment operation of the bank, this
study contains following ratios.
3.5.1.1.1. Liquidity Ratios
Liquidity Ratios are used to Judge the ability of banks to meet its short term liabilities that
are likely to mature in the short period. It is measurement of speed with which a bank’s assets
can be converted into cash to meet deposit withdrawal and other current obligations.
The following ratios are evaluation under liquidity ratios.
a) Current ratio
This Ratio shows the banks short term solvency. It shows the relationship between current
assets and current liabilities. This ratio computed as.
29
bilitiesCurrentLia
etsCurrentAssratio =
Current Assets includes cash and bank b/s, money at call or short notice, loan and advances,
investment of Govt. securities and other interest receivables ,overdrafts, bill purchased and
discounted and miscellaneous current assets.
Similarly, current liabilities include deposits and other short-term loan, bills payable, tax
provision staff bonus, dividend payables and other miscellaneous current liabilities.
The accepted standard of current ratio is 2:1 but accurate standard depends on circumstances
in case of seasonal business ratio and the nature of business.
b) Cash and bank balance to total deposit ratio
It is also called the Cash Reserve Ratio. Cash and bank balance are the most liquid current
assets. This ratio measures the percentage of most liquid fund with the bank to make
immediate payment to the depositor. This ratio is computed by dividing cash and bank
balance by total deposit.
This can be presented as
DepositsTotal
kBalanceCashandBanratio =
Hence, cash and bank balance includes cash in hand, foreign cash on hand, cheque and other
cash items, balance with domestic banks and balance held in foreign banks. The total deposit
encompasses current deposits, saving deposits, fixed deposits, money at call or short notice
and other deposits.
c) Cash and bank balance to current assets ratio
This ratio measures the proportion of most liquid assets i.e. cash and balance among the total
current assets of bank. Higher ratio shows the banks ability to meet demand for cash. This
ration is computed by dividing cash and bank balance by current assets. This can be stated as
etsCurrentAss
kBalanceCashandBanratio =

30
d) Investment on government securities to current asset ratio
This ratio is calculated to find out the percentage of current assets invested in Govt. securities
i.e. treasury bills and development bonds. This ratio is computed by dividing investment on
Govt. securities by current assets, we can state it as
etsCurrentAss
esntSecuritionGovernmeInvestmentratio =
Here, investment on Govt. securities includes treasury bills and development bonds etc.
3.5.1.1.2. Asset management ratio
Assets management ratio measures how efficiently the bank manages the resources at its
command. The following ratios are used under this asset management ratio:
a) Loan and advances to total deposit ratio
This ratio is calculated to find out, how successfully the banks are utilizing their total
deposits on loans and advances for profit generating purpose. The ratio is also called ‘total
credit/deposit ratio (C/D ratio)’. Greater ratio implies the better utilization of total deposits.
This can be obtained by dividing loan and advances by total deposits, which can be stated as
itsTotalDepos
ancesLoanandAdvratio =
b) Total investment to total deposit ratio
Investment is one of the major credits created to earn income. This implies the utilization of
firm’s deposit on investment in Govt. securities and shares debentures of other companies
and bank. This ratio can be obtained by dividing total investment by total deposit. This can
be mentioned as
itsTotalDepos
tmentTotalInvesratio =
The numerator consists of investment on Govt. securities, investment on debenture and
bonds, shares in other companies and other investment.

31
c) Loan and advances to working fund ratio
Loan and advances is the major component in the total working fund (total assets), which
indicates the ability of bank to canalize its deposits in the form of loan and advances to earn
high return. This ratio is computed by dividing loan and advances by total working fund.
This is stated as
ngFundTotalWorki
ancesLoanandAdvratio =
Here, the denominator includes all assets as of on balance sheet items. In other words this
includes current assets, net fixed assets, loans for development banks and other
miscellaneous assets but excludes off balance sheet items like letter of credit, letter of
guarantee etc.
d) Investment on government securities to total working fund ratio
This ratio shows that banks investment on Govt. securities in comparison to the total working
fund. This ratio is calculated by dividing investment on Govt. securities by total working
fund. This is presented as
ngFundTotalWorki
esntSecuritionGovernmeInvestmentratio =
e) Investment in government securities to total domestic deposit ratio
NRB has defined the ratio as Statutory Liquidity Ratio. The ratio is calculated by dividing the
amount of investment in Govt. securities by the amount of total domestic deposit. This can be
stated as
icDepositTotalDomet
esntSecuritionGovernmeInvestmentratio =
f) Investment on shares and debenture to total working fund ratio
This ratio shows the banks investment in shares and debenture of subsidiary and other
companies. This ratio can be derived by dividing investment on shares and debentures by
total working fund, which can be mentioned as

32
ngFundTotalWorki
sdDebentureonSharesanInvestmentratio =
The numerator includes investment on debentures, bonds and shares of other companies.
g) Provision for loan loss ratio
This ratio shows the possibility of loan default of a bank. It indicates how efficiently it
manages its loan advances and makes effort for loan recovery. Higher ratio implies higher
portion of non- performing loan portfolio. Dividing loan loss provision from total loan and
advances derives this ratio. This can be stated as
ndAdvancesTotalLoana
ovisionLoanLossratio
Pr=
Here, the numerator indicates the amount of provisions for possible loss.
3.5.1.1.3. Profitability ratios
Profitability ratios are calculated to measure the efficiency of operation of a firm in term of
profit. It is the indicator of the financial performance any institution. This implies that higher
the profitability ratio, better the financial performance of bank and vice versa. Profitability
position can be evaluated through following different ways:
a) Return on loan and advances ratio
This ratio indicates how efficiently the bank has employed its resources in the form of loan
and advances. This ratio is computed by dividing net profit (Loss) by loan and advances.
This can be expressed as
ancesLoanandAdv
ofitNetratio
Pr=
b) Return on total working fund ratio
This ratio measures the overall profitability of all working funds i.e. total assets. It is also
known as return on assets (ROA). A firm has to earn satisfactory return on assets or working
fund for its survival. This ratio is calculated by dividing net profit (loss) by total working
fund. This can be mentioned as
33
ngFundTotalWorki
ofitNetratio
Pr=
The numerator indicates the portion of income left to the internal equities after all costs,
charges, expenses have been educated.
c) Return on equity (ROE)
Net worth refers to the owner’s claim of a bank. The excess amount of total assets over total
liabilities is known as net worth. This ratio measures how efficiently the banks have used the
funds of owners. This ratio is calculated by dividing net profit by total equity capital (net
worth). This can be stated as,
yTotalEquit
ofitNetratio
Pr=
Here, total equity includes all of shareholder’s reserves including P/L a/c GLLP and share
capital i.e. ordinary share and preference share capital.
d) Total interest earned to total outside assets ratio
This ratio measures the interest earning capacity of the bank through the efficient utilization
of outside assets. Higher ratio implies efficient use of outside assets to earn interest. This
ratio is calculated by dividing total interest earned by total outside assets and can be
mentioned as,
deAssetsTotalOutsi
estEarnedTotalInterratio =
The denominator includes loan and advances, bills purchased and discounted and all types of
investments. The numerator comprised total interest income from loans, advances, cash
credit, and overdrafts, Govt. securities, inter bank and other investments.
e) Total interest earned to total working fund ratio
This ratio is calculated to find out the percentage of interest earned to total assets (working
fund). Higher ratio implies better performance of the bank its terms of interest, earning on its
total working fund. This ratio is calculated by dividing total interest earned by total working
fund. This is stated as,
34
sTotalAsset
estEarnedTotalInterratio =
f) Total interest earned to total operating income ratio
This ratio is calculated to find out the proportion of interest income in total operating income
of the bank. It indicates how efficient is the bank in mobilizing of its resources (funds) in
interest bearing assets i.e. loan and advances, investment etc. This ratio is calculated by
dividing total interest earned by total operating income. This ratio can be stated as,
tingIncomeTotalOpera
estEarnedTotalInterratio =
3.5.1.1.4. Risk ratios
Risk taking is the prime business of bank’s investment management. It increases
effectiveness and profitability of the bank. These ratios indicate the amount of risk associated
with the various banking operations, which ultimately influences the banks investment
policy.
The following ratios are evaluated under this topic:
a) Credit risk ratio
Credit risk ratio measures the possibility that loan will not be repaid or that investment will
deteriorate in quality or go into default with consequent loss to the bank. By definition, credit
risk ratio is expressed as the percentage of non-performing loan to total loan and advances.
Here dividing total loan and advances by the amount of non-performing loan derives this
ratio. This can be stated as
ndAdvancesTotalLoana
vancesgLoanandAdPerforNonratio
min=
b) Interest risk ratio
Interest risk ratio shows the decline in the net interest income (NII) due to the change in the
interest rates charged by the banks on its deposits and advances. Higher interest rates risk
ratios suggest the banks to increase the interest rates on deposit and loan and advances, to
increase net interest income (NII) and vice versa. This ratio is calculated by dividing interest

35
sensitive assets (i.e. securities+ variable rate loan and advances) by interest sensitive
liabilities (i.e. borrowing total deposits) excluding current deposits. This can be mentioned as
bilitiesnsetiveLiaInterestSe
etsnsetiveAssInterestSeratio =
Here, the numerator includes Treasury bill, development bonds, investment in debenture,
mutual fund and other investment and the denominator includes borrowing from NRB and
other banks, total deposits excluding current deposits.
3.5.2 Statistical tools
Some important statistical tools are used to achieve the objective of this study. In this study,
Statistical tools such Standard deviation (SD), Coefficient of variance (CV), Least square
linear trend and Hypothesis testing have been used. They basic analysis is written in point
below:
3.5.2.1 Trend analysis
The objective of Trend analysis is to forecast the value of variables in the future. It
determines the expected value of the variables taken into consideration. Under this topic the
trend analysis of deposits, loan and advances, investment and net profit of ADBN and the
JVBs from FY 2061/62 to FY 2065/66 has been made. For this a simple and linear trend
model (linear regression analysis) has been chosen. Under the simple trend model, it is
assumed that the dependent variable changes only due to the time factor and the effect of
other factors are assumed to be negligible. Under the linear model, it is assumed that the
variable moves about a straight line in a graph, plotted with dependent variable on Y-Axis
and Independent variable (Time) on X-Axis.
Under this topic following subtopic has been presented.
• Trend analysis of total deposits.
• Trend analysis of loan and advances.
• Trend analysis of total investment.
• Trend analysis of net profit.

36
3.5.2.2 Test of hypotheses
Hypotheses are the pre-assumed answers to the problem of the research. They provide the
directions to the activities done or to be done by the researcher.
The objective of this test is the significance regarding the parameters of the population on the
basis of sample drawn from the population. This test has been conducted on the various ratios
related to the banking business. For the purpose of this research, F-Test has been used for
Hypothesis Testing.
The following hypotheses have been set for the purpose of this research:
• Hypothesis 1
There is no significant difference between the loan and advances to total deposit ratios of
ADBN and JVBs
• Hypothesis 2:
There is no significant difference between the return on loan and advance ratios of ADBN
and JVBs
• Hypothesis 3:
There is no significant difference between the total interest earned to total outside asset ratios
of ADBN and JVBs
37
CHAPTER – IV
PRESENTATION & ANALYSIS OF DATA
In this chapter, the various financial ratios related to the investment management and the fund
mobilizations are studied to evaluate and analyze the performance of ADBN, Himalayan bank
and NBBL. Study of all types of ratios has not been done. Only those ratios that are important
from the point of view of the fund mobilization and investment have been calculated. The
important ratios that are studied for this purpose are given below:
4.1 Financial tools
4.1.1 Ratio Analysis
4.1.1.1. Liquidity ratios
� Current Ratio
The current ratios of the three banks from the F/Y 2061/62 to 2065/66 have been shown in the
Table 4.1
Table 4.1
Fiscal Year ADBN NBBL HBL
2061/62 1.8482 1.2089 2.2905
2062/63 1.7911 1.7903 2.4913
2063/64 1.8434 1.3393 1.3702
2064/65 2.0728 1.4375 1.3921
2065/66 2.2661 1.2300 1.3321
Mean 1.9643 1.4012 1.7752
SD 0.1794 0.2111 0.5071
CV 9.1334 15.0654 28.5639
Source: Appendix A (1)
The mean of the current ratios ADBN is 1.9643 as compared to 1.4012 and 1.7752 of NBBL
and HBL respectively. It is sufficiently greater than the ideal current ratio, i.e. 1.5. Similarly the
CV of ADBN is 9.1334 as compared to 15.0654 and 28.5639 of NBBL and HBL respectively.

38
� Cash and Bank Balance to Total Deposit Ratio
The percentage of Cash and Bank Balance to Total Deposit Ratios of the three banks from the
F/Y 2061/62 to 2065/66 have been shown in the table 4.2
Table 4.2
Fiscal Year ADBN NBBL HBL
2061/62 11.1488 11.4075 8.1183
2062/63 16.1033 12.9994 6.4828
2063/64 11.3810 12.1653 5.8484
2064/65 11.1320 17.3298 4.5478
2065/66 14.7988 25.5895 8.7901
Mean 12.9128 15.8983 6.7575
SD 2.1150 5.2626 1.5341
CV 16.3789 33.1015 22.7030
Source: Appendix A (2)
Average Cash Reserve Ratio of ADB is 12.9128% which is slightly lower than that of NBBL
(18.8983%) and greater than that of HBL (6.7575%). This shows the sufficiency of Cash
Reserve in ADBN. The coefficient of Variance of Cash Reserve Ratio of ADBN is 16.38%
which is less than that of NBBL and HBL.
� Cash and Bank Balance to Current Asset Ratio
The Cash and Bank Balance to Current Assets Ratios of the three banks from the F/Y 2061/62
to 2065/66 have been shown in the Table 4.3
Table 4.3
Fiscal Year ADBN NBBL HBL
2061/62 10.8049 13.2187 7.8044
2062/63 15.6619 16.5127 6.2479
2063/64 11.4430 17.7009 5.5354
2064/65 9.3618 22.1710 4.2124
2065/66 11.3682 23.6035 8.1828
Mean 11.7280 18.6414 6.3966
SD 2.1041 3.7921 1.4634
CV 17.9411 20.3426 22.8774
Source: Appendix A (3)
The Cash balance to current ratio of ADBN (11.728%) is lower than that of NBBL (16.6414%)
but it is considerably greater than that of HBL (6.3966%).the CV of ADBN is the lowest
(17.94%) as compared to 20.34% and 22.88% of NBBL and HBL respectively.
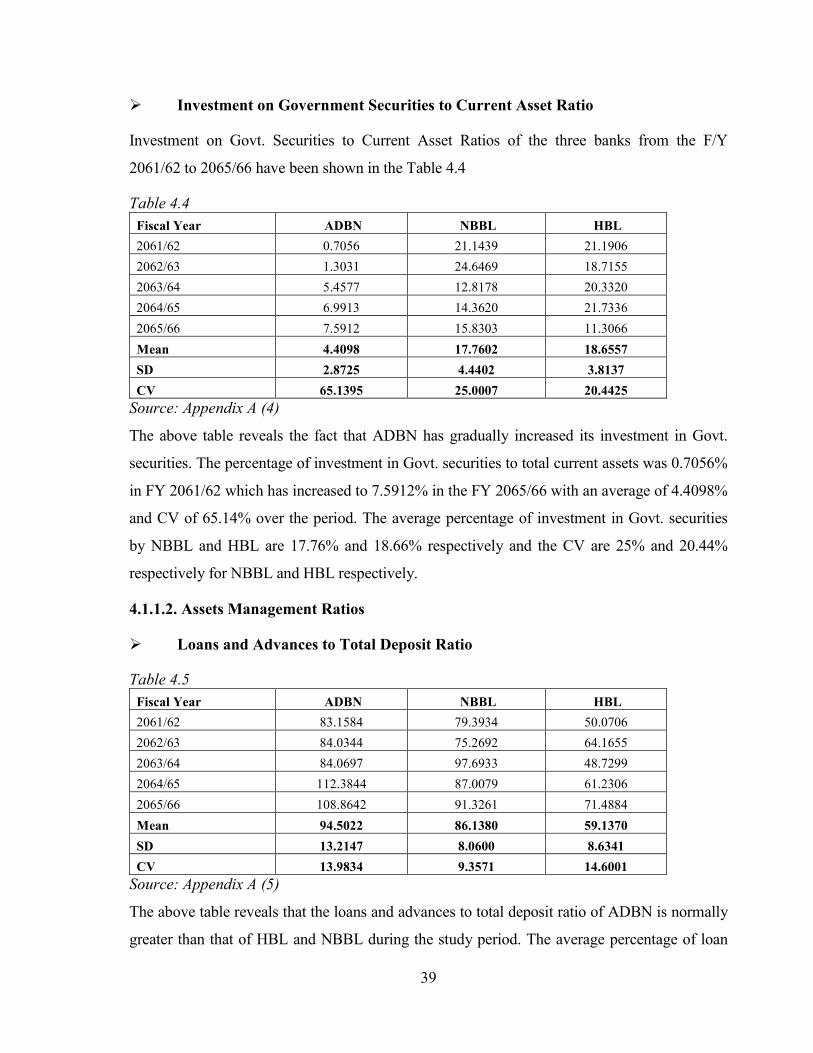
39
� Investment on Government Securities to Current Asset Ratio
Investment on Govt. Securities to Current Asset Ratios of the three banks from the F/Y
2061/62 to 2065/66 have been shown in the Table 4.4
Table 4.4
Fiscal Year ADBN NBBL HBL
2061/62 0.7056 21.1439 21.1906
2062/63 1.3031 24.6469 18.7155
2063/64 5.4577 12.8178 20.3320
2064/65 6.9913 14.3620 21.7336
2065/66 7.5912 15.8303 11.3066
Mean 4.4098 17.7602 18.6557
SD 2.8725 4.4402 3.8137
CV 65.1395 25.0007 20.4425
Source: Appendix A (4)
The above table reveals the fact that ADBN has gradually increased its investment in Govt.
securities. The percentage of investment in Govt. securities to total current assets was 0.7056%
in FY 2061/62 which has increased to 7.5912% in the FY 2065/66 with an average of 4.4098%
and CV of 65.14% over the period. The average percentage of investment in Govt. securities
by NBBL and HBL are 17.76% and 18.66% respectively and the CV are 25% and 20.44%
respectively for NBBL and HBL respectively.
4.1.1.2. Assets Management Ratios
� Loans and Advances to Total Deposit Ratio
Table 4.5
Fiscal Year ADBN NBBL HBL
2061/62 83.1584 79.3934 50.0706
2062/63 84.0344 75.2692 64.1655
2063/64 84.0697 97.6933 48.7299
2064/65 112.3844 87.0079 61.2306
2065/66 108.8642 91.3261 71.4884
Mean 94.5022 86.1380 59.1370
SD 13.2147 8.0600 8.6341
CV 13.9834 9.3571 14.6001
Source: Appendix A (5)
The above table reveals that the loans and advances to total deposit ratio of ADBN is normally
greater than that of HBL and NBBL during the study period. The average percentage of loan

40
and advance to total deposit of ADBN is 94.5% as compared to 86.14% and 59.14% of NBBL
and HBL respectively. The CV of ADBN (13.98%) is higher than that of NBBL (9.357%) but
slightly lower than that of HBL (14.6%).
From the above we can draw conclusion that ADBN has strong position regarding the
mobilization of total deposit on loans and advances and acquiring high profit with compare to
other two banks. But the high ratio is not better from the point of liquidity as the loans and
advances are not as liquid as cash and bank balances.
� Total Investment to Total Deposit Ratio
Table 4.6
Fiscal Year ADBN NBBL HBL
2061/62 4.9805 19.8895 47.1199
2062/63 5.1004 20.4518 41.1049
2063/64 9.8020 11.0224 39.3464
2064/65 14.7101 12.7705 41.8939
2065/66 19.5970 22.2294 25.1164
Mean 10.8380 17.2728 38.9163
SD 5.6572 4.4913 7.3699
CV 52.1977 26.0023 18.9379
Source: Appendix A (6)
The above table reveals that the investment to total deposit ratio of ADBN (10.838%) is the
lowest among the three banks. The ratios of NBBL and HBL are 17.27% and 38.92%
respectively. The ratio of ADBL shows a clearly increasing tendency. It has increased from
4.98% in FY 2061/62 to 19.6% in FY 2065/66.
� Loans and Advances to Working Fund Ratio
Table 4.7
Fiscal Year ADBN NBBL HBL
2061/62 56.7463 67.2267 43.6794
2062/63 56.9718 65.1121 55.5857
2063/64 60.0957 76.3168 42.6712
2064/65 67.1341 70.6539 52.8996
2065/66 62.9154 63.4498 61.9106
Mean 60.7727 68.5518 51.3493
SD 3.9032 4.5680 7.2942
CV 6.4227 6.6635 14.2051
Source: Appendix A (7)

41
The above table reveals that loans and advances comprise in average 60.77% of the total
working fund to working fund of ADBN. The ratio is 68.55% and 51.35% in NBBL and HBL
respectively. In average, NBBL has maintained higher loans and advances to total working
fund ratios than ADBN and HBL. The CV of ADBN is slightly lower than that of NBBL but
significantly lower than that of HBL.
� Investment on Government Securities to Total Working Fund Ratio
Table 4.8
Fiscal Year ADBN NBBL HBL
2061/62 0.4968 15.4506 19.2293
2062/63 0.9083 16.7846 16.8226
2063/64 3.8802 6.8817 18.8107
2064/65 4.9661 9.1159 20.2717
2065/66 5.7111 11.9237 10.5185
Mean 3.1925 12.0313 17.1305
SD 2.1188 3.7233 3.4902
CV 66.3671 30.9468 20.3744
Source: Appendix A (8)
The above table indicates that the investment in Govt. securities of ADBN is the lowest among
the three banks. The average of ADBN is 3.19% as compared to 12.03% and 17.13%
respectively of NBBL and HBL. However it can be noticed that the ratios of ADBN show an
increasing trend whereas those of NBBL and HBL seems to be more stable.
� Investment in Government Securities to Total Domestic Deposit ratio
Table 4.9
Fiscal Year ADBN NBBL HBL
2061/62 0.7280 18.7394 29.5378
2062/63 1.3398 19.6212 25.9573
2063/64 5.4282 8.9396 27.4229
2064/65 8.3133 11.4866 29.3062
2065/66 9.8822 17.4779 14.1245
Mean 5.1383 15.2529 25.2698
SD 3.6482 4.2481 5.7242
CV 71.0009 27.8509 22.6525
Source: Appendix A (9)
The percentage of investment in Govt. securities to total domestic deposit shows a similar
result as compared to the percentage of investment in Govt. securities to total working fund.

42
The average of ADBN is 5.14% whereas those of NBBL and HBL are 15.25% and 25.27%
respectively. It should be noted that the ratio of ADBN has increased from 0.73% in the FY
2061/62 to 9.88% in the FY 2065/66.
� Investment on Shares and Debentures to Total Working Fund Ratio
Table 4.10
Fiscal Year ADBN NBBL HBL
2061/62 0.3694 0.4383 0.1403
2062/63 0.3372 0.4307 0.1305
2063/64 0.3213 0.5393 0.2140
2064/65 0.2379 0.4231 0.2430
2065/66 0.2351 0.3552 0.2344
Mean 0.3002 0.4373 0.1924
SD 0.0543 0.0590 0.0476
CV 18.0788 13.4842 24.7427
Source: Appendix A (10)
The average percentage of investment in shares and debentures to total working fund of ADBN
is 0.30% which is lower than that of NBBL (0.44%) but greater than that of HBL (0.19%). The
CV of the investment in shares and debentures of ADBN (18.08%) is also greater than that of
NBBL (13.48%) but less than that of HBL (24.74%)
� Provision for Loan Loss Ratio
Table 4.11
Fiscal Year ADBN NBBL HBL
2061/62 38.3016 19.1050 8.2631
2062/63 33.7732 34.0548 6.5856
2063/64 26.3759 51.9162 5.4343
2064/65 14.9136 42.3651 3.4984
2065/66 16.7215 26.5655 2.9297
Mean 26.0172 34.8013 5.3422
SD 9.1749 11.5316 1.9650
CV 35.2646 33.1356 36.7824
Source: Appendix A (11)
The average of provision for loan loss ratio of ADBN is 26.02% which is lower than that of
NBBL (34.80%) but is substantially higher than that of HBL (5.34%). However it can be
noticed that the ratio has improved to 16.72% in the last year of study (FY 2065/66) which was
38.30% in the first year of study (FY 2061/62). The CV of the ratios of all the three banks are
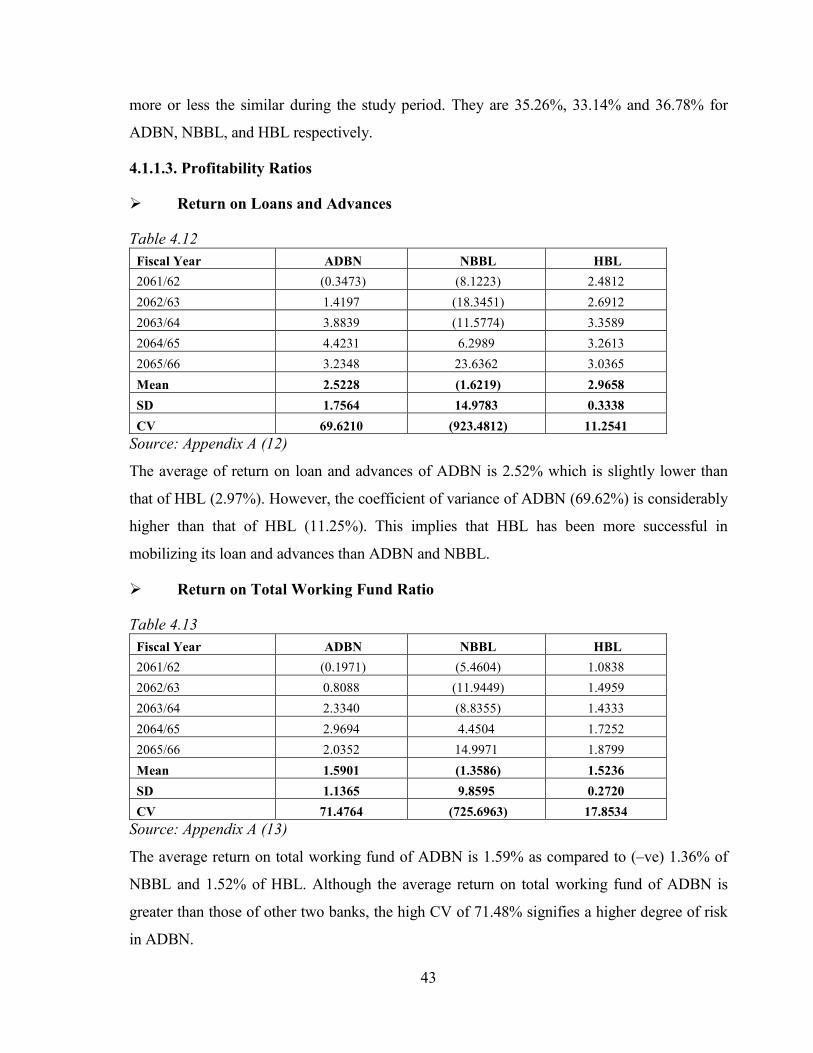
43
more or less the similar during the study period. They are 35.26%, 33.14% and 36.78% for
ADBN, NBBL, and HBL respectively.
4.1.1.3. Profitability Ratios
� Return on Loans and Advances
Table 4.12
Fiscal Year ADBN NBBL HBL
2061/62 (0.3473) (8.1223) 2.4812
2062/63 1.4197 (18.3451) 2.6912
2063/64 3.8839 (11.5774) 3.3589
2064/65 4.4231 6.2989 3.2613
2065/66 3.2348 23.6362 3.0365
Mean 2.5228 (1.6219) 2.9658
SD 1.7564 14.9783 0.3338
CV 69.6210 (923.4812) 11.2541
Source: Appendix A (12)
The average of return on loan and advances of ADBN is 2.52% which is slightly lower than
that of HBL (2.97%). However, the coefficient of variance of ADBN (69.62%) is considerably
higher than that of HBL (11.25%). This implies that HBL has been more successful in
mobilizing its loan and advances than ADBN and NBBL.
� Return on Total Working Fund Ratio
Table 4.13
Fiscal Year ADBN NBBL HBL
2061/62 (0.1971) (5.4604) 1.0838
2062/63 0.8088 (11.9449) 1.4959
2063/64 2.3340 (8.8355) 1.4333
2064/65 2.9694 4.4504 1.7252
2065/66 2.0352 14.9971 1.8799
Mean 1.5901 (1.3586) 1.5236
SD 1.1365 9.8595 0.2720
CV 71.4764 (725.6963) 17.8534
Source: Appendix A (13)
The average return on total working fund of ADBN is 1.59% as compared to (–ve) 1.36% of
NBBL and 1.52% of HBL. Although the average return on total working fund of ADBN is
greater than those of other two banks, the high CV of 71.48% signifies a higher degree of risk
in ADBN.

44
� Return on Equity Ratio (ROE)
Table 4.14
Fiscal Year ADBN NBBL HBL
2061/62 1.3129 * (333.3377) 21.8164
2062/63 (42.3202)* 115.0120* 25.9010
2063/64 83.1401 40.4540* 22.9128
2064/65 26.3516 (27.2189)* 25.3032
2065/66 12.3872 194.0318 24.1302
Mean 16.1743 (2.2117) 24.0127
SD 40.6074 181.2970 1.5019
CV 251.0608 (8,197.0801) 6.2547
[*ratios for the period where the total equity are negative]
Source: Appendix A (14)
On the basis of the return on equity, the performance of ADBN can be considered to be better
than NBBL but cannot be considered as good as that of HBL. The performance of HBL is the
most consistent among the three banks.
� Total Interest Earned to Total outside Assets Ratio
Table 4.15
Fiscal Year ADBN NBBL HBL
2061/62 17.2947 9.1048 11.6420
2062/63 16.1984 7.7389 9.5686
2063/64 16.9640 10.7116 12.1262
2064/65 12.9530 8.7467 10.0713
2065/66 11.8683 14.6444 9.4470
Mean 15.0557 10.1893 10.5710
SD 2.2155 2.4242 1.1031
CV 14.7153 23.7914 10.4347
Source: Appendix A (15)
The above table shows the ratio of total interest earned to total outside assets of the three banks
from FY 2061/62 to FY 2065/66. In the study period, ADBN has earned the highest interest on
total outside assets. The average rate of interest earned to outside assets of ADBN, NBBL and
HBL are 15.06%, 10.19% and 10.57% respectively. The CV of the ratio of ADBN is 14.72%
which is higher than that of HBL but lower than that of NBBL.
� Total Interest Earned to Total Working Fund Ratio

45
Table 4.16
Fiscal Year ADBN NBBL HBL
2061/62 9.8141 6.1208 5.0852
2062/63 9.2285 5.0390 5.3188
2063/64 10.1947 8.1748 5.1744
2064/65 8.6959 6.1798 5.3277
2065/66 7.4670 9.2919 5.8487
Mean 9.0800 6.9613 5.3509
SD 0.9542 1.5438 0.2650
CV 10.5092 22.1770 4.9523
Source: Appendix A (16)
The mean of ADBN is highest (9.08%) as compared to other two banks (6.96% and 5.35% of
NBBL and HBL respectively) and depicts that ADBN is earning better interest as compared to
its total working fund ratio. However the CV of the ratio of ADBN is higher than that of HBL
but lower than that of NBBL.
� Total Interest Earned to Total Operating Income Ratio
Table 4.17
Fiscal Year ADBN NBBL HBL
2061/62 92.2492 80.9204 82.2845
2062/63 95.0523 79.3661 79.6363
2063/64 94.2537 80.1119 82.1735
2064/65 91.2661 68.2015 81.1009
2065/66 88.6333 80.3009 80.1347
Mean 92.2909 77.7801 81.0660
SD 2.2763 4.8150 1.0606
CV 2.4665 6.1905 1.3083
Source: Appendix A (17)
The above table shows that, out of the total operating income of ADBN, interest on loans and
advances has a higher part i.e. 92.29% and the same of HBL and NBBL is 81.07% and 77.78%
respectively. The coefficient of variance of the ratio of ADBN is lower than that of NBBL but
is higher than that of HBL.

46
4.1.1.4. Risk Ratios
� Credit Risk Ratio
Table 4.18
Fiscal Year ADBN NBBL HBL
2061/62 26.5214 19.0398 8.0594
2062/63 27.5452 29.8795 6.1228
2063/64 22.6964 39.7623 4.3819
2064/65 9.3696 31.7324 2.4476
2065/66 11.1212 19.7950 2.2236
Mean 19.4508 28.0418 4.6471
SD 7.7079 7.7899 2.2182
CV 39.6278 27.7796 47.7341
Source: Appendix A (18)
The above table shows that the credit risk ratio of ADBN has significantly decreased in the
later years. It has decreased to 11.12% in the FY 2065/66 which was 26.52% in FY 2061/62.
The average of portion of non-performing loan of ADBN for the study period was 19.45%
which is lower than that of NBBL (28.04%) but higher than that of HBL (4.65%).
� Interest Risk ratio
Table 4.19
Fiscal Year ADBN NBBL HBL
2061/62 87.1134 89.0452 64.7690
2062/63 87.8267 84.0541 81.0406
2063/64 90.3787 111.2981 60.7983
2064/65 121.3189 99.4404 73.8168
2065/66 119.3928 109.8267 80.5026
Mean 101.2061 98.7329 72.1855
SD 15.6852 10.8699 8.1844
CV 15.4983 11.0094 11.3380
Source: Appendix A (19)
From the above table, the interest risk ratio of ADBN is 101.21% which is the highest among
the three banks. The CV of ADBN is 15.5% which is also the highest among the three banks.
These indicate the highest interest risk in ADBN among the three banks.

47
4.2 Statistical analysis
Statistical analysis is performed under this chapter. Following statistical tools has been used for
this purpose:
4.2.1 Trend analysis
4.2.1.1. Trend of Total Deposit
The trend values of the deposits of the three banks based on the data from the fiscal year
2061/62 to 2065/66 and the predicted values of Deposits (in thousand Rs.) up to fiscal year
2070/71 have been shown in the following table.
Table 4.20: Trend of Total Deposit
ADBN NBBL HBL
Mean 31,395,964.40 11,081,602.79 29,575,483.18
a= (3,845,929,212.88) 1,329,409,010.01 (5,148,299,607.18)
b= 1,878,549.02 (638,724.52) 2,508,660.41
Predicted Values for FY
2066/67 37,031,611.46 9,165,429.23 37,101,464.42
2067/68 38,910,160.48 8,526,704.72 39,610,124.83
2068/69 40,788,709.50 7,887,980.20 42,118,785.24
2069/70 42,667,258.52 7,249,255.68 44,627,445.65
2070/71 44,545,807.54 6,610,531.16 47,136,106.07
Source: Appendix B (1)
The deposits of ADBN and HBL have the increasing trend whereas the deposit of NBBL
depicts a decreasing trend. From the above table it can be predicted that the deposits of ADBN
would reach up to Rs. 44,545.8 million in the fiscal year 2070/71. This can be presented by the
following chart.

48
Figure 4. 1
4.2.1.2. Trend of Loans and Advances
The following table shows the trend values of loans and advances of the banks based on the
data of F/Y 2061/62 to 2065/66 and the predicted values (in thousand Rs) of Loan and
advances for the next 5 fiscal years.
Table 4.21: Trend of Loan and Advances
ADBN NBBL HBL
a= (8,834,945,437.06) 281,797,007.76 (5,604,002,856.49)
b= 4,294,997.59 (131,956.61) 2,723,679.27
Predicted Values for FY
2066/67 42,814,573.20 9,042,705.22 25,842,188.40
2067/68 47,109,570.79 8,910,748.61 28,565,867.67
2068/69 51,404,568.38 8,778,792.01 31,289,546.94
2069/70 55,699,565.96 8,646,835.40 34,013,226.20
2070/71 59,994,563.55 8,514,878.80 36,736,905.47
Source: Appendix B (1)
From the above table the loans and advances of ADBN and HBL show an increasing trend
whereas NBBL shows a decreasing trend. All the three banks have the increasing trend. It can
be predicted that the value of the loan and advances of ADBN would reach to Rs. 59,994.56
million in the fiscal year 2070/71. This can be presented by the following chart.

49
Figure 4. 2
4.2.1.3. Trend of Total Investment
The following table shows the trend values of total investments of the banks based on the data
of F/Y 2061/62 to 2065/66 and the predicted values (in thousand Rs) of loan and advances for
the next 5 fiscal years.
Table 4.22: Trend of Total Investment
ADB NBBL HBL
a= (2,957,119,866.25) 342,609,089.20 736,200,142.47
b= 1,434,430.42 (165,050.87) (351,215.65)
Predicted Values for FY
2066/67 7,847,816.03 1,448,936.78 10,237,398.06
2067/68 9,282,246.45 1,283,885.91 9,886,182.41
2068/69 10,716,676.87 1,118,835.03 9,534,966.76
2069/70 12,151,107.29 953,784.16 9,183,751.11
2070/71 13,585,537.72 788,733.29 8,832,535.47
Source: Appendix B (3)
The total investment of ADBN shows the increasing trend but the investment of NBBL and
HBL are decreasing. The total investment of ADBN would reach up to Rs. 13,585.5 million in
the fiscal year 2070/71. This can be presented by the following chart.

50
Figure 4. 3
4.2.1.4. Trend of Total Profit
The following table shows the trend values of total profits of three banks based on the data of
F/Y 2061/62 to 2065/66 and the predicted values (in thousand Rs) of Loan and advances for
the next 5 fiscal years.
Table 4.23: Trend of Total Profit
ADB NBBL HBL
a= (803,697,064.73) (1,707,871,752.03) (219,808,931.94)
b= 389,794.08 827,371.38 106,753.00
Predicted Values for FY
2066/67 2,007,290.36 2,304,898.70 849,510.80
2067/68 2,397,084.43 3,132,270.08 956,263.79
2068/69 2,786,878.51 3,959,641.46 1,063,016.79
2069/70 3,176,672.59 4,787,012.85 1,169,769.78
2070/71 3,566,466.66 5,614,384.23 1,276,522.78
Source: Appendix B (4)
The profits of all the three banks show the increasing trend. From the above, it can be predicted
that the net profit of ADBN would reach to Rs. 3,566.5 million in FY 2070/71. This can be
presented by the following chart.

51
Figure 4. 4

52
4.2.2 Test of Hypotheses
Hypothesis 1
H0: Loan and advances to total deposit ratios of the three banks are equal.
H1: Loan and advances to total deposit ratios of the three banks are not equal.
Table 4.24: ANOVA Table Source of variation Sum of Squares d.f. Mean Squares F-ratio
Bet’n samples SSC= -75,660 C-1=2 MSC= -37,830 F=MSC/MSE
Within samples SSE= 80,647 N-C=12 MSE= 6,721 = -5.63
Total SST= 4,987 N-1=14
F(TAB)(2,12)= 3.89
Source: Appendix C
Since the calculated value of F (5.63) is greater than table value of F =3.89 at 12 degree of
freedom (d.f.) and 5% level of significance, the null hypothesis (H0) is rejected and the
alternative hypothesis (H1) is accepted.
Hypothesis 2
H0: Return on Loans and Advances ratios of the three banks are equal.
H1: Return on Loans and Advances ratios of the three banks are not equal.
Table 4.25: ANOVA Table Source of variation Sum of Squares d.f. Mean Squares F-ratio
Bet’n samples SSC= 220.42 C-1=2 MSC=110.21 F=MSC/MSE Within samples SSE= 981.35 N-C=12 MSE=81.78 =1.35
Total SST=1,201.76 N-1=14
F(TAB)(2,12)= 3.89
Source: Appendix C
Here the calculated value of F (1.35) is less than the table value of F=3.89 at 12 degree of
freedom and 5% level of significance, the null hypothesis is accepted and the alternative
hypothesis is rejected.
Hypothesis 3
H0: Total interest earned to total outside asset ratios of the three banks are equal.
H1: Total interest earned to total outside asset ratios of the three banks are not equal.

53
Table 4.26: ANOVA Table Source of variation Sum of Squares d.f. Mean Squares F-ratio
Bet’n samples SSC=-1,684 C-1=2 MSC=-842 F=MSC/MSE Within samples SSE=1,817 N-C=12 MSE=151 =-5.56
Total SST=133 N-1=14
F(TAB)(2,12)= 3.89
Source: Appendix C
Since the calculated value of F (5.56) is greater than table value of F =3.89 at 12 degree of
freedom and 5% level of significance, the null hypothesis (H0) is rejected and the alternative
hypothesis (H1) is accepted.
4.3 Major findings of the study
The major findings which were generated from this study have been summarized below:
Liquidity Ratio
The liquidity position of ADBN, NBBL and HBL reveals that:
� The mean liquidity ratio of ADBN is higher than that of NBBL and HBL, which
indicates that ADBN has maintained higher liquidity and lower risk in compare to other
two banks. The ratio of ADBN is less variable than that of other two banks which
indicates the more stable liquidity position of ADBN.
� The mean cash reserve ratio of ADBN is greater than that of HBL but lower than that of
NBBL. Cash reserve ratio of ADBN is more stable and consistent than that of other two
banks. This indicates that ADBN has maintained a better position of cash reserve than
HBL but less than NBBL.
� Similarly, the mean ratio of cash and bank balance to current assets also of ADBN is
greater than that of HBL but lower than that of NBBL. This ratio also of ADBN is more
stable and consistent than that of other two banks. This again indicates that ADBN has
maintained a better position of cash and bank balances than HBL but less than NBBL.
� The liquidity position of ADBN from the point of view of investment on Govt.
securities cannot be considered as good as that of other two banks.
54
Asset Management Ratio
� The mean ratio of loans and advances to total deposit of ADBN is higher than that of
other two banks. But ratios are more consistent than that of NBBL and less consistent
than that of HBL. The ratios of ADBN are higher than that of the maximum ceiling as
prescribed by NRB.
� The lowest mean ratio of total investment to deposit of ADBN among the three banks
indicates the lowest amount of investment. However the amount of investment has
substantially increased in the later years.
� The mean ratio of loans and advances to total working fund of ADBN is higher than of
HBL and that lower than of NBBL, which shows that ADBN has provided a greater
portion of working fund as loan and advances than that of HBL. At the same time it is
lower than that of NBBL.
� The mean ratios of investment in Govt. securities to total working fund and to total
domestic deposit of ADBN are the lowest among the three banks. Although the average
of investment in Govt. securities is not sufficient to comply the NRB requirement,
ADBN has succeeded to invest in Govt. securities sufficient amount so as to comply the
NRB requirement in the later years of the study.
� The mean ratio of investment in shares and debentures to total working fund of ADBN is
higher than that of HBL whereas it is lower than that of NBBL. It states that ADBN has
succeed much more in investing it’s fund in shares and debenture as compared to HBL
but less than NBBL in comparison.
� The provision for loan loss of ADBN is better than that of NBBL but not as good as that
of HBL. However, ADBN has substantially improved the position of provision for loan
loss in the later years.
Profitability Ratio
� The average return on loan and advances and on total working fund of ADBN can be
considered satisfactory but the rate of return is not consistent over the study period.

55
� Similarly the return on equity of ADBN also can be considered satisfactory. The return
on equity of ADBN is lower than that of HBL but is better than that of NBBL. However
the rate of return is not consistent over the study period.
� The mean ratio of total interest earned to total outside asset of ADBN is higher than of
other two banks. The ratios of ADBN are also consistent than compared to other two
banks. This states that ADBN is in better position in this regard.
� Similarly, the mean ratio of total interest earned to total working fund of ADBN also is
higher than that of other two banks. The ratios of ADBN are also more consistent than of
other two banks. This states that ADBN is in better position than other two banks in this
regard.
� The mean ratio of total interest earned to total operating income of ADBN is higher than
that of other two banks which indicates that the position of ADBN is much more
satisfactory than that of other two banks. The ratios of ADBN is also consistent than that
of other two banks. However the concentration on interest income only mey lead to
serious consequences.
Risk Ratio
� The credit risk of ADBN is higher than that of HBL but lower than of NBBL which
indicates the higher credit risk. However, the ratio of ADBN has significantly decreased
in the later years.
� The interest rate risk of ADBN is higher than that of other two banks. It indicates the
interest rate structure of ADBN is higher than the average level. In fact, it has crossed the
maximum bench mark.
Trend Analysis
The trend analysis of ADBN, NBBL and HBL reveals that:
� The deposits of ADBN and HBL have the increasing trend whereas the deposit of NBBL
depicts a decreasing trend. The total deposit of ADBN, NBBL and HBL will be Rs.

56
44,545.8M, Rs. 6,610.5M and Rs. 47,136.1M at the end of Ashadh 2071. It states that
the deposit collection position of ADBN is satisfactory as compared to other two banks.
� The loans and advances of ADBN and HBL show an increasing trend whereas NBBL
shows a decreasing trend The total loans and advances of ADBN, NBBL and HBL will
be Rs. 59,994.56M, Rs. 8,514.88M and Rs. 36,736.9M at the end of Ashadh 2071. The
lending position of ADBN is better than other two banks in comparison.
� The total investment of ADBN shows the increasing trend but the investment of NBBL
and HBL are decreasing. The total investment of ADBN would reach up to Rs.
13,585.5M in the FY 2070/71 whereas those of NBBL and HBL would go down to
788.7M and 8,832.5M if the same trend continues.
� The profits of all the three banks show the increasing trend. From the above, it can be
predicted that the net profit of ADBN would reach to Rs. 3,566.5M in FY 2070/71. The
trend shows that the net profit of NBBL is increasing at the highest rate followed by
ADBN.
Test of Hypotheses
The test of hypothesis reveals that
� Loan and advances to total deposit ratio of the three banks are not equal. ADBN has
forwarded a greater amount of loan and advances in proportion to total credit as
compared to NBBL and HBL.
� Return on loan and advances ratios of the three banks can be considered to be equal. This
implies that the banks have been earning similar amounts with respect to the total amount
of loan and advances forwarded by the bank.
� Total interest earned to total outside asset ratios of the three banks are not equal. The data
available reveal that the ratio of ADBN is higher than those of NBBL and HBL. This can
probably be due to a greater concentration of loan and advances in the total assets of
ADBN.

57
CHAPTER –V
SUMMARY, CONCLUSION & RECOMMENDATION
5.1 Summary
� CB plays a vital role in the economic development of the country. They render various
services to their customers which automatically facilitates their economic and their social
life. They are much important for integrated and speedy development a country.
� Joint venture banks are the CBs formed from the joint participation of two or more
enterprise for the purpose of carrying out specific operations such as investment in trade,
business and industries as well as in the form of negotiation between different groups of
industries and trade to facilitate easy in mutual exchange of goods and services.
� The primary objective of every joint venture banks, being operated from private sector, is
to earn profit by investing or granting loans and advances to people associated with trade,
business, industry etc. Though the primary motive of those banks is to earn profit they are
providing quick services to the customers and aids in empowering the economic activities
of the country by investing loans in the development of new and growing business
activities.
� Agricultural Development Bank was established with an objective to raise the economic
condition of farmers by availing credit and capital inputs in easy and smooth manner. The
subsequent amendments of the act empowered the bank to finance small farmers on
group.
� In current scenario there is a very high competition in banking sector in Nepal but
investment alternatives are decreasing day by day, the reason behind it is political
instability, insurgency etc. So banks have to face many problems to survive in this type of
environment. Every bank is following sound investment policy for a purposeful, safe and
profitable investment.
58
� Development of trade, industry and business is the main ground of banks to conduct its
activities and fulfill its profit making objectives. The sound investment policy help all the
banks to make profitable investment and which in turn also helps to develop the
economic condition of the country.
� We can also say that in current scenario the investible market in Nepal is almost saturated
and there is also a high flow of money in the market but less viable and investible sector.
� Most of the CBs operating in Nepal are earning profit and been able to satisfy their
shareholders by providing adequate return which in turn attracts the potential customers
to power their money in bank as there are very few sectors to make a profitable
investment and the investors are always reluctant to risk. Hence there in a lot of deposits
in CBs but very little investment opportunity.
� The basic objective of this study is to evaluate the investment policy adopted by
Agricultural Development Bank and compare it with the policy of Nepal Bangladesh
Bank Ltd. and Himalayan Bank Ltd.
� This study basically depends upon the financial statements published by the respective
banks and secondary data and to make it more attractive and reliable various bank related
journals and past period thesis related to this topic have been consulted.
� Basically there are five principles of sound lending policy i.e. profitability, liquidity,
safety and security, suitability and dispersal. The sound investment policy states that the
funds are distributed in a various assets with good profitability and provides maximum
safety and security to the depositors and bank. Moreover, risk in banking sector trends to
be concentrated in the loan portfolio. When a bank gets into serious financial trouble its
problem usually spring from significant amounts of loan that have become un-collectible
due to mismanagement, illegal manipulation of loan, misguided lending policy or
unexpected economic downturn. Therefore the banks investment policy must be such that
it is sound and prudent in order to protect public funds.
59
� Various process and methods are applied in the study. The data required for the analysis
are directly obtained from financial statement of concerned banks and publication of
NRB.
� Various financial and statistical tools are applied in the study to achieve the objectives of
the study. The analysis of data is done according to the pattern available.
5.2 Conclusion
From the study following points have been concluded:
� The liquidity position of ADBN is good enough as compared to that of NBBL and HBL.
Investment in Govt. securities of ADBN is lower than that of other two banks. However
ADBN has increased the liquidity in Govt. securities in the later years.
� The asset management of ADBN can be considered good enough. It has forwarded the
highest amount of loan and advances in proportion to total deposit. The amount of total
investment and investment in Govt. securities of ADBN is lower than those of other two
banks. However tha amount on investment in Govt. securities in the last year of study is
just enough to comply the requirement of NRB. The provision for loan loss o ADBN lies
between that of NBBL and HBL.
� The performance of ADBN can be considered to be somewhere between the
performances of NBBL and HBL on the basis of return and interest income. The
performance of HBL is the most consistent among the three. ADBN and NBBL have
improved their performance in the later years of the study. ADBN has earned the highest
amount of interest income with respect to the total outsides assets as well as with respect
to the total working fund. However over concentration on interest income would lead to
negative consequences.
� The degree of risk is high in ADBN. The Interest risk is the highest among the three
banks and the Credit Risk also is higher than that of HBL. Credit risk has been reduced
significantly in the later years of study. On the contrary, the interest risk has increased in
the later years of study.

60
� The trend of the Total Deposit, Total loans and Advances and Total Investment of ADBN
shows a fair position of ADBN as compared to that of HBL and NBBL. ADBN has
improved its position in the later years of study.
5.3 Recommendation
From the study, the following recommendations can be made.
� The liquidity position of ADBN is fairly good enough. It should continue the current
position of liquidity. However it should slightly increase the amount of investment in
Govt. securities to improve the quality of liquid assets of the bank.
� There is a substantial portion of loan and advances in ADBN. ADBN should reduce the
concentration of assets on loan and advances with respect to the amount of deposit.
� Non-performing loans consist substantial portion of loan and advances of ADBN.
Accordingly, the provision for loan loss ratio also has remained at fairly high level.
ADBN should focus on reducing the proportion of non-performing loans and improving
the quality of loan and advances forwarded. ADBN should focus on the collection of
expired loans and advances to reduce the loan loss ratio. The policy of ADBN should
ensure rapid identification of delinquent loans, immediate contact with the borrowers and
continual follow up until a loan is recovered. The recovery of loan is the most
challenging job to a bank. Therefore the bank must be very careful in formulating a
sound credit collection policy.
� Portfolio management of bank assets basically means allocation of fund in different
components of a banking components having different degree of risks and varying rate of
return so as to maintain a proper degree of balance between risk and return. The portfolio
condition of ADBN should be carefully examined periodically.
� Profit is a very important for the survival and stability of any organization. The return on
loan and advances, return on working fund and return on equity is the lowest in ADBN.
This may be due to the focus of ADBN on low return areas with higher degree of risk.

61
ADBN should look for other areas of investment with higher return and lower risks so
that it can earn a return sufficient enough for its survival, stability and long term
sustainability.
� The proportion of interest earned in the total earning is greater in ADBN. This shows the
focus of ADBN in lending business only. Lending business is the major source of any
bank. Liberal lending policy helps a bank to make the efficient utilization of its deposits.
However ADBN should try to diversify its business to other areas of banking such as
Merchandise Business, Remittance Business, etc. it should introduce new products and
offer services to the public. Automation of banking activities, networking of branches and
introduction of ABBS services, online banking services, introduction of debit cards and
credit cards, etc. may be some important activities that would probably lead to an
improvement in the performance of ADBN.
� Since both the credit risk and interest rate risk are higher in ADBN, it should decrease the
proportion of loan and advances in the total working fund by acquisition of other types of
assets.
� The study reveals that ADBN has not adopted any cost management strategy to have
control over its cost of funding. Higher interest paid to working fund, higher loan loss
ratio, high administrative cost are some of the reasons behind less profitability of the
bank. So ADBN should try to adopt cost management strategy by applying standard
costing, value analysis, and value added statement and sound capital structure.

62
BIBLIOGRAPHY
Books
� Sharpe, W.J. & Alexander, G.J. (1995). Investments: Prentice-Hall of India Ltd., New Delhi.
� Cheney, J.M. & Moses, E.A. (1973). Fundamentals of Investments: West Publishing Company, USA.
� Jones Charles P. (1991). Investment analysis and Management: Himalayan Publishing House, Mumbai.
� Francis, J.C. (1998). Management of Investments: Harper Collins Publishers, New York.
� Singh, P. (1991). Investment Management: Himalayan Publishing House, Mumbai.
� Van Horne, J. C. (1985). Fundamentals of Financial Management: Prentice Hall of India Ltd., New Delhi.
� Van Horne, J. C. (1998). Financial Management and Policy: Prentice-Hall Pvt. Ltd., New Delhi.
� Shrestha M. K. (1994). Financial Management: Curriculum Development Center, T.U., Kathmandu.
� Weston & Brigham, (1980).Managerial Finance: The Dryden Press, Hinsdale Illinois, USA.
� Wolf, H. K. & Pant, P.R. (1999). Social Science Research and Thesis Writing: Buddha Academic Enterprises Pvt. Ltd., Kathmandu.
Theses
� Panta, U. R. (2033). A Study on investment Policy of Nepal Banks Deposits and its
Utilization: Master’s thesis, T.U.
� Bhattarai, R. (1978). Lending Policy of Commercial Banks of Nepal: Master’s thesis, T.U.
� Ojha, K.(1997) A study on Priority Sector Investment in Commercial Bank (With Special
Reference to Rastriya Banijya Bank): Master’s thesis , T.U. , Kathmandu.
� Pradhan, N.M., (1980). A study on investment policy of Nepal Bank Ltd.: Master’s thesis, T.U.

63
� Khadka, R. R. (1998). A study on investment policy of NABIL Bank in comparison to
other joint venture banks of Nepal: Master thesis Shanker Dev Campus.
Journals, Official Publications and Others Articles
� Bank and Financial Institution Act, 2063.
� Annual Reports of Agriculture Development Bank
� Annual Reports of Nepal Bangladesh Bank Ltd.
� Annual Reports of Himalayan Bank Ltd.
� Commercial Banks Act 2031.
� Unified Directives 2066, other directives and circulars issued by Nepal Rastra Bank.
� Thapa, G. B. (1994) .Financial System of Nepal: Development Vision: Patan Multiple Campus, Lalitpur.
� Shrestha, Dr. S. (2055). Lending Operations of Commercial Banks of Nepal and its
impact on GDP: The Business Voice of Nepal: Banijya Sansar, T.U.
� Shrestha, S. R. (1998). Portfolio Management in commercial Bank Theory and Practice: Nepal Bank Ltd., Kathmandu.
� Bajracharya, B. B. (1990). Monetary Policy and Deposit Mobilization in Nepal: RBB, Kathmandu.

64
APPENDICES
Appendix A: Calculation of Financial Ratios
1. Current Ratio (Rs. In '000) ADBN
FY Current Assets Current Liabilities Ratio
2061/62 28,089,379.02 15,198,420.11 1.848
2062/63 30,467,028.65 17,009,979.19 1.791
2063/64 32,240,726.10 17,490,012.01 1.843
2064/65 38,709,300.00 18,674,890.00 2.073
2065/66 45,763,800.00 20,195,160.00 2.266
NBBL
FY Current Assets Current Liabilities Ratio
2061/62 10,464,177.61 8,656,038.22 1.209
2062/63 10,245,968.75 5,723,170.00 1.790
2063/64 6,450,677.37 4,816,600.00 1.339
2064/65 8,507,135.05 5,917,910.00 1.438
2065/66 10,838,910.86 8,811,900.00 1.230
HBL
FY Current Assets Current Liabilities Ratio
2061/62 25,812,031.05 11,269,000.00 2.291
2062/63 27,486,845.60 11,033,000.00 2.491
2063/64 31,747,414.66 23,170,440.00 1.370
2064/65 34,378,400.99 24,696,000.00 1.392
2065/66 37,255,082.19 27,968,000.00 1.332
2. Cash and Bank Balance to Total Deposit Ratio (Rs.In'000) ADBN
FY Cash and Bank Balance Total Deposit Ratio
2061/62 3,035,038.25 27,223,046.16 11.149
2062/63 4,771,701.11 29,631,817.48 16.103
2063/64 3,689,320.87 32,416,358.36 11.381
2064/65 3,623,900.00 32,553,800.00 11.132
2065/66 5,202,500.00 35,154,800.00 14.799
NBBL
FY Cash and Bank Balance Total Deposit Ratio (%)
2061/62 1,383,229.04 12,125,578.26 11.408
2062/63 1,691,890.82 13,015,136.11 12.999
2063/64 1,141,831.17 9,385,949.55 12.165
2064/65 1,886,114.13 10,883,652.58 17.330
2065/66 2,558,360.21 9,997,697.43 25.589
HBL
FY Cash and Bank Balance Total Deposit Ratio (%)
2061/62 2,014,470.96 24,814,011.98 8.118
2062/63 1,717,352.33 26,490,851.64 6.483
2063/64 1,757,341.26 30,048,417.76 5.848
2064/65 1,448,142.89 31,842,789.36 4.548
2065/66 3,048,526.80 34,681,345.18 8.790

65
3. Cash and Bank Balance to Current Asset Ratio (Rs.In'000)
ADBN
FY Cash and Bank Balance Current Assets Ratio (%)
2061/62 3,035,038.25 28,089,379.02 10.805
2062/63 4,771,701.11 30,467,028.65 15.662
2063/64 3,689,320.87 32,240,726.10 11.443
2064/65 3,623,900.00 38,709,300.00 9.362
2065/66 5,202,500.00 45,763,800.00 11.368
NBBL
FY Cash and Bank Balance Current Assets Ratio (%)
2061/62 1,383,229.04 10,464,177.61 13.219
2062/63 1,691,890.82 10,245,968.75 16.513
2063/64 1,141,831.17 6,450,677.37 17.701
2064/65 1,886,114.13 8,507,135.05 22.171
2065/66 2,558,360.21 10,838,910.86 23.603
HBL
FY Cash and Bank Balance Current Assets Ratio (%)
2061/62 2,014,470.96 25,812,031.05 7.804
2062/63 1,717,352.33 27,486,845.60 6.248
2063/64 1,757,341.26 31,747,414.66 5.535
2064/65 1,448,142.89 34,378,400.99 4.212
2065/66 3,048,526.80 37,255,082.19 8.183
4. Investment on Government Securities to Current Assets Ratio
(Rs.In'000) ADBN
FY
Investment in Govt.
Securities Current Assets Ratio (%)
2061/62 198,191.55 28,089,379.02 0.706
2062/63 397,010.90 30,467,028.65 1.303
2063/64 1,759,614.73 32,240,726.10 5.458
2064/65 2,706,300.00 38,709,300.00 6.991
2065/66 3,474,000.00 45,763,800.00 7.591
NBBL
FY
Investment in Govt.
Securities Current Assets Ratio (%)
2061/62 2,212,535.72 10,464,177.61 21.144
2062/63 2,525,309.17 10,245,968.75 24.647
2063/64 826,834.54 6,450,677.37 12.818
2064/65 1,221,791.99 8,507,135.05 14.362
2065/66 1,715,829.21 10,838,910.86 15.830
HBL
FY
Investment in Govt.
Securities Current Assets Ratio (%)
2061/62 5,469,728.94 25,812,031.05 21.191
2062/63 5,144,313.00 27,486,845.60 18.716
2063/64 6,454,873.47 31,747,414.66 20.332
2064/65 7,471,667.91 34,378,400.99 21.734
2065/66 4,212,300.38 37,255,082.19 11.307

66
5. Loan and Advances to Total Deposit Ratio (Rs.In'000) ADBN
FY Loans and Advances Total Deposit Ratio (%)
2061/62 22,638,255.30 27,223,046.16 83.158
2062/63 24,900,913.54 29,631,817.48 84.034
2063/64 27,252,333.32 32,416,358.36 84.070
2064/65 36,585,400.00 32,553,800.00 112.384
2065/66 38,271,000.00 35,154,800.00 108.864
NBBL
FY Loans and Advances Total Deposit Ratio (%)
2061/62 9,626,913.54 12,125,578.26 79.393
2062/63 9,796,382.95 13,015,136.11 75.269
2063/64 9,169,440.56 9,385,949.55 97.693
2064/65 9,469,632.30 10,883,652.58 87.008
2065/66 9,130,505.84 9,997,697.43 91.326
HBL
FY Loans and Advances Total Deposit Ratio (%)
2061/62 12,424,520.65 24,814,011.98 50.071
2062/63 16,997,997.05 26,490,851.64 64.166
2063/64 14,642,559.56 30,048,417.76 48.730
2064/65 19,497,520.48 31,842,789.36 61.231
2065/66 24,793,155.27 34,681,345.18 71.488
6. Total Investment to Total Deposit Ratio (Rs.In'000) ADBN
FY Total Investment Total Deposit Ratio (%)
2061/62 1,355,832.88 27,223,046.16 4.980
2062/63 1,511,330.02 29,631,817.48 5.100
2063/64 3,177,460.91 32,416,358.36 9.802
2064/65 4,788,700.00 32,553,800.00 14.710
2065/66 6,889,300.00 35,154,800.00 19.597
NBBL
FY Total Investment Total Deposit Ratio (%)
2061/62 2,411,720.07 12,125,578.26 19.890
2062/63 2,661,833.50 13,015,136.11 20.452
2063/64 1,034,560.19 9,385,949.55 11.022
2064/65 1,389,901.50 10,883,652.58 12.771
2065/66 2,222,431.71 9,997,697.43 22.229
HBL
FY Total Investment Total Deposit Ratio (%)
2061/62 11,692,341.56 24,814,011.98 47.120
2062/63 10,889,031.45 26,490,851.64 41.105
2063/64 11,822,984.56 30,048,417.76 39.346
2064/65 13,340,176.79 31,842,789.36 41.894
2065/66 8,710,690.65 34,681,345.18 25.116

67
7. Loans and Advances to Total Working Fund (Rs.In'000) ADBN
FY Loans and Advances Total Working Fund Ratio (%)
2061/62 22,638,255.30 39,893,794.63 56.746
2062/63 24,900,913.54 43,707,456.43 56.972
2063/64 27,252,333.32 45,348,247.15 60.096
2064/65 36,585,400.00 54,496,000.00 67.134
2065/66 38,271,000.00 60,829,300.00 62.915
NBBL
FY Loans and Advances Total Working Fund Ratio (%)
2061/62 9,626,913.54 14,320,077.04 67.227
2062/63 9,796,382.95 15,045,417.82 65.112
2063/64 9,169,440.56 12,014,975.66 76.317
2064/65 9,469,632.30 13,402,850.06 70.654
2065/66 9,130,505.84 14,390,115.34 63.450
HBL
FY Loans and Advances total working fund Ratio (%)
2061/62 12,424,520.65 28,444,805.49 43.679
2062/63 16,997,997.05 30,579,806.20 55.586
2063/64 14,642,559.56 34,314,867.93 42.671
2064/65 19,497,520.48 36,857,624.33 52.900
2065/66 24,793,155.27 40,046,685.89 61.911
8. Investment on Government Securities to Total Working Fund Ratio
(Rs. In ‘000) ADBN
FY
Investment on Govt.
Securities Total Working Fund Ratio (%)
2061/62 198,191.55 39,893,794.63 0.497
2062/63 397,010.90 43,707,456.43 0.908
2063/64 1,759,614.73 45,348,247.15 3.880
2064/65 2,706,300.00 54,496,000.00 4.966
2065/66 3,474,000.00 60,829,300.00 5.711
NBBL
FY
Investment on Govt.
Securities Total Working Fund Ratio (%)
2061/62 2,212,535.72 14,320,077.04 15.451
2062/63 2,525,309.17 15,045,417.82 16.785
2063/64 826,834.54 12,014,975.66 6.882
2064/65 1,221,791.99 13,402,850.06 9.116
2065/66 1,715,829.21 14,390,115.34 11.924
HBL
FY
Investment on Govt.
Securities Total Working Fund Ratio (%)
2061/62 5,469,728.94 28,444,805.49 19.229
2062/63 5,144,313.00 30,579,806.20 16.823
2063/64 6,454,873.47 34,314,867.93 18.811
2064/65 7,471,667.91 36,857,624.33 20.272
2065/66 4,212,300.38 40,046,685.89 10.518

68
9. Investment on Government Securities to Total Domestic Deposit Ratio
(Rs. In ‘000) ADBN
FY
Investment in Govt.
Securities Total Domestic Deposit Ratio (%)
2061/62 198,191.55 27,223,046.16 0.728
2062/63 397,010.90 29,631,817.49 1.340
2063/64 1,759,614.73 32,416,358.36 5.428
2064/65 2,706,300.00 32,553,800.00 8.313
2065/66 3,474,000.00 35,154,000.00 9.882
NBBL
FY
Investment in Govt.
Securities Total Domestic Deposit Ratio (%)
2061/62 2,212,535.72 11,806,864.03 18.739
2062/63 2,525,309.17 12,870,330.15 19.621
2063/64 826,834.54 9,249,121.62 8.940
2064/65 1,221,791.99 10,636,698.75 11.487
2065/66 1,715,829.21 9,817,114.63 17.478
HBL
FY
Investment in Govt.
Securities Total Domestic Deposit Ratio (%)
2061/62 5,469,728.94 18,517,751.83 29.538
2062/63 5,144,313.00 19,818,342.19 25.957
2063/64 6,454,873.47 23,538,247.66 27.423
2064/65 7,471,667.91 25,495,146.91 29.306
2065/66 4,212,300.38 29,822,589.47 14.125
10. Investment on Shares and Debenture to Total Working Fund Ratio(Rs.In'000) ADBN
FY
Investment on Shares and
Debentures Total Working Fund Ratio (%)
2061/62 147,372.30 39,893,794.63 0.369
2062/63 147,372.30 43,707,456.43 0.337
2063/64 145,702.40 45,348,247.15 0.321
2064/65 129,656.40 54,496,000.00 0.238
2065/66 142,985.40 60,829,300.00 0.235
NBBL
FY
Investment on Shares and
Debentures Total Working Fund Ratio (%)
2061/62 62,767.00 14,320,077.04 0.438
2062/63 64,798.00 15,045,417.82 0.431
2063/64 64,798.00 12,014,975.66 0.539
2064/65 56,707.50 13,402,850.06 0.423
2065/66 51,118.50 14,390,115.34 0.355
HBL
FY
Investment on Shares and
Debentures Total Working Fund Ratio (%)
2061/62 39,908.80 28,444,805.49 0.140
2062/63 39,908.80 30,579,806.20 0.131
2063/64 73,423.86 34,314,867.93 0.214
2064/65 89,558.36 36,857,624.33 0.243
2065/66 93,883.36 40,046,685.89 0.234

69
11. Provision for Loan Loss Ratio (Rs.In'000) ADBN
FY Loan Loss Provision Total Loans and Advances Ratio (%)
2061/62 8,670,819.23 22,638,255.30 38.302
2062/63 8,409,832.95 24,900,913.54 33.773
2063/64 7,188,036.08 27,252,333.32 26.376
2064/65 5,456,200.00 36,585,400.00 14.914
2065/66 6,399,500.00 38,271,000.00 16.722
NBBL
FY Loan Loss Provision Total Loans and Advances Ratio (%)
2061/62 1,839,223.16 9,626,913.54 19.105
2062/63 3,336,136.55 9,796,382.95 34.055
2063/64 4,760,427.42 9,169,440.56 51.916
2064/65 4,011,823.47 9,469,632.30 42.365
2065/66 2,425,562.72 9,130,505.84 26.565
HBL
FY Loan Loss Provision Total Loans and Advances Ratio (%)
2061/62 1,026,647.62 12,424,520.65 8.263
2062/63 1,119,416.53 16,997,997.05 6.586
2063/64 795,726.82 14,642,559.56 5.434
2064/65 682,092.69 19,497,520.48 3.498
2065/66 726,363.82 24,793,155.27 2.930
12. Return on Loans and Advances (Rs.In'000) ADBN
FY Net Profit Loans and Advances Ratio (%)
2061/62 (78,632.82) 22,638,255.30 -0.347
2062/63 353,524.88 24,900,913.54 1.420
2063/64 1,058,448.59 27,252,333.32 3.884
2064/65 1,618,200.00 36,585,400.00 4.423
2065/66 1,238,000.00 38,271,000.00 3.235
NBBL
FY Net Profit Loans and Advances Ratio (%)
2061/62 (781,929.58) 9,626,913.54 -8.122
2062/63 (1,797,159.37) 9,796,382.95 -18.345
2063/64 (1,061,579.50) 9,169,440.56 -11.577
2064/65 596,487.03 9,469,632.30 6.299
2065/66 2,158,104.14 9,130,505.84 23.636
HBL
FY Net Profit Loans and Advances Ratio (%)
2061/62 308,275.17 12,424,520.65 2.481
2062/63 457,457.70 16,997,997.05 2.691
2063/64 491,822.91 14,642,559.56 3.359
2064/65 635,868.52 19,497,520.48 3.261
2065/66 752,834.74 24,793,155.27 3.036
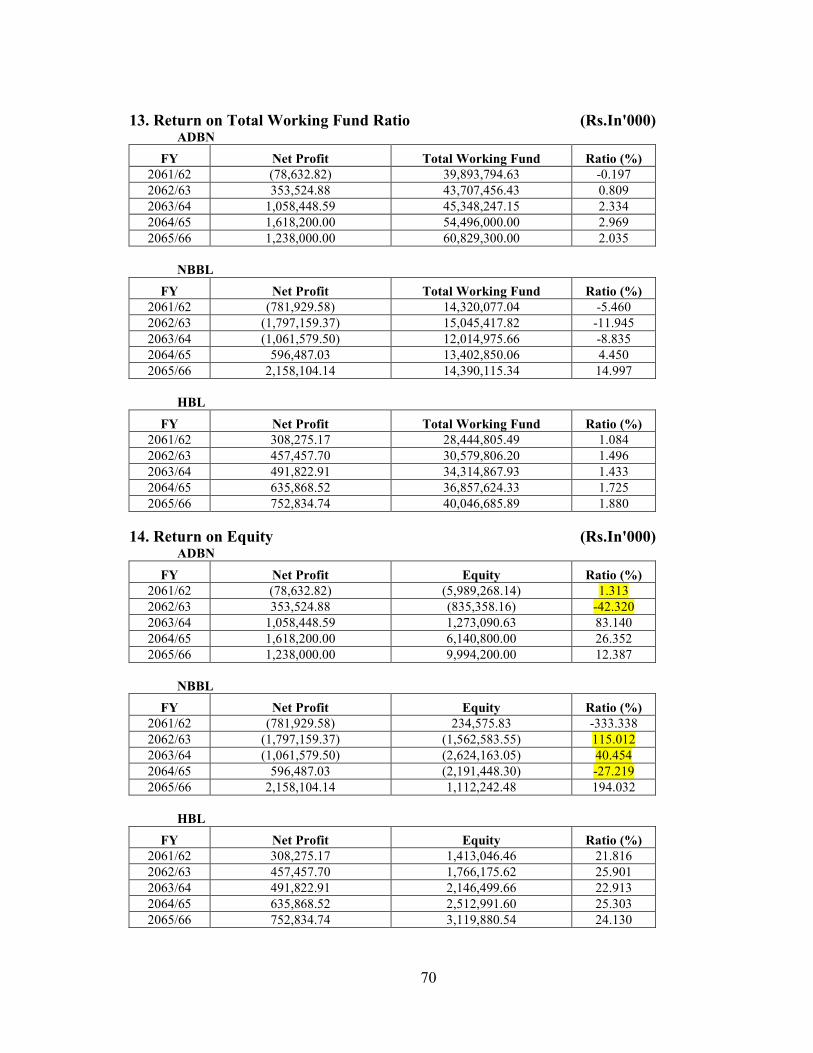
70
13. Return on Total Working Fund Ratio (Rs.In'000) ADBN
FY Net Profit Total Working Fund Ratio (%)
2061/62 (78,632.82) 39,893,794.63 -0.197
2062/63 353,524.88 43,707,456.43 0.809
2063/64 1,058,448.59 45,348,247.15 2.334
2064/65 1,618,200.00 54,496,000.00 2.969
2065/66 1,238,000.00 60,829,300.00 2.035
NBBL
FY Net Profit Total Working Fund Ratio (%)
2061/62 (781,929.58) 14,320,077.04 -5.460
2062/63 (1,797,159.37) 15,045,417.82 -11.945
2063/64 (1,061,579.50) 12,014,975.66 -8.835
2064/65 596,487.03 13,402,850.06 4.450
2065/66 2,158,104.14 14,390,115.34 14.997
HBL
FY Net Profit Total Working Fund Ratio (%)
2061/62 308,275.17 28,444,805.49 1.084
2062/63 457,457.70 30,579,806.20 1.496
2063/64 491,822.91 34,314,867.93 1.433
2064/65 635,868.52 36,857,624.33 1.725
2065/66 752,834.74 40,046,685.89 1.880
14. Return on Equity (Rs.In'000) ADBN
FY Net Profit Equity Ratio (%)
2061/62 (78,632.82) (5,989,268.14) 1.313
2062/63 353,524.88 (835,358.16) -42.320
2063/64 1,058,448.59 1,273,090.63 83.140
2064/65 1,618,200.00 6,140,800.00 26.352
2065/66 1,238,000.00 9,994,200.00 12.387
NBBL
FY Net Profit Equity Ratio (%)
2061/62 (781,929.58) 234,575.83 -333.338
2062/63 (1,797,159.37) (1,562,583.55) 115.012
2063/64 (1,061,579.50) (2,624,163.05) 40.454
2064/65 596,487.03 (2,191,448.30) -27.219
2065/66 2,158,104.14 1,112,242.48 194.032
HBL
FY Net Profit Equity Ratio (%)
2061/62 308,275.17 1,413,046.46 21.816
2062/63 457,457.70 1,766,175.62 25.901
2063/64 491,822.91 2,146,499.66 22.913
2064/65 635,868.52 2,512,991.60 25.303
2065/66 752,834.74 3,119,880.54 24.130

71
15. Total Interest Earned to Total Outside Asset Ratio (Rs.In'000) ADBN
FY Total Interest Earned Total Outside Assets Ratio (%)
2061/62 3,915,224.98 22,638,255.30 17.295
2062/63 4,033,544.58 24,900,913.54 16.198
2063/64 4,623,095.86 27,252,333.32 16.964
2064/65 4,738,900.00 36,585,400.00 12.953
2065/66 4,542,100.00 38,271,000.00 11.868
NBBL
FY Total Interest Earned Total Outside Assets Ratio (%)
2061/62 876,508.41 9,626,913.54 9.105
2062/63 758,131.69 9,796,382.95 7.739
2063/64 982,196.61 9,169,440.56 10.712
2064/65 828,276.00 9,469,632.30 8.747
2065/66 1,337,112.31 9,130,505.84 14.644
HBL
FY Total Interest Earned Total Outside Assets Ratio (%)
2061/62 1,446,468.09 12,424,520.65 11.642
2062/63 1,626,473.82 16,997,997.05 9.569
2063/64 1,775,582.62 14,642,559.56 12.126
2064/65 1,963,647.47 19,497,520.48 10.071
2065/66 2,342,198.18 24,793,155.27 9.447
16. Total Interest Earned to Total Working Fund Ratio (Rs.In'000)
ADBN
FY Total Interest Earned Total Working Fund Ratio (%)
2061/62 3,915,224.98 39,893,794.63 9.814
2062/63 4,033,544.58 43,707,456.43 9.229
2063/64 4,623,095.86 45,348,247.15 10.195
2064/65 4,738,900.00 54,496,000.00 8.696
2065/66 4,542,100.00 60,829,300.00 7.467
NBBL
FY Total Interest Earned Total Working Fund Ratio (%)
2061/62 876,508.41 14,320,077.04 6.121
2062/63 758,131.69 15,045,417.82 5.039
2063/64 982,196.61 12,014,975.66 8.175
2064/65 828,276.00 13,402,850.06 6.180
2065/66 1,337,112.31 14,390,115.34 9.292
HBL
FY Total Interest Earned Total Working Fund Ratio (%)
2061/62 1,446,468.09 28,444,805.49 5.085
2062/63 1,626,473.82 30,579,806.20 5.319
2063/64 1,775,582.62 34,314,867.93 5.174
2064/65 1,963,647.47 36,857,624.33 5.328
2065/66 2,342,198.18 40,046,685.89 5.849

72
17. Total Interest Earned to Total Operating Income Ratio (Rs.In'000) ADBN
FY Total Interest Earned Total Operating Income Ratio (%)
2061/62 3,915,224.98 4,244,185.18 92.249
2062/63 4,033,544.58 4,243,501.85 95.052
2063/64 4,623,095.86 4,904,946.91 94.254
2064/65 4,738,900.00 5,192,400.00 91.266
2065/66 4,542,100.00 5,124,600.00 88.633
NBBL
FY Total Interest Earned Total Operating Income Ratio (%)
2061/62 876,508.41 1,083,173.98 80.920
2062/63 758,131.69 955,233.40 79.366
2063/64 982,196.61 1,226,031.47 80.112
2064/65 828,276.00 1,214,455.08 68.201
2065/66 1,337,112.31 1,665,127.53 80.301
HBL
FY Total Interest Earned Total Operating Income Ratio (%)
2061/62 1,446,468.09 1,757,885.57 82.285
2062/63 1,626,473.82 2,042,376.58 79.636
2063/64 1,775,582.62 2,160,773.04 82.173
2064/65 1,963,647.47 2,421,239.88 81.101
2065/66 2,342,198.18 2,922,825.94 80.135
18. Credit Risk Ratio (Rs.In'000) ADBN
FY
Non Performing Loan and
Advances Total Loan and Advances Ratio (%)
2061/62 6,003,992.67 22,638,255.30 26.521
2062/63 6,858,994.32 24,900,913.54 27.545
2063/64 6,185,295.00 27,252,333.32 22.696
2064/65 3,427,900.00 36,585,400.00 9.370
2065/66 4,256,200.00 38,271,000.00 11.121
NBBL
FY
Non Performing Loan and
Advances Total Loan and Advances Ratio (%)
2061/62 1,832,943.79 9,626,913.54 19.040
2062/63 2,927,108.50 9,796,382.95 29.879
2063/64 3,645,982.54 9,169,440.56 39.762
2064/65 3,004,940.76 9,469,632.30 31.732
2065/66 1,807,385.87 9,130,505.84 19.795
HBL
FY
Non Performing Loan and
Advances Total Loan and Advances Ratio (%)
2061/62 1,001,347.32 12,424,520.65 8.059
2062/63 1,040,757.82 16,997,997.05 6.123
2063/64 641,615.31 14,642,559.56 4.382
2064/65 477,229.22 19,497,520.48 2.448
2065/66 551,309.63 24,793,155.27 2.224

73
19. Interest Risk Ratio (Rs.In'000) ADBN
FY Interest Bearing Assets Interest Bearing Liabilities Ratio (%)
2061/62 22,638,255.30 25,987,124.99 87.113
2062/63 24,900,913.54 28,352,321.75 87.827
2063/64 27,252,333.32 30,153,498.69 90.379
2064/65 36,585,400.00 30,156,400.00 121.319
2065/66 38,271,000.00 32,054,700.00 119.393
NBBL
FY Interest Bearing Assets Interest Bearing Liabilities Ratio (%)
2061/62 9,626,913.54 10,811,267.39 89.045
2062/63 9,796,382.95 11,654,854.19 84.054
2063/64 9,169,440.56 8,238,631.28 111.298
2064/65 9,469,632.30 9,522,925.17 99.440
2065/66 9,130,505.84 8,313,557.76 109.827
HBL
FY Interest Bearing Assets Interest Bearing Liabilities Ratio (%)
2061/62 12,424,520.65 19,182,807.64 64.769
2062/63 16,997,997.05 20,974,669.53 81.041
2063/64 14,642,559.56 24,083,811.20 60.798
2064/65 19,497,520.48 26,413,386.50 73.817
2065/66 24,793,155.27 30,797,946.78 80.503

74
Appendix B: Calculation of Trend Values
1. Trend of Total Deposit Amount in Rs. ‘000
Year ADBN NBBL HBL
x y1 y2 y3 x*y1 x*y2 x*y3 x2
2062 27,223,046 12,125,578 24,814,012 56,133,921,182 25,002,942,372 51,166,492,703 4,251,844
2063 29,631,817 13,015,136 26,490,852 61,130,439,461 26,850,225,795 54,650,626,933 4,255,969
2064 32,416,358 9,385,950 30,048,418 66,907,363,655 19,372,599,871 62,019,934,257 4,260,096
2065 32,553,800 10,883,653 31,842,789 67,223,597,000 22,474,742,578 65,755,360,028 4,264,225
2066 35,154,800 9,997,697 34,681,345 72,629,816,800 20,655,242,890 71,651,659,142 4,268,356
∑x ∑y1 ∑y2 ∑y3 ∑x*y1 ∑x*y2 ∑x*y3 ∑x2
10320 156,979,822 55,408,014 147,877,416 324,025,138,098 114,355,753,506 305,244,073,063 21,300,490
∑ ∑
∑ ∑∑∑−
−=
22
2
)( xxn
xyxyxa
∑ ∑
∑ ∑∑−
−=
22 )( xxn
yxxynb
Trend Values ADBN NBBL HBL
a= (3,845,929,213) 1,329,409,010 (5,148,299,607)
b= 1,878,549 (638,725) 2,508,660
Predicted Values of Total Deposit for
ŷ = a + b* x̂
Year ADBN NBBL HBL
2062 27,638,866 12,359,052 24,558,162
2063 29,517,415 11,720,327 27,066,823
2064 31,395,964 11,081,603 29,575,483
2065 33,274,513 10,442,878 32,084,144
2066 35,153,062 9,804,154 34,592,804
2067 37,031,611 9,165,429 37,101,464
2068 38,910,160 8,526,705 39,610,125
2069 40,788,710 7,887,980 42,118,785
2070 42,667,259 7,249,256 44,627,446
2071 44,545,808 6,610,531 47,136,106

75
2. Trend of Loan and Advances Amount in Rs. ‘000
Year ADBN NBBL HBL
x y1 y2 y3 x*y1 x*y2 x*y3 x2
2062 22,638,255 9,626,914 12,424,521 46,680,082,429 19,850,695,719 25,619,361,580 4,251,844
2063 24,900,914 9,796,383 16,997,997 51,370,584,633 20,209,938,026 35,066,867,914 4,255,969
2064 27,252,333 9,169,441 14,642,560 56,248,815,972 18,925,725,316 30,222,242,932 4,260,096
2065 36,585,400 9,469,632 19,497,520 75,548,851,000 19,554,790,700 40,262,379,791 4,264,225
2066 38,271,000 9,130,506 24,793,155 79,067,886,000 18,863,625,065 51,222,658,788 4,268,356
∑x ∑y1 ∑y2 ∑y3 ∑x*y1 ∑x*y2 ∑x*y3 ∑x2
10320 149,647,902 47,192,875 88,355,753 308,916,220,034 97,404,774,826 182,393,511,005 21,300,490
Trend Values ADBN NBBL HBL
a= (8,834,945,437) 281,797,008 (5,604,002,856)
b= 4,294,998 (131,957) 2,723,679
Predicted Values of Loan and Advances for
FY ADBN NBBL HBL
2062 21,339,585 9,702,488 12,223,792
2063 25,634,583 9,570,532 14,947,471
2064 29,929,580 9,438,575 17,671,151
2065 34,224,578 9,306,618 20,394,830
2066 38,519,576 9,174,662 23,118,509
2067 42,814,573 9,042,705 25,842,188
2068 47,109,571 8,910,749 28,565,868
2069 51,404,568 8,778,792 31,289,547
2070 55,699,566 8,646,835 34,013,226
2071 59,994,564 8,514,879 36,736,905
3. Trend of Total Investment Amount in Rs. ‘000
Year ADBN NBBL HBL
x y1 y2 y3 x*y1 x*y2 x*y3 x2
2062 1,355,833 2,411,720 11,692,342 2,795,727,399 4,972,966,784 24,109,608,297 4,251,844
2063 1,511,330 2,661,834 10,889,031 3,117,873,831 5,491,362,511 22,464,071,881 4,255,969
2064 3,177,461 1,034,560 11,822,985 6,558,279,318 2,135,332,232 24,402,640,132 4,260,096
2065 4,788,700 1,389,902 13,340,177 9,888,665,500 2,870,146,598 27,547,465,071 4,264,225
2066 6,889,300 2,222,432 8,710,691 14,233,293,800 4,591,543,913 17,996,286,883 4,268,356
∑x ∑y1 ∑y2 ∑y3 ∑x*y1 ∑x*y2 ∑x*y3 ∑x2
10320 17,722,624 9,720,447 56,455,225 36,593,839,848 20,061,352,037 16,520,072,264 21,300,490
Trend Values ADBN NBBL HBL
a= (2,957,119,866) 342,609,089 736,200,142
b= 1,434,430 (165,051) (351,216)

76
Predicted Values of Total Investment for
FY ADBN NBBL HBL
2062 675,664 2,274,191 11,993,476
2063 2,110,094 2,109,140 11,642,261
2064 3,544,525 1,944,089 11,291,045
2065 4,978,955 1,779,039 10,939,829
2066 6,413,386 1,613,988 10,588,614
2067 7,847,816 1,448,937 10,237,398
2068 9,282,246 1,283,886 9,886,182
2069 10,716,677 1,118,835 9,534,967
2070 12,151,107 953,784 9,183,751
2071 13,585,538 788,733 8,832,535
4. Trend of net profit Amount in Rs. ‘000
Year ADBN NBBL HBL
x y1 y2 y3 x*y1 x*y2 x*y3 x2
2062
(78,633)
(781,930)
308,275
(162,140,875) (1,612,338,794)
635,663,401 4,251,844
2063
353,525
(1,797,159)
457,458 729,321,827 (3,707,539,780)
943,735,235 4,255,969
2064
1,058,449
(1,061,580)
491,823 2,184,637,890 (2,191,100,088)
1,015,122,486 4,260,096
2065
1,618,200
596,487
635,869 3,341,583,000 1,231,745,717
1,313,068,494 4,264,225
2066
1,238,000
2,158,104
752,835 2,557,708,000 4,458,643,153
1,555,356,573 4,268,356
∑x ∑y1 ∑y2 ∑y3 ∑x*y1 ∑x*y2 ∑x*y3 ∑x2
10320 4,189,541 (886,077) 2,646,259 8,651,109,842 (1,820,589,792) 5,462,946,189 21,300,490
Trend Values
ADBN NBBL HBL
a= (803,697,065) (1,707,871,752) (219,808,932)
b= 389,794 827,371 106,753
Predicted Values of Net Profit for
FY ADBN NBBL HBL
2062 58,320 (1,831,958) 315,746
2063 448,114 (1,004,587) 422,499
2064 837,908 (177,215) 529,252
2065 1,227,702 650,156 636,005
2066 1,617,496 1,477,527 742,758
2067 2,007,290 2,304,899 849,511
2068 2,397,084 3,132,270 956,264
2069 2,786,879 3,959,641 1,063,017
2070 3,176,673 4,787,013 1,169,770
2071 3,566,467 5,614,384 1,276,523

77
Appendix C: Testing of Hypotheses
Hypothesis 1: Loan and Advances to Total Deposit Ratio
Fiscal Year ADB NBBL HBL
x1 x2 x3 (x1)2 (x2)
2 (x3)2
2055/56 83.16 79.39 50.07 6,915.32 6,303.32 2,507.06
2056/57 84.03 75.27 64.17 7,061.78 5,665.45 4,117.22
2057/58 84.07 97.69 48.73 7,067.71 9,543.97 2,374.60
2058/59 112.38 87.01 61.23 12,630.26 7,570.37 3,749.18
2059/60 108.86 91.33 71.49 11,851.42 8,340.45 5,110.60
∑x1 ∑x2 ∑x3 ∑x12 ∑x2
2 ∑x32
472.51 430.69 295.69 45,526.49 37,423.56 17,858.66
T ∑x1+∑x2+∑x3 1,198.89
c.f. T2/N 95,821.84
SST ∑x12+∑x2
2+∑x32-c.f 4,986.87
SSC ∑x12/n1+∑x2
2/n2+∑x32/n3-c.f -75,660.09
SSE SST – SSC 80,646.97
MSC SSC/(k-1) -37,830.05
MSE SSE/(N-k) 6,720.58
F calculated MSC/MSE -5.63
F(TAB)(2,12) 3.89
Decision
H0 : REJECT H1 : ACCEPT

78
Hypothesis 2: Return on Loan and Advance
Fiscal Year ADB NBBL HBL
x1 x2 x3 (x1)2 (x2)
2 (x3)2
2055/56 -0.35 -8.12 2.48 0.12 65.97 6.16
2056/57 1.42 -18.35 2.69 2.02 336.54 7.24
2057/58 3.88 -11.58 3.36 15.08 134.04 11.28
2058/59 4.42 6.30 3.26 19.56 39.68 10.64
2059/60 3.23 23.64 3.04 10.46 558.67 9.22
∑x1 ∑x2 ∑x3 ∑x12 ∑x2
2 ∑x32
12.61 -8.11 14.83 47.25 1,134.90 44.54
T ∑x1+∑x2+∑x3 19.33
c.f. T2/N 24.92
SST ∑x12+∑x2
2+∑x32-c.f 1,201.76
SSC ∑x12/n1+∑x2
2/n2+∑x32/n3-c.f 220.42
SSE SST – SSC 981.35
MSC SSC/(k-1) 110.21
MSE SSE/(N-k) 81.78
F calculated MSC/MSE 1.35
F(TAB)(2,12) 3.89
Decision
H0 : ACCEPT H1 : REJECT

79
Hypothesis 3: The total interest earned to total outside asset ratios
Fiscal Year ADB NBBL HBL
x1 x2 x3 (x1)2 (x2)
2 (x3)2
2055/56 17.29 9.10 11.64 299.11 82.90 135.54
2056/57 16.20 7.74 9.57 262.39 59.89 91.56
2057/58 16.96 10.71 12.13 287.78 114.74 147.04
2058/59 12.95 8.75 10.07 167.78 76.50 101.43
2059/60 11.87 14.64 9.45 140.86 214.46 89.24
∑x1 ∑x2 ∑x3 ∑x12 ∑x2
2 ∑x32
75.28 50.95 52.86 1,157.91 548.49 564.82
T ∑x1+∑x2+∑x3 179.08
c.f. T2/N 2,137.97
SST ∑x12+∑x2
2+∑x32-c.f 133.24
SSC ∑x12/n1+∑x2
2/n2+∑x32/n3-c.f -1,683.73
SSE SST – SSC 1,816.97
MSC SSC/(k-1) -841.86
MSE SSE/(N-k) 151.41
F calculated MSC/MSE -5.56
F(TAB)(2,12) 3.89
Decision
H0 : REJECT H1 : ACCEPT