A COMPARATIVE PERSPECTIVE ON RACIAL RESIDENTIAL SEGREGATION: : American and Canadian Experiences
28
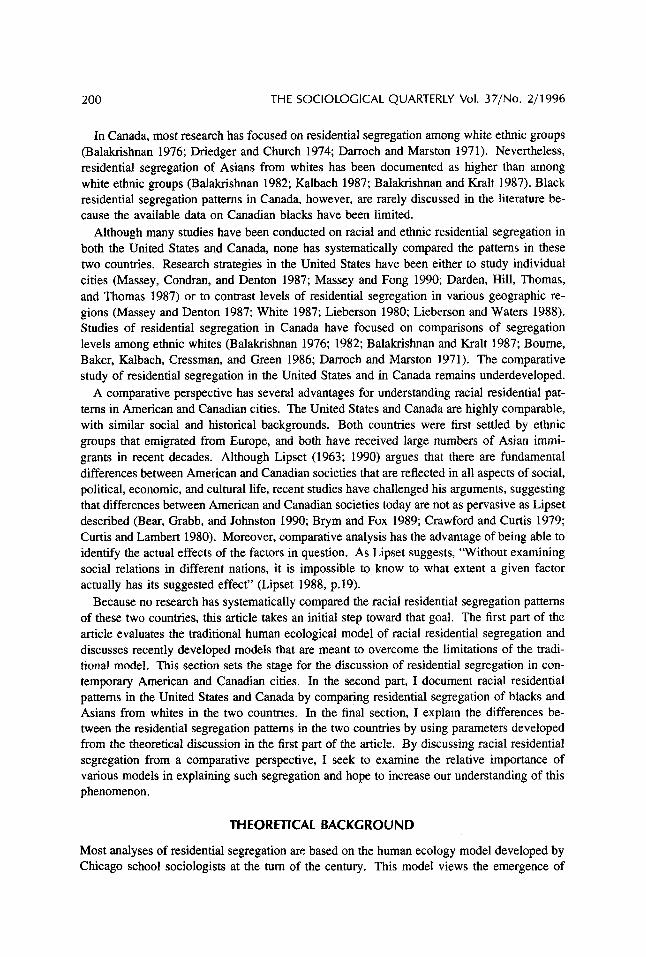
A COMPARATIVE PERSPECTIVE ON RACIAL RESIDENTIAL SEGREGATION: American and Canadian Experiences Eric Fong* University of Toronto This article takes a first step to compare the residential segregation of blacks and Asians from whites in American and Canadian cities. The analysis is based on census data from 404 American and 41 Canadian cities. African Americans in the United States experience a higher level of residential segregation than Asians in U.S. cities. On the other hand, blacks in Canada experience the same low level of segregation as Asians. To explain the different experiences of blacks in the United States and Canada, a multivariate model is proposed and tested. The results reveal several patterns. First, African Americans are con- sistently obstructed much more than Asian Americans by their proportion in the city. In contrast blacks in Canada are not. Second, the residential segregation patterns of African Americans are affected strongly by the labor market and strucutral changes of the economy in the city. However, the structural change of the economy in the city has a very weak effect on the level of residential segregation of Asian Americans, black Canadians, and Asian Canadians. Driving in Detroit and Toronto, one recognizes easily the difference in the racial composi- tion of these two cities. Downtown Toronto is racially mixed. As more Asian and black immigrants moved to Toronto in the last decade, the city became more diversified. Yet, the levels of racial residential segregation remain low. In contrast, Detroit, Toronto’s neighbor to the south, is racially segregated. Detroit blacks there are residentially more concentrated in the central city and despite the various policies adopted by the city government and local private companies, white flight continues. Residential segregation has been a major concern in the sociological literature. Research in the United States has shown that American cities, especially the central cities, are highly segregated by race (Massey and Denton 1987; Farley 1970; 1977; Van Valey, Roof, and Wilcox 1977; Guest and Weed 1976; Bleda 1979; White 1987). With the increase of immi- grants from Asia to the United States over the last few decades, researchers also realize that Asians, whether native-born or newly arrived, also experience residential segregation, though much less than do African Americans (Massey and Fong 1990; Massey and Denton 1987; White 1987). * k t all correspondence to Eric Fong, Department of Sociology. 203 College Sweet, University of Toronto, Toronto, Ontario MST 1P9. ~ The Sociological Quarterly, Volume 37, Number 2, pages 199-226. Copyright 0 1996 by The Midwest Sociological Society. AU rights reserved. Send requests for permission to reprint to: Rights and Permissions, University of California Press, Journals Division, 2120 Berkeley Way, Berkeley, CA 947uI. ISSN: 0038-0253.
Transcript of A COMPARATIVE PERSPECTIVE ON RACIAL RESIDENTIAL SEGREGATION: : American and Canadian Experiences
A COMPARATIVE PERSPECTIVE ON RACIAL RESIDENTIAL SEGREGATION:
American and Canadian Experiences
Eric Fong* University of Toronto
This article takes a first step to compare the residential segregation of blacks and Asians from whites in American and Canadian cities. The analysis is based on census data from 404 American and 41 Canadian cities. African Americans in the United States experience a higher level of residential segregation than Asians in U.S. cities. On the other hand, blacks in Canada experience the same low level of segregation as Asians. To explain the different experiences of blacks in the United States and Canada, a multivariate model is proposed and tested. The results reveal several patterns. First, African Americans are con- sistently obstructed much more than Asian Americans by their proportion in the city. In contrast blacks in Canada are not. Second, the residential segregation patterns of African Americans are affected strongly by the labor market and strucutral changes of the economy in the city. However, the structural change of the economy in the city has a very weak effect on the level of residential segregation of Asian Americans, black Canadians, and Asian Canadians.
Driving in Detroit and Toronto, one recognizes easily the difference in the racial composi- tion of these two cities. Downtown Toronto is racially mixed. As more Asian and black immigrants moved to Toronto in the last decade, the city became more diversified. Yet, the levels of racial residential segregation remain low. In contrast, Detroit, Toronto’s neighbor to the south, is racially segregated. Detroit blacks there are residentially more concentrated in the central city and despite the various policies adopted by the city government and local private companies, white flight continues.
Residential segregation has been a major concern in the sociological literature. Research in the United States has shown that American cities, especially the central cities, are highly segregated by race (Massey and Denton 1987; Farley 1970; 1977; Van Valey, Roof, and Wilcox 1977; Guest and Weed 1976; Bleda 1979; White 1987). With the increase of immi- grants from Asia to the United States over the last few decades, researchers also realize that Asians, whether native-born or newly arrived, also experience residential segregation, though much less than do African Americans (Massey and Fong 1990; Massey and Denton 1987; White 1987).
* k t all correspondence to Eric Fong, Department of Sociology. 203 College Sweet, University of Toronto, Toronto, Ontario MST 1P9.
~
The Sociological Quarterly, Volume 37, Number 2, pages 199-226. Copyright 0 1996 by The Midwest Sociological Society. AU rights reserved. Send requests for permission to reprint to: Rights and Permissions, University of California Press, Journals Division, 2120 Berkeley Way, Berkeley, CA 947uI. ISSN: 0038-0253.
200 THE SOCIOLOGICAL QUARTERLY Vol. 37/No. 2/1996
In Canada, most research has focuseA on residential segregation among white ethnic groups (Balakrishnan 1976; Driedger and Church 1974; Darroch and Marston 1971). Nevertheless, residential segregation of Asians from whites has been documented as higher than among white ethnic groups (Balakrishnan 1982; Kalbach 1987; Balakrishnan and Kralt 1987). Black residential segregation patterns in Canada, however, are rarely discussed in the literature be- cause the available data on Canadian blacks have been limited.
Although many studies have been conducted on racial and ethnic residential segregation in both the United States and Canada, none has systematically compared the patterns in these two countries. Research strategies in the United States have been either to study individual cities (Massey, Condran, and Denton 1987; Massey and Fong 1990; Darden, Hill, Thomas, and Thomas 1987) or to contrast levels of residential segregation in various geographic re- gions (Massey and Denton 1987; White 1987; Lieberson 1980; Lieberson and Waters 1988). Studies of residential segregation in Canada have focused on comparisons of segregation levels among ethnic whites (Balakrishnan 1976; 1982; Balakrishnan and Kralt 1987; Bourne, Baker, Kalbach, Cressman, and Green 1986; Darroch and Marston 1971). The comparative study of residential segregation in the United States and in Canada remains underdeveloped.
A comparative perspective has several advantages for understanding racial residential pat- terns in American and Canadian cities. The United States and Canada are highly comparable, with similar social and historical backgrounds. Both countries were first settled by ethnic groups that emigrated from Europe, and both have received large numbers of Asian immi- grants in recent decades. Although Lipset (1963; 1990) argues that there are fundamental differences between American and Canadian societies that are reflected in all aspects of social, political, economic, and cultural life, recent studies have challenged his arguments, suggesting that differences between American and Canadian societies today are not as pervasive as Lipset described (Bear, Grabb, and Johnston 1990; Brym and Fox 1989; Crawford and Curtis 1979; Curtis and Lambert 1980). Moreover, comparative analysis has the advantage of being able to identify the actual effects of the factors in question. As Lipset suggests, “Without examining social relations in different nations, it is impossible to know to what extent a given factor actually has its suggested effect” (Lipset 1988, p.19).
Because no research has systematically compared the racial residential segregation patterns of these two countries, this article takes an initial step toward that goal. The first part of the article evaluates the traditional human ecological model of racial residential segregation and discusses recently developed models that are meant to overcome the limitations of the tradi- tional model. This section sets the stage for the discussion of residential segregation in con- temporary American and Canadian cities. In the second part, I document racial residential patterns in the United States and Canada by comparing residential segregation of blacks and Asians from whites in the two countnes. In the final section, I explain the differences be- tween the residential segregation patterns in the two countries by using parameters developed from the theoretical discussion in the first part of the article. By discussing racial residential segregation from a comparative perspective, I seek to examine the relative importance of various models in explaining such segregation and hope to increase our understanding of this phenomenon.
THEORETICAL BACKGROUND
Most analyses of residential segregation are based on the human ecology model developed by Chicago school sociologists at the turn of the century. This model views the emergence of
American and Canadian Experiences 201
racial segregation as a reflection of socioeconomic differentiation along racial lines. The dif- ferences in the socioeconomic resources of various racial groups may be due to factors such as historical context or recency of immigration (Lieberson 1980; Massey 1985). The model predicts further that segregation will decrease when racial groups are socially mobile and have similar socioeconomic resources. In the human ecological model, however, it is also argued that the spatial assimilation process is affected by the level of acculturation. Thus, recent immigrants who have poor English language ability and low levels of education usually prefer to stay close to their ethnic counterparts; this situation, in turn, affects their incentives for spatial assimilation (Massey 1985).
Research has supported the basic hypothesis that residential segregation of minority groups declines as income and education increase among them (White, Biddlecom, and Guo 1993; Massey and Denton 1987; Farley 1970 1977; Van Valey, Roof, and Wilcox 1977; Guest and Weed 1976 Bleda 1979). Using census data, Lieberson’s (1963) study of ten cities showed a general decline in segregation as income and education improved. Recent findings from 1980 census data (Alba and Logan 1993; Massey and Fong 1990 Massey and Denton 1987; White 1987) also show that income and education in general have a negative association with resi- dential segregation for blacks.
In Canada, another country with diverse racial groups, the level of residential segregation of various ethnic groups from the charter groups (i.e., British and French) declines as other eth- nic groups experience socioeconomic achievement (Darroch and Marston 1971 : Balakrishnan 1976; Driedger and Church 1974). In a study of the ten largest metropolitan areas of Canada, Balaluishnan (1982) found that the generalized mean of dissimilarity indexes of all groups in the study decreased from 0.64 for low socioeconomic index tracts to 0.41 for high socioeco- nomic index tracts. The socioeconomic index was constructed from the income, education, and occupation of the population in the tract. In general, the results support the human ecol- ogy model argument that racial segregation decreases when minority groups are socially mo- bile and have socioeconomic resources that are more homogeneous with the majority group.
Research has also shown that racial residential patterns in contemporary society are more complicated than those hypothesized by the human ecology model. Studies have pointed out that not every minority group has experienced the same rate of spatial returns from their socioeconomic achievement. A closer look by Massey, Condran, and Denton’s study (1987) shows that though residential segregation levels decrease as a group’s income improves, blacks are less able than whites to translate socioeconomic gains into spatial outcomes. This is consistent with the findings on the effect of race on the St. Louis housing market by Kain and Quigley (1975). Research on Hispanics and Asians has also found that these two panethnic groups experience different rates of return on social and physical housing environ- ments from their socioeconomic achievement (Alba and Logan 1991; Massey and Fong 1990 Massey and Denton 1987).
Similar results have been found in Canada. Controlling for social status, most of the studies suggest a stable hierarchy for residential segregation among minority groups in Canada (Balakrishnan and Kralt 1987). Whites, except for Eastern Europeans, are least segregated, while “visible minority” groups are most segregated (Kalbach 1987; Richmond 1967; Balakrishnan 1982).
With the mixed results of the effects of socioeconomic resources on racial residential seg- regation, some researchers propose an alternative approach that emphasizes the influence of a city’s structural factors- its labor market and its context- on racial residential segregation
202 THE SOCIOLOGICAL QUARTERLY Vol. 37/No. 2/1996
(Farley and Frey 1994; Massey 1985; Kasarda 1990). City’s labor market here focuses on the structural change in the city’s economy and the status of city’s labor market itself; whereas context refers to the housing market, proportion of minority, ecology of the city, and location (central versus suburban city).
In the last decade, both the American and Canadian economies have undergone structural changes. Both have expanded investment abroad and received tremendous investment from overseas. This increase in international trade has made urban firms less localized. The corpo- ration no longer has strong ties to any specific location. Many manufacturing companies have moved their factories out of cities or even overseas to take advantage of cheaper labor and lower tax rates (Feagin and Smith 1987; Logan and Molotch 1987; Norcliffe, Goldrick, and Muszynski 1986). Many traditional industrial cities in both the United States and Canada have lost huge numbers of manufacturing jobs in recent decades. For example, New York and Philadelphia lost approximately half of their manufacturing jobs between 1970 and 1980 (Kasarda 1990), whereas manufacturing employment in Toronto fell from 178,698 in 1975 to 164,945 in 1980, a loss of almost 10 percent in only five years (Norcliffe, Goldrich, and Muszynski 1986).
Traditional manufacturing jobs have been replaced by jobs that either require high levels of skill and intensive knowledge or are low-paid service jobs (Kasarda 1983; 1985; Ellwood 1986). Many of the blue-collar jobs that required little education, which once constituted the economic backbone of industrial cities, have vanished. More than a million jobs that required less than a high-school education were lost between 1970 and 1986 in the United States. Yet American cities added 322,000 jobs that require more than thirteen years of education in the same period (Kasarda 1990). In Canada, the proportion of manufacturing jobs shrank from 22 to 17 percent between 1975 and 1980, the greatest decrease among all employment categories; the greatest gain in the business services sector, followed by personal services and trade. These three categories increased by an average of 16 percent (Norcliffe,Goldrick, and Mus- zynski 1986).
These changes in the structure of the urban labor market have seriously affected urban blacks in America who formerly filled the blue-collar jobs. Most of the African Americans who have low educational levels remain unemployed and live in devastating poverty (Kasarda 1985; Cuciti and James 1990; Lewin-Epstein 1985). Consequently, they have a lesser chance of improving their living environment. Poverty has become more concentrated geographically as blacks have become increasingly segregated (Kasarda 1990).
The structural changes in economy do not affect all groups equally. A massive influx of Asians to the United States and Canada after 1970 created a drastic growth in the ethnic economy in most of their major cities. The development of the ethnic economy created the dynamics that facilitate the economic achievement of group members (Nee, Sanders, and Sernau 1994). Research has shown that opportunities generated by ethnic businesses allow minority members to achieve socioeconomic success, even when they face harsh competition in the labor market and when the structure of the city economy changes. On the other hand, African Americans in the United States, typically having a low rate of business ownership, may suffer heavily from the changes in the labor market situation. Most self-employed Afri- can Americans engage in the kind of business that does not require employees, such as trans- portation and personal services. As a result, black business ownership has little effect on their community (Logan, Alba, and McNulty 1994). Therefore, with the development of ethnic
American and Canadian Experiences 203
business, Asians in the United States and Canada will be affected less strongly by the struc- tural change of the economy as compared to African Americans.
To understand the effect of the job market on racial residential segregation, we must con- sider not only the change in the composition of the labor force, but also recognize how the status of the job market itself affects racial residential segregation. The status of the job market here refers to the tightness or looseness of the local labor market. When the economy is growing and the need for labor is greater, households have a greater opportunity to improve their socioeconomic resources. This, in turn, can translate into a favorable living environ- ment. However, if the job market in a city is stagnant and the need for labor less, households will have less opportunity to improve their socioeconomic situation. Thus, they will be less able to improve their living environment.
At the city’s structural level, its context also has to be considered to assess the effects of structural factors on racial residential segregation. This context affects the level of segrega- tion in several ways. First, the problem of affordable housing arises when housing costs are far above wages. When local and state governments experience fiscal crises and the federal government faces economic constraints, many financial subsidy programs are cut. Conse- quently, minority groups face the problem of finding affordable housing with fewer socioeco- nomic resources. As their chances to move to better housing decrease, so does their contact with the majority group. Second, a stagnant housing market implies a reduction in the filter- ing down process; individual households have less chance to improve their living conditions and less opportunity for greater spatial contact with charter groups. Third, the ecology of the central city ,with a larger stock of older housing, tends to intensify segregation (Farley and Frey 1994; Massey and Denton 1987). The highly centralized industrial areas that developed in the past encourage poorer racial groups to live close to the workplace and thus minimizing traveling costs (Massey and Denton 1987). Finally, the proportion of a minority group in the city is an important structural element in racial residential patterns. Lieberson (1980) argues that a massive increase in the proportion of a minority population in a city will raise the level of racial awareness among other residents in the city. Most actions and decisions are made along ethnic lines. This situation encourages greater identification of the group and in turn intensifies residential segregation.
In addition to the emphasis on socioeconomic and city structural factors in studying racial residential segregation, another approach is to examine the effect of skin color on racial resi- dential segregation patterns. Research has documented that a darker-skinned population is usually associated with higher residential segregation from people of lighter skin color, even when socioeconomic variations are controlled. Hughes and Hertel (1990) suggest that skin color constitutes the basis for differentiation and preference in American society because whites have a more positive attitude toward groups with light skin. Light-skinned individuals are perceived as biologically related to whites and more ready to assimilate into the society.
Housing audit studies (Wienk, Simonson, and Eggers, 1979; Yinger, 1987) clearly show that African Americans continue to experience discrimination in the housing market. For example, a housing audit study conducted in 1988 reported that 92 percent of white auditors were told that an apartment was available, whereas only 46 percent of the black auditors received that information (Massey and Denton 1993). Although studies in Canada have found that blacks and Asians receive lower returns than whites from their educational achieve- ments and in the workforce when working experiences are controlled (Reitz 1980; Li 1988), the information on the experiences of blacks and whites in the housing market is limited.
204 THE SOClOLOClCAL QUARTERLY Vol. 3 7,”. 2/1996
In sum, three major explanations of racial residential segregation (socioeconomic, city’s structural, and skin color explanations) are presented in the literature. The remaining sections provide a historical perspective on the residential segregation patterns of blacks and Asians from whites in American and Canadian cities, a comparison of the segregation patterns of these two groups from whites, and then an examination of the effects of these factors on racial residential segregation.
HISTORICAL CONTEXT OF RACIAL RESIDENTIAL SEGREGATION IN THE UNITED STATES AND CANADA
Blacks
Most blacks in the United States are descendants of blacks who arrived in the country by forced migration during the slavery period and who settled in rural areas. Large numbers were concentrated in the South before the turn of the century. However, this changed at the beginning of this century. Increasing numbers of blacks moved from the South because of its harsh conditions, and the sudden increase in employment opportunities in the North. This out- migration of blacks from the South accelerated during the 1910s and reached its peak in the 1940s and 1950s. The lack of skills and education of most rural southern blacks limited them to low-paying domestic and manufacturing jobs after they arrived in the North. At the same time, the sudden massive increase of blacks in the northern cities generated an awareness of the blacks’ presence among whites. Faced with limited financial resources and increasing overt discrimination, southern blacks in the North clustered in areas with predominantly black populations. This phenomenon occurred in most large northern cities such as Chicago (Spear 1967; Hirsch 1983), Detroit (Zunz 982), Cleveland (Kusmer 1976), Boston (Thernstrom 1973), and Philadelphia (Dubois 1967).
The residential segregation of blacks from whites was intensified by the suburbanization process before and after World War 11. Blacks stayed behind in central cities because they could not afford suburban housing and found it difficult to obtain mortgages. This high level of residential segregation was reinforced when cities in the United States underwent structural economic changes. Firms moved from the cities to the suburbs or even outside the country because of cheaper labor and lower taxes. Traditional manufacturing jobs were replaced by jobs that required higher levels of education and skill. As a result, blacks with little education were affected seriously; they had less chance to improve their housing environment and to increase their spatial contacts with whites.
Blacks have at least as long a history in Canada as in the United States. Many landed in French North America as a result of the slave trade during the seventeenth century. During the American revolution, the black population increased rapidly. This large influx was caused by the Loyalists’ flight to Canada with their property, including their slaves. In addition, some blacks arrived in Canada in this period because the British offered freedom and resettle- ment to all slaves who fought on the British side (Winks 1971). However, not all these blacks were granted land and those who received land grants fared little better, because their parcels were small, infertile, inconveniently located, and separated from whites (Henry 1973; Clair- mont and Magill 1976). Thus, in rural Nova Scotia, residential segregation of blacks from whites has existed since the eighteenth century.
When Canada abolished slavery in 1833, declaring that all slaves in all Canadian provinces were free, the migration of black fugitive slaves from the United States began. These fugitives did not stay long, however, because the majority returned to the United States after the Civil
American and Canadian Experiences 205
War. With the loss of this major source of black immigration to Canada, its black population in Canada dwindled.
A century later, the situation changed. In the 1970s, the black population increased rapidly because of the changes in immigration regulations. More than 60 percent of the blacks now living in Canada have immigrated since the 1970s. Most of these recently arrived blacks are well-educated, speak fluent French or English, and professional skills. Their strong educa- tional backgrounds and professional training enable them to compete successfully in the labor market. Although studies have shown that blacks have suffered discrimination in the workforce, 13 percent of blacks hold managerial or professional positions. Their median in- come is almost the same as that of Canadians of British or French origin. Thus, because of their small numbers and relatively large socioeconomic resources, Canadian blacks are likely to experience more spatial contact with whites than are blacks in the United States.
ASIANS
The five major Asian ethnic groups- Chinese, Japanese, Korean, Asian Indian, and Filipi- nos- arrived in the United States at different times. They were looking for better opportuni- ties but were received with a hostility (Chan 1991). Most of these early immigrants were occupied exclusively in low-paying jobs in cities because of their low level of education and the severely discriminatory hiring practices before and at the turn of this century. During this period, most Chinese and Japanese clustered in their own communities, where they could protect themselves collectively and obtain ethnic goods and services. However, major immi- gration from China was stopped in 1882 with the passage of the Chinese Exclusion Act. Major immigration from Japan was stopped in 1908 when the Gentlemen’s Agreement was signed between the American and Japanese governments. As a result, the Asian proportion of the US. gradually shrank.
Since the 1960s, when a series of changes occurred in immigration laws, the Asian popula- tion in the United States has increased rapidly. The combination of newly arrived immigrants, earlier immigrants, and native-born Asians complicates the demographic and socioeconomic composition of the Asian population (Daniels 1988). Most of the native-born Asians and some of the immigrants have achieved educational credentials and have strong English skills (Azores 1986; Cabezas, Shinagawa, and Kawaguchi 1986). Most members of this group are engaged in professional occupations and have assimilated into the receiving society without much difficulty. They have settled in areas other than their own ethnic communities. How- ever, both the older and the more recently arrived immigrants with low levels of education and poor English skills have stayed in their ethnic communities to obtain employment (Zhou and Logan 1991; Sanders and Nee 1987). The bipolar occupational composition of the Asian population suggests that the level of residential segregation of Asians from whites in Ameri- can cities is moderate.
More precisely, the moderate level of residential segregation has resulted from the balance of the low level of residential segregation for those Asians who have high incomes and high levels of education and the relatively high level of residential segregation of those Asians who have low levels of income and education. Since the latter group of Asians is found mostly in ethnic communities located in large cities, the level of residential segregation is likely to be higher in larger American cities.
Like Asians in the United States, Asians in Canada experienced hostility at the turn of this century. They, too, were almost completely isolated from the main society and lived in their
206 THE SOCIOLOGICAL QUARTERLY Vol. 3 7/No. 2/1996
ethnic own communities. Because they faced discrimination, their everyday lives and con- tacts with Canadian society were dictated by their contractors. Nevertheless, the passage of the Chinese Immigration Act in 1923 and the Gentlemen's Agreement with the Japanese government substantially limited the number'of immigrants from the two major sending coun- tries in Asia.
As the political environment and racial attitudes changed after World War 11, various dis- criminatory laws were repealed. With the change of immigration policy in 1967, whereby immigration was based on a point system with no regard for racial and ethnic background (Finkel 1986), the Asian population in Canada increased dramatically. The newly arrived Asians are a selected, homogeneous group with similar socioeconomic backgrounds. Many are Chinese from Hong Kong; most are highly educated, economically well off, and able to speak English well. The similarity between the experiences of Asians in Canada and the United States suggests that Asians in Canada also should experience only a moderate level of racial residential segregation, except in older cities, where ethnic communities exist.
DATA
This analysis is based on census data. Those for the United States are drawn mainly from the Summary Tape Files 4 (STF4A) (U.S. Bureau of Census 1983). Data for Canada are taken from the 1986 Census 2B profile (Statistics Canada 1986) and three special requested tables. Census data from the two countries are highly comparable. Both countries have similar sam- pling procedures; both require every person and housing unit to be enumerated on a question- naire for basic demographic information; and both require about twenty percent of the population to complete a longer questionnaire for additional information ( U S Bureau of the Census, 1983; Statistics Canada 1988).
The basic unit of analysis is the census tract. However, a tract was deleted from this study if more than forty percent of the population in that tract is institutionalized (i.e., serving in the military or living in institutions such as hospitals and prisons). Census tracts were chosen for analysis because both American and Canadian censuses utilize the same definition of the census tract. Both define census tracts as small, socially homogeneous geostatistical areas established in urban communities with an average size of four thousand persons (U.S. Bureau of the Census 1983; Statistics Canada 1988).
In addition, the census tract is also the smallest geographic unit to provide most racial and ethnic data. Because of confidentiality requirements, tract data are suppressed if a racial group contains fewer than thlrty people in the American census, or if any category of a tabula- tion for a racial group contains fewer than five people in the Canadian census. If a smaller unit is used, such as an enumeration district, which has an average population of 600 in the United States and 450 in Canada, the chances are greater that minority groups will fail to meet the confidentiality criteria and that more information will be suppressed. Although data at the census tract level are not free of confidentiality problems, they are more accurate than those tabulated for other small geographical units.
Instead of basing the analysis on metropolitan areas, segregation indices are computed to measure the degree of residential segregation within selected municipalities. Standard Metro- politan Statistical Areas (SMSAs) or Consolidated Metropolitan Areas (CMAs) are not used in this study for several reasons. First, although the SMSA of the American census and CMA of the Canadian census are both defined as geostatistical areas that are socially and economi- cally integrated, the criteria for the classification of an area as an SMSA or a CMA differ
American and Canadian Experiences 207
(U.S. Bureau of the Census 1983; Statistics Canada 1988). The U.S. census defines an SMSA as the counties surrounding a central city of at least 50,000 population, where these counties meet additional criteria; the Canadian census defines a CMA as the main labor market of an urban area of at least 100,000 population, provided that the municipalities meet certain crite- ria. The U.S. criteria for inclusion of an area are based on the percentage of commuting population and population density of the area, whereas the Canadian criteria for inclusion are only based on the commuting population, with no population density requirement (Nadwodny, Puderer, and Forstall 1990). As a result, the Canadian definition tends to include less territory in densely settled areas than the American definition but is more inclusive in sparsely settled areas (Nadwodny, Puderer, and Forstall 1990). When the Canadian criteria are applied to New York State, for example, its metropolitan areas lose about two-thirds of their land and one-sixth of their population.
These different criteria for inclusion in a metropolitan area not only affect comparability, but also the level of residential segregation, since it depends on the geographical distribution of racial groups. Certain racial groups may be excluded systematically from the metropolitan area under the criteria of one country, but included according to the criteria of the other. The calculation of segregation indices for municipalities instead of SMSAsICMAs can therefore serve the purposes of theoretical consistency as well as comparability.
The place code in the SW4A file of the US. census allows one to determine easily which particular tract belongs to which municipality. The Canadian municipality is reconstructed using information obtained from the Census Tract Manual in Census Recensement Series (Statistics Canada 198%). This publication provides detailed information on identifying all enumeration areas within each tract and linking individual municipalities to each enumeration area. All tracts in the Canadian census, by definition, are composed of certain numbers of enumeration areas. Each enumeration area has a similar population size and is constructed so that no area crosses the boundary of a city. Thus, if the boundaries of a census tract cross a city boundary, the tract data are adjusted to the proportion of the enumeration area included in the municipality.
Some 404 U.S. municipalities and 41 Canadian municipalities are selected for analysis on the basis of two criteria.’ First, the municipality must be large enough to allow a sensible analysis; only municipalities with populations of 25,000 or more were selected. Second, to ensure that municipalities contain relatively large numbers of blacks and Asians, Langberg and Farley’s approach (1985) was adopted. They computed segregation measures only when the number of a racial group in the population was ten times the number of tracts in the city. This criterion has the advantage of assuring the reliability of the segregation indices. In this analysis, however, the criterion is raised to a larger factor than the original one: municipalities are selected when the number of each racial group, blacks and Asians, is twenty times greater than the number of tracts.2
The measurement of race is derived differently for the two countries. The 1986 Canadian census did not ask any question that would identify a respondent’s race. The construction of the race variable for Canadian data is based on an ethnic origin question, which was coded according to an exhaustive list of groups provided in the Census Dictionary (Statistics Canada 1987a). For present purposes, respondents of the following origins were classified as white: French, British, Western European, Northern European, Southern European, “French and Brit- ish”, “French and others” and “British and others.” To avoid the problem of double-counting “French and others” and “British and others”, the number of respondents in those groups are
208 THE SOCIOLOGICAL QUARTERLY Vol. 37/No. 2/1996
divided by two3. Asians are defined to include those ethnic groups listed as Asians in the U.S. census dictionary (U.S. Bureau of Census 1983). Black Canadians were identified directly from the ethnic question. “Black” was added in the ethnicity question in the 1986 census as a response to the Canadian government’s Equality in Employment Program.
Respondents of Hispanic origin are excluded from the analysis because of the small propor- tion of Hispanics in Canada, and also to avoid the type II error. Since Hispanics can be white, black, or Asian and the Canadian data do not provide information on the racial identity of the Hispanics population, there is high a possibility of accepting a case as Hispanic when the respondent is not actually a member of that population group. As the Hispanic population has distinctive residential patterns from blacks and Asians, the inclusion of Hispanic popula- tion in the Canadian analysis may affect the results.
For American municipalities, whites, blacks, and Asians are defined directly from the race question. To be consistent with the Canadian racial categories, white Hispanics, black His- panics, and Asian Hispanics are subtracted from the white, black, and Asian within-tract populations.
MEASURES OF SEGREGATION
In recent years, numerous indices have been proposed to measure the level of segregation. Debates have concentrated on the accuracy and effectiveness of one index versus another (Cortese, Falk, and Cohen 1976; James and Taeuber 1985; Theil and Finizza 1971; White 1986). However, Massey and Denton (1988) have recently argued that various segregation indices actually measure different dimensions of spatial segregation. They performed factor analysis on twenty such indices and confirmed their assertions.
Following Massey and Denton’s argument, several segregation indices are used to measure different aspects of segregation. The first index is the dissimilarity index:
t, I pi-p I D = C i=l ZTp(1-P)
where Z, and p i are the total population and proportion of a minority group in areal unit i, P is the proportion of a minority racial group of the whole city, and T is the city’s population. The dissimilarity index measures the evenness of the distribution of racial groups. If a minority group is distributed unevenly, this indicates that group members are “overrepresented in some areas and underrepresented in others” (Massey and Denton 1988, p. 283). This index has the advantage of being easy to interpret. It indicates the percentage of a given population group that would have to redistribute itself in order to achieve the same percentage distribution as the other groups across the tracts of a city. Complete evenness yields the minimum value 0; complete segregation yields the maximum value 1. The dissimilarity index, however, is af- fected by random departures from evenness when the proportion of minority population in a city ( P ) is small.
To measure the exposure dimension of segregation, isolation and interaction indices are used. Unlike the dissimilarity index, the isolation index does not measure how the distribution of a minority population departs from some ideal of evenness; rather, it measures the actual segregation by taking into account the relative size of the population. The formula for the isolation index is
American and Canadian Experiences 209
where xiand ti are the numbers of X group members and the total population of areal unit i , and X represents the number of X group members in the city. As in the dissimilarity index, the isolation index varies from 0 to 1. It can be understood as the probability that two persons randomly selected from a census tract belong to the same population group (Massey and Denton 1988). A higher value signifies greater segregation.
The final segregation index employed in the study is the interaction index:
This index can be interpreted as the probability that two persons randomly selected from the same tract belong to different groups. If only two groups are assumed, then xPy* = 1- Y X P *. The interaction index is asymmetrical, so the likelihood of interaction between a member of group x and a member of group y is not the same as the likelihood of interaction between a member of group y and a member of group x. Therefore, xPy*#yPx*. Instead, xPy*=yPx*(X/Y), where X and Y are the total populations of groups X and Y in the city.
RESULTS Because this analysis includes 404 US. and 41 Canadian cities, space limitations do not allow me to present all of the segregation indices calculated €or individual cities (results available request). The summary statistics of the segregation indices are reported in Table 1. Table 2 displays selected segregation indices of major municipalities with populations greater than 350,000 for American cities and greater than 110,000 for Canadian cities, where the majority of urbanized blacks and Asians live.
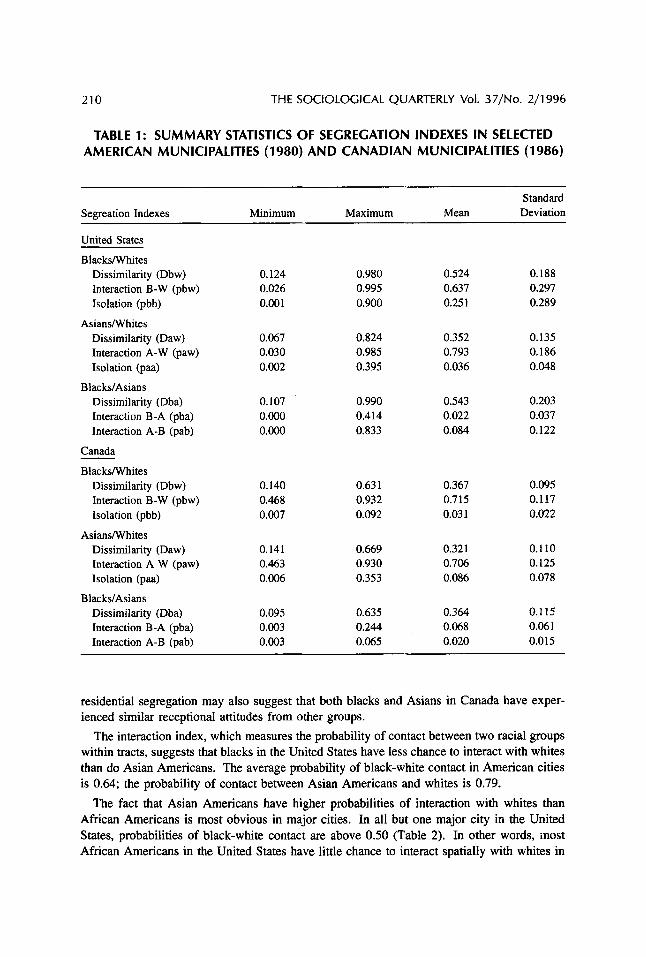
Table 1 presents a familiar picture of residential segregation in the United States, where residential segregation of blacks is generally higher than that of Asian Americans. The aver- age black-white dissimilarity index in the United States is 0.52; the maximum is 0.98. The average for Asian Americans, however, is 0.35, much lower than for African Americans. The same pattern is reflected in Table 2. The black-white dissimilarity indices for most of the major cities in the United States are above 0.70; in contrast, all of the Asian-white dissimilar- ity indices in major cities are below 0.60. Results suggest the skewness of the distributions of the segregation indices. Minorities in major cities experience higher level of residential segre- gation from whites.
Blacks and Asians in Canada, however, experience similar levels of residential segregation: the average dissimilarity score is 0.37 for blacks and 0.32 for Asians. Major cities in both countries display similar levels of residential dissimilarity. The dissimilarity indices of blacks in relation to whites in the three largest Canadian cities (Montreal, Toronto, and Vancouver) are around 0.30 to 0.50 (Table 2). Asians' dissimilarity indices for these three cities are at similar levels. Similar levels of residential segregation of blacks and Asians from whites may reflect that both groups have similar socioeconomic backgrounds. Most blacks and Asians are highly selected groups who immigrated to Canada in the 1970s. However, the similar level of
21 0 THE SOCIOLOGICAL QUARTERLY Vol. 3 7/No. 2/1996
TABLE 1: SUMMARY STATISTICS OF SEGREGATION INDEXES IN SELECTED AMERICAN MUNICIPALITIES (1980) AND CANADIAN MUNICIPALITIES (1986)
Segreation Indexes Minimum
United States
BlacksNhites Dissimilarity (Dbw) Interaction B-W (pbw) Isolation (pbb)
Dissimilarity (Daw) Interaction A-W (paw) Isolation (paa)
Dissimilarity (Dba) Interaction B-A (pba) Interaction A-B (pab)
AsiansNhites
Blacks/Asians
Canada
BlackslWhites Dissimilarity (Dbw) Interaction B-W (pbw) Isolation (pbb)
Dissimilarity (Daw) Interaction A-W (paw) Isolation (paa)
Dissimilarity (Dba) Interaction B-A (pba) Interaction A-B (pab)
AsianslWhites
BlackslAsians
0.124 0.026 0.00 1
0.067 0.030 0.002
0. I07 0.000 O.OO0
0.140 0.468 0.007
0.141 0.463 0.006
0.095 0.003 0.003
Maximum Mean Standard Deviation
0.980 0.995 0.900
0.824 0.985 0.395
0.990 0.414 0.833
0.63 1 0.932 0.092
0.669 0.930 0.353
0.635 0.244 0.065
0.524 0.637 0.25 1
0.352 0.793 0.036
0.543 0.022 0.084
0.367 0.715 0.031
0.321 0.706 0.086
0.364 0.068 0.020
0.188 0.297 0.289
0.135 0.186 0.048
0.203 0.037 0.122
0.095 0.117 0.022
0.110 0.125 0.078
0.1 15 0.061 0.0 15
residential segregation may also suggest that both blacks and Asians in Canada have exper- ienced similar receptional attitudes from other groups.
The interaction index, which measures the probability of contact between two racial groups within tracts, suggests that blacks in the United States have less chance to interact with whites than do Asian Americans. The average probability of black-white contact in American cities is 0.64; the probability of contact between Asian Americans and whites is 0.79.
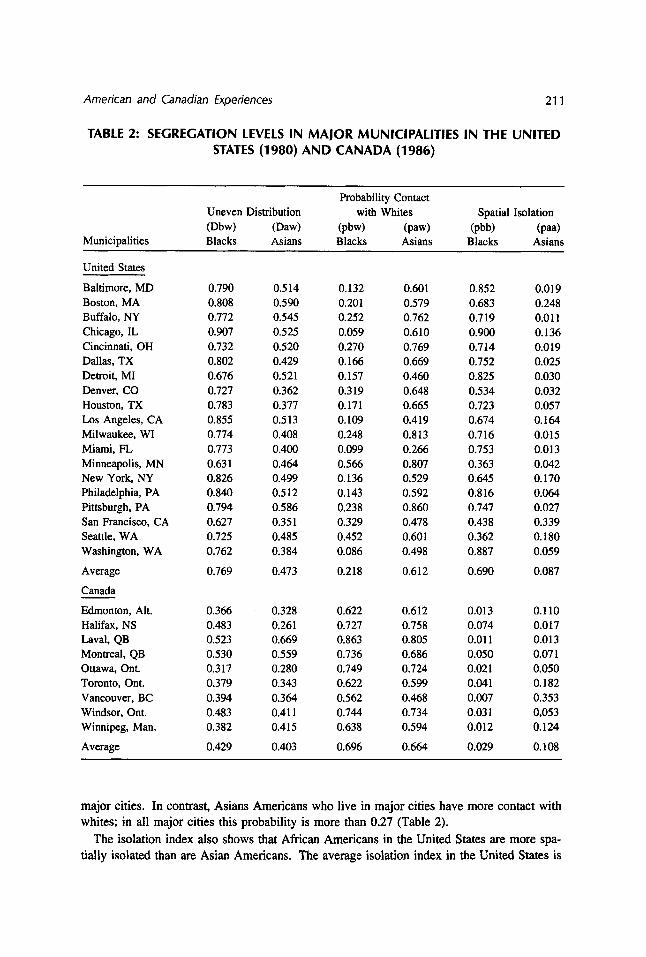
The fact that Asian Americans have higher probabilities of interaction with whites than African Americans is most obvious in major cities. In all but one major city in the United States, probabilities of black-white contact are above 0.50 (Table 2). In other words, inost African Americans in the United States have little chance to interact spatially with whites in
American and Canadian Experiences 21 1
TABLE 2: SEGREGATION LEVELS IN MAJOR MUNICIPALITIES IN THE UNITED STATES (1980) A N D CANADA (1986)
Probability Contact Uneven Distribution with Whites Spatial Isolation (Dbw) (PbW (paw) (pbb) (Pa)
Municipalities Blacks Asians Blacks Asians Blacks Asians
United States
Baltimore, MD Boston, MA Buffalo, NY Chicago, IL Cincinnati, OH Dallas, TX Detroit, MI Denver, CO Houston, TX Los Angeles, CA Milwaukee, WI Miami, FL Minneapolis, MN New York, NY Philadelphia, PA Pittsburgh, PA San Francisco, CA Seattle, WA Washington, WA
Average
Canada
Edmonton, Alt. Halifax, NS Laval, QB Montreal, QB Ottawa, Ont. Toronto, Ont. Vancouver, BC Windsor, Ont. Winnipeg, Man.
Average
0.790 0.808 0.772 0.907 0.732 0.802 0.676 0.727 0.783 0.855 0.774 0.773 0.63 1 0.826 0.840 0.794 0.627 0.725 0.762
0.769
0.366 0.483 0.523 0.530 0.317 0.379 0.394 0.483 0.382
0.429
0.5 14 0.590 0.545 0.525 0.520 0.429 0.521 0.362 0.377 0.513 0.408 0.400 0.464 0.499 0.5 12 0.586 0.351 0.485 0.384
0.473
0.328 0.261 0.669 0.559 0.280 0.343 0.364 0.41 1 0.4 15
0.403
0.132 0.201 0.252 0.059 0.270 0.166 0.157 0.319 0.171 0.109 0.248 0.099 0.566 0.136 0.143 0.238 0.329 0.452 0.086
0.218
0.622 0.727 0.863 0.736 0.749 0.622 0.562 0.744 0.638
0.696
0.601 0.579 0.762 0.610 0.769 0.669 0.460 0.648 0.665 0.419 0.813 0.266 0.807 0.529 0.592 0.860 0.478 0.601 0.498
0.612
0.612 0.758 0.805 0.686 0.724 0.599 0.468 0.734 0.594
0.664
0.852 0.683 0.719 0.900 0.714 0.752 0.825 0.534 0.723 0.674 0.716 0.753 0.363 0.645 0.816 0.747 0.438 0.362 0.887
0.690
0.013 0.074 0.01 1 0.050 0.021 0.041 0.007 0.03 1 0.012
0.029
0.019 0.248 0.011 0.136 0.0 19 0.025 0.030 0.032 0.057 0.164 0.015 0.013 0.042 0.170 0.064 0.027 0.339 0.180 0.059
0.087
0.1 10 0.017 0.0 13 0.07 1 0.050 0.182 0.353 0,053 0.124
0.108
major cities. In contrast, Asians Americans who live in major cities have more contact with whites; in all major cities this probability is more than 0.27 (Table 2).
The isolation index also shows that African Americans in the United States are more spa- tially isolated than are Asian Americans. The average isolation index in the United States is
21 2 THE SOCIOLOGICAL QUARTERLY Vol. 37/No. 2/1996
0.25 for blacks, but only 0.04 for Asian Americans. African Americans in major American cities are highly segregated; only three municipalities have an isolation index below 0.50 (Table 2). In some major cities, such as Chicago and Detroit, the index is above 0.80 (Table 2). In contrast, Asian Americans have not experienced systematic spatial isolation in any major city; all isolation indices for this group are below 0.30. (Table 2)
Probabilities of blacks’ and Asians’ contact with whites in Canada are similar. The average probabilities of contact with whites for blacks and for Asians are about 0.72 and 0.71, respec- tively (Table 1); in all major Canadian cities, blacks and Asians have a high probability of contact with whites. Likewise, average isolation indices of blacks from whites in major Cana- dian cities are around 0.10 (Table 2). For Asians, the index is also about 0.10 in all major Canadian cities except Toronto. The level in Toronto is slightly higher because of the high proportion of recent Asian immigrants in that city.
Blacks in the United States have a higher level of spatial isolation, a more uneven distribu- tion, and a lower likelihood of interaction with whites than do Asian Americans. The levels of black residential segregation are particularly high in all major American cities, whereas Asian Americans experience low or moderate levels everywhere. In Canada, blacks and Asians display similar levels of racial residential segregation. Neither groups experiences high level of spatial isolation. These findings, however, may reflect only the differences be- tween blacks’ and Asians’ socioeconomic status in the two countries.
TABLE 3: MEDIAN EDUCATION AND INCOME OF BLACKS AND ASIANS IN THE UNITED STATES (1980) AND CANADA (1986)
~~
Blacks Asians Mean S.D. Mean S.D.
United States
Median Education Median Income (in U.S.$ x 1,000)
Canada
12.79 1.07 14.10 1.52
15.85 6.46 19.64 6.88
Median Education 14.00 1.19 14.34 1.37 Median Income 19.96 5.3 1 22.81 3.05 (in 1979 US,$ x 1,OOO)
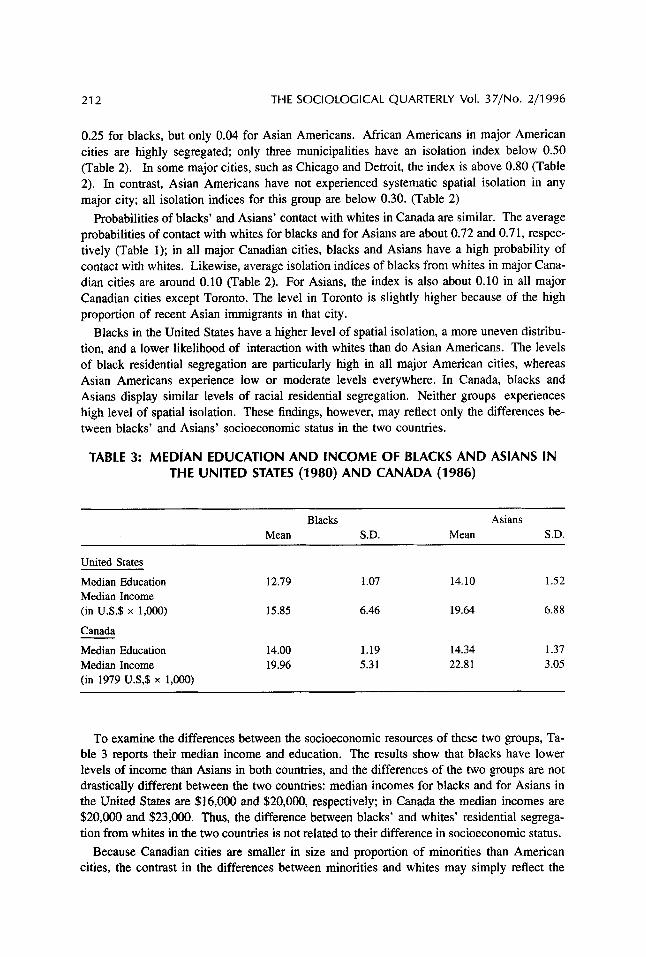
To examine the differences between the socioeconomic resources of these two groups, Ta- ble 3 reports their median income and education. The results show that blacks have lower levels of income than Asians in both countries, and the differences of the two groups are not drastically different between the two countries: median incomes for blacks and for Asians in the United States are $16,000 and $20,000, respectively; in Canada the median incomes are $20,000 and $23,000. Thus, the difference between blacks’ and whites’ residential segrega- tion from whites in the two countries is not related to their difference in socioeconomic status.
Because Canadian cities are smaller in size and proportion of minorities than American cities, the contrast in the differences between minorities and whites may simply reflect the
American and Canadian Experiences 21 3
TABLE 4: SPATIAL PAlTERNS OF BLACKS A N D ASIANS IN SELECTED AMERICAN MUNICIPALITIES (1980) AND CANADIAN MUNICIPALITIES (1986),
BY DEMOGRAPHIC AND MUNICIPAL CHARACTERISTICS
Probability Contact
(Dbw) (PbW) (paw) (pbb) (pa@ Municipalities Blacks Asians Blacks Asians Blacks Asians
Uneven Distribution with Whites Spatial Isolation
United States
Region Northeast North Central South West
Location Suburban Central
Minority Proportion Small Medium Large
Small Medium Large
Canada
Region
Municipal Size
Atlantic Quebec Ontario West
Small Medium Large
Small Medium Large
Minority Proportion
Municipal Size
0.517 0.567 0.613 0.413
0.475 0.620
0.479 0.453 0.637
0.463 0.49 1 0.617
0.363 0.336 0.381 0.389
0.244 0.140 -
0.193 0.140 0.288
0.418 0.377 0.390 0.261
0.3 14 0.423
0.446 0.335 0.273
0.323 0.329 0.402
0.300 0.346 0.3 15 0.299
0.303 0.257 0.141
0.141 0.170 0.185
0.649 0.732 0.47 1 0.648
0.751 0.418
0.897 0.703 0.321
0.784 0.701 0.432
0.756 0.821 0.672 0.623
0.562 0.468 -
0.795 0.468 0.482
0.793 0.868 0.785 0.716
0.826 0.730
0.820 0.831 0.730
0.863 0.798 0.721
0.763 0.818 0.664 0.596
0.805 0.758 0.463
0.804 0.463 0.466
0.258 0.227 0.448 0.130
0.140 0.466
0.016 0.136 0.593
0.143 0.169 0.437
0.046 0.030 0.038 0.010
0.007 0.018 -
0.022 0.014 0.007
0.028 0.021 0.023 0.068
0.033 0.041
0.013 0.022 0.073
0.021 0.042 0.045
0.0 18 0.036 0.101 0.158
0.006 0.014 0.028
0.006 0.017 0.007
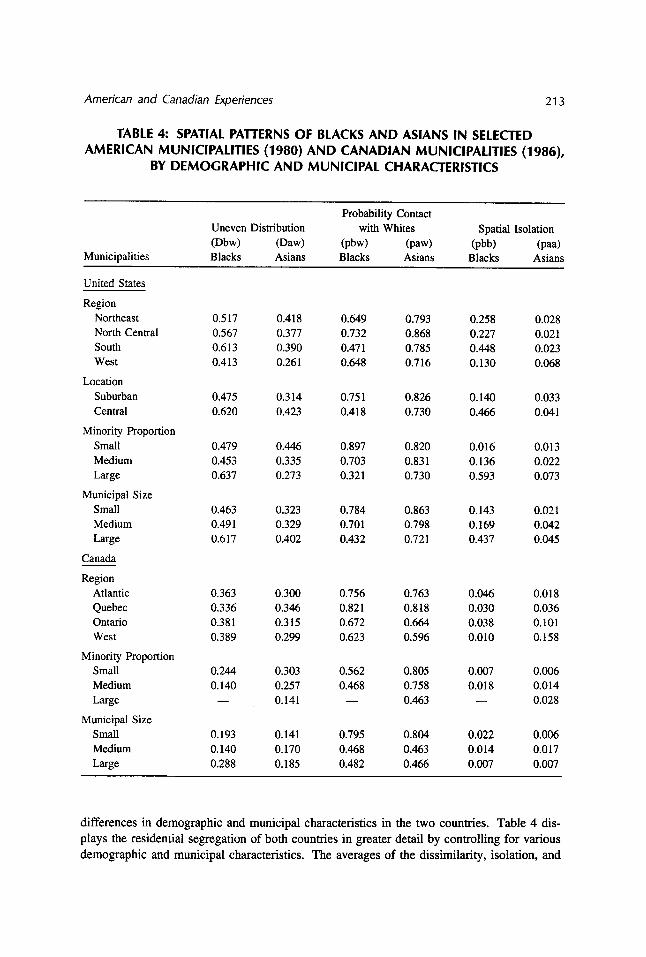
differences in demographic and municipal characteristics in the two countries. Table 4 dis- plays the residential segregation of both countries in greater detail by controlling for various demographic and municipal characteristics. The averages of the dissimilarity, isolation, and
21 4 THE SOCIOLOGICAL QUARTERLY Vol. 37/No. 2/1996
interaction indices are calculated for characteristics such as region, suburban or central loca- tion, proportion of minorities, and size of municipality. We use the same categories of pro- portion of minorities and size of municipality for both countries to ensure comparability: each category is based on the cutoff point of American municipalities. For example, American cities that are included in the category of highest proportion of minorities of American cities consist of the one-third with the highest minority proportion. The next one-third of the cities are classified as medium minority proportion. Cities with the lowest proportion of minority include only the bottom one-third. The same principle applies to cutoff points for municipal size.
Indices suggest that residential distributions are more uneven for blacks in the United States than in Canada even after controlling for demographic or municipal factors. The proportion of blacks in a city does not change this relationship: whether the city has a small or medium- sized proportion of blacks, racial residential segregation remains higher among American blacks.
The results also suggest that blacks in the United States are more spatially isolated in south- ern cities and less segregated in the western cites. Further, blacks in the United States are much more highly segregated in the central cities4; the average spatial isolation of blacks in the central cities is almost five times as great as that of blacks living in the suburbs. In addition, the results show that blacks experience more residential segregation as the black population and the size of the municipality increase.
The level of residential segregation of blacks in Canada remains low even after controlling for regional or municipal characteristics. Although blacks in Nova Scotia have been docu- mented as experiencing high residential segregation from whites, our analysis does not show higher residential segregation of blacks from whites in the Atlantic region than elsewhere in Canada. One obvious reason for this finding is that most blacks in Nova Scotia live in rural areas. Therefore, the high level of segregation in Nova Scotia is not reflected in this Canadian data set, which only includes urban areas. In short, the differences between residential segregation of blacks and Asians from whites
in the two countries do not reflect merely the differences in the socioeconomic status of the two minority groups or the demographic and municipal characteristics of the two countries. The preliminary analyses seem to suggest that a positive relationship between dark skin and racial residential segregation exists in the United States but not in Canada.
A CAUSAL EXPLANATION OF RESIDENTIAL SEGREGATION
To fully explore the differences in blacks’ and Asians’ segregation levels in the United States and in Canada, I employ a multivariate model derived from the earlier discussion. The model suggests that racial residential segregation patterns in contemporary society are affected not only by socioeconomic status and recency of immigration, but also by the labor market and the urban structural context. In this analysis, socioeconomic status is measured by the median income and median edu-
cational level of the racial group, whereas recency of immigration is measured by the propor- tion of native-born group members in the city. A small proportion of native-born group members in the area suggests a large proportion of immigrants. According to the model, the level of residential segregation is hypothesized to be high in a city with a large proportion of immigrants who rely on ethnic networks and have relatively little incentive to assimilate spa-
American and Canadian Experiences 27 5
tially. Yet, because most black Americans are native-born, the proportion of native-born group members does not apply to the model for this group.
I construct two variables to measure the restructuring of the labor and the job markets The first variable represents a gross measure of the changes in the manufacturing industry in the municipality over the past ten years and captures the economic restructuring of the municipal- ity. The U.S. data for 1970 were obtained from County and City Data Book (U.S. Bureau of Census 1977); the Canadian data for 1975 were collected from Manufacturing Industries of Canada (Statistics Canada 1976). For this first variable, a value less than 1 suggests a de- crease in the number of manufacturing jobs in the past ten years. Thus, the possibility of spatial assimilation will be lower because racial groups with lower educational levels will be affected more strongly in declining manufacturing industries (McCreary, England, and Farkas 1989). The second variable, job competition, is the ratio of the possible working-age popula- tion to the total employment in the city.’ In other words, this variable is the ratio of demand to supply in the city’s labor market. It measures overall job opportunities and summarizes the strength of the city’s economy. A larger value suggests more intense competition for jobs. In conditions of stiff competition, minority groups with little education will suffer most (Glenn 1963; McCreary, England, and Farkas 1989) because they have fewer economic resources to translate into improvement of spatial integration.
Urban structural context refers to the housing market, the proportion of minorities, the ecological structure, and the location of each city. The housing market affects residential segregation through two mechanisms: the availability of affordable housing and the state of the housing market. Individual households seeking affordable housing and living in a city with a weak housing market will have less chance to improve their living environment. Avail- ability of affordable housing is measured by the ratio of the median value of housing to the median household income of the racial group in question. The state of the housing market is captured by the inflation rate for housing, which is the ratio of the current median housing price to the median housing price ten years previously. A higher rate implies a tight housing market and a limited filtering-down process. The 1970 U. S. data on housing values are obtained from County and City Data Book (U. SBureau of Census 1977). Because data on 1976 housing values are not available in the 1976 Canadian census, I obtained those values by linear interpolation of 1971 and 1981 housing values from the Canadian census (Statistics Canada 1971; 1981). The proportion of minorities in the city is measured by the proportion of a minority group in the entire city population. The minority members include only the groups (blacks or Asians) in the model rather than the entire nonwhite population. Because the black population is larger in American than in Canadian cities, comparative research is an ideal way to test the importance of the proportion of minorities in the city on residential segregation. The probability of contact with whites is related mathematically to the popula- tion composition. Therefore, the inclusion of this variable not only has theoretical signifi- cance but also acts as a control variable.
The age of a city with a large stock of older housing is indicated by the proportion of housing built before 1950 in the United States and before 1946 in Canada. The location of the city is denoted by the dummy variable, which is 1 when the municipality is classified by the census as central city. This variable does not apply to Canadian models because Canadian municipalities do not receive such official classifications in their censuses.
To estimate the effects of the various proposed factors on the level of racial residential segregation, I use interaction and dissimilarity indices as dependent variables to measure the
21 6 THE SOCIOLOGICAL QUARTERLY Vol. 37/No. 2/1996
spatial interaction and the uneven distribution of residential patterns, respectively. The results of using the interaction index as the dependent variable are similar when the dissimilarity index is used. Thus, the following discussion only reports the results of using the interaction index as the dependent variable. (results of using the dissimilarity index as the dependent variable are available upon request.) The isolation index is not included in the analysis be- cause the mathematical composition of the index depends strongly on the proportion of the minority group in the city. Thus, multicollinearity may occur. In addition, because the sum of the isolation and interaction indices is very nearly unity, the additional regression on the isola- tion index would be almost redundant of the regression on the interaction index. Because a wide range of municipalities from small towns to large cities, such as New York and Toronto, are represented in the data set, weighted least squares regression is used. In addition, the index is bounded from 0 to 1, which may violate the normal distribution estimation assump- tion and produce invalid significant tests. Thus, they are transformed into logits (logit (p)= log [p/( 1-p)]) to avoid violating the estimation assumptions.
Analyzing the data in two separate models has a limitation. Because the calculations of the significance tests of the independent variables in the regression analysis are related to sample size, the large difference between sample sizes in the American, (n = 404) and Canadian (n = 41) models may suggest that the results of the significance tests will be very different. The sample size effect will tend to reduce standard errors for the United States., for results that would otherwise be equivalent. This study, however, focuses on the relative strength of the coefficients for explaining the segregation level rather than on the actual value of a particular coefficient. Thus, the comparison is legitimate. Nevertheless, results should be interpreted cautiously.
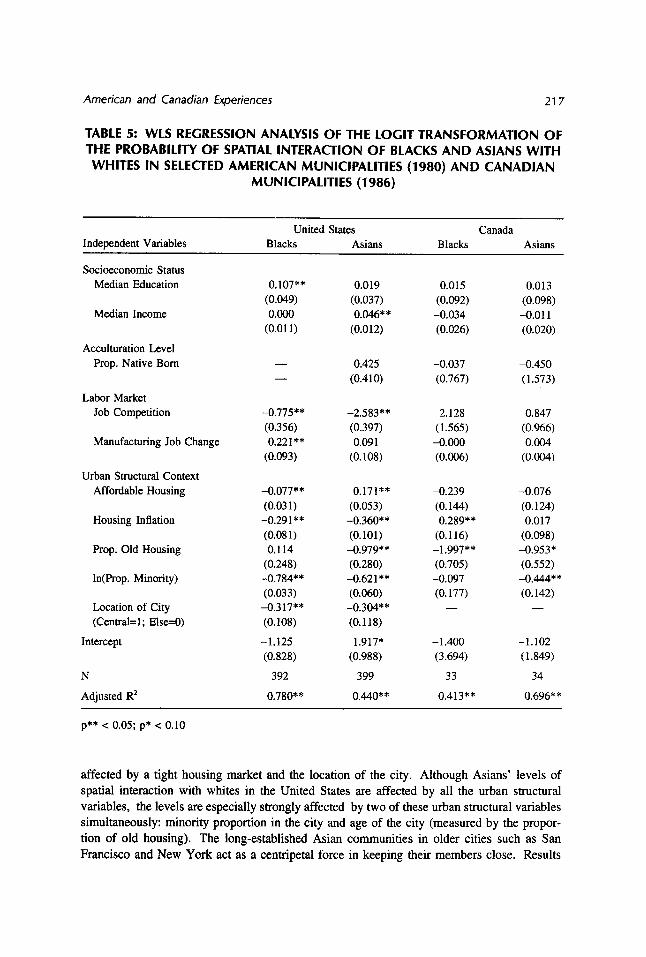
Table 5 reports the results of WLS regression of the logit transformation of the interaction index, which measures the probability of contact with whites, on factors derived from the proposed model. The results suggest that the spatial interaction patterns of blacks and Asians with whites in the United States are affected by different sets of factors. For the effects of socioeconomic status on the levels of spatial interaction with whites, the spatial interaction of blacks with whites is higher when blacks’ educational levels improve, whereas the spatial interaction of Asians with whites is affected strongly by income levels. Blacks’ income levels and Asians’ educational levels have minimal effects on their spatial interaction with whites.
The spatial interaction between blacks and Asians with whites is also affected by different sets of city labor market factors. The levels of spatial interaction between blacks and whites in the United States are affected strongly by both the job market and the change in manufactur- ing jobs. If the job market is weak and manufacturing jobs decline in the local market, spatial interaction between blacks and whites will be reduced. In contrast, the spatial interaction of Asian Americans with whites is affected strongly only by the job market and not by the change in manufacturing jobs. These results suggest that Asian Americans are more able to adapt to structural change in the economy because ethnic economies sometimes minimize the effects of the decline in manufacturing employment to their socioeconomic achievements (Zhou 1992):
Similarly, spatial interaction between the two minority groups with whites is affected by different sets of urban contextual variables. In light of all urban contextual variables, the residential segregation level of blacks is affected strongly by the minority proportion in the city. This finding reflects an earlier point. American blacks are especially highly segregated in cities with high proportions of blacks. In addition, their residential segregation level is also
American and Canadian Experiences 21 7
TABLE 5: WLS REGRESSION ANALYSIS O F THE LOCIT TRANSFORMATION OF THE PROBABILITY OF SPATIAL INTERACTION OF BLACKS A N D ASIANS WITH WHITES IN SELECTED AMERICAN MUNICIPALITIES (1 980) A N D CANADIAN
MUNICIPALITIES (1986)
United States Canada Independent Variables Blacks Asians Blacks Asians
Socioeconomic Status Median Education
Median Income
Acculturation Level Prop. Native Born
Labor Market Job Competition
Manufacturing Job Change
Urban Structural Context Affordable Housing
Housing Inflation
Prop. Old Housing
In(Prop. Minority)
Location of City (Central=l; Else=O)
Intercept
N
Adjusted R2
0.107** (0.049) O.OO0
(0.01 1)
- -
-0.775** (0.356) 0.221**
(0.093)
-0.077** (0.03 1)
(0.08 1 ) 0.114
(0.248)
(0.033) -0.317** (0.108)
-0.291**
-0.784**
-1.125 (0.828)
392
0.780**
0.019 (0.037) 0.046**
(0.012)
0.425 (0.410)
-2.583** (0.397) 0.091
(0.108)
0.17 1 ** (0.053) -0.360** (0.101) -0.979** (0.280) -0.62 1 ** (0.060) -0.304** (0.118)
1.917* (0.988)
399
0.440**
0.015 (0.092) -0.034 (0.026)
-0.037 (0.767)
2.128 (1.565) -0.000 (0.006)
-0.239 (0.144) 0.289**
(0.116)
(0.705)
(0.177)
- 1.997**
-0.097
-
-1.400 (3.694)
33
0.413**
0.013 (0.098) -0.01 1 (0.020)
-0.450 (1.573)
0.847 (0.966) 0.004
(0.004)
-0.076 (0.124) 0.017
(0.098) -0.95 3 * (0.552) -0.444** (0.142) -
-1.102 ( 1.849)
34
0.696**
p** c 0.05; p* c 0.10
affected by a tight housing market and the location of the city. Although Asians’ levels of spatial interaction with whites in the United States are affected by all the urban structural variables, the levels are especially strongly affected by two of these urban structural variables simultaneously: minority proportion in the city and age of the city (measured by the propor- tion of old housing). The long-established Asian communities in older cities such as San Francisco and New York act as a centripetal force in keeping their members close. Results
21 8 THE SOCIOLOGICAL QUARTERLY Vol. 37/No. 2/1996
also suggest that Asian residential segregation is lower in areas that experience more severe problem of affordable housing. This finding is somewhat anomalous.
In Canada, the relationships of both groups’ levels of spatial interaction with whites and the job market are not statistically significant. This finding shows that both blacks and Asians in Canada may remain competitive even in a weak job market and they are not affected by the decline in manufacturing jobs in the city. However, both blacks’ and Asians’ levels of spatial interaction with whites in Canada are affected strongly by the age of the city. An old city- one with a large proportion of old housing-tends to intensify blacks’ and Asians’ segrega- tion from whites. In addition, blacks’ levels of spatial interaction with whites are also moder- ately affected by the housing market situation, whereas Asians’ levels of spatial interaction are related to their proportion in the city. More specifically, a high level of housing inflation which implies a limited filtering-down process increases the level of spatial interaction of blacks and whites in Canada. However, the result is not in the expected direction.
In short, in spite of a few anomalous coefficients in the models, results in general confirm the discussion. The results also show that the differences between blacks’ and Asians’ resi- dential segregation levels with whites in the United States can be explained by the fact that the two minority groups axe affected by different factors. Blacks’ residential segregation levels are related strongly to the job market, structural change in the economy, and several housing structural contexts. Since the 1970s, when the job market became tight and the number of manufacturing jobs began to decline, African Americans’ economic situation has suffered and they have experienced a high level of residential segregation in most major American cities. In contrast, Asian Americans’ levels of residential segregation are affected strongly by the job market and housing structural contexts. In Canada, however, both blacks’ and Asians’ levels of spatial interaction with whites do not relate to either of the labor market variables, the job competition and manufacturing job change, both are strongly affected by the same urban structural factor - the age of the city.
POOLED MODEL ANALYSIS
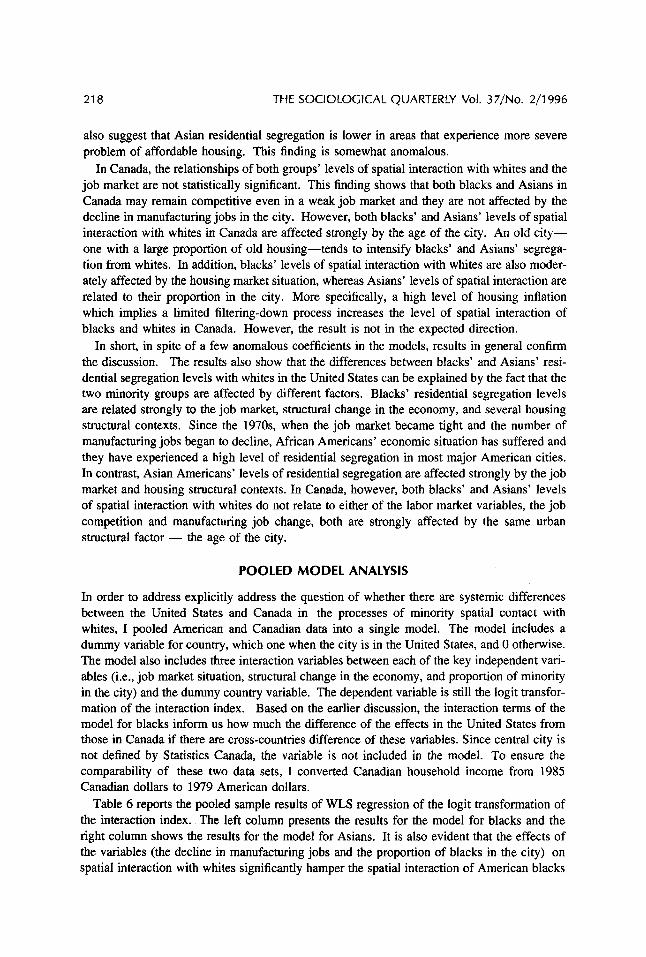
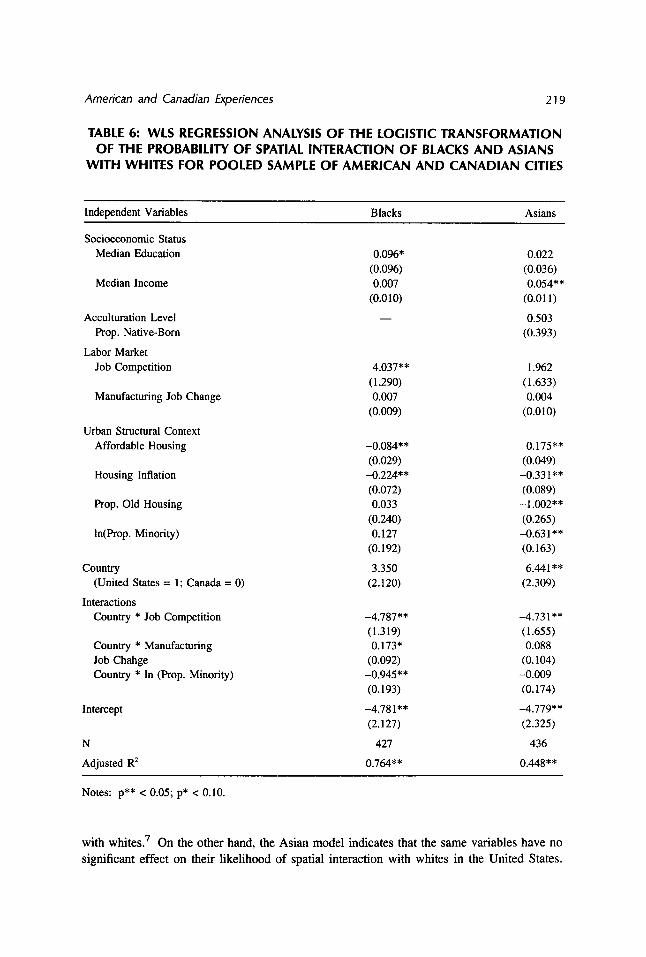
In order to address explicitly address the question of whether there are systemic differences between the United States and Canada in the processes of minority spatial contact with whites, I pooled American and Canadian data into a single model. The model includes a dummy variable for country, which one when the city is in the United States, and 0 otherwise. The model also includes three interaction variables between each of the key independent vari- ables (i.e., job market situation, structural change in the economy, and proportion of minority in the city) and the dummy country variable. The dependent variable is still the logit transfor- mation of the interaction index. Based on the earlier discussion, the interaction terms of the model for blacks inform us how much the difference of the effects in the United States from those in Canada if there are cross-countries difference of these variables. Since central city is not defined by Statistics Canada, the variable is not included in the model. To ensure the comparability of these two data sets, I converted Canadian household income from 1985 Canadian dollars to 1979 American dollars.
Table 6 reports the pooled sample results of WLS regression of the logit transformation of the interaction index. The left column presents the results for the model for blacks and the right column shows the results for the model for Asians. It is also evident that the effects of the variables (the decline in manufacturing jobs and the proportion of blacks in the city) on spatial interaction with whites significantly hamper the spatial interaction of American blacks
American and Canadian Experiences 219
TABLE 6 WLS REGRESSION ANALYSIS O F THE LOGISTIC TRANSFORMATION O F THE PROBABILITY O F SPATIAL INTERACTION O F BLACKS A N D ASIANS
WITH WHITES FOR POOLED SAMPLE O F AMERICAN A N D CANADIAN CITIES
Independent Variables Blacks Asians
Socioeconomic Status Median Education
Median Income
Acculturation Level Prop. Native-Born
Job Competition Labor Market
Manufacturing Job Change
Urban Structural Context Affordable Housing
Housing Inflation
Prop. Old Housing
In(Prop. Minority)
Country
Interactions
(United States = 1; Canada = 0)
Country * Job Competition
Country * Manufacturing Job Chahge Country * In (Prop. Minority)
Intercept
N
Adjusted R2
0.096* (0.096) 0.007
(0.0 10)
4.037** (1.290) 0.007
(0.009)
-0.084** (0.029)
(0.072) 0.033
(0.240) 0.127
(0.192)
3.350 (2.120)
-0,224**
-4.787** (1.3 19) 0.173*
(0.092)
(0.193)
-4.781** (2.127)
427
0.764**
-0.945**
0.022 (0.036) 0.054**
(0.01 1)
0.503 (0.393)
1.962 (1.633) 0.004
(0.010)
0.175** (0.049) -0.33 1 ** (0.089) -1.002** (0.265) -0.63 1 ** (0.163)
6.441 ** (2.309)
-4.731** (1.655) 0.088
(0.104)
(0.174)
-4.779** (2.325)
436
0.448**
-0.009
Notes: p** c 0.05; p* c 0.10.
with whites.’ On the other hand, the Asian model indicates that the same variables have no significant effect on their likelihood of spatial interaction with whites in the United States.
220 THE SOCIOLOGICAL QUARTERLY Vol. 37,”o. 211 996
The analysis clearly suggests that American blacks are substantially affected by the city’s structural contexts in the process of minority spatial contact with whites.
CONCLU S l ON
In the United States, blacks are more disadvantaged than Asians in the process of spatial assimilation. African Americans experience a higher level of uneven residential distribution, less contact with whites, and greater spatial isolation. In the major cities, such as Chicago and New York, where most blacks live they experience extreme residential segregation. This segregation varies according to demographic and municipal factors: African Americans in large southern central cities with large proportions of blacks tend to have the highest levels of residential segregation.
Blacks in Canada do not experience the same highly segregated conditions as those in the United States, even though the differences between blacks’ and Asians’ socioeconomic status are similar in the two countries. Segregation is minimal. Isolation levels of both groups in Canadian cities are below 0.1. The level of blacks’ residential segregation from whites re- mains low, even when the proportion of blacks in the city is controlled.
To explain the differences between blacks’ residential patterns in the United States and Canada, I proposed and tested R multivariate model. The results suggest that blacks’ and Asians’ residential patterns are affected by different sets of factors, which in turn lead to several implications. First, levels of residential segregation of blacks from whites in the United States are strongly affected by their proportion in the city. In contrast, levels of segre- gation of blacks in Canada are not. This may be due to the fact that blacks are discriminated against in the U.S. housing market. Whites have been unwilling to share neighborhoods with blacks. In turn, the presence of blacks has received much attention by others. On the other hand, most blacks and Asians in Canada immigrated to Canada in recent decades, which in turn may affect their perception of the host country as well as the receptional attitude of other groups toward them. In particular, blacks in Canada are less likely to become the target of discrimination, because of their small numbers. Thus, it seems that the experience of blacks is specific to American cities. This finding echoes the argument of Massey and Denton (1987), who believe that residential segregation in the United States is affected not by race in general but by black race in particular. Thus, skin color is still an important issue in the United States, but not in Canada.
Although research shows that blacks and Asians may experience discrimination in the Ca- nadian workforce (Reitz 1980; Li 1988), the results of this current project do not imply that these two groups suffer discrimination in the housing market. This seemingly contradictory conclusion reveals the structural differences between individual and group levels of assimila- tion. According to Lieberson (1963), individual and group assimilation processes sometimes move in different directions. A large proportion of the minority group may assimilate very well into the main society, while the group itself maintains clear boundaries. Because work- place experiences emphasize an individual phenomenon and because this article deals with the structures of assimilation at the group level (Massey and Mullan 1984), it is possible that the outcomes of individual experiences in workplace and spatial assimilation are different at these two levels.
In addition, the comparisons made here suggest that education and income are no longer important in predicting residential segregation patterns. Instead, the labor market and urban structural context are crucial to understand the residential patterns in contemporary North
American and Canadian Experiences 22 1
American cities. In particular, the labor market of a city is critical for understanding the high level of segregation of blacks in the United States. Because most municipalities in the United States are experiencing the structural transformation of the labor market, and because African Americans have lower levels of education and historically experience discrimination in the labor market, they suffer heavily from the structural changes in the American economy. As a result, they have less chance to improve their socioeconomic situation, and they experience high levels of racial residential segregation. In contrast, the residential segregation of Asian Americans from whites has been affected
very weakly by the structural change of the city economy in the last decade, whereas levels of residential segregation of black Canadians and Asian Canadians from whites do not relate to job competition and structural changes of the economy. The massive growth of the Asian population in both countries since the 1970s has created various ethnic communities in major American and Canadian cities, which in turn have created opportunities for their members. Blacks in Canada are a selected immigrant group with high educational levels that protect them from the effects of structural change in the economy. Thus, the socioeconomic achieve- ments of Asian Americans and of black and Asian Canadians are not affected even when the economies of American and Canadian cities change, and their process of spatial assimilation with whites is unhampered.
In this article, I have presented a preliminary comparative study of residential segregation in Canadian and US. cities. Although I have made some observations about the differences in residential segregation patterns in the two countries, several issues deserve further attention. First, why does skin color still significantly affect the process of residential distribution in the United States but not in Canada? Although possible explanations are suggested, systematic analyses are needed to delineate the relative effect of group size and skin color on residential patterns. In addition, the research has pointed out the limitations of emphasizing the socioeco- nomic variables in explaining residential segregation. We must consider labor market mecha- nisms and urban structural context in order to understand the patterns of racial residential segregation. Further research must delineate how the city labor market and the urban struc- tural context affect individual socioeconomic status, which in turn influences racial interac- tion in urban neighborhoods.
222 THE SOCIOLOGICAL QUARTERLY Vol. 37/No. 2/1996
ACKNOWLEDGEMENT
Paper presented at the 1993 annual meeting of the American Sociological Association. This research was supported by the Canadian Ethnic Studies Program, Mulitculturalism and Citi- zenship Canada, and Connaught Fund of the University of Toronto. I would like to thank Ming-Long Lam for his technical assistance.
NOTES
1. The average populations of blacks and Asians in the selected American cities are 40,406 and 5,702; whereas the average populations of blacks and Asians in the selected Canadian cities are 3,608 and 15,451, respectively.
2. I raised the criterion to the factor of twenty because on average Canadian cities are smaller than American cities. If the selection of cities is based on Langberg and Farley’s original rule, small cities with a small minority population in Canada will be selected.
3. Analyses that exclude “French and others” and “British and others” do not show any major differ- ences from those that include them. Thus, it is safe to include these two multi-categories without much confusion of interpretation.
4. A central city is a city of more than 50,000 inhabitants within an urbanized area defined by the U.S. Census Bureau. This variable has not been used by the Canadian census.
5. The potential working-age population in the United States is 18 to 64 years old; in Canada, it is the population over age 19. The definitions are different for the two countries because I do not have access to a detailed age distribution in Canada at the tract level. In the American models that define the potential working-age population as over age 19, analyses show the results are similar to those obtained by using the 18-64 year old population. Because the age distribution in Canada is similar to that in the United States, the results should be similar for both the Canadian and the U.S. models.
6. The author is grateful to this suggestion made by one of the reviewers. 7. The main effects of the three variables that interact with the country variable can be interpreted as
the effects for Canada (country = 0 for Canada) and the three interaction effects inform the differences in the effects between the United States from Canada (country = 1 for United States). To test whether the differences in the effects between the United States and Canada of these three interaction variables are statistical significant, I used the simultaneous confidence interval test. I controlled the overall confi- dence level at 95 percent. Then, under the Bonfemoni adjustment, I calculated a confidence interval for each coefficient at 97.5 percent. The results suggest that the interaction effects of the proportion of blacks and the manufacturing job changes are significant for the black model, whereas only the interac- tion effect of the job competition is significant for the Asian model.
REFERENCES
Alba, Richard and John Logan. 1991. “Variations on Two Themes: Racial and Ethnic Patterns in the Attainment of Suburban Residence.” Demography 28:431-453. . 1993. “Minority Proximity to Whites in Suburbs: An Individual-Level Analysis of Segregation.” American Journal of Sociology 98:1388-1427.
Azores, Tania. 1986. “Educational Attainment and Upward Mobility: Prospects for Filipino Americans.” Amerasia 13(1):39-52.
Balakrishnan, T . R. 1976. “Ethnic Residential Segregation in the Metropolitan Areas of Canada.” Cana- dian Journal of Sociology 1:481-498. . 1982. “Changing Patterns of Ethnic Residential Segregation in the Metropolitan Areas of Can- ada.” Canadian Review of Sociology and Anthropology 19: 92-1 10.
American and Canadian Experiences 223
Balakrishnan, T. R. and John Kralt. 1987. “Segregation of Visible Minorities in Montreal, Toronto and Vancouver.” Pp. 138-157 in Ethnic Canada: Identities and Inequalities, edited by Leo Driedger. Toronto: Copp Clark Pitman.
Bear, Douglas, Edward Grabb, and William A. Johnston. 1990. “The Values of Canadians and Ameri- cans: A Critical Analysis and Reassessment.” Social Forces 68: 693-713.
Bleda, Sharon Estee. 1979. “Socioeconomic, Demographic, and Cultural Bases of Ethnic Residential Segregation.” Ethnicity 6:147-167.
Bourne, L. S., A. M. Baker, W. Kalbach, R. Cressman, and D. Green. 1986. Canada’s Ethnic Mosaic: Characteristics and Patterns of Ethnic Origin Groups in Urban Areas. Major report no. 26. To- ronto: Center for Urban and Community Studies, University of Toronto.
Brym, Robert, and Bonnie Fox. 1989. From Culture to Power: The Sociology of English Canada. To- ronto: Oxford University Press.
Cabezas, Amado, Larry Hajime Shinagawa, and Gary Kawaguchi. 1986. “New Inquiries into Socioeco- nomic Status of Filipino Americans in California.” Amerasia 13: 1-21.
Chan, Sucheng. 1991. Asian Americans: An Interpretive History. Boston: Twayne. Clairmont, Donald and Dennis W. Magill. 1976. ‘The Changing Political Consciousness of Nova Scotia
Blacks and the Influence of Africville.” Pp. 73-96 in Ethnicity in the Americas, edited by Frances Henry. Chicago, IL.: Aldine de Gruyter.
Cortese, Charles F., R. Frank Falk, and Jack C. Cohen. 1976. “Furthur Considerations on the Method- ological Analysis of Segregation Indices.” American Sociological Review 41:630-637.
Crawford, Craig, and James Curtis. 1979. “English Canadian-American Differences in Value Orienta- tions: Survey Comparisons Bearing on Lipset’s Thesis.” Studies in Comparative International Development 14:23 -44.
Cuciti, Peggy, and Franklin James. 1990. “A Comparison of Black and Hispanic Poverty in Large Cities of the Southwest.” Hispanic Journal of Behavioral Sciences 12( 1):50-75.
Curtis, James, and Walter Lambert. 1980. “Culture and Social Organization.” Pp. 79-121 in Sociology, edited by R. Hagedorn. Toronto: Holt, Rinehart, and Winston.
Daniels, Roger. 1988. Asian America: Chinese and Japanese in the United States Since 1850. Seattle: University of Washington Press.
Darden, Joe T., Richard Child Hill, June Thomas, and Richard Thomas. 1987. Detroit: Race and Uneven Development. Philade1phia:Temple University Press.
Darroch, A. Gordon, and Wilfred G. Marston. 1971. ‘The Social Class Basis of Ethnic Residential Segre- gation: The Canadian Case.” American Journal of Sociology 77:491-5 10.
Driedger, Leo, and Glen Church. 1974. “Residential Segregation and Institutional Completeness: A Com- parison of Ethnic Minorities.” Canadian Review of Sociology and Anthropology 11:30-52.
DuBois, W. E. B. 1967. The Philadephia Negro: A Social Study. New York Schocken Books. Ellwood, David T. 1986. “The Spatial Mismatch Hypothesis: Are There Teenage Jobs Missing in the
Ghetto?’ Pp 147-185 in The Black Youth Employment Crisis, edited by R. B. Freeman and H. J. Holzer. Chicago: University of Chicago Press.
Farley, Reynolds. 1970. ‘‘The Changing Distribution of Negroes within Metropolitan Areas: The Emer- gence of Black Suburbs.” American Journal of Sociology 75512-529. . 1977. “Residential Segregation in Urbanized Areas of the United States in 1970: An Analysis of Social Class and Racial Differences.” Demography 14497-5 18.
Farley, Reynolds and William Frey. 1994. “Changes in the Segregation of Whites from Blacks.” Ameri- can Sociological Review 59:23-45.
Feagin, Joe R., and Michael Peter Smith. 1987. “Cities and the New International Division of Labor: An Overview.” Pp. 3-34 in The Capitalist City, edited by Michael Peter Smith and Joe R. Feagin. Cambridge, MA.: Basil Blackwell.
Finkel, Alvin. 1986. “Canadian Immigration Policy and the Cold War, 1945-1980.” Journal of Canadian Studies 2153-69.
224 THE SOCIOLOGICAL QUARTERLY Vol. 37/No. 2/1996
Glenn, Norval D. 1963. “Occupational Benefits to Whites from the Subordination of Negroes.” American Sociological Review 28: 443-448.
Guest, Avery M., and James A. Weed. 1976. “Ethnic Residential Segregation: Patterns of Change.” American Journal of Sociology 81: 1088-1 11 1.
Henry, Frances. 1973. Forgotten Canadians: The Blacks of Nova Scotiu. Don Mills, Ont.: Longman Canada.
Hirsch, Arnold R. 1983. Making the Second Ghetto: Race and Housing in Chicago, 1940-1960. New York Cambridge University Press.
Hughes, Michael and Bradley R. Hertel. 1990. “The Significance of Color Remains: A study of Life Chances, Mate Selection and Ethnic Consciousness among Black Americans.” Social Forces
James, David R., and Karl E. Taeuber. 1985. “Measures of Segregation.” Pp. 1-32 in Sociological Meth- odology, 1985, edited by Nancy Tuma. San Francisco, CA: Jossey-Bass.
Kain, John F., and John M. Quigley. 1975. Housing Markets and Racial Discrimination: A Microeconomic Analysis. New York: Columbia University Press.
Kalbach, Warren E. 1987. “Growth and Distribution of Canada’s Ethnic Populations, 1871-1981.” Pp. 82-1 10 in Ethnic Canada: Identities and Inequalities, edited by Leo Driedger. Toronto: Copp Clark Pitman.
Kasarda, John. 1983. “Entry-Level Jobs, Mobility, and Urban Minority Unemployment.” Urban Af- fairs Quarterly 19:21-40. . 1985. “Urban Change and Minority Opportunities.” Pp 33-67 in The New Urban Reality, edited by Paul E. Peterson. Washington, D. C.:Brookings Institution. . 1990. “Structural Factors Affecting the Location and Timing of Urban Underclass Growth.” Urban Geography 11(3):234-264.
Kusmer, Kenneth L. 1976. A Ghetto Takes Shape: Black Cleveland, 1870-1930. Urbana, IL.: University of Illinois Press.
Langberg, Mark and Reynolds Farley. 1985. “Residential Segregation of Asian Americans in 1980.” Sociology and Social Research 70:7 1-75.
Lewin-Epstein, Noah. 1985. “Neighborhoods, Local Labor Markets and Employment Opportunities for White and Nonwhite Youth.” Social Science Quarterly 66:163-171.
Li, Peter S . 1988. Ethnic Inequality in a Class Society. Toronto: Wall and Thompson. Lieberson, StanIey. 1963. Ethnic Patterns in American Cities. New York Free Press.
Lieberson, Stanley and Mary C. Waters. 1988. From Many Strands: Ethnic and Racial Groups in Con-
Light, Ivan. 1972. Ethnic Enterprise in America. Berkeley: University of California Press. Lipset, Seymour Martin. 1963. The First New Nation: The United States in Historical Perspective. New
68: 1 105- 1 120.
. 1980. A Piece of the Pie. Berkeley: University of California Press.
temporary America. New York: Russell Sage Foundation.
York Basic. . 1988. Revolution and Counterrevolution. New York: Basic. . 1990. Continental Divide: The Values and Institutions of the United States and Canada. New York: Routledge.
Logan, John R., and Harvey L. Molotch. 1987. Urban Fortunes:The Political Economy of Place. Berke- ley: University of California Press.
Logan, John R., Richard D. Alba, and Thomas L. McNulty. 1994. “Ethnic Economies in Metropolitan Regions: Miami and Beyond.” Social Forces 72:691-724.
Nee, Victor, Jimy M. Sanders, and Scott Semau. 1994. “Job Transitions in an Immigrant Metropolis.” American Sociological Review 59: 849 - 872.
Massey, Douglas S. 1985. “Ethnic Residential Segregation: A Theoretical Synthesis and Empirical Re- view.” Sociology and Social Research 69(3): 315-350.
Massey, Douglas S., and Gretchen A. Condran, and Nancy A. Denton. 1987. ‘The Effect of Residential Segregation on Black Social and Economic Well Being.” Social Forces 66:29-56.
American and Canadian Experiences 225
Massey, Douglas S., and Nancy A. Denton. 1993. American Apartheid. Boston, MA: Harvard University Press. . 1987. ‘Trends in the Residential Segregation of Blacks, Hispanics, and Asians.” American Sociological Review 52802-825. . 1988. ‘The Dimensions of Residential Segregation.” Social Forces 67:28 1-315.
Massey, Douglas S., and Eric Fong. 1990. “Segregation and Neighborhood Quality: Blacks, Hispan- ics, and Asians in the San Francisco metropolitan Area.” Sociul Forces, 69:15-32.
Massey, Douglas S., and Brendan P. Mullan. 1984. “Processes of Hispanic and Black Spatial Assimila- tion.” American Journal of Sociology 89836-871.
McCreary, Lori, Paula England, and George Farkas. 1989. “The Employment of Central City Male Youth: Nonlinear Effects of Racial Composition.” Social Forces 68: 55-75.
Nadwodny, Richard A., Henry A. Puderer, and Richard L. Forstall. 1990. “Metropolitan Area Delinea- tion: A Canadian-U.S. Comparison.” Paper presented at the annual meeting of the Population Association of America Conference, Toronto, Canada.
Norcliffe, Glen, Michael Goldrick, and Leon Muszynski. 1986. “Cyclical Factors, Technological Change, Capital Mobility, and Deindustriaiization in Metropolitan Toronto.” Urban Geography 7:413- 436.
Perry, David C. 1987. ‘The Politics of Dependency in Deindustrializing America: The Case of Buffalo, New York.” Pp. 113-137 in The Capitalist Cify, edited by Joe R. Feagin and Michael Peter Smith. Cambridge, MA: Basil Blackwell.
Reitz, Jeffrey G. 1980. The Survival of Ethnic Groups. Toronto: McGraw-Hill Ryerson. Richmond, Anthony H. 1967. Post-War Immigrants in Canada. Toronto: University of Toronto Press. Sanders, Jimy M. and Victor Nee. 1987. “Limits of Ethnic Solidarity.” American Sociological Review
Spear, Allan H. 1967. Black Chicago: The Making of a Negro Ghetto, 1890-1920. Chicago: University of
Statistics Canada. 1988. I986 Census Handbook. Ottawa, Ont: Statistics Canada.
52:745-767.
Chicago Press.
. 1987a. Census Dictionary. Ottawa, Ont: Statistics Canada.
. 1987b. Census Recensement-Censw Tracts. Ottawa, Ont: Statistics Canada.
. 1986. 1986 Census 28 Profile. Ottawa, Ont: Statistics Canada.
. 198 1. Census Metro Areas with Components-Population, Occupied Private Dwellings, Private Households, and Census and Economic Families in Private Households: Selected Social and Eco- nomic Characteristics. Ottawa: Statistics Canada. . 1976. Manufacturing Industries of Canada: Sub-provincial Areas. Ottawa: Statistics Canada. . 1971. Census of Canada: Housing Values and Rents. Ottawa: Statistics Canada.
Theil, Henri, and Anthony Y. Finizza. 1971. “A Note on the Measurement of Racial Integration of Schools by Means of Informational Concepts.” Journal of Mathematical Sociology 1: 187-194.
Thernstrom, Stephen. 1973. The Other Bostonians: Poverty and Progress in the American Metropolis, 1880-1970. Cambridge, MA: Harvard University Press.
US. Bureau of Census. 1983. 1980 Census of Housing and Population Users’ Guide. Washington, DC: Government Printing Office. . 1977. County and City Data Book 1977. Washington, DC: Government Printing Office.
Van Valey, Thomas L., Wade Clark Roof, and Jerome E. Wilcox. 1977. ‘Trends in Residential Segrega- tion, 1960- 1970.” American Journal of Sociology 82:826-844.
White, Michael J. 1987. American Neighborhoods and Residential Differentiation. New York Russell Sage Foundation. . 1986. “Segregation and Diversity Measures in Population Distribution.” Population Studies
White, Michael J., Ann E. Biddlecom, and Shenyang Guo. 1993. “Immigration, Naturalization, and Resi- 52(2): 198-221.
dential Assimilation among Asian Americans in 1980.” Social Forces 72:93-118.
226 THE SOCIOLOGICAL QUARTERLY Vol. 37/No. 2/1996
Wienk, Ronal, Cliff Reid, John Simonson, and Fred Eggers. 1979. Measuring Racial Discrimination in American Housing Markets: The Housing Market Practices Survey. Washington, DC: US. De- partment of Housing and Urban Development.
Winks, Robin W. 1971. The Blacks in Canada. New Haven, CT: Yale University Press. Yinger, John. 1987. “The Racial Dimension of Urban Housing Markets in the 1980s.” Pp.43-67 in Di-
vided Neighborhoods: Changing Patterns of Racial Segregation, edited by Gary A. Tobin. New- bury Park, CA: Sage.
Zhou, Min. 1992. Chinatown: The Socioeconomic Potential of an Urban Enclave. Philadelphia,PA: Tem- ple University Press.
Zhou, Min, and John R. Logan. 1991. “In and Out Chinatown: Residential Mobility and Segregation of New York City’s Chinese.” Social Forces 70: 387-408.
Zunz, Olivier. 1982. The Changing Face of Inequality: Urbanization, Industrial Development, and Immi- grants in Detroit, 1880-1920. Chicago: University of Chicago Press.