A COMPARATIVE MORPHOLOGICAL AND CHEMICAL STUDY OF …
13
FARMACIA, 2013, Vol. 61, 6 1069 A COMPARATIVE MORPHOLOGICAL AND CHEMICAL STUDY OF THE SEEDS FROM TRIGONELLA FOENUM GRAECUM (L.) AND T. CAERULEA (L.) SER. SPECIES MIHAELA DINU 1 , ROBERT ANCUCEANU 1* , VALERIA RĂDULESCU 2 , DIANA-CAROLINA ILIEŞ 2 , CORNEL MUNTEANU 3 , CORINA ARAMĂ 4 1 Department of Pharmaceutical Botany and Cell Biology, Faculty of Pharmacy, University of Medicine and Pharmacy “Carol Davila”, 6 Traian Vuia, Bucharest 020956, Romania 2 Department of Organic Chemistry, Faculty of Pharmacy, University of Medicine and Pharmacy “Carol Davila”, 6 Traian Vuia, Bucharest 020956, Romania 3 Institute of Physical Chemistry "Ilie Murgulescu" 4 Department of Analytical Chemistry, Faculty of Pharmacy, University of Medicine and Pharmacy “Carol Davila”, 6 Traian Vuia, Bucharest 020956, Romania *corresponding author: [email protected] Abstract While the seeds of Trigonella foenum-graecum (L.) are relatively widely used as a spice and seasoning in food and as a traditional herbal medicinal product, those of T. caerulea have a more limited use and are rather ignored. We report on a comparative study of the surface morphology (investigated by scanning electron microscopy), of alcoholic extracts prepared from the seeds of the two species (analysed through HPLC) and of their fatty acid composition (investigated through GC, after derivatization with methanol). There are important differences in the seed morphology, the epidermis cells (macrosclereids) of T. foenum-graecum seeds are very narrow (6.4 x 8.4 μm; SD 0.8 μm and 0.8 μm) and those of T. caerulea are still narrower (4.4 x 5.2 μm; SD 0.6 and 0.5 μm, respectively). The HPLC chromatograms of the alcoholic seed extracts from the two species revealed at least seven peaks specific for T. foenum-graecum only, and three for T. caerulea only, suggesting a different chemical composition. Quercetin, myricetin and kaempferol, used as reference substances were not detected in the extracts. The qualitative and quantitative compositions of the various fatty acids do not indicate substantial differences between the two species: in the seeds from both species linoleic and linolenic (around 40% each), palmitic (around 10%) and stearic acids (2-4%) are the most important components. Rezumat În timp ce seminţele de Trigonella foenum-graecum (L.) sunt relativ mult utilizate drept condiment şi ca medicament tradiţional pe bază de plante, cele de T. caerulea (L.) Ser. au o utilizare mai limitată şi sunt destul de ignorate. Articolul de faţă prezintă rezultatele unui studiu comparativ al morfologiei suprafeţei (investigate prin microscopie
Transcript of A COMPARATIVE MORPHOLOGICAL AND CHEMICAL STUDY OF …

FARMACIA, 2013, Vol. 61, 6
1069
A COMPARATIVE MORPHOLOGICAL AND CHEMICAL STUDY OF THE SEEDS FROM TRIGONELLA FOENUM GRAECUM (L.) AND T. CAERULEA (L.) SER. SPECIES MIHAELA DINU1, ROBERT ANCUCEANU1*, VALERIA RĂDULESCU2, DIANA-CAROLINA ILIEŞ2, CORNEL MUNTEANU3, CORINA ARAMĂ4
1Department of Pharmaceutical Botany and Cell Biology, Faculty of Pharmacy, University of Medicine and Pharmacy “Carol Davila”, 6 Traian Vuia, Bucharest 020956, Romania 2Department of Organic Chemistry, Faculty of Pharmacy, University of Medicine and Pharmacy “Carol Davila”, 6 Traian Vuia, Bucharest 020956, Romania 3Institute of Physical Chemistry "Ilie Murgulescu" 4Department of Analytical Chemistry, Faculty of Pharmacy, University of Medicine and Pharmacy “Carol Davila”, 6 Traian Vuia, Bucharest 020956, Romania *corresponding author: [email protected]
Abstract
While the seeds of Trigonella foenum-graecum (L.) are relatively widely used as a spice and seasoning in food and as a traditional herbal medicinal product, those of T. caerulea have a more limited use and are rather ignored. We report on a comparative study of the surface morphology (investigated by scanning electron microscopy), of alcoholic extracts prepared from the seeds of the two species (analysed through HPLC) and of their fatty acid composition (investigated through GC, after derivatization with methanol).
There are important differences in the seed morphology, the epidermis cells (macrosclereids) of T. foenum-graecum seeds are very narrow (6.4 x 8.4 µm; SD 0.8 µm and 0.8 µm) and those of T. caerulea are still narrower (4.4 x 5.2 µm; SD 0.6 and 0.5 µm, respectively). The HPLC chromatograms of the alcoholic seed extracts from the two species revealed at least seven peaks specific for T. foenum-graecum only, and three for T. caerulea only, suggesting a different chemical composition. Quercetin, myricetin and kaempferol, used as reference substances were not detected in the extracts. The qualitative and quantitative compositions of the various fatty acids do not indicate substantial differences between the two species: in the seeds from both species linoleic and linolenic (around 40% each), palmitic (around 10%) and stearic acids (2-4%) are the most important components.
Rezumat
În timp ce seminţele de Trigonella foenum-graecum (L.) sunt relativ mult utilizate drept condiment şi ca medicament tradiţional pe bază de plante, cele de T. caerulea (L.) Ser. au o utilizare mai limitată şi sunt destul de ignorate. Articolul de faţă prezintă rezultatele unui studiu comparativ al morfologiei suprafeţei (investigate prin microscopie

FARMACIA, 2013, Vol. 61, 6
1070
electronică de baleiaj), al unor extracte alcoolice preparate din seminţele celor două specii (analizate prin HPLC) şi al compoziţiei în acizi graşi (investigate prin GC, după derivatizare cu metanol).
Există diferenţe importante în morfologia seminţelor, celulele epidermice (macrosclereide) de T. foenum-graecum sunt foarte înguste (6,4 x 8,4 µm; SD 0,8 µm şi 0,8 µm), iar cele de T. caerulea sunt chiar şi mai înguste (4,4 x 5,2 µm; SD 0,6 şi respectiv, 0,5 µm). Cromatogramele HPLC ale extractelor alcoolice obţinute din seminţele celor două specii au pus în evidenţă cel puţin 7 picuri diferite, specifice doar pentru T. foenum-graecum şi trei doar pentru T. caerulea, sugerând o compoziţie chimică diferită. Quercetolul, miricetolul şi kaempferolul, utilizate ca substanţe de referinţă nu au fost detectate în extracte. Compoziţia calitativă şi cantitativă în diferiţi acizi graşi nu indică diferenţe substanţiale între cele două specii: în seminţele ambelor specii acizii linoleic şi linolenic (cca. 40% fiecare), palmitic (cca. 10%) şi stearic (2-4%) sunt cei mai importanţi.
Keywords: Trigonella species, fatty acids, HPLC, SEM Introduction
Trigonella foenum-graecum (L.) (fenugreek), belonging to the Fabaceae family (Papillionaceae subfamily, Trifolieae tribe), is an aromatic herb growing spontaneously in large areas of Asia and Europe [3], as well as in the North African area [6]. Its seeds are often used as a spice and seasoning in food preparations [6]. As food supplements or as such, they are promoted for glycemic control in patients with diabetes mellitus, for their hypocholesterolemic, anorectic and weight-loss inducing effects and to induce lactation in women [16]. The European Medicines Agency has not approved any use as „well-established” (in the sense of Directive 2001/83/EC) for the seeds, but has accepted the traditional use of the seeds and of dry or soft extracts in two indications: temporary loss of appetite and symptomatic treatment of minor inflammations of the skin. (The “traditional use” refers to the employment of a herbal product “exclusively based upon long-standing use” and not on clinical evidence) [7].
While the seeds of T. foenum-graecum (which belongs to subgen. Trifoliastrum (Moench) G.Beck. [18]) are relatively widely used for dietary or medicinal purposes, those of its relative T. caerulea (L.) Ser. (which belongs to subgen. Trigonella [18]) are less known and used for these purposes, although the species is widespread in Europe and occasionally cultivated (the species it is sometimes divided in a wild subspecies – ssp. procumbens, and a cultivated one – ssp. caerulea) [11, 19]. The dried herb powdered serves to prepare a greenish sort of cheese and for flavouring bread and other foods. The seeds are also used for flavouring purposes [11]. A recent study of 37 taxa of the genus Trigonella was published by Ceter T. et al. (2012), but it was only limited to the comparative morphology, with

FARMACIA, 2013, Vol. 61, 6
1071
no chemical information [2]. A computerized interrogation of Medline database carried out in January 2009 returned 441 paper titles for T. foenum-graecum and only 3 for T. caerulea. Considering the scarcity of data regarding this second species of genus Trigonella, we have initiated a comparative study of the two species. In a previous publication [5] we reported on a comparative study which looked into the morpho-anatomical features of the two species and the effects of extracts derived from the two species on the germination of Triticum caryopses. Here, we report further on the surface morphology of the seeds investigated by means of scanning electron microscopy and on chemical comparative analysis of the fatty acids (through GC) and of alcoholic extracts prepared from the seeds of the two species (through HPLC).
Materials and Methods
Seeds of T. foenum-graecum were purchased from a health food and herbal store in Bucharest (producer stated on the label: Fares, Orăştie, Romania). Seeds of T. caerulea were collected after fructification, during the June-July period, from a private garden in Alexandria (Teleorman county, Romania).
Scanning electron microscopy (SEM) analysis. Surface topology of the seeds from the two Trigonella species was investigated by means of a high resolution dual beam (SEM/FIB) instrument, Quanta 3D FEG model, at an accelerating voltage of 5 kV, low vacuum mode (pressure ~ 50 Pa) and Low Vacuum Secondary Electron Detector (LVSED). For T. caerulea fruits were also examined; as seeds from T. foenum-graecum were procured from commerce, fruits were not available for SEM analysis. Sample preparation was minimal and consisted in immobilising the seeds and fruit fragments, respectively, on a double-sided carbon tape, with no coating. Sizes provided in the text are expressed as mean values calculated on the basis of 10 measurements and accompanied by the corresponding standard deviation (SD).
HPLC chromatographic comparison of alcoholic extracts of the two species: An HPLC separation method was developed and used for comparison, focused on separating as many as possible compounds from the alcoholic extracts of the two related species.
Apparatus: A Varian HPLC chromatograph was used, equipped with a photodiode-array detector (PDA, Prostar 3309) and a Prostar 240SDM quaternary high-pressure pump. The analytical separation was carried out on an Inertsil, ODS-2, 250 x 4.6 mm, 5 µm column.
FARMACIA, 2013, Vol. 61, 6
1072
Chromatographic conditions: A binary gradient elution system, based on water (A) and methanol (B), was used to perform the separation. The gradient elution parameters were as follows: 0-8 min., 70% A; 8-40 min., 70%-40% A. The flowing rate of the mobile phase was 1 mL/min and the loading volume 20 µL. The column was held at a constant temperature of 25º C. The PDA detector was set at 254, 290 and 360 nm. Spectral purity of the chromatographic peaks was checked by means of the “peak purity” option in the Varian MS Workstation ver. 6.9.1. software.
Chemicals: Gradient-grade acetonitrile was purchased from Merck KGaA and quercetin, myricetin and kaempferol from Sigma.
Sample preparation: Seeds of the two species were grinded in an electrical grinder and passed through a 60 mesh sieve. From the powder, 1% ethanolic solutions were prepared holding the powder-ethanol mixture (1:100, w/V) under reflux with a heating mantle for 30 minutes. After cooling down, the solution was decanted into a 100 mL volumetric flask, filled with ethanol to the mark, stirred vigorously and filtered; each solution thus obtained was injected into the chromatograph. Reference solutions were prepared by dissolving a small amount (less than 1 mg) in 1-2 mL of ethanol.
GC-MS analysis of fatty acids based on derivatization as methyl esters, was carried out using a Fisons Instruments GC 8000 with an electron impact quadrupole, MD 800 mass spectrometer detector. The electron ionisation energy was 70 eV. A fused silica column 5% phenylpoly(dimethylsiloxane) (SLB - 5ms, 30 m x 0.32 mm i.d., film thickness = 0.25 µm) was employed. The operating conditions were the following: a split-splitless injector (split ratio, 1/30) at 280˚C, ion-source temperature 200˚C and the interface temperature 280˚C; initial column temperature, 100˚C for 3 min, raised at 10˚/min to 280˚C and finally held isothermally for 25 min; the carrier gas (helium) flow rate was 2 mL/min; sample volume injected, 2 µL. Data acquisition was performed with MassLab Software for the mass range 30-600 u with a scan speed of 1 scan/s. The identity of volatile oil components was established from their GC Kovats retention indices and from mass spectra by computer matching with mass spectra library (NIST, WILEY and a personal library of 600 spectra). The linear retention indices were determined in relation to a homologous series of n-alkanes (C15 - C28). The experimental values of Kovats indices were compared with those reported in literature. Component relative concentrations were calculated from GC peak areas without using correction factors.

FARMACIA, 2013, Vol. 61, 6
1073
Figure 1
SEM images of T. foenum-graecum seed (a, b, c, e, g) and T. caerulea seed (d, f, h).

FARMACIA, 2013, Vol. 61, 6
1074
Figure 2
Light microscope images of T. foenum-graecum seed (a, b) and SEM images of T. caerulea fruit (c-h).

FARMACIA, 2013, Vol. 61, 6
1075
Sample preparation: A non-polar extract (containing lipids) was prepared from the powdered seeds (3-4 grams) through repeated extractions (four extractions for each species) with hexane at room temperature. The extraction yield (on a dry basis) was 2.41% for T. foenum-graecum and 3.62% for T. caerulea. Derivatization of fatty acids was based on transesterification with methanol catalyzed by KOH, through a slight adaptation of the method described by Ichihara K. et al. (1996) [9]. 80-160 mg of extract were treated at room temperature with 2 mL of hexane and 0.2 mL of 2 M methanolic KOH for 1-2 min. The hexane layer containing methyl-esters of fatty acids was used for the GC-MS analysis.
Results and Discussion
Scanning electron microscopy (SEM) analysis. The morphology of the T. foenum-graecum seed is in line with the descriptions available in the literature [10, 13, 14]: more or less diamond-shaped, 3.00-4.00 mm diameter and with a slightly lateral and oblique groove (although sometimes in the literature the groove is described as occurring “in the middle” [13, 14]). At the level of the groove there is a small indentation, giving the seed an emarginated aspect (fig. 1, a-b). Seeds of T. caerulea are smaller (1.50-2.00 mm diameter), ovoid in shape, with a small depression, morphologically different from those of T. foenum-graecum, in agreement with the literature data [1] (fig. 1, d). Both seeds show small protuberances visible with relatively low magnification (fig. 1, c and d), different between the two species: in the case of T. foenum-graecum they seem to be covered by a lipid layer or similar material (of cuticle origin – fig. 1, e), while in T. caerulea they seem more homogenous, less differentiated from the rest of the surface (fig. 1, f). The epidermis cells of T. foenum-graecum seeds are very narrow (6.4 x 8.4 µm; SD 0.8 µm and 0.8 µm); viewed in surface they seem almost isodiametric (fig. 1, g), but light microscopy images have confirmed that they are elongated, palisade-like (i.e. much longer than broad). These prosenchymatic cells, known as macrosclereids are typical for the exotesta of the Fabaceae family [15, 4]. Macrosclereids of T. caerulea are even narrower, with cell diameters measured at surface of 4.4 x 5.2 µm (SD 0.6 and 0.5 µm, respectively) (fig. 1, h). In the light microscopy images, macrosclereids seem to be disposed in circles creating toroidal doughnut-like patterns (fig. 2, a,b); the only structures seemingly corresponding to these circles in the SEM images are the small protuberances described above (but we have no explanation for this discrepancy between the light and SEM images). The surface of T. caerulea seeds is considerably more striated than that of T. foenum-graecum seeds.
FARMACIA, 2013, Vol. 61, 6
1076
The epicarp of the T. caerulea pod has larger cells, rather typical for plants (36.9 x 49.0 µm (SD 5.1 µm and 6.3 µm, respectively), covered by a cuticle layer (fig. 2, c, d). In certain areas (where mesocarp tissues are visible due to damage), packs of fibers with calcium oxalate crystal sheaths may be seen (fig. 2, e-g). The average diameters (on cross-section) of the fibers are 12.5 x 15.4 µm (SD 1.6 and 2.8 µm) and the mean sizes of the oxalate crystals is 7.1 x 8.9 (SD 1.2 and 1.4 µm, respectively). The endocarp shows elongated cells with a fibrillar appearance, forming an intricate network (fig. 2, h). For this reason the extremities were not easily distinct and length measurements could not be performed in an accurate manner; their lumen is about 6.7 µm (SD 2.4 µm).
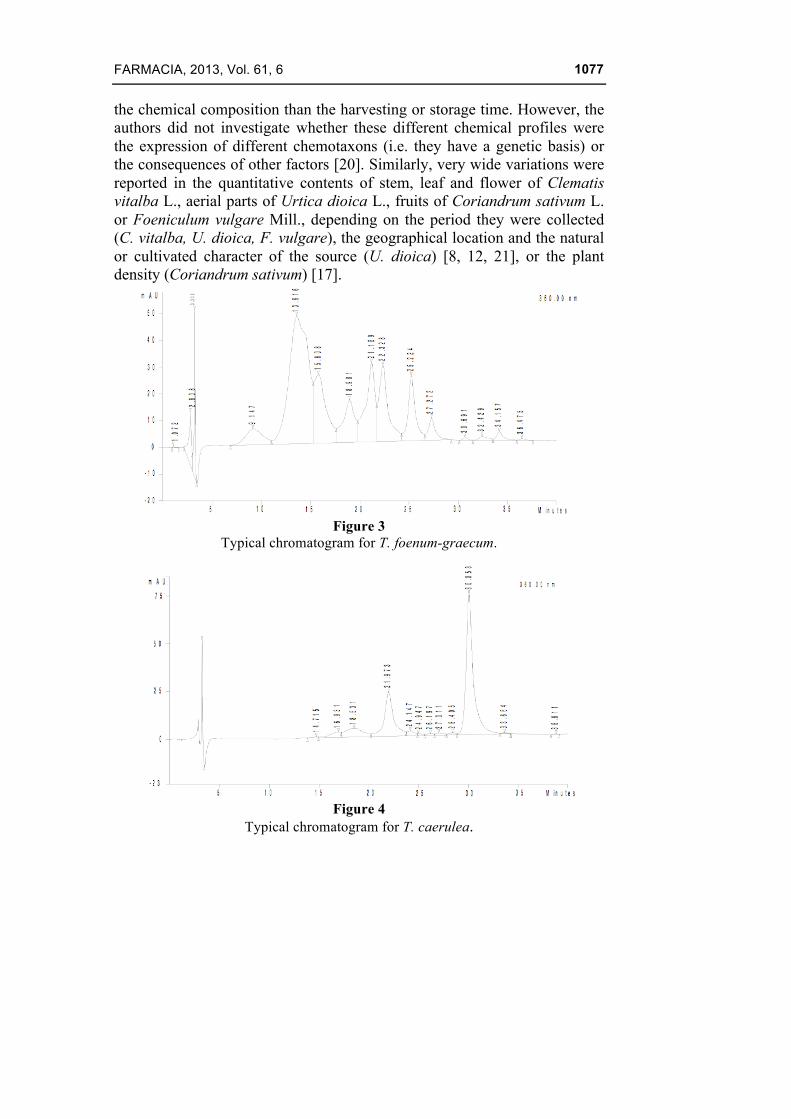
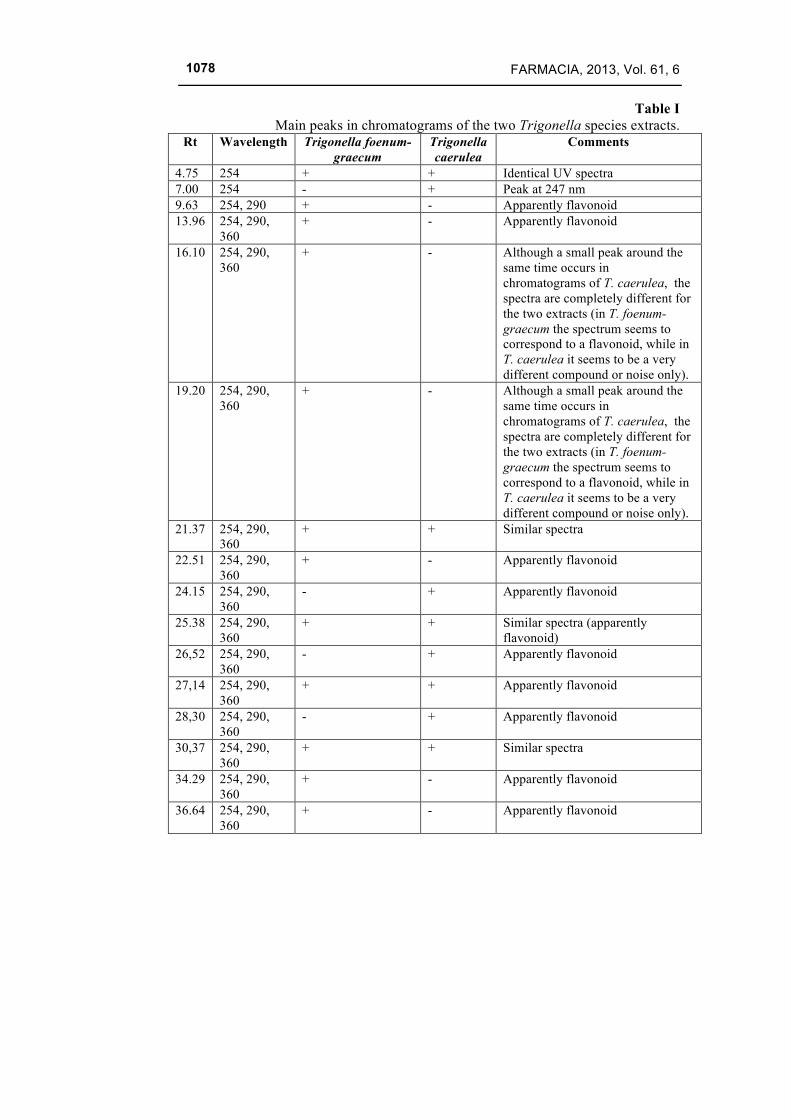
HPLC comparative analysis. To develop the HPLC method, a CN and an RP-C18 column were assessed, and several mobile phases (based on methanol and acetonitrile) and gradient conditions were tested. The described method had the best results. Typical chromatograms of the extracts derived from the two species are shown in fig. 3 and 4 (retention times are expressed as averages). Based on the UV spectra, with the exception of the peaks from 4.75 and 7.00 minutes, most peaks seem to correspond to flavonoidic compounds. Significant differences seem to exist in the phytochemical composition of the two extracts, in both qualitative and quantitative terms. A synthetic presentation of the main peaks with their corresponding retention times is included in table I. There are at least seven peaks specific for T. foenum-graecum only, and three peaks specific for T. caerulea only. Quantitatively, the largest peak in the sample derived from T. foenum-graecum has a Rt of 13.96 and other larger peaks are found at 16.10, 21.37 and 22.51; in the chromatogram of T. caerulea sample the largest peak is at 30.37, followed by one at 21.37 minutes. None of the three reference substances used (quercetin, myricetin, kaempferol) was detected in the extracts; the retention times of the reference substances were higher than the run time of the analysis.
While it seems reasonable and likely that these differences reflect a chemotaxonomonical divergence, it is not impossible that they reflect variance due to other factors than taxonomical identity, such as soil, climate or allelopathy, as such ample differences in chemical composition inside the same species (both qualitative and quantitative) are well known from the scientific literature. For instance, analysis through HPLC of 56 specimens of Hypericum japonicum Thunb. collected from various China locations has revealed a surprising diversity in the chemical composition, at least three distinct chemical profiles (chemovarieties) being put into evidence. Moreover, in that study, location seemed to have a much higher impact on
FARMACIA, 2013, Vol. 61, 6
1077
the chemical composition than the harvesting or storage time. However, the authors did not investigate whether these different chemical profiles were the expression of different chemotaxons (i.e. they have a genetic basis) or the consequences of other factors [20]. Similarly, very wide variations were reported in the quantitative contents of stem, leaf and flower of Clematis vitalba L., aerial parts of Urtica dioica L., fruits of Coriandrum sativum L. or Foeniculum vulgare Mill., depending on the period they were collected (C. vitalba, U. dioica, F. vulgare), the geographical location and the natural or cultivated character of the source (U. dioica) [8, 12, 21], or the plant density (Coriandrum sativum) [17].
Figure 3
Typical chromatogram for T. foenum-graecum.
Figure 4
Typical chromatogram for T. caerulea.
FARMACIA, 2013, Vol. 61, 6
1078
Table I Main peaks in chromatograms of the two Trigonella species extracts.
Rt Wavelength Trigonella foenum-graecum
Trigonella caerulea
Comments
4.75 254 + + Identical UV spectra 7.00 254 - + Peak at 247 nm 9.63 254, 290 + - Apparently flavonoid 13.96 254, 290,
360 + - Apparently flavonoid
16.10 254, 290, 360
+ - Although a small peak around the same time occurs in chromatograms of T. caerulea, the spectra are completely different for the two extracts (in T. foenum-graecum the spectrum seems to correspond to a flavonoid, while in T. caerulea it seems to be a very different compound or noise only).
19.20 254, 290, 360
+ - Although a small peak around the same time occurs in chromatograms of T. caerulea, the spectra are completely different for the two extracts (in T. foenum-graecum the spectrum seems to correspond to a flavonoid, while in T. caerulea it seems to be a very different compound or noise only).
21.37 254, 290, 360
+ + Similar spectra
22.51 254, 290, 360
+ - Apparently flavonoid
24.15 254, 290, 360
- + Apparently flavonoid
25.38 254, 290, 360
+ + Similar spectra (apparently flavonoid)
26,52 254, 290, 360
- + Apparently flavonoid
27,14 254, 290, 360
+ + Apparently flavonoid
28,30 254, 290, 360
- + Apparently flavonoid
30,37 254, 290, 360
+ + Similar spectra
34.29 254, 290, 360
+ - Apparently flavonoid
36.64 254, 290, 360
+ - Apparently flavonoid
FARMACIA, 2013, Vol. 61, 6
1079
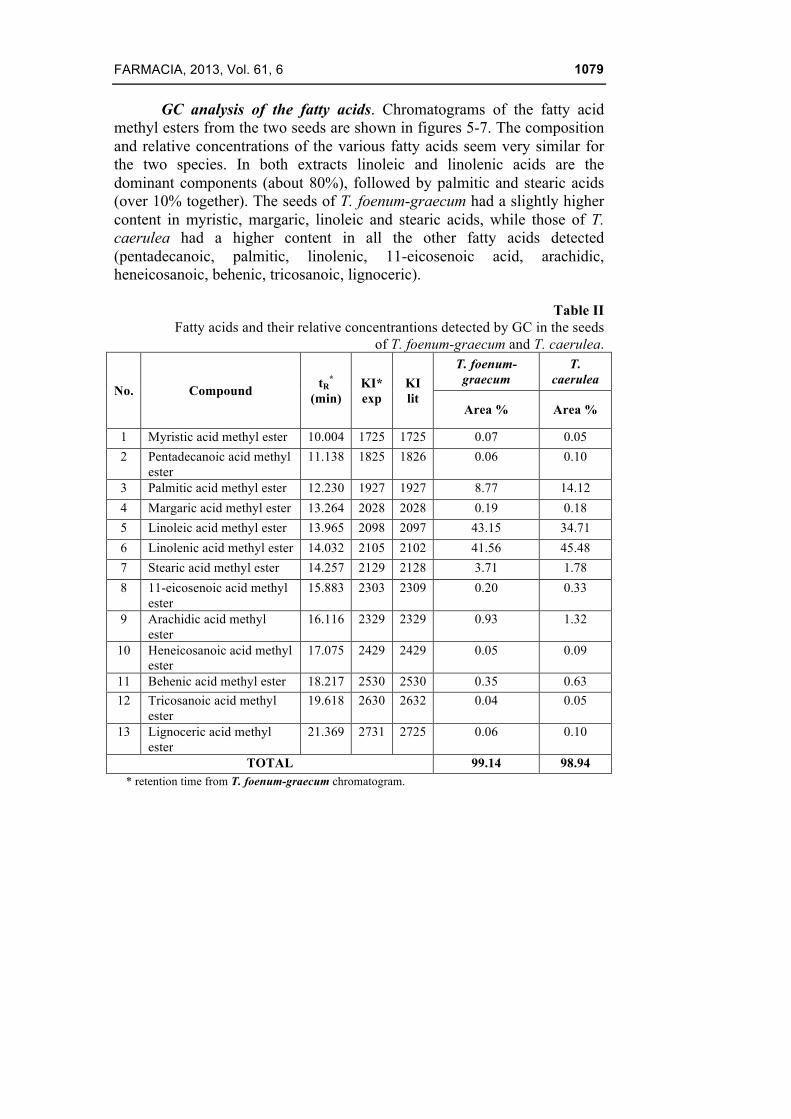
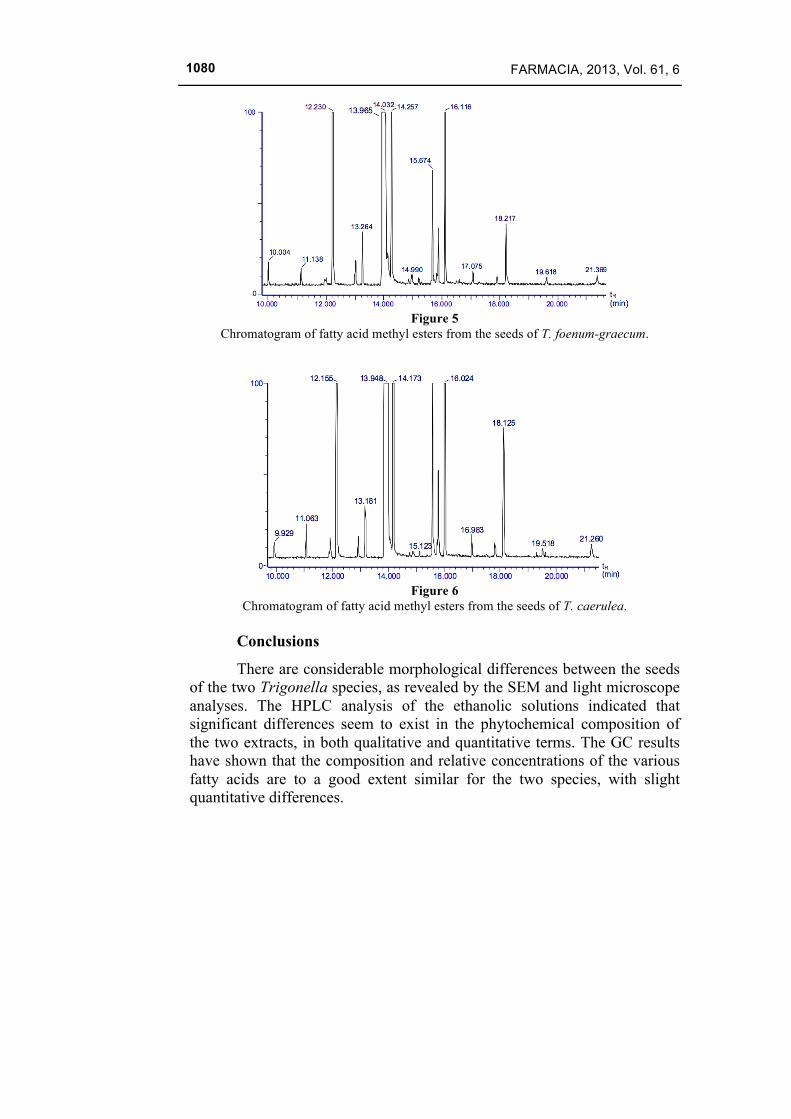
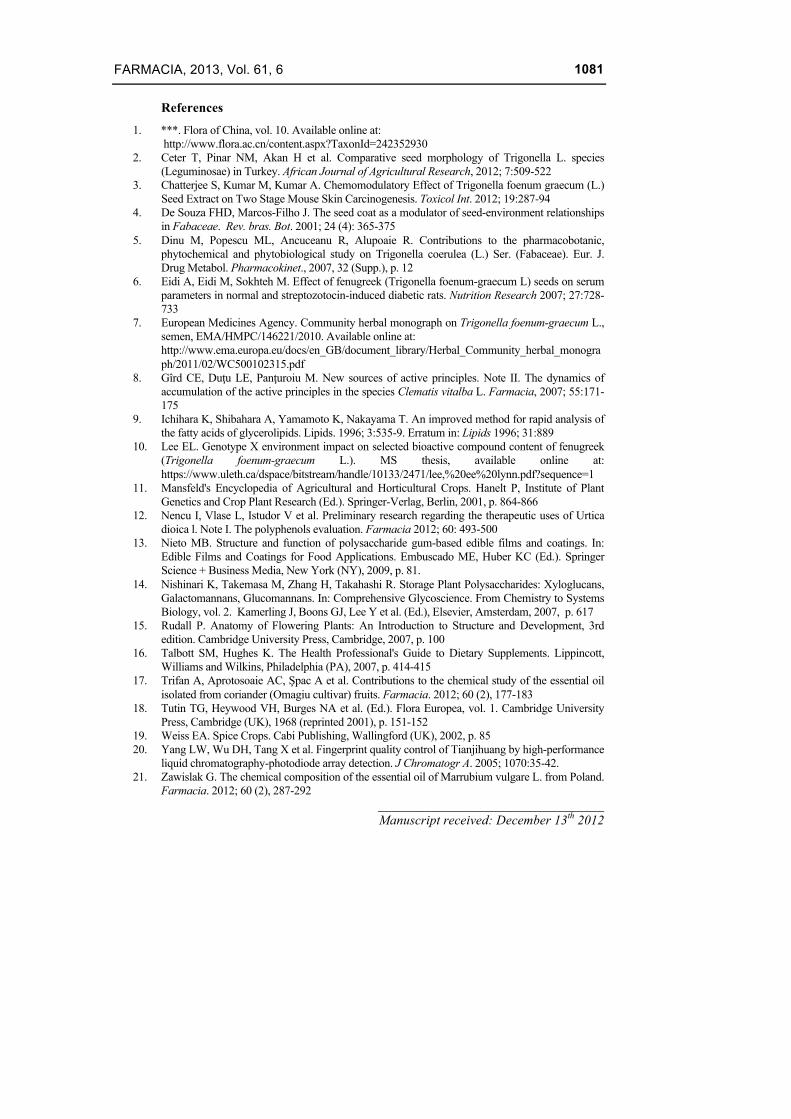
GC analysis of the fatty acids. Chromatograms of the fatty acid methyl esters from the two seeds are shown in figures 5-7. The composition and relative concentrations of the various fatty acids seem very similar for the two species. In both extracts linoleic and linolenic acids are the dominant components (about 80%), followed by palmitic and stearic acids (over 10% together). The seeds of T. foenum-graecum had a slightly higher content in myristic, margaric, linoleic and stearic acids, while those of T. caerulea had a higher content in all the other fatty acids detected (pentadecanoic, palmitic, linolenic, 11-eicosenoic acid, arachidic, heneicosanoic, behenic, tricosanoic, lignoceric).
Table II
Fatty acids and their relative concentrantions detected by GC in the seeds of T. foenum-graecum and T. caerulea.
No. Compound tR*
(min) KI* exp
KI lit
T. foenum-graecum
T. caerulea
Area % Area %
1 Myristic acid methyl ester 10.004 1725 1725 0.07 0.05 2 Pentadecanoic acid methyl
ester 11.138 1825 1826 0.06 0.10
3 Palmitic acid methyl ester 12.230 1927 1927 8.77 14.12 4 Margaric acid methyl ester 13.264 2028 2028 0.19 0.18 5 Linoleic acid methyl ester 13.965 2098 2097 43.15 34.71 6 Linolenic acid methyl ester 14.032 2105 2102 41.56 45.48 7 Stearic acid methyl ester 14.257 2129 2128 3.71 1.78 8 11-eicosenoic acid methyl
ester 15.883 2303 2309 0.20 0.33
9 Arachidic acid methyl ester
16.116 2329 2329 0.93 1.32
10 Heneicosanoic acid methyl ester
17.075 2429 2429 0.05 0.09
11 Behenic acid methyl ester 18.217 2530 2530 0.35 0.63 12 Tricosanoic acid methyl
ester 19.618 2630 2632 0.04 0.05
13 Lignoceric acid methyl ester
21.369 2731 2725 0.06 0.10
TOTAL 99.14 98.94 * retention time from T. foenum-graecum chromatogram.
FARMACIA, 2013, Vol. 61, 6
1080
Figure 5
Chromatogram of fatty acid methyl esters from the seeds of T. foenum-graecum.
Figure 6
Chromatogram of fatty acid methyl esters from the seeds of T. caerulea. Conclusions
There are considerable morphological differences between the seeds of the two Trigonella species, as revealed by the SEM and light microscope analyses. The HPLC analysis of the ethanolic solutions indicated that significant differences seem to exist in the phytochemical composition of the two extracts, in both qualitative and quantitative terms. The GC results have shown that the composition and relative concentrations of the various fatty acids are to a good extent similar for the two species, with slight quantitative differences.
FARMACIA, 2013, Vol. 61, 6
1081
References
1. ***. Flora of China, vol. 10. Available online at: http://www.flora.ac.cn/content.aspx?TaxonId=242352930
2. Ceter T, Pinar NM, Akan H et al. Comparative seed morphology of Trigonella L. species (Leguminosae) in Turkey. African Journal of Agricultural Research, 2012; 7:509-522
3. Chatterjee S, Kumar M, Kumar A. Chemomodulatory Effect of Trigonella foenum graecum (L.) Seed Extract on Two Stage Mouse Skin Carcinogenesis. Toxicol Int. 2012; 19:287-94
4. De Souza FHD, Marcos-Filho J. The seed coat as a modulator of seed-environment relationships in Fabaceae. Rev. bras. Bot. 2001; 24 (4): 365-375
5. Dinu M, Popescu ML, Ancuceanu R, Alupoaie R. Contributions to the pharmacobotanic, phytochemical and phytobiological study on Trigonella coerulea (L.) Ser. (Fabaceae). Eur. J. Drug Metabol. Pharmacokinet., 2007, 32 (Supp.), p. 12
6. Eidi A, Eidi M, Sokhteh M. Effect of fenugreek (Trigonella foenum-graecum L) seeds on serum parameters in normal and streptozotocin-induced diabetic rats. Nutrition Research 2007; 27:728-733
7. European Medicines Agency. Community herbal monograph on Trigonella foenum-graecum L., semen, EMA/HMPC/146221/2010. Available online at: http://www.ema.europa.eu/docs/en_GB/document_library/Herbal_Community_herbal_monograph/2011/02/WC500102315.pdf
8. Gîrd CE, Duţu LE, Panţuroiu M. New sources of active principles. Note II. The dynamics of accumulation of the active principles in the species Clematis vitalba L. Farmacia, 2007; 55:171-175
9. Ichihara K, Shibahara A, Yamamoto K, Nakayama T. An improved method for rapid analysis of the fatty acids of glycerolipids. Lipids. 1996; 3:535-9. Erratum in: Lipids 1996; 31:889
10. Lee EL. Genotype X environment impact on selected bioactive compound content of fenugreek (Trigonella foenum-graecum L.). MS thesis, available online at: https://www.uleth.ca/dspace/bitstream/handle/10133/2471/lee,%20ee%20lynn.pdf?sequence=1
11. Mansfeld's Encyclopedia of Agricultural and Horticultural Crops. Hanelt P, Institute of Plant Genetics and Crop Plant Research (Ed.). Springer-Verlag, Berlin, 2001, p. 864-866
12. Nencu I, Vlase L, Istudor V et al. Preliminary research regarding the therapeutic uses of Urtica dioica l. Note I. The polyphenols evaluation. Farmacia 2012; 60: 493-500
13. Nieto MB. Structure and function of polysaccharide gum-based edible films and coatings. In: Edible Films and Coatings for Food Applications. Embuscado ME, Huber KC (Ed.). Springer Science + Business Media, New York (NY), 2009, p. 81.
14. Nishinari K, Takemasa M, Zhang H, Takahashi R. Storage Plant Polysaccharides: Xyloglucans, Galactomannans, Glucomannans. In: Comprehensive Glycoscience. From Chemistry to Systems Biology, vol. 2. Kamerling J, Boons GJ, Lee Y et al. (Ed.), Elsevier, Amsterdam, 2007, p. 617
15. Rudall P. Anatomy of Flowering Plants: An Introduction to Structure and Development, 3rd edition. Cambridge University Press, Cambridge, 2007, p. 100
16. Talbott SM, Hughes K. The Health Professional's Guide to Dietary Supplements. Lippincott, Williams and Wilkins, Philadelphia (PA), 2007, p. 414-415
17. Trifan A, Aprotosoaie AC, Şpac A et al. Contributions to the chemical study of the essential oil isolated from coriander (Omagiu cultivar) fruits. Farmacia. 2012; 60 (2), 177-183
18. Tutin TG, Heywood VH, Burges NA et al. (Ed.). Flora Europea, vol. 1. Cambridge University Press, Cambridge (UK), 1968 (reprinted 2001), p. 151-152
19. Weiss EA. Spice Crops. Cabi Publishing, Wallingford (UK), 2002, p. 85 20. Yang LW, Wu DH, Tang X et al. Fingerprint quality control of Tianjihuang by high-performance
liquid chromatography-photodiode array detection. J Chromatogr A. 2005; 1070:35-42. 21. Zawislak G. The chemical composition of the essential oil of Marrubium vulgare L. from Poland.
Farmacia. 2012; 60 (2), 287-292 __________________________________ Manuscript received: December 13th 2012