
A comparative analysis with East Asian tigers and east ...
22
Demographic dividend in Ethiopia; challenge or opportunity? A comparative analysis with East Asian tigers and east African neighbors By Gizachew Balew (BSc, MPH, PHD Student) Cho Youngtae (Dr.) Graduate school of public health Seoul national University Seoul, South Korea June 2015.
Transcript of A comparative analysis with East Asian tigers and east ...

Demographic dividend in Ethiopia; challenge or opportunity?
A comparative analysis with East Asian tigers and east African neighbors
By
Gizachew Balew (BSc, MPH, PHD Student)
Cho Youngtae (Dr.)
Graduate school of public health
Seoul national University
Seoul, South Korea
June 2015.

Abstract
Background: While developed nations are suffering from a very low fertility and growing
elderly population, Africa’s population is projected to be 2.4 million in in 2050, induced
mostly from a high fertility. The coming decades are expected to be an opportunity for most
African countries to enjoy the demographic dividend that comes from a growing productive
population. This study tries to explore the changing age structure in Ethiopia in comparison
with east African neighbors and East Asian tigers.
Methodology: In this research secondary data on population for sub-Saharan Africa and
East Asian tigers from 2012 UN population projection database was used to review the
country specific population structure and its implications for economic development using
various indicators; changes in population age structure, elderly support ratio, child support
ratio and demographic dividend.
Result: Currently the estimated population dividend for four east African countries; Ethiopia,
Uganda, Tanzania and Kenya shows a positive trend. However, unlike the short duration it
took for East Asian tigers, 40 years, it is projected that this dividend is not fast with an
average duration of 65 and 85 years for Kenya and Tanzania. By 2015 the Ethiopian labor
force is expected to grow at a rate of 3.9% and the consumer population will grow at a rate
of 2.7% per year. Assuming that fertility reduction continues, the 1.1 child support ratio in
1990, which means 11 working age population supporting 10 children of age less than 15,
increases to almost 18 and 26 working groups per 10 children in 2030 and 2050, opening an
opportunity for economic development.
However it is also important to note the fast drop in elderly support ratio from 16 to 9 from
2015 to 2055, a very sharp fall of about 0.5 fold in 2050 and 2.5 fold in 2065 and further 14
fold falls in 2100. This is a very fast drop in support ratio showing the biggest challenge
waiting ahead for the nation if it doesn’t manage and utilize its demographic dividend wisely.
Conclusion and recommendation: East Africa in general and Ethiopia in particular are now
in a demographic transition. However, if this opportunity is missed, if the growing youth
population is not in the economic sector, countries will lose the great potential to accumulate
capital from their growing productive sector, making the demographic dividend a
demographic debt. Demographic dividend can’t be met by luck; rather it is a planned
outcome of strong fertility regulation and expansion of family planning services supported
with strong investment in employment creation, skill development and promotion of saving
and investment.
Key Words: Demographic dividend, Support ratio, East Africa, Ethiopia

Introduction
Most regions of the world have experienced gradually declining rates of population
growth, second population transit ion. Such demographic changes are found to have
played a major role in the economic growth and poverty reductions in the respective
nations. By now, while developed nations are suffering from a very low fertility and
growing elderly population, least developed nations, on the other hand are having the
highest fertility and growing child dependency. By 2050, Africa’s population is projected
to increase to 2.4 billion from 1.1 billion today, making it the region with the largest
population growth(PRB, 2013). This projection is under the assumption of increased
access to family planning that will result in reduction in fertility rates. Globally, over the
last 40 years, women are having fewer children, from 4.7 children per woman in 1970 to
an average of 2.5 children in 2014, the highest fertility being in Niger at 7.4 children per
woman and the lowest in Taiwan at 1.1 children per woman(PRB, 2014). According tyo
this report, Africa has shown a 30% reduction in fertility rate from 6.7 to 4.7 in the same
40 years past, however still growing very rapidly.
Development can be seen from different directions; but as most agree it encompasses,
economic development, political maturity, and social development. Social development
especially demographic changes seem to be given less attention in the way they can play
a role in a nation’s development especially in the African context. According to the wall
street journal, the chances for swift economic growth are higher when a country hits that
sweet spot called “demographic dividend.”(ROSENTHAL, 2014). Similarly a speech made
by the director of the State of World Population 2014 Report says(UNFPA, 2014); if Africa
can get things right, including bringing down its birth rates, the demographic dividend could
add as much as $500 billion to sub-Saharan economies every year for as many as 30 years.

Other major changes needed in the demographic structure inc lude, population age
structure changes, fertility transitions and migration and urbanization changes.
The Demographic Dividend is the potential growth in a country’s economy resulting from a
change in the age structure of its population. It occurs when a falling birth rate changes the
age distribution, so that fewer investments are needed to meet the needs of the youngest age
groups and resources are released for investment in economic development and family
welfare. That is, a falling birth rate makes for a smaller population at young, dependent ages
and for relatively more people in the adult age groups—who comprise the productive labor
force. It improves the ratio of productive workers to child dependents in the population and
makes for faster economic growth and fewer burdens on families. Development history and
evidences tell us that most of the developed nations have already passed through the stage of
demographic dividend and they have invested and made use of it. But what were the
investments made? What should other nations need to adopt to replicate social and economic
development for their nation? These questions need to be researched by academicians and
addressed to African politicians to help for an evidence based decision.
Algebraically, the demographic dividend can be expressed as the difference between the
growth rate of the number of equivalent workers and that of equivalent consumers. The
difference gives the rate of economic growth that would result if the age profile of production
and consumption remained constant. Indeed this is the way that the East Asian economies
grow after World War II, especially South Korea, a country with no natural resource. It has
invested on its human resource and utilized it to harness its economic development to be in
the top global economies with in a very short period(Gribble, 2012). Good demographics
may be a precondition for high growth but is not enough, need to be supported by a descent
governance. Leaders in least developed nations need both the peace dividend, demographic
dividend and financial dividend. It is common to notice that some countries having low
fertility are not making a fast progress in economic achievement like the East Asia fast
development. This does mean that demographic dividend doesn’t mean that the country will
prosper soon rather under the existence of strong and quality education system, good
macroeconomic management, proper investment and job creation, improved access to
quality health service, will help a national to realize its future development agenda. Indeed
these intern depends on the existence of peace and security in the country and the
establishment of a proper and efficient market system that will be brought through a peace
dividend, a term used to show the improved gains in social and economic development
following reduced expenditure on military and other civil conflicts as well as war with in or
out of borderi.
When Japan was in its fast-growth period – in the 1950s and 1960s, and at the recent Korean
miraculous economic development, they funneled literate and well-educated workers into
their factories and services, business sectors and public offices(ref). On the other hand in least
developed nations, industrialization is still very weak where the growing youth is either
underemployed or unemployed, and at the same time is not skilled which results in missed
opportunity for development ii. Africa is expected to face this same problem of jobless
economic growth which is driven by either peace dividend, export of oil, other natural
resource exploitation or in some cases pumping of foreign loan and investment in
infrastructure(ref).
Fertility regulation is at the center of population dividend in most of these Asian countries.
High fertility leads to a fast population growth dominated by a young population that
competes for scarce resource like land, food, shelter, other natural resources and often scarce

and low-paying jobs and contributes to political instability to fulfill its primary needs
(Bonghartiii). On the other hand a growing adult population over its dependent population will
be a resource that helps fuel the country’s economy by being engaged in the productive sector
and bringing innovative ideas if supported by modern scientific and education opportunities.
On the dark side of it, human population can also be the best destructor in terms of civil
conflict, war, and violence if it is not well managed. Countries with more than 40% of young
adults in the population of adults were 2.3 times as likely to experience an outbreak of civil
conflict as countries with smaller proportions during the 1990’s [ iii]. Every success in human
life and development in the globe is brought by the brilliant mind of human generation and
working with human population should be at the center of development for any sustainable
economic, social and political transformation in a nation.
Figure 1: The link between high fertility and economic development
However for most politicians, population is still a measure of military power, number of seats
or voices in a parliament, and source of finance for a regional and sub-regional budget
distribution by the central government, especially when there are ethnic based politics. The
economic burden of having high child dependency and the advantages of productive labor
force at a reduced child dependency is given less attention. Indeed under the current progress
• increased
household size
•Less resource
available per
capita (land,
water, public
goods...)
•Production goes
to basic
consumption
Fertility
•excess consumption
•No/reduced saving
•Less capital
accumulation and
investment
• Intergeneratio
poverty
Household Saving &
investment
•Excess Social
expenditure
(school, health,
basic
consumptions)
•Less capital
investment
• Challenges in
Management
•Chaos Public
•Poor technology
• low production
•Low quality of
health service
•Low quality of
education
•Poverty
Vicious cycle of
poverty

in achieving longevity at a global level, the proportion of elderly population is projected to
grow at a fastest rate in least developed countries for the coming decades, which will curb the
window of opportunity, population dividend in to a population dept; if nations do not
appropriately invest on it. In my argument the least developed nations can’t carry this double
burden, dependency both from the growing child and the elderly if they don’t work on their
fertility and invest on technology and innovation to create vibrant working environment for
the growing working age population.
Among the most valuable resources that the globe has, human capital is the biggest and the
driving force for any economic, social, cultural and political development across the globe.
Nevertheless, the administration of human population seems to be complex and even
forgotten for various reasons. In fact this is also one of the main challenges that lead to
inequity in human development. Especially countries with low socioeconomic condition do
not have the appropriate system to manage their human capital, both the educated and non-
educated ones. The dynamics of human population are not really well understood and
managed in these countries. They don’t have a clear system of enumeration, identification,
training and development, motivation and appropriate utilization.
Indeed before a country reaches to a stage of demographic dividend, most have passed a
fertility control of their population that allows these nations to reduce excessive consumption
while increasing saving and investment at an individual as well as public level. Which intern
resulted in national economic development and building of a better education, health, and
agricultural as well as trade and other services for their population. The main object of this
study is to explore the pattern of population dividend and compares it across east Asian
tigers and east African nations with special emphasis on Ethiopian population structure and
implications for the country’s economy.

Methods and materials
An analysis in this paper is based on the population estimates and medium fertility variant
projections prepared by the Population Division (UN 2012). In this research secondary data
on population for sub-Saharan Africa and East Asian tigers is downloaded from UN
population projection. The same data was used to review the country specific population
structure and its implications for economic development using various indicators. Analysis
was done in excel 2013, where trend and relative changes based from 1990 estimate were
done for some indicators. The most used indicators to review demographic changes include,
population growth for age < 15, labor force, and the elderly, demographic consumer, elderly
support ratio, child support ratio, change in support ratio, demographic dividend and
dependency ratio are used for comparisons.
Results and discussion
The following graph shows the demographic dividend in East Asian countries. As we can see
from the graph, most of the East Asian countries have been in a negative demographic
dividend meaning in a reduction in economic growth rate induced by demographic changes
before 1970 and will again be after 2015. Japan had a positive dividend before 1970 and
entered a negative dividend then after. It means that keeping technological advancement
constant, the negative economic dividend is going to affect the economic development of
these nations negatively. These East Asian tigers have enjoyed a positive dividend between
1970 and 2015 for a maximum of 45 years, when after they all exhaust their positive
economic growth induced only by population dividend. A positive growth in workers per
consumer means that there are more resources available per capita in the economy that can be

used to improve current consumption or to invest in human or physical capital, which
increases future productivity and standards of living. This beneficial effect is a potential that
will materialize only if employment and productivity do not worsen concomitantly. It doesn’t
work if the labor market is not efficient to accommodate the youth, if there is high youth
unemployment. In fact most of the East Asian tigers have managed to effectively utilize these
dividends; one can note that this period is when most east Asian economy was growing very
fast.
A similar comparison for east african countries shows that most african countries were in a
negative population devidend when the east asian countries were in a fast economic growth.
However, currently the estimated population devidend for four east African countries,
Ethiopia, uganda, tanzaniya and kenya shows a positive trend. Kenya and Tanzaniya were
already in a higher labour force scince 1985 and are still in population devidend but brought
by growing labour force. It is expected that this devidend is not fast with an average duration
of 65 and 85 years for kenya and tanzaniya unlike the short duration for east asian tigers,
-0.12
-0.07
-0.02
0.03
0.08
195
0
195
5
196
0
196
5
197
0
197
5
198
0
198
5
199
0
199
5
200
0
200
5
201
0
201
5
202
0
202
5
203
0
203
5
204
0
204
5
205
0
205
5
206
0
206
5
207
0
207
5
208
0
208
5
209
0
209
5
210
0
China, Hong Kong Japan Republic of Korea Singapore Thailand Viet Nam

which took an average of 40 years. This implies that the fertility reduction is very slow to
better use of this opportunity in the two countries. The fertility level of south korea was
arround 6.16 in 1960 reduced to replacement level fertility with in 1983 iv and continued to
become 1.187 in 2013. However all of the above eastern African countries fertility have
been declining very slowly for the last couple of decades, 6 and above in 1990, and almost
the same in 2005 except for Kenya where fertility declined to 5 v. On the other hand for
Uganda and Ethiopia, it startes late after 2000 and is estimated to take about 60 and 75 years
for Ethiopia and Uganda, which is also a longer duration than the east asian tigers seen in
figure 1. However generally, there is a positive devidend that will be brought by change in
population age structure in east aftrican countries if the expected reduction in fertility is
expected to happen which needs strong effot from these nations.
The Ethiopian population has one of the fastest population growth rates in the world, with an
estimated growth rate of 2.6 per year. Estimates of the united nation world population
projection indicate that Ethiopian population will reach to 137.7 million and 187.6 million in
-0.06
-0.04
-0.02
0
0.02
0.04
0.06
1950
1955
1960
1965
1970
1975
1980
1985
1990
1995
2000
2005
2010
2015
2020
2025
2030
2035
2040
2045
2050
2055
2060
2065
2070
2075
2080
2085
2090
2095
2100
Ethiopia
Kenya
Uganda

2030 and 2050 making Ethiopia as one of the 10 world populous nation. From 1990 to 2010,
even if there are reductions in fertility from above 6 points to 4.8, the population growth and
proportion of children under the age of 15 to elderly population and productive population
are almost about 48% of the national population having a 15:16:1 ratio between children,
labor force, and old age population in 1990 and 14:16:1 in 2010. This still shows the high
dependency ratio of children. Indeed if family planning utilization continues and fertility
reduces it is expected that this will drop to 9:17:1 and 4:11:1 in 2030 and 2050 respectively.
This will have a child dependency ratio of 0.85 in 2010, 0.55 and 0.39 in 2030 and 2050
respectively while having an old age dependency ratio of 0.06, 0.07 and 0.10 from 2010 to
2030 and 2050.
Year <15 lab eld chil.dep eld.dep Pop(mill)
1990 15 16 1 0.92 0.06 48
2000 16 16 1 0.93 0.06 66
2010 14 16 1 0.85 0.06 87.1
2030 9 17 1 0.55 0.07 137.7
2050 4 11 1 0.39 0.10 187.6
However it doesn’t mean that the youth population is reducing, rather the elderly population
is growing increasing the proportion mix of the dependent population. It is very challenging
for a developing nation with a weak economic structure to cope with the growing old age and
child dependent population.
Year lab Grth Cons. Grth Pop. Dividend
2000 0.032 0.032 0.000
2005 0.032 0.031 0.002
2010 0.036 0.029 0.007
2015 0.039 0.027 0.012

As we have seen earlier the Ethiopian population grows in a very fast growth rate. The
proportion of the child dependent population is more than 80% currently. However the
reduction in mortality due to various public health interventions and relative improvement in
health condition has brought the child population to join to a productive adult population.
Demographically this results in a higher growth of the productive adult population. Coupled
with this rapid growth of the adult population is a slight reduction in fertility that supports
the opening of a demographic window of opportunity, the demographic dividend where the
productive population grows at a faster rate compared to the consumer population. This
leads to a surplus of human resource for most of the productive sectors. In the year 2000,
according to the United Nations 2012 population estimate, the adult population growth and
the consumer growth were almost equal which starts to shift then after to a relative increase
in productive population with its peak around 2015-2020. By 2015 the Ethiopian labor force
is expected to grow at a rate of 3.9% and the consumer population will grow at a rate of 2.7%
per year, showing a maximum growth in labor force. This will continue to the year 2055. In
2030, a labor force growth of 2.5 and a consumptive population growth of 1.9 is expected,
the major growth in to labor force going to be brought by the large number of youth
population entering the adult population and the reduction in consumptive population is due
to the reduction in fertility. However after 2055, the dependent population and the productive
2020 0.036 0.025 0.011
2025 0.031 0.023 0.008
2030 0.028 0.021 0.007
2035 0.025 0.019 0.006
2040 0.022 0.017 0.005
2045 0.019 0.015 0.004
2050 0.016 0.013 0.003
2055 0.013 0.012 0.001

population are expected to grow at a rate of 1.3 and 1.2 where after the productive labor
force growth starts to decline while the consumptive population starts to grow faster, due to
aging of the younger population. The totality of this period where the labor force growth is
much higher than the growth of consumer population is called a window of opportunity for
economic development. Most developed nations have effectively used their dividend and have
achieved their economic and social development through well-designed policy directions.
Africa in general and Ethiopia in particular are now in this opportunity and it is expected
that the initiation of various development strategies will help to utilize this human resource
and capitalize for its economic development. However there is a fear that there seems to be a
less attention to demographic changes and the youth population are not given attention for
the skill and technology transfer and employment opportunity creation to use the productive
power of this population.
This is under the current assumption of continued fall in fertility level. This time is a golden
opportunity where politicians have to give emphasis in reaching the youth population, invest
on its education, involve in the productive sector by creating dynamic employment
opportunities. However if this growing youth population is not in the economic sector the
country will lose the great potential to accumulate capital from its growing productive sector.
However the failure to do so will lead to a population dept. rather than a population dividend,
where after 40 and 50 years, this growing youth population will turn to an elder,
nonproductive and consumptive population depleting the national reserve. Least developed
nations can’t accommodate the double burden of increasing child population and old age
population if they don’t utilize the demographic dividend.
Economists and demographers have introduced the use of an economic support ratio to show
the change in population dynamics and its effect on the national economy. Indeed youth

dependency ratio and old age dependency ratio are the commonly used demographic terms
that show how much the productive labor force and the dependent populations in a nation
vary across time. Economic support ratio is a similar term which is almost the inverse of a
dependency ratio, however this term shows how many labor of productive population
supports one dependent population. There are two commonly used operational terms under
this definition, the demographic support ratio and the effective support ratio. The
demographic support ratio is an indicator estimated by the proportion of the working age
population to the consumer population in a nation. In this instance the productive population
is estimated to be the population in the age interval between 15 and 64 whereas the consumer
population is all the population in the nation. However researchers have come up with
various techniques to measure the consumer population as it is believed that age has a big
effect in consumption difference. A study in US (Cutler, Poterba, Sheiner, Summers, &
Akerlof, 1990) has come up with the following formula to calculate the consumer population.
0.72 ∗ (𝑎𝑔𝑒 <= 20) + 𝑙𝑎𝑏𝑜𝑟 (15 − 64𝑎𝑔𝑒) + 1.27 ∗ (𝑎𝑔𝑒 >= 65)
According to this calculation youth and children below the age of 20 have about 30% less
consumption than the productive labor force and the elderly have about 27% high rate of
consumption. Another view is the introduction of real or effective labor force and effective
consumer. In this argument all people under the age of 15 and above the age of 65 are not
dependents and all people in the age 15-64 are not productive. Hence the recall data of labor
participation and consumer only population has to be taken to calculate the effective
economic support ratio. However due to limitations in data, we will concentrate on
demographic support ratio to estimate the effective economic support ratio and forward our
views on this regard.

Year youth elderly ESR
1990 1.092 16.049 0.506
2010 1.176 15.812 0.523
2030 1.805 15.272 0.618
2050 2.586 9.706 0.671
As can be seen from the above table, the Ethiopian child support ratio is increasing from
1990 to 2050 according to the projection. A support ratio of 1.1 in 1990 which means 11
working age population supporting 10 children of age les than 15 is increasing to almost 18
working groups for 10 children by 2030 and 26 working groups per 10 children in 2050. This
is in line with the expected reduction in the fertility assuming current trend in family planning
continues. Similarly the increase in life expectancy from an improved health system and
improved living standard might help in increasing the number of working age population of
the country, which is a big opportunity ifs well managed. A reduction in dependent
population will give room for most households and the public to increase saving and
investment that later can have an input on the nations development in large. However on the
other hand support ratio to the elderly population remains almost constant from 1990 to
2030 which is another added opportunity that will not bring much burden for the public in
taking care of elderly population. In spite of this, after 2015, the already productive
population that joined the labor force in the early 21st century will enter in to their elderly
life reducing the old age support ratio significantly, from almost 16 working age people to 9
working age people per one elderly in 2055 and further dramatic fall then after. Generally
looking the Ethiopian economic support ratio is expected to rise from 1990, where one labor
worker is supposed to support himself and one another person, it will not change till 2010 but
is expected to change slightly to 0.62 in 2030 which means that 5 working age people will
support themselves and three others which shows a reduction in two dependent population

for every five working age population. This is expected to increase further in 2055 to 0.67
indicating two working age people supporting themselves and one other dependent
population. This might be brought following the demographic dividend that starts in the early
21st century and continues to the middle of the century. However this is also expected to fall
in the last quarter of the century following the rapid aging of the youth population that has
entered the productive labor force in the early years of the century.
However the above figure is an absolute one and it doesn’t show the changes over time.
Demographers have created a percentage change in support ratio from a relative fixed time
period to show the changes happening in the economic support ratio overtime. Denoted by
alpha (α)at time “t”, the percentage change in support ratio is calculated based on the
support ratio that has been in the nation taking the 1990 as the baseline for this paper.
Accordingly the change in alpha is presented in the following table. Indeed the change in
support ratio can be decomposed in to the change in support ratio due to change in child
population structure or change in old age population structure.
Mathematically
0.00
5.00
10.00
15.00
20.00
25.00
1950 1957 1964 1971 1978 1985 1992 1999 2006 2013 2020 2027 2034 2041 2048 2055 2062 2069 2076 2083 2090 2097
Economic support ratio
YSR EldSR ESR

𝛼 =𝑝
𝑐, 𝑤ℎ𝑒𝑟𝑒 𝑝 = 𝑝𝑟𝑜𝑑𝑢𝑐𝑡𝑖𝑣𝑒 𝑙𝑎𝑏𝑜𝑢𝑟 𝑓𝑜𝑟𝑐𝑒, 𝑐 = 𝑑𝑒𝑚𝑜𝑔𝑟𝑎𝑝ℎ𝑖𝑐 𝑐𝑜𝑛𝑠𝑢𝑚𝑒𝑟,
The demographic consumer, which approximates the economic consumer population,
constitutes the total sum of child population below the age of 15, productive labor force
between 15 and 64 and elderly population above the age of 65.In other words,
α =p
(C+P+E)
Change in alpha (α) is calculated as change in support ratio at time “t” compared to the
reference time, time “0”.
∆α =(αt − α0 )
𝛼0
= 𝛼𝑡
𝛼0
− 1
Further decomposition shows that the change in support ratio comes from change in child
support ratio and change in elderly support ratio. According Cutler et.al, this may further be
shown as follows:
∆𝛂 = (∆𝐏 − ∆𝐂) ∗ [𝐂
𝐂 + 𝐏 + 𝐄] + (∆𝐏 − ∆𝐄) ∗ [
𝐄
𝐂 + 𝐏 + 𝐄]
Change in child support ratio Change in elderly support
ratio
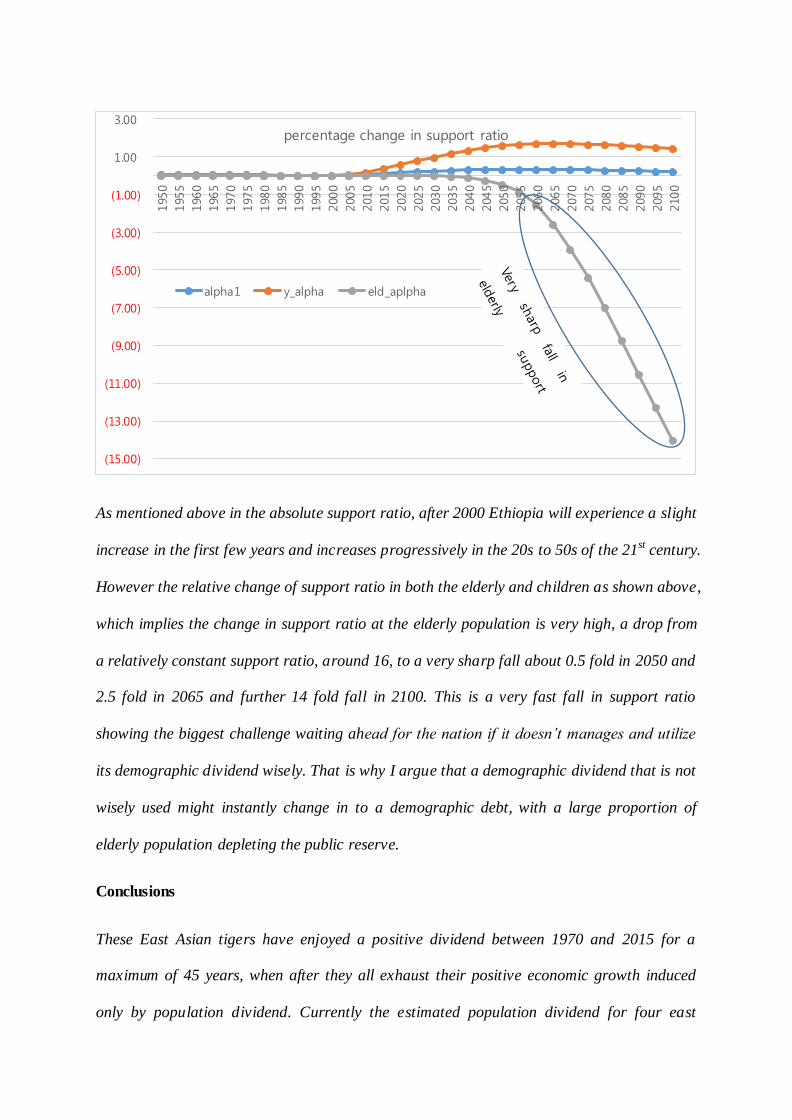
As mentioned above in the absolute support ratio, after 2000 Ethiopia will experience a slight
increase in the first few years and increases progressively in the 20s to 50s of the 21st century.
However the relative change of support ratio in both the elderly and children as shown above,
which implies the change in support ratio at the elderly population is very high, a drop from
a relatively constant support ratio, around 16, to a very sharp fall about 0.5 fold in 2050 and
2.5 fold in 2065 and further 14 fold fall in 2100. This is a very fast fall in support ratio
showing the biggest challenge waiting ahead for the nation if it doesn’t manages and utilize
its demographic dividend wisely. That is why I argue that a demographic dividend that is not
wisely used might instantly change in to a demographic debt, with a large proportion of
elderly population depleting the public reserve.
Conclusions
These East Asian tigers have enjoyed a positive dividend between 1970 and 2015 for a
maximum of 45 years, when after they all exhaust their positive economic growth induced
only by population dividend. Currently the estimated population dividend for four east
(15.00)
(13.00)
(11.00)
(9.00)
(7.00)
(5.00)
(3.00)
(1.00)
1.00
3.00
195
0
195
5
196
0
196
5
197
0
197
5
198
0
198
5
199
0
199
5
200
0
200
5
201
0
201
5
202
0
202
5
203
0
203
5
204
0
204
5
205
0
205
5
206
0
206
5
207
0
207
5
208
0
208
5
209
0
209
5
210
0
percentage change in support ratio
alpha1 y_alpha eld_aplpha

African countries, Ethiopia, Uganda, Tanzania and Kenya shows a positive trend, it is
expected that this dividend is not fast with an average duration of 65 and 85 years for Kenya
and Tanzania unlike the short duration for East Asian tigers, which took an average of 40
years. This shows a rise in productive labor force compared to the consumer population in
the region, under the assumption of continued fertility reduction.
By 2015 the Ethiopian labor force is expected to grow at a rate of 3.9% and the consumer
population will grow at a rate of 2.7% per year, showing a maximum growth in labor force,
which is projected to continue to the year 2055. Assuming that family planning utilization
continues and fertility reduces the proportion of children, labor force and elderly is
expected to drop to 9:17:1 and 4:11:1 in 2030 and 2050 respectively, from 15:16:1 in 1990 .
This will have a child dependency ratio of 0.85 in 2010, 0.55 in 2030 and 0.39 in 2050 while
having an old age dependency ratio of 0.06, 0.07 and 0.10 in 2010, 2030 and 2050
respectively. Indirectly this shows, a support ratio of 1.1 in 1990 which means 11 working
age population supporting 10 children of age less than 15 is increasing to almost 18 working
groups for 10 children by 2030 and 26 working groups per 10 children in 2050. The increase
in supporting labor force opens an opportunity for saving and investment in a nation.
Generally the Ethiopian economic support ratio is expected to rise after 2010. In 1990, one
labor worker is supposed to support himself and one another person, which is expected to
grow to 0.62 in 2030 which means that 5 working age people will support themselves and
three others which shows a reduction in two dependent populations for every five working
age population. However it is also important the fast drop in elderly support ratio from 16 to
9 from 2015 to 2055, a very sharp fall of about 0.5 fold in 2050 and 2.5 fold in 2065 and
further 14 fold fall in 2100. This is a very fast fall in support ratio showing the biggest
challenge waiting ahead for the nation if it doesn’t manage and utilize its demographic
dividend wisely.

Africa in general and Ethiopia in particular are now in a demographic dividend opportunity
and it is expected that the initiation of various development strategies will help to utilize this
human resource and capitalize for its economic development. However there is a fear that
there seems to be a less attention to demographic changes and the youth population does not
have the opportunity for the skill and technology transfer and employment creation to use the
productive power of this population. If the growing youth population is not in the economic
sector countries will lose the great potential to accumulate capital from their growing
productive sector, making the demographic dividend a demographic debt.
In conclusion demographic dividend will not be attained by luck, rather it is a planned
outcome of strong fertility regulation and expansion of family planning services. It doesn’t
also mean that change in population age structure will bring economic development, if there
is no strong investment in employment creation, skill development and promotion of saving
and investment.
Reference
Cutler, D. M., Poterba, J. M., Sheiner, L. M., Summers, L. H., & Akerlof, G. A. (1990). An Aging
Society: Opportunity or Challenge? Brookings Papers on Economic Activity, 1990(1), 1-73.
doi: 10.2307/2534525
Gribble, J. N. (2012). South Korea's Demographic Dividend:
http://www.prb.org/Publications/Articles/2012/south-korea-population.aspx.
PRB. (2013). World Population Data Sheet, http://www.prb.org/Publications/Datasheets/2013/2013-
world-population-data-sheet/data-sheet.aspx retrived on june 2015.
PRB. (2014). Population Reference Bureau. http://www.prb.org/Publications/Datasheets/2014/2014-
world-population-data-sheet/data-sheet.aspx retrieved on Jan 26.2015.
ROSENTHAL, R. (2014). For Africa and Asia, Two demographic Devidended:
http://blogs.wsj.com/economics/2014/11/21/for-africa-and-asia-two-demographic-
dividends/, The Wall Street Journal.
UNFPA. (2014). Statement of the Executive Director on The State of World Population 2014 report :
http://www.unfpa.org/news/statement-executive-director-state-world-population-2014-
report#sthash.w3oZs6gZ.dpuf.

ii resource http://www.ft.com/cms/s/0/bd935806-6d00-11e1-a7c7-00144feab49a.html#ixzz3Q0ZfzQUg ).
ii Pilling David. http://www.ft.com/intl/cms/s/0/bd935806-6d00-11e1-a7c7-
00144feab49a.html?siteedition=uk#axzz3Q2Ks9Qlk
iii http://populationaction.org/reports/the-security-demographic-population-and-civil-conflict-after-
the-cold-war/
iv Korea Fertility Rate Index Mundi; http://www.indexmundi.com/facts/korea/fertility-rate retrieved
on Jun 20/ 2015
v World Bank Health Nutrition and Population Statistic
http://databank.worldbank.org/data/reports.aspx?source=health-nutrition-and-population-statistics
retrieved on Jun 20/ 2015