A COMPARATIVE ANALYSIS OF HOUSEHOLD FOOD SECURITY MEASURES...
18
International Journal of Food and Agricultural Economics ISSN 2147-8988, E-ISSN: 2149-3766 Vol. 5, No. 2, 2017, pp. 41-58 41 A COMPARATIVE ANALYSIS OF HOUSEHOLD FOOD SECURITY MEASURES IN RURAL ZIMBABWE Blessing Butaumocho Food and Nutrition Council, Head of Programs, 1574 Elpes Road, Hatcliffe, Harare, Zimbabwe, Email:[email protected] Plaxedes T. Chitiyo Duquesne University, Center for Environmental Research and Education, 600 Forbes Avenue, Pittsburgh, Pennsylvania 15282, USA, Email: [email protected] Abstract Despite development of numerous food security measures for humanitarian emergency programs, there is limited research on which food security measures complement each other. A comparative analysis of household food security measures, that is, household hunger scale, food consumption score, and consolidated approach for reporting food security indicators, utilizing Zimbabwe Vulnerability Assessment Committee 2014 Rural Livelihoods Assessment data, was conducted in Zimbabwe. According to the results, the household hunger score produced the least levels of food insecurity, followed by the consolidated approach for reporting food security indicators while the food consumption score produced the highest food insecurity prevalence. The consolidated approach for reporting food security indicators is recommended for supporting long-term chronic food insecurity interventions and the household hunger score for food security assessments to inform emergency relief. Further research is required to refine and contextualize the food consumption score cut-off points to rural Zimbabwe. Keywords: Comparative analysis; Emergency programs; Food security; Household food security measures; Zimbabwe Vulnerable Assessment Committee JEL Codes: Q1, Q18 1. Introduction Poor conceptualizations of food security as well as its measurement have been blamed for poor policy designs and their performance since diagnosis and response are driven by measurement (Webb et al., 2006).Food security, a common currency in the development discourse in the 1970s has evolved from being just about food supply and availability to being complex and multi-dimensional to include utilization, access, and stability (Cafiero, Melgar- Quiñonez, Ballard, & Kepple, 2014; Coates, 2013; Committee on Food Security, 2012; Connolly-Boutin and Smit 2016; FAO, 2008; Maxwell, Coates, & Vaitla 2013). This complexity of the food security concept has presented challenges on its measurement despite progress made to reach international consensus on what it is and the importance of its sound and viable measurement (Barret, 2010; Headey & Ecker, 2012; Webb et al., 2006). However, the resurgence of food security—a critical concept used by development agencies and policy- makers for economic and humanitarian needs assessment emergency programs —on the international development agenda has brought to the fore the need to improve its measurement (Barrett, 2010; Coates, 2013; Connolly-Boutin & Smit, 2016; Headey & Ecker, 2012;
Transcript of A COMPARATIVE ANALYSIS OF HOUSEHOLD FOOD SECURITY MEASURES...
International Journal of Food and Agricultural Economics
ISSN 2147-8988, E-ISSN: 2149-3766
Vol. 5, No. 2, 2017, pp. 41-58
41
A COMPARATIVE ANALYSIS OF HOUSEHOLD FOOD SECURITY
MEASURES IN RURAL ZIMBABWE
Blessing Butaumocho
Food and Nutrition Council, Head of Programs, 1574 Elpes Road, Hatcliffe,
Harare, Zimbabwe, Email:[email protected]
Plaxedes T. Chitiyo Duquesne University, Center for Environmental Research and Education, 600
Forbes Avenue, Pittsburgh, Pennsylvania 15282, USA, Email: [email protected]
Abstract
Despite development of numerous food security measures for humanitarian emergency
programs, there is limited research on which food security measures complement each other.
A comparative analysis of household food security measures, that is, household hunger scale,
food consumption score, and consolidated approach for reporting food security indicators,
utilizing Zimbabwe Vulnerability Assessment Committee 2014 Rural Livelihoods Assessment
data, was conducted in Zimbabwe. According to the results, the household hunger score
produced the least levels of food insecurity, followed by the consolidated approach for
reporting food security indicators while the food consumption score produced the highest food
insecurity prevalence. The consolidated approach for reporting food security indicators is
recommended for supporting long-term chronic food insecurity interventions and the
household hunger score for food security assessments to inform emergency relief. Further
research is required to refine and contextualize the food consumption score cut-off points to
rural Zimbabwe.
Keywords: Comparative analysis; Emergency programs; Food security; Household food
security measures; Zimbabwe Vulnerable Assessment Committee
JEL Codes: Q1, Q18
1. Introduction
Poor conceptualizations of food security as well as its measurement have been blamed for
poor policy designs and their performance since diagnosis and response are driven by
measurement (Webb et al., 2006).Food security, a common currency in the development
discourse in the 1970s has evolved from being just about food supply and availability to being
complex and multi-dimensional to include utilization, access, and stability (Cafiero, Melgar-
Quiñonez, Ballard, & Kepple, 2014; Coates, 2013; Committee on Food Security, 2012;
Connolly-Boutin and Smit 2016; FAO, 2008; Maxwell, Coates, & Vaitla 2013). This
complexity of the food security concept has presented challenges on its measurement despite
progress made to reach international consensus on what it is and the importance of its sound
and viable measurement (Barret, 2010; Headey & Ecker, 2012; Webb et al., 2006). However,
the resurgence of food security—a critical concept used by development agencies and policy-
makers for economic and humanitarian needs assessment emergency programs—on the
international development agenda has brought to the fore the need to improve its measurement
(Barrett, 2010; Coates, 2013; Connolly-Boutin & Smit, 2016; Headey & Ecker, 2012;
A Comparative Analysis of Household…
42
Hendricks, 2015; Pinstrup-Andersen, 2009; Schindler, Graef, König, & Mchau, 2016; Webb
et al., 2006).
Given the importance of food security, it is necessary to identify appropriate measures that
complement each other to capture all the important facets of food security (Cafiero et al. 2014;
Coates, 2013; Desiere, D’Haese1, & Niragira, 2015; Maxwell et al., 2013). Different aspects
of household level food security have been captured using food consumption score (FCS),
household hunger scale (HHS), and consolidated approach for reporting food security
indicators (CARI) (Ballard, Coates, Swindale, & Deitchler, 2011; Heady & Ecker, 2013;
Maxwell et al., 2013; WFP, 2009). The FCS, a dietary diversity indicator, has the ability to
measure consumption of macro and micronutrients as well as predict economic status and
malnutrition levels (WFP, 2009; Heady & Ecker, 2013; Maxwell et al., 2013). Although FCS
is simple and cost-effective in tracking temporal dimension of food security, and displays
substantial sensitivity to shocks, research has shown that it can misclassify food insecurity
(Brinkman, de Pee, Sanogo, Subran, & Bloem, 2010; Headey & Ecker, 2013; Headey & Ecker,
2012).
The second measure, the HHS, is an experiential/perception-based indicator that utilizes
household food deprivation experiences where reactions captured from a survey and
summarized on a scale capture the most severe food security behaviors (Ballard et al., 2011;
Maxwell et al., 2013). The HHS is a derivative of the household food insecurity access Scale
(HFIAS), and recognizes additional important subsets of measures that capture food
consumption related behaviors (Maxwell et al., 2013). Finally, the CARI combines the FCS,
the household poverty measure, and household assets endowments to measure a household’s
current food security status as well as its coping capacity and hence its vulnerability or
resilience to potential future shocks (Maxwell et al., 2013).
Despite development of these indicators (i.e., FCS, HHS, and CARI) to measure different
food security aspects, research on the current use of these measures remains limited. To date,
comparative analyses of different common food security measurements such as coping
strategies index (CSI), reduced coping strategies index (RCSI), household food insecurity and
access scale (HFIAS), HHS, FCS, and household dietary diversity scale (HDDS) have been
conducted (De Cock et al., 2013; Desiere et al., 2015; Faber, Schwabe, & Drimie, 2009; Heady
& Ecker, 2013; Kennedy et al., 2010; Maxwell et al., 2013; Maxwell et al., 2014). Extant
research indicates that combining indicators improves food security measurement since
indicators differ in the aspects of food security they capture; but it is important to know which
indicators are suitable for which applications (Maxwell et al., 2013; Maxwell et al., 2014).
Since food security is multidimensional, there is need for valid and reliable measurement of
food security where more than one suitable indicator is selected (Cafiero et al., 2014; Desiere
et al., 2015; Maxwell, Vaitla, & Coates, 2014). Thus, there is need for more research in this
area (Maxwell et al., 2013; Maxwell et al., 2014).
1.1 Purpose and Objectives of the Study
The purpose of this current study was therefore, to compare household food security
measures in the rural areas of Zimbabwe using data from the Zimbabwe Vulnerability
Assessment Committee (ZimVAC)’s 2014 rural livelihoods assessment. The ZimVAC is an
inter-sectoral multi-agency mandated by the Government of Zimbabwe to regularly generate
and provide the government and its development partners with reliable information for
planning and programming in order to improve and strengthen rural and urban livelihoods
(ZimVAC, 2015). It is also an integral part of the Southern Africa Development Coordination
Regional Vulnerability Assessment Committee (SADC-RVAC), a multi-agency consortium,
which supports up-to-date vulnerability assessments and risk mapping in the region (SADC,
2012).
B. Butaumocho, P. Chitiyo
43
The way food security is measured is crucial in providing answers to practical questions
such as what types of people are food-insecure, and where do they live?, what is the effect of
different government policies on the incidence and depth of poverty and food insecurity?, and
who should be eligible for benefits such as food aid or cash hand-outs? It is within this context
that this research was designed to compare three measures (i.e., HHS, FCS, and CARI) used
by the ZimVAC 2014 to determine household food security status among rural livelihoods.
The following questions guided this study:
1. How does the measurement of household food insecurity prevalence obtained with
HHS, CARI and FSC compare? To what extent do they tell the same ‘‘story’’ about household
food insecurity and classify households similarly?
2. What are the strengths and limitations of each of these household food security
measurements?
3. What are the programming implications of these household food security measures
to household food security improvement responses?
4. What are the potential costs of relying on an arbitrary selection of single indicators to
classify household food-insecurity in Zimbabwe?
2. Method
2.1. Study Area
The study was carried out in Mashonaland West and Matabeleland South rural provinces
located in the north-western and southern Zimbabwe with approximately 1,542,000 and
744,000 people in 2014, respectively (Figures1 and 2). Mashonaland West province was
selected to represent staple cereal surplus provinces while Matabeleland South represents
staple cereal deficit provinces. Agriculture is the main source of livelihood for rural households
in both provinces, although crop production is prominent in Mashonaland West while livestock
and remittances from outside Zimbabwe are greater in Matabeleland South. The difference in
the livelihoods between the two provinces is largely due to differences in agro-ecology with
Mashonaland West receiving higher mean annual rainfall amounts and experiencing fewer and
less severe dry spells and droughts compared to Matabeleland South (Vincent & Thomas,
1960). Agro-ecological zone 1 receives above 1,000mm of annual rainfall, zone 2 averages
between 750 and 1,000mm, zone 3 between 650 and 800mm while the dry agro-ecological
regions 4 and 5 that covers most Matabeleland South province receive less than 650mm of
rainfall (Vincent & Thomas, 1960).
2.2. Data collection
The study obtained primary household level data for the two selected rural provinces from
the 2014 ZimVAC rural livelihood assessment survey data set (ZimVAC, 2014). The data were
collected in May 2014 by four enumerators in each of the country’s 60 rural districts of
Zimbabwe over a period of 15 days during harvesting time. The 2014 harvest was good
throughout the country with low production areas like Matabeleland South having above
normal crop harvest.
The ZimVAC 2014 rural household survey sample was determined using the WFP
technical guidelines on sampling for vulnerability assessments (WFP, 2004). The sample
design aimed for estimating household food insecurity prevalence at 95% level of confidence,
power level of 80% and a margin of error of not more than 10% at district level. Hence, districts
were the survey sampling and reporting domains. Average prevalence of food insecure
households in rural Zimbabwe was estimated at 20% based on previous ZimVAC rural
assessments.

A Comparative Analysis of Household…
44
Source: Department of Surveyor General (2008)
Figure 1. Mashonaland West Province Agro-ecological Regions by District
Source: Department of Surveyor General (2008); Zimbabwe National Statistics Agency
(2008).
Figure 2. Matabeleland South Province Agro-Ecological Regions by District
The minimum target sample size of 164 households per district was set given the desired
confidence and precision levels when a Two-Stage Cluster sampling aiming for not more than
20% minimum detectable differences amongst districts was used. In order to guarantee this
minimum sample size a 10% contingency was added to the districts’ minimum sample size.
Each district was considered a strata and each ward a cluster in which an enumeration area
(EA) or villages was randomly selected. In each district 15 wards (hence, 15 EAs) were chosen
using systematic random sampling, and then 12 households were sampled from each EA using
systematic random sampling resulting is 180 households being sampled in each district.
This study extracted all relevant data from the 2014 rural livelihoods assessment data using
the select cases option in SPSS. This created a sample of households from the two selected
provinces (Table 1). In Gwanda district of Matabeleland South one household was lost whereas
in Insiza district one household was fortuitously added. Consequently, the two provinces were

B. Butaumocho, P. Chitiyo
45
represented by 1,260 households each. A summary description of the sample used in this study
is presented in Table 2.
Table 1. Sampled Households in Mashonaland West and Matabeleland South Provinces
in 2014
Mashonaland West Matabeleland South
Districts Sampled Households Districts Sampled Households
Chegutu 180 Beitbridge 180
Hurungwe 180 Bulilima 180
Kariba 180 Mangwe 180
Makonde 180 Gwanda 179
Zvimba 180 Insiza 181
Mhondoro-Ngezi 180 Matobo 180
Sanyati 180 Umzingwane 180
Total 1260 Total 1260
Source: ZimVAC, 2014.
Table 2. Household Demographic Summary
Mashonaland West Matabeleland South
Average household size 5 members 6 members
Adequate agricultural labor 56% 56%
Household head age 47 years 53 years
Household head over 60 years old 25% 34%
Household head gender 70 % male 60 % male
Widowed households 15% 24%
Household head with at least
Primary education
74%
69%
Households with at least Secondary
education
34%
22%
Households with at least one
Orphan
27% 27%
Household with at least one
Chronically ill members
6% 6%
Households with at least one
Mentally/physically challenged
member
6% 6%
2.3. Household Food Security Measurements Computations
Using the selected sample of 2, 520 households from the two provinces and adapted SPSS
syntaxes, HHS, FCS, and CARI values for each household were computed.
2.3.1. Food Consumption Score
The FCS used by ZimVAC is based on the WFP guidance (WFP, 2008). The FCS for each
household was computed by summing up the products of the consumption frequency for each
food group and its corresponding assigned nutritional weight. As such, the FCS is a composite
measure of dietary diversity, food frequency, and relative nutritional importance of different
A Comparative Analysis of Household…
46
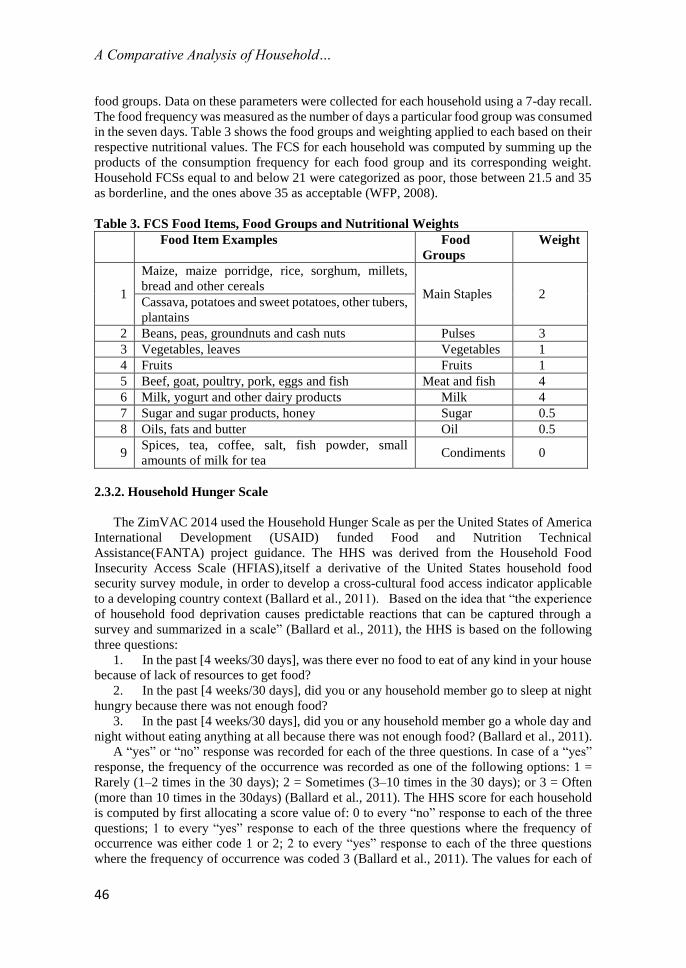
food groups. Data on these parameters were collected for each household using a 7-day recall.
The food frequency was measured as the number of days a particular food group was consumed
in the seven days. Table 3 shows the food groups and weighting applied to each based on their
respective nutritional values. The FCS for each household was computed by summing up the
products of the consumption frequency for each food group and its corresponding weight.
Household FCSs equal to and below 21 were categorized as poor, those between 21.5 and 35
as borderline, and the ones above 35 as acceptable (WFP, 2008).
Table 3. FCS Food Items, Food Groups and Nutritional Weights
Food Item Examples Food
Groups
Weight
1
Maize, maize porridge, rice, sorghum, millets,
bread and other cereals Main Staples 2
Cassava, potatoes and sweet potatoes, other tubers,
plantains
2 Beans, peas, groundnuts and cash nuts Pulses 3
3 Vegetables, leaves Vegetables 1
4 Fruits Fruits 1
5 Beef, goat, poultry, pork, eggs and fish Meat and fish 4
6 Milk, yogurt and other dairy products Milk 4
7 Sugar and sugar products, honey Sugar 0.5
8 Oils, fats and butter Oil 0.5
9 Spices, tea, coffee, salt, fish powder, small
amounts of milk for tea Condiments 0
2.3.2. Household Hunger Scale
The ZimVAC 2014 used the Household Hunger Scale as per the United States of America
International Development (USAID) funded Food and Nutrition Technical
Assistance(FANTA) project guidance. The HHS was derived from the Household Food
Insecurity Access Scale (HFIAS),itself a derivative of the United States household food
security survey module, in order to develop a cross-cultural food access indicator applicable
to a developing country context (Ballard et al., 2011). Based on the idea that “the experience
of household food deprivation causes predictable reactions that can be captured through a
survey and summarized in a scale” (Ballard et al., 2011), the HHS is based on the following
three questions:
1. In the past [4 weeks/30 days], was there ever no food to eat of any kind in your house
because of lack of resources to get food?
2. In the past [4 weeks/30 days], did you or any household member go to sleep at night
hungry because there was not enough food?
3. In the past [4 weeks/30 days], did you or any household member go a whole day and
night without eating anything at all because there was not enough food? (Ballard et al., 2011).
A “yes” or “no” response was recorded for each of the three questions. In case of a “yes”
response, the frequency of the occurrence was recorded as one of the following options: 1 =
Rarely (1–2 times in the 30 days); 2 = Sometimes (3–10 times in the 30 days); or 3 = Often
(more than 10 times in the 30days) (Ballard et al., 2011). The HHS score for each household
is computed by first allocating a score value of: 0 to every “no” response to each of the three
questions; 1 to every “yes” response to each of the three questions where the frequency of
occurrence was either code 1 or 2; 2 to every “yes” response to each of the three questions
where the frequency of occurrence was coded 3 (Ballard et al., 2011). The values for each of

B. Butaumocho, P. Chitiyo
47
the three questions were summed up to obtain a household score ranging from 0 to 6 with the
higher scores indicating poorer household food access status(Ballard et al., 2011).
2.3.3. Household Food Consumption Score
CARI combines current household food access indicators with measures of household
coping capacity like economic vulnerability and asset depletion to determine the level of food
insecurity within a given population (WFP, 2015). In the 2014 ZimVAC rural livelihoods
assessment each household’s consumption status was determined using the FCS derived as
described above. Each household’s coping capacity was determined using the household’s
food expenditure share and their livelihood coping strategies. Figure 3 shows the analysis
framework that determined each household’s CARI food access status in the ZimVAC 2014.
The domain indicators were recoded into the CARI four-point groups as shown in Table 4.
Source: (WFP, 2015)
Figure 3. Flow chart of the CARI console used in the ZimVAC 2014
Table 4. Indicator Coding Used in the ZimVAC 2014
Domain Indicator Food
Secure
(1)
Margina
lly Food
Secure
(2)
Marginally
Food Insecure
(3)
Severely
Food
Insecure
(4)
Cu
rren
t
stat
us Food
Consumption
Food
Consumption
Group
Acceptable Borderline Poor
Co
pin
g
cap
acit
y
Economic
Vulnerability
Food
Expenditure
share
<50% 50%-
65% 65%-75% >75%
Assets
Depletion
Livelihoods
Coping
indicator
None
Employe
d stress
strategies
Employed
crisis strategies
Employed
emergency
strategies

A Comparative Analysis of Household…
48
Correlation analyses between and amongst the HHS, CARI and FCS were conducted to
compare and analyze the food insecurity prevalence obtained by each of the three food security
measures in the two selected rural provinces—Mashonaland West and Matabeleland South.
The three household food security measures were also compared to a set of household
characteristics and other indicators known from the literature to significantly correlate with
household food security such as household size, income/expenditure, household assets
holdings, income source vulnerability, and household head’s marital status, education level as
well as presence of a chronically ill, physically/mentally challenged member in the household.
3. Results
3.1. Household Food Security Measures
3.1.1. Food Consumption Score
The FCS for Mashonaland West averaged at 45.2 while that for Matabeleland South was
51.7. Independent –group’s t-test of the FCSs for the two provinces indicated that the Levene’s
test of the variable had a probability of 0.770. Accordingly, assuming equal variance between
the FCSs for the two provinces, the t-test for the variable indicated that p<0.05, suggesting that
the FCS for Mashonaland West was significantly lower than that for Matabeleland South
province.
Table 5. Food Consumption Score Food Security Status by Province
Province
Proportion of households in Food Consumption Score
Category
Poor Borderline Acceptable
Mashonaland West 12% 26% 62%
Matabeleland South 4% 22% 74%
Overall 8% 24% 68%
Mashonaland West (38%) had significantly higher food insecurity (poor and borderline
FCS) prevalence compared to Matabeleland South (26%) (p<0.05) (Table 5).
3.1.2. Household Hunger Scale
The SPSS data explore output for the HHS variable grouped by province at 95% confidence
interval suggested that the average HHS score for Mashonaland West (0.76) households was
significantly greater than that for the households in Matabeleland South (0.43). The HHS
measure estimated that 18% of the households in the two provinces were food insecure (with
moderate or severe hunger) and 2% were severely food insecure (Table 6). The level of food
insecurity prevalence in Mashonaland West (23%) was significantly higher compared to that
in Matabeleland South province (13%) (p<0.05).
Table 6. Household Hunger Scale Food Security Status by Province
Province
Proportion of households in Household Hunger Scale
Category
Little or no hunger Moderate hunger Severe hunger
Mashonaland West 77% 19% 4%
Matabeleland South 87% 12% 1%
Overall 82% 16% 2%
B. Butaumocho, P. Chitiyo
49
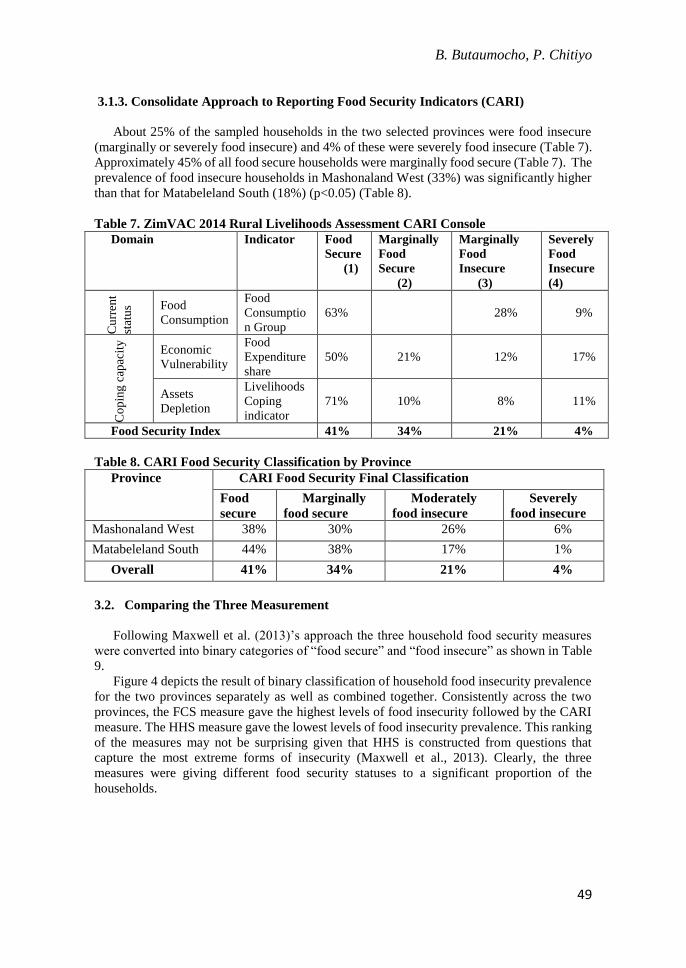
3.1.3. Consolidate Approach to Reporting Food Security Indicators (CARI)
About 25% of the sampled households in the two selected provinces were food insecure
(marginally or severely food insecure) and 4% of these were severely food insecure (Table 7).
Approximately 45% of all food secure households were marginally food secure (Table 7). The
prevalence of food insecure households in Mashonaland West (33%) was significantly higher
than that for Matabeleland South (18%) (p<0.05) (Table 8).
Table 7. ZimVAC 2014 Rural Livelihoods Assessment CARI Console
Domain Indicator Food
Secure
(1)
Marginally
Food
Secure
(2)
Marginally
Food
Insecure
(3)
Severely
Food
Insecure
(4)
Cu
rren
t
stat
us Food
Consumption
Food
Consumptio
n Group
63% 28% 9%
Co
pin
g c
apac
ity
Economic
Vulnerability
Food
Expenditure
share
50% 21% 12% 17%
Assets
Depletion
Livelihoods
Coping
indicator
71% 10% 8% 11%
Food Security Index 41% 34% 21% 4%
Table 8. CARI Food Security Classification by Province
Province CARI Food Security Final Classification
Food
secure
Marginally
food secure
Moderately
food insecure
Severely
food insecure
Mashonaland West 38% 30% 26% 6%
Matabeleland South 44% 38% 17% 1%
Overall 41% 34% 21% 4%
3.2. Comparing the Three Measurement
Following Maxwell et al. (2013)’s approach the three household food security measures
were converted into binary categories of “food secure” and “food insecure” as shown in Table
9.
Figure 4 depicts the result of binary classification of household food insecurity prevalence
for the two provinces separately as well as combined together. Consistently across the two
provinces, the FCS measure gave the highest levels of food insecurity followed by the CARI
measure. The HHS measure gave the lowest levels of food insecurity prevalence. This ranking
of the measures may not be surprising given that HHS is constructed from questions that
capture the most extreme forms of insecurity (Maxwell et al., 2013). Clearly, the three
measures were giving different food security statuses to a significant proportion of the
households.

A Comparative Analysis of Household…
50
Table 9. Classification Systems of Food Security Measures
Indicator
Original
Category Original qualitative label
Converted binary
classification
FCS 1 Poor Food Insecure
2 Borderline
3 Acceptable Food Secure
CARI 1 Food secure Food Secure
2 Marginally food secure
3 Moderately food insecure Food Insecure
4 Severely food insecure
HHS 1 Little or no hunger Food Secure
2 Moderate hunger Food Insecure
3 Severe hunger
Figure 4. Comparison of Household Food Insecurity Prevalence by the Three Measures
Pairwise comparison of household food security status based on the converted binary
classification of the HHS and FCS indicated that about 25% of the households deemed food
secure by the HHS were classified as food insecure by the FCS. Conversely, 37% of the
households classified as food insecure by the HHS were categorized as food secure by the
FCS. Pairwise comparison of household food security classifications by the FCS and CARI
produced the least number of households misclassified by either food security measure (see
Table 10).
B. Butaumocho, P. Chitiyo
51
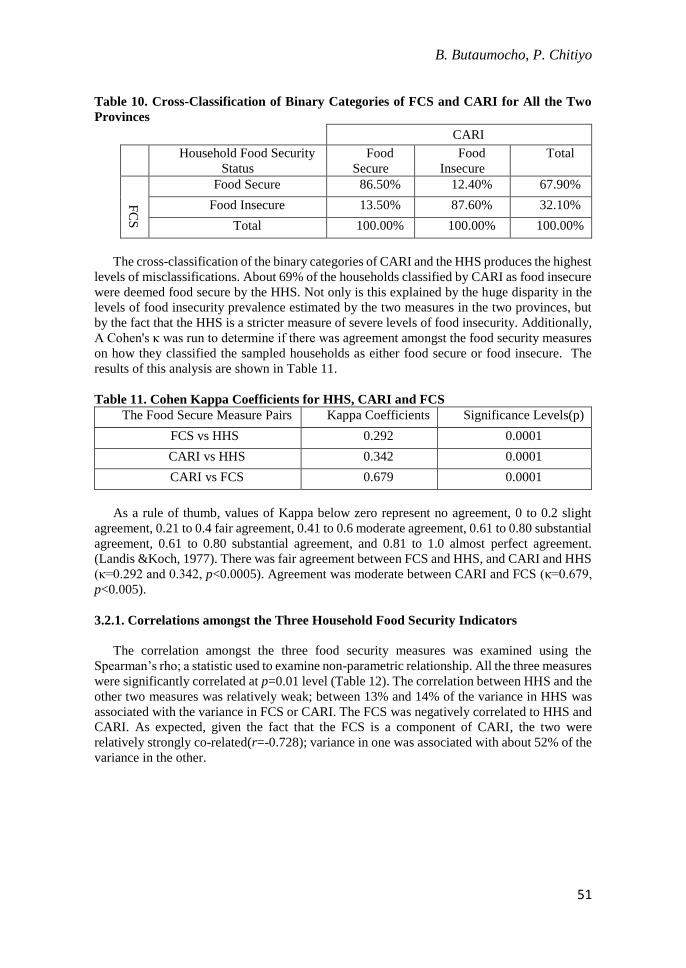
Table 10. Cross-Classification of Binary Categories of FCS and CARI for All the Two
Provinces
CARI
Household Food Security
Status
Food
Secure
Food
Insecure
Total
FC
S
Food Secure 86.50% 12.40% 67.90%
Food Insecure 13.50% 87.60% 32.10%
Total 100.00% 100.00% 100.00%
The cross-classification of the binary categories of CARI and the HHS produces the highest
levels of misclassifications. About 69% of the households classified by CARI as food insecure
were deemed food secure by the HHS. Not only is this explained by the huge disparity in the
levels of food insecurity prevalence estimated by the two measures in the two provinces, but
by the fact that the HHS is a stricter measure of severe levels of food insecurity. Additionally,
A Cohen's κ was run to determine if there was agreement amongst the food security measures
on how they classified the sampled households as either food secure or food insecure. The
results of this analysis are shown in Table 11.
Table 11. Cohen Kappa Coefficients for HHS, CARI and FCS
The Food Secure Measure Pairs Kappa Coefficients Significance Levels(p)
FCS vs HHS 0.292 0.0001
CARI vs HHS 0.342 0.0001
CARI vs FCS 0.679 0.0001
As a rule of thumb, values of Kappa below zero represent no agreement, 0 to 0.2 slight
agreement, 0.21 to 0.4 fair agreement, 0.41 to 0.6 moderate agreement, 0.61 to 0.80 substantial
agreement, 0.61 to 0.80 substantial agreement, and 0.81 to 1.0 almost perfect agreement.
(Landis &Koch, 1977). There was fair agreement between FCS and HHS, and CARI and HHS
(κ=0.292 and 0.342, p<0.0005). Agreement was moderate between CARI and FCS (κ=0.679,
p<0.005).
3.2.1. Correlations amongst the Three Household Food Security Indicators
The correlation amongst the three food security measures was examined using the
Spearman’s rho; a statistic used to examine non-parametric relationship. All the three measures
were significantly correlated at p=0.01 level (Table 12). The correlation between HHS and the
other two measures was relatively weak; between 13% and 14% of the variance in HHS was
associated with the variance in FCS or CARI. The FCS was negatively correlated to HHS and
CARI. As expected, given the fact that the FCS is a component of CARI, the two were
relatively strongly co-related(r=-0.728); variance in one was associated with about 52% of the
variance in the other.

A Comparative Analysis of Household…
52
Table 12. Spearman’s rho Correlations Between Food Security Measures
Indicator Parameter HHS FCS CARI
HHS Correlation Coefficient 1 -0.359** 0.379**
N 2520 2520 2520
FCS Correlation Coefficient -0.359** 1 -0.728**
N 2520 2520 2520
CARI Correlation Coefficient 0.379** -0.728** 1
N 2520 2520 2520
** Correlation is significant at the 0.01 level (2-tailed).
3.2.2. The relationship between the Three Household Food Security and Household
Characteristics and Socio-Economic Status
The Chi-square test showed no significant relationship between all the three food access
measures and household size (p>0.05). However, significant relationships existed between
the three food security measures and household marital status (Figure 5), and with household
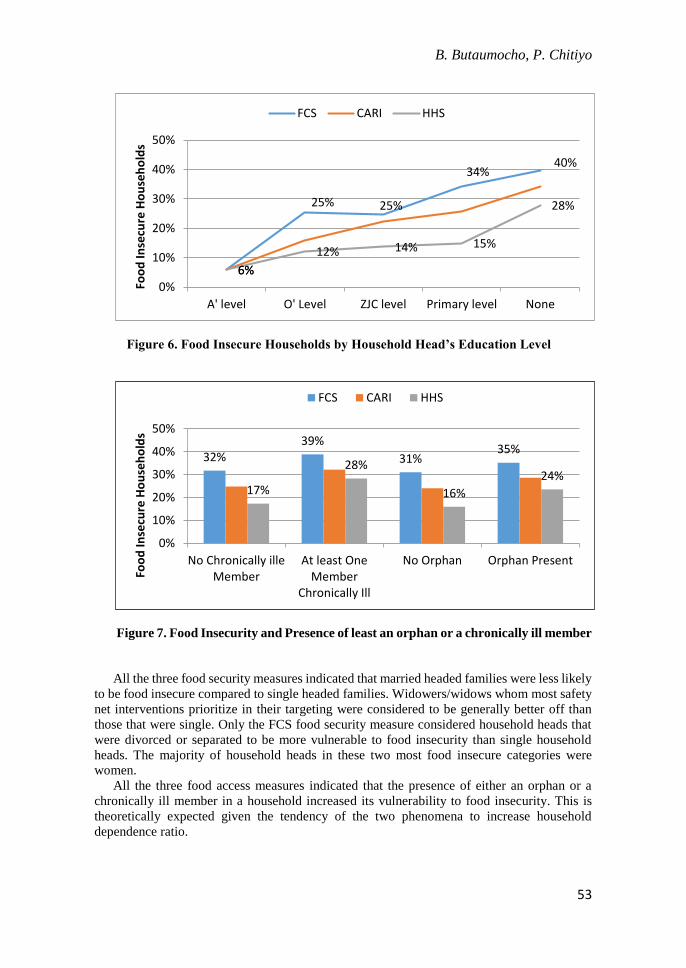
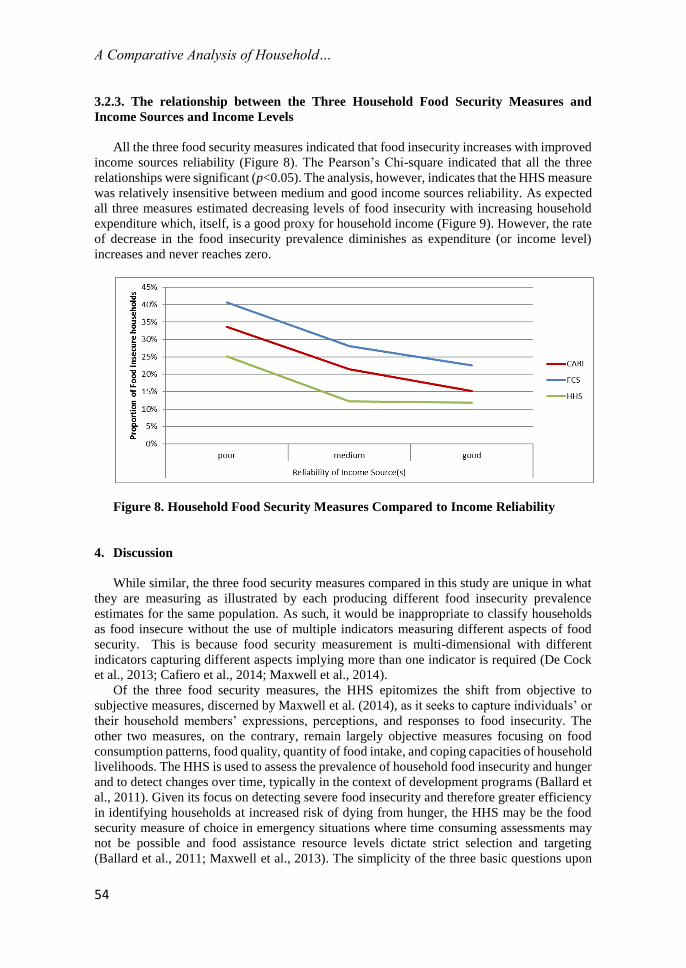
head education level (Figure 6) as well as presence of at least an orphan or a chronically ill
member in the household (Figure 7).
Figure 5. Food Insecure Household by Household Head’s Marital Status
42%39%
32% 32%26%24% 27%
22% 20%14%
0%
10%
20%
30%
40%
50%
Foo
d In
secu
re H
ou
seh
old
s
FCS CARI HHS
B. Butaumocho, P. Chitiyo
53
Figure 6. Food Insecure Households by Household Head’s Education Level
Figure 7. Food Insecurity and Presence of least an orphan or a chronically ill member
All the three food security measures indicated that married headed families were less likely
to be food insecure compared to single headed families. Widowers/widows whom most safety
net interventions prioritize in their targeting were considered to be generally better off than
those that were single. Only the FCS food security measure considered household heads that
were divorced or separated to be more vulnerable to food insecurity than single household
heads. The majority of household heads in these two most food insecure categories were
women.
All the three food access measures indicated that the presence of either an orphan or a
chronically ill member in a household increased its vulnerability to food insecurity. This is
theoretically expected given the tendency of the two phenomena to increase household
dependence ratio.
6%
25% 25%
34%40%
6%
12% 14% 15%
28%
0%
10%
20%
30%
40%
50%
A' level O' Level ZJC level Primary level None
Foo
d In
secu
re H
ou
seh
old
s
FCS CARI HHS
32%39%
31%35%
17%
28%
16%
24%
0%
10%
20%
30%
40%
50%
No Chronically illeMember
At least OneMember
Chronically Ill
No Orphan Orphan Present
Foo
d In
secu
re H
ou
seh
old
s
FCS CARI HHS
A Comparative Analysis of Household…
54
3.2.3. The relationship between the Three Household Food Security Measures and
Income Sources and Income Levels
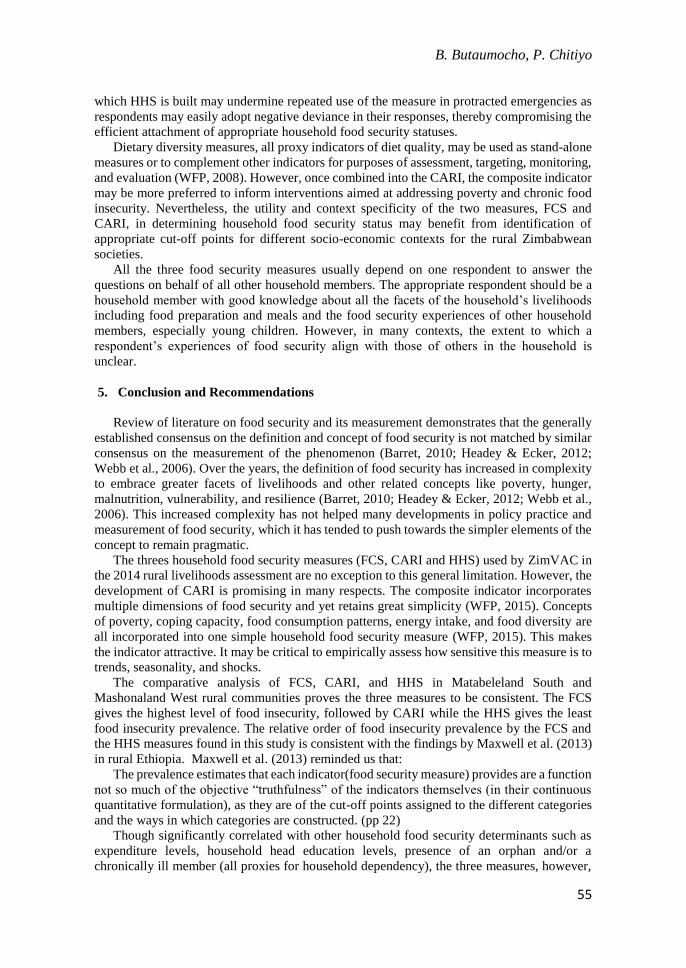
All the three food security measures indicated that food insecurity increases with improved
income sources reliability (Figure 8). The Pearson’s Chi-square indicated that all the three
relationships were significant (p<0.05). The analysis, however, indicates that the HHS measure
was relatively insensitive between medium and good income sources reliability. As expected
all three measures estimated decreasing levels of food insecurity with increasing household
expenditure which, itself, is a good proxy for household income (Figure 9). However, the rate
of decrease in the food insecurity prevalence diminishes as expenditure (or income level)
increases and never reaches zero.
Figure 8. Household Food Security Measures Compared to Income Reliability
4. Discussion
While similar, the three food security measures compared in this study are unique in what
they are measuring as illustrated by each producing different food insecurity prevalence
estimates for the same population. As such, it would be inappropriate to classify households
as food insecure without the use of multiple indicators measuring different aspects of food
security. This is because food security measurement is multi-dimensional with different
indicators capturing different aspects implying more than one indicator is required (De Cock
et al., 2013; Cafiero et al., 2014; Maxwell et al., 2014).
Of the three food security measures, the HHS epitomizes the shift from objective to
subjective measures, discerned by Maxwell et al. (2014), as it seeks to capture individuals’ or
their household members’ expressions, perceptions, and responses to food insecurity. The
other two measures, on the contrary, remain largely objective measures focusing on food
consumption patterns, food quality, quantity of food intake, and coping capacities of household
livelihoods. The HHS is used to assess the prevalence of household food insecurity and hunger
and to detect changes over time, typically in the context of development programs (Ballard et
al., 2011). Given its focus on detecting severe food insecurity and therefore greater efficiency
in identifying households at increased risk of dying from hunger, the HHS may be the food
security measure of choice in emergency situations where time consuming assessments may
not be possible and food assistance resource levels dictate strict selection and targeting
(Ballard et al., 2011; Maxwell et al., 2013). The simplicity of the three basic questions upon
B. Butaumocho, P. Chitiyo
55
which HHS is built may undermine repeated use of the measure in protracted emergencies as
respondents may easily adopt negative deviance in their responses, thereby compromising the
efficient attachment of appropriate household food security statuses.
Dietary diversity measures, all proxy indicators of diet quality, may be used as stand-alone
measures or to complement other indicators for purposes of assessment, targeting, monitoring,
and evaluation (WFP, 2008). However, once combined into the CARI, the composite indicator
may be more preferred to inform interventions aimed at addressing poverty and chronic food
insecurity. Nevertheless, the utility and context specificity of the two measures, FCS and
CARI, in determining household food security status may benefit from identification of
appropriate cut-off points for different socio-economic contexts for the rural Zimbabwean
societies.
All the three food security measures usually depend on one respondent to answer the
questions on behalf of all other household members. The appropriate respondent should be a
household member with good knowledge about all the facets of the household’s livelihoods
including food preparation and meals and the food security experiences of other household
members, especially young children. However, in many contexts, the extent to which a
respondent’s experiences of food security align with those of others in the household is
unclear.
5. Conclusion and Recommendations
Review of literature on food security and its measurement demonstrates that the generally
established consensus on the definition and concept of food security is not matched by similar
consensus on the measurement of the phenomenon (Barret, 2010; Headey & Ecker, 2012;
Webb et al., 2006). Over the years, the definition of food security has increased in complexity
to embrace greater facets of livelihoods and other related concepts like poverty, hunger,
malnutrition, vulnerability, and resilience (Barret, 2010; Headey & Ecker, 2012; Webb et al.,
2006). This increased complexity has not helped many developments in policy practice and
measurement of food security, which it has tended to push towards the simpler elements of the
concept to remain pragmatic.
The threes household food security measures (FCS, CARI and HHS) used by ZimVAC in
the 2014 rural livelihoods assessment are no exception to this general limitation. However, the
development of CARI is promising in many respects. The composite indicator incorporates
multiple dimensions of food security and yet retains great simplicity (WFP, 2015). Concepts
of poverty, coping capacity, food consumption patterns, energy intake, and food diversity are
all incorporated into one simple household food security measure (WFP, 2015). This makes
the indicator attractive. It may be critical to empirically assess how sensitive this measure is to
trends, seasonality, and shocks.
The comparative analysis of FCS, CARI, and HHS in Matabeleland South and
Mashonaland West rural communities proves the three measures to be consistent. The FCS
gives the highest level of food insecurity, followed by CARI while the HHS gives the least
food insecurity prevalence. The relative order of food insecurity prevalence by the FCS and
the HHS measures found in this study is consistent with the findings by Maxwell et al. (2013)
in rural Ethiopia. Maxwell et al. (2013) reminded us that:
The prevalence estimates that each indicator(food security measure) provides are a function
not so much of the objective “truthfulness” of the indicators themselves (in their continuous
quantitative formulation), as they are of the cut-off points assigned to the different categories
and the ways in which categories are constructed. (pp 22)
Though significantly correlated with other household food security determinants such as
expenditure levels, household head education levels, presence of an orphan and/or a
chronically ill member (all proxies for household dependency), the three measures, however,
A Comparative Analysis of Household…
56
showed rather low levels of correlation to these indicators. This may be a cause for concern as
this may suggest there are other important food security determining factors not sufficiently
accounted for in the food security measures.
Based on the current comparative analysis, this study recommends using the HHS in
emergency situations to inform programs to primarily save lives, since it is designed to pick
up only the most-severe behaviors in response to household food insecurity. The CARI is
recommended for livelihoods resilience programming with poverty reduction and addressing
chronic food insecurity as its key objectives. This recommendation is made in full recognition
of the need to contextualize the cut-off points used in the FCS for the Zimbabwe rural
communities. The point to emphasize here is that choice of one measure, if necessary, has to
be informed by the prevailing socio-economic context within which the food security
assessment is being undertaken as well as the main purpose for the assessment.
In the event that one assessment is fortunate to have all three food security measures, this
study follows Maxwell et al. (2013) in recommending cross-classifying households through
the three measures. The absence of a gold standard on household food security measures makes
it difficult to validate externally each of the measures compared in this study.
6. Constraints and limitations
The ZimVAC 2014 rural livelihoods data was at household level and as such is not immune
to weaknesses arising from memory failure, biases, and choice of survey instrument (Beegle,
De Weerdt, Friedman, & Gibson, 2012). Sometimes the interviewee may not know accurately
all relevant socio-economic activities by all household members because of memory loss or
the activities may happen away from home. By its very design the survey is unable to
illuminate on intra-household dynamics. The analysis of this study, thus considers the
household as a unit that pools its resources and makes its key decisions as one. The ZimVAC
2014 rural livelihoods assessment is a cross-sectional survey done once a year; therefore, it is
limited in its ability to bring out seasonal influences on household’s socio-economic situation.
7. Acknowledgements
This research is based on data from the ZimVAC 2014 rural livelihoods assessment.
ZimVAC is part of SADC initiative to keep abreast with and coordinate development of
vulnerability assessments and analysis in the region. Constituted in 2002, ZimVAC is a multi-
sectoral committee led and coordinated by the Food and Nutrition Council. It comprises of
different Government Departments, the United Nation Agencies and non-governmental
organizations working in the area of poverty and the broader socio-economic development.
The 2014 ZimVAC rural livelihoods assessment is one of 13 rural livelihoods assessment
ZimVAC has produced since its inception.
References
Ballard T., Coates J., Swindale A., &Deitchler, M. (2011). Household Hunger Scale: Indicator
Definition and Measurement Guide (FHI 360). Washington, DC: Food and Nutrition
Technical Assistance II Project.
Barrett, B.C. (2010). Measuring Food Insecurity. Science, 327(12), 835 -828.
Beegle, K., De Weerdt, J., Friedman, J., & Gibson, J. (2012). Methods of household
consumption measurement through surveys: Experimental results from Tanzania. Journal
of Development Economics, 98(1), 3-18.
B. Butaumocho, P. Chitiyo
57
Brinkman, H. J., de Pee, S., Sanogo, I., Subran, L., & Bloem, M. W. (2010). High food prices
and the global financial crisis have reduced access to nutritious food and worsened
nutritional status and health. The Journal of nutrition, 140(1), 153-161.
Cafiero, C., Melgar‐ Quiñonez, H.R., Ballard, T.J., and Kepple, A.W. (2014). Validity and
reliability of food security measures. Annals of the New York Academy of
Sciences, 1331(1), 230-248.
Coates, J. (2013). Build it back better: deconstructing food security for improved measurement
and action. Global Food Security, 2(3), 188-194.
Connolly-Boutin, L., &Smit, B. (2016). Climate change, food security, and livelihoods in sub-
Saharan Africa. Regional Environmental Change, 16(2), 385-399.
Committee on Food Security. (2012). Coming to terms with terminology: Food security,
nutrition security, food security and nutrition and, food and nutrition security CFS 39:
2012/4.Retrievedfrom
http://www.fao.org/fsnforum/sites/default/files/file/Terminology/MD776(CFS___Comin
g_to_terms_with_Terminology).pdf
De Cock, N., D’Haese, M., Vink, N., Van Rooyen, C. J., Staelens, L., Schönfeldt, H. C., &
D’Haese, L. (2013). Food security in rural areas of Limpopo province, South Africa. Food
Security, 5(2), 269-282.
Deitchler, M., Ballard, T., Swindale, A., & Coates, J. (2010). Validation of a measure of
household hunger for cross-cultural use. Washington, DC: Food and Nutrition Technical
Assistance II Project.
Desiere, S., D’Haese, M., &Niragira, S. (2015). Assessing the cross-sectional and inter-
temporal validity of the Household Food Insecurity Access Scale (HFIAS) in
Burundi. Public Health Nutrition, 18(15), 2775-2785.
Faber, M., Schwabe, C., & Drimie, S. (2009). Dietary diversity in relation to other household
food security indicators. International Journal of Food Safety, Nutrition and Public
Health, 2(1), 1-15.
FAO. (2008). An Introduction to the Basic Concepts of Food Security, Food Security
Information for Action Practical Guides, The EC - FAO Food Security Program. Rome.
Italy. Retrieved from http://www.fao.org/docrep/013/al936e/al936e00.pdf .
Headey, D., &Ecker, O. (2012). Improving the measurement of food security. IFPRI
Discussion Paper 01225. Retrieved from
http://citeseerx.ist.psu.edu/viewdoc/download?doi=10.1.1.258.1218&rep=rep1&type=pdf
Headey, D., & Ecker, O. (2013). Rethinking the measurement of food security: from first
principles to best practice. Food security, 5(3), 327-343.
Hendriks, S.L. (2015). The food security continuum: a novel tool for understanding food
insecurity as a range of experiences. Food Security, 7(3), 609-619.
Kennedy G., Berardo A., Papavero C., Horjus P., Ballard T., Claude Dop M., Delbaere J., &
Brouwer I. D. (2010). Proxy measures of household food consumption for food security
assessment and surveillance: comparison of the household dietary diversity and food
consumption scores. Public Health Nutrition, 13(12), 2010–2018.
Landis, J. R., &Koch, G. G. (1977). The measurement of observer agreement for categorical
data. Biometrics, 33, 159-174.
Maxwell, D., Coates. J, &Vaitla, B. (2013). How do different indicators of household food
security compare? Empirical evidence from Tigray. Retrieved from
http://www.securenutrition.org/sites/default/files/resources/attachment/english/maxwell-
d_2013_how-do-different-indicators-of-hfs-compare.pdf
Maxwell, D., Vaitla, B., &Coates, J. (2014). How do indicators of household food insecurity
measure up? An empirical comparison from Ethiopia. Food Policy, 47, 107-116.
Pinstrup-Andersen, P. (2009). Food security: definition and measurement. Food Security, 1(1),
5-7.

A Comparative Analysis of Household…
58
Renzaho, A.M.N, & Mellor, D. (2010). Food security measurement in cultural pluralism:
Missing the point or conceptual misunderstanding? Nutrition, 26(1), 1-9.
SADC. (2012). Regional variability assessment and analysis programme. Retrieved from
https://www.sadc.int/sadc-secretariat/directorates/office-deputy-executive-secretary-
regional-integration/food-agriculture-natural-resources/regional-vulnerability-
assessment-analysis-programme-rvaa/
Schindler, J., Graef, F., König, H. J., & Mchau, D. (2016). Developing community-based food
security criteria in rural Tanzania. Food Security, 1-14.
Vincent, V. & Thomas, R. G. (1960).An agricultural survey of Southern Rhodesia: Part I:
agro-ecological survey. Government Printer. Salisbury.
Vink, N. (2012). Food security and African agriculture. South African Journal of International
Affairs, 19(2), 157-177.
Webb, P., Coates, J., Frongillo, E. A., Rogers, B. L., Swindale, A., & Bilinsky, P. (2006).
Measuring household food insecurity: Why it's so important and yet so difficult to do. The
Journal of nutrition, 136(5), 1404-1408.
WFP. (2009). Emergency food security assessment handbook - second edition. Retrieved
fromhttps://www.wfp.org/content/emergency-food-security-assessment-handbook
WFP. (2008). Technical guidance sheet: Food Consumption Score Analysis. Retrieved from
http://documents.wfp.org/stellent/groups/public/documents/manual_guide_proced/wfp19
7216.pdf
WFP. (2004). Sampling guidelines for vulnerability analysis. Retrieved from
http://documents.wfp.org/stellent/groups/public/documents/manual_guide_proced/wfp19
7270.pdf?_ga=1.98303515.521164051.1483035921
WFP. (2015). Technical guide note: Consolidated Approach to Reporting Indicators of Food
Security (CARI)2nd Edition. Retrieved from
https://resources.vam.wfp.org/sites/default/files/CARI%20Guidance_2nd%20ed.pdf
ZimVAC. (2014). Rural livelihoods assessment. Food Nutrition Council. Harare, Zimbabwe
ZimVAC. (2015). Zimbabwe vulnerable assessment committee market assessment report.
HarareZimbabwe.Retrievedfromhttp://documents.wfp.org/stellent/groups/public/docume
nts/ena/wfp281753.pdf?iframe