A comparative analysis of 5-azacytidine and zebularine ... · The diversity of DNA methylation...
21
A comparative analysis of 5-azacytidine and zebularine induced DNA demethylation Patrick T. Griffin, Chad E. Niederhuth, and Robert J. Schmitz Department of Genetics, University of Georgia, Athens, GA, 30602, USA Corresponding author: Robert J. Schmitz University of Georgia 120 East Green Street, Athens, GA 30602 Telephone: (706) 542-1887 Fax: (706) 542-3910 E-mail: [email protected] . CC-BY-NC-ND 4.0 International license peer-reviewed) is the author/funder. It is made available under a The copyright holder for this preprint (which was not . http://dx.doi.org/10.1101/048884 doi: bioRxiv preprint first posted online Apr. 15, 2016;
Transcript of A comparative analysis of 5-azacytidine and zebularine ... · The diversity of DNA methylation...

A comparative analysis of 5-azacytidine and zebularine induced DNA demethylation
Patrick T. Griffin, Chad E. Niederhuth, and Robert J. Schmitz
Department of Genetics, University of Georgia, Athens, GA, 30602, USA
Corresponding author:
Robert J. Schmitz University of Georgia 120 East Green Street, Athens, GA 30602 Telephone: (706) 542-1887 Fax: (706) 542-3910 E-mail: [email protected]
.CC-BY-NC-ND 4.0 International licensepeer-reviewed) is the author/funder. It is made available under aThe copyright holder for this preprint (which was not. http://dx.doi.org/10.1101/048884doi: bioRxiv preprint first posted online Apr. 15, 2016;

Abstract The non-methylable cytosine analogs, 5-azacytidine and zebularine, are widely used to inhibit DNA methyltransferase activity and reduce genomic DNA methylation. In this study, whole-genome bisulfite sequencing is used to construct maps of DNA methylation with single base pair resolution in Arabidopsis thaliana seedlings treated with each demethylating agent. We find that both inhibitor treatments result in nearly indistinguishable patterns of genome-wide DNA methylation and that 5-azacytidine, despite being more unstable in aqueous solution, has a slightly greater demethylating effect at higher concentrations across the genome. Transcriptome analyses revealed a substantial number of up-regulated genes, with an overrepresentation of transposable element genes, particularly CACTA-like elements. This demonstrates that chemical demethylating agents have a disproportionately large effect on loci that are otherwise silenced by DNA methylation.
.CC-BY-NC-ND 4.0 International licensepeer-reviewed) is the author/funder. It is made available under aThe copyright holder for this preprint (which was not. http://dx.doi.org/10.1101/048884doi: bioRxiv preprint first posted online Apr. 15, 2016;
Introduction Cytosine DNA methylation, the covalent addition of a methyl group to the 5’ carbon of a cytosine nucleotide, is required for viability in plants and mammals that possess this base modification. Its presence or absence is known to influence gene expression (Finnegan, Brettell, & Dennis, 1993), heterochromatin status (Mathieu, Reinders, Caikovski, Smathajitt, & Paszkowski, 2007) and genomic integrity through transposon silencing (Johannes et al., 2009; Reinders et al., 2009; Saze & Kakutani, 2007; Slotkin et al., 2009). In mammals, DNA methylation covers most of the genome with the exception of certain unmethylated CG dinucleotide “islands” (Kafri et al., 1992), and aberrant DNA methylation is associated with cancer in humans (Gal-Yam et al., 2008; Ohm et al., 2007; Widschwendter et al., 2007). In plants, DNA methylation is less regularly dispersed and is found enriched at pericentromeric regions, whereas it is found at lower levels on the ends of chromosomes (Cokus et al., 2008; Lister et al., 2008; C. E. Niederhuth & Schmitz, 2014; Zhang et al., 2006; Zilberman, Gehring, Tran, Ballinger, & Henikoff, 2007). Because DNA methylation in flowering plants can be passed along both mitotically and meiotically and is known to influence morphological variation within species, it is thought of as a latent reservoir of phenotypic diversity, and its manipulation has been pursued in recent years to discover potentially beneficial new traits, particularly in crop species (Ji, Neumann, & Schmitz, 2015).
The diversity of DNA methylation patterns in plants is largely attributed to the variety of DNA methyltransferase enzymes that establish and maintain it. Methylated CG sites (mCG), regardless of their location in the genome, are faithfully propagated by the maintenance methyltransferase MET1 (Finnegan et al., 1993). CHG methylation (mCHG) is most commonly found in transposons and repeat elements and is maintained by a feed forward loop that requires the activity of the histone methyltransferase KRYPTONITE (KYP) and the DNA methyltransferase CHROMOMETHYLTRANSFERAE 3 (CMT3) (Cao et al., 2003; Jackson, Lindroth, Cao, & Jacobsen, 2002). Curiously, CMT3 is also required for the maintenance of gene body DNA methylation (gbM), as it was recently discovered that species that have lost CMT3 have no gbM (Adam J Bewick et al., 2016). CHH methylation (mCHH) is dependent on either CMT2, which largely acts in deep heterochromatin regions of the genomes as well as within the bodies of large transposons, or DOMAINS REARRANGED METHYLTRANSFERASE 2 (DRM2) as part of the RNA-directed DNA Methylation (RdDM) pathway, which mostly acts at the edges of repeats and transposons in euchromatin (Law & Jacobsen, 2010).
The development of whole-genome bisulfite sequencing (WGBS) has advanced the understanding of how this chromatin modification is used by genomes (Cokus et al., 2008; Lister et al., 2008). For example, when paired with genetic mutants in the model species Arabidopsis thaliana, WGBS has proven to be particularly helpful in delineating the localization and role of DNA methyltransferases and their associated protein complexes. A comprehensive
.CC-BY-NC-ND 4.0 International licensepeer-reviewed) is the author/funder. It is made available under aThe copyright holder for this preprint (which was not. http://dx.doi.org/10.1101/048884doi: bioRxiv preprint first posted online Apr. 15, 2016;
analysis of WGBS on DNA methylation mutants helped describe the specific roles of RdDM-associated enzymes and siRNA-independent DNA methylation enzymes, while also establishing the interplay between the two pathways (Stroud, Greenberg, Feng, Bernatavichute, & Jacobsen, 2013). This study and others continue to provide a valuable resource to plant researchers interested in the mechanistic underpinnings of how DNA methylation is established and maintained in plant genomes. In addition to genetic manipulation, the chemical inhibition of DNA methyltransferases has been utilized as a transient alternative to study the effect of DNA methylation loss in plants. Two of the most widely used chemical demethylating agents, 5-azacytidine (AZA) and zebularine (ZEB), act as non-methylable cytosine analogs—incorporating into the DNA double helix in the place of cytosine with each cycle of DNA replication (Pecinka & Liu, 2014). Previous studies have shown that AZA covalently binds to DNA methyltransferases (Christman, Mendelsohn, Herzog, & Schneiderman, 1983; Creusot, Acs, & Christman, 1982; Jones & Taylor, 1980; Santi, Norment, & Garrett, 1984), forming nucleoprotein adducts, which depletes the number of active DNA methyltransferase enzyme in the cell. ZEB, a more stable alternative to AZA, was confirmed to inhibit DNA methylation in a similar manner, although it is not thought to form an irreversible bond with DNA methyltransferases (Champion et al., 2010). Although these studies have suggested how AZA and ZEB affect DNA methylation in plants, a genome-wide, comprehensive analysis of either chemical on DNA methylomes is missing. Such an experiment could help identify (A) if there is any differential demethylating effects between the chemicals, (B) if different regions of chromosomes are differentially affected by demethylating agents, and (C) if certain classes of genetic elements are more affected by chemical demethylating agents than others.
In this study, we perform WGBS on Arabidopsis seedlings treated with several concentrations of either AZA or ZEB. We then examine WGBS data and compare the effect of each chemical in relation to each other and to untreated or mock-treated controls. Although each demethylating agents seems to have an indiscriminate, concentration-dependent effect genome-wide, AZA may be more efficacious at higher concentrations. Comparing small windows of highly methylated areas, mCG was found to be proportionally less impacted by AZA in comparison with mCHH in both the pericentromeres and chromosome arms. RNA-seq was performed to supplement WGBS data and identify potential relationships between chemical demethylation and RNA expression in specific genetic elements. Transposable element genes were by far the most highly upregulated class of genetic elements—specifically CACTA-like elements. Genes typically silenced by mCHH pathways were more highly upregulated than those categorized as gene body-methylated genes. The results of this study help to further clarify the effect of non-methylable cytosine analogs on DNA methylation genome-wide and will provide a resource for future studies of DNA methylation in plants.
.CC-BY-NC-ND 4.0 International licensepeer-reviewed) is the author/funder. It is made available under aThe copyright holder for this preprint (which was not. http://dx.doi.org/10.1101/048884doi: bioRxiv preprint first posted online Apr. 15, 2016;

Methods
I. Seed sterilization, plate preparation, and chemical treatments Agarose gel (Ameresco) with added half-strength Linsmaier and Skoog
nutrients (Caisson Laboratories, Inc) was prepared and autoclaved. 5-azacytidine (Sigma) and zebularine (APExBIO) were dissolved in dimethyl-sulfoxide (DMSO) and water, respectively, before being added to the liquefied cooling agar at final concentrations of 25 µM, 50 µM and 100 µM. Columbia-0 (col-0) background Arabidopsis thaliana seeds were then subjected to an ethanol-based seed sterilization, and approximately 30 seeds were plated on the solid agar. As a control, seeds were plated on agar containing DMSO with no chemical demethylating agent (AZA mock-treated control), or agar containing neither DMSO nor chemical demethylating agent (untreated control). Three replicates of each treatment type were simultaneously plated and grown in parallel. After a two-day stratification period at 4ºC, the seeds were transferred to room temperature and allowed to grow for 8 days under constant light.
II. DNA extraction and Whole-Genome Bisulfite Sequencing
Arabidopsis seedlings from each agar plate were pooled and flash-frozen before the tissue was finely ground. DNA extraction was carried out on all samples using the DNeasy Plant Mini Kit (QIAGEN), and the DNA was sheered to approximately 200 bp by sonication. Whole-genome bisulfite sequencing was carried out according to the MethylC-Seq procedure as previously outlined (Urich, Nery, Lister, Schmitz, & Ecker, 2015). Briefly, sonicated DNA (≈200-400 bp) was selected with Ser-Mag Speed Beads (Thermo Scientific), subjected to end-repair, A-tailing, and adaptor ligation. The DNA was then treated with sodium bisulfite from the EZ DNA Methylation Gold Kit (Zymo Research). Finally, the bisulfite converted DNA was PCR-amplified for 10 cycles. After cleanup of the PCR product, the DNA libraries were sequenced using the Illumina Next-Seq500 instrument at the Georgia Genomics Facility. One sample from each treatment group and control group was deeply sequenced, with average coverage ranging from 23.0 to 28.1 genome-wide (Table S1). Downstream analysis was carried out on FASTQ files that were mapped to the TAIR10 reference genome after being trimmed for adaptors and preprocessed to remove low quality reads as has been described previously (Schmitz et al., 2013). A second replicate of the control samples and seedlings treated with 100 µM of AZA or ZEB were sequenced and run through the web tool FASTmC, a non-reference-based DNA methylation estimation tool developed by our lab (A. J. Bewick et al., 2015).
To achieve the most precise measurement of the DNA methylation level across regions with different coverage, the contribution of a particular cytosine to the methylation level within a genetic region was weighted based on its depth of coverage (Schultz, Schmitz, & Ecker, 2012). Features within BedTools (Quinlan & Hall, 2010) were used to intersect loci of interest with methylome data reported by the Methylpy pipeline (Schultz et al., 2015). Custom scripts in Python and R
.CC-BY-NC-ND 4.0 International licensepeer-reviewed) is the author/funder. It is made available under aThe copyright holder for this preprint (which was not. http://dx.doi.org/10.1101/048884doi: bioRxiv preprint first posted online Apr. 15, 2016;
were used to manipulate data sets, calculate weighted methylation level, and build figures, among other tasks. The linear model function in R was used to calculate p values for the correlation between demethylating agent concentration and DNA methylation level genome-wide (Table S3).
III. RNA-Seq
Col-0 seeds were treated with 100 µM of 5-azacytidine alongside mock-treated controls as previously described. TRIzol (Thermo Scientific)-based RNA extraction was then carried out and RNA libraries were made using the TruSeq Stranded mRNA Library Prep Kit (Illumina). Three replicates of AZA-treated seedlings and four replicates of mock-treated seedling were then sequenced using the Illumina Next-Seq500 instrument at the Georgia Genomics Facility. Reads were mapped to the TAIR10 Arabidopsis reference genome using the default settings of Tophat 2 version 2.0.14 (Kim et al., 2013). Downstream comparison between treated and control samples were then carried out using Cuffdiff software version 2.2.1 with default settings to retrieve aggregated expression values and significance estimates (Trapnell et al., 2013). Genes with p value less than the False Discovery Rate after Benjamini-Hochberg correction for multiple testing were considered for differential expression. To eliminate infinite expression difference, 0.1 was added to every expression value, and the log2-fold-changes between treated and untreated samples were calculated. Genes with a log2-fold-change greater than 2.0 or less than -2.0 were treated as significantly differentially expressed. IV. Categorization of methylated genes
A. thaliana genes were classified as gene-body methylated (gbM), mCHG-enriched, or mCHH-enriched using lists from Niederhuth et al 2016 (Chad E Niederhuth et al., 2016). Briefly, genes were tested for enrichment of mCG, mCHG, and mCHH sites in coding sequences against a background methylation rate using a binomial test (Chad E Niederhuth et al., 2016; Takuno & Gaut, 2012). Genes enriched for mCG, but not mCHG or mCHH were classified as gbM genes. Genes enriched for mCHG, but not mCHH were classified as mCHG-enriched genes. These genes also can also contain mCG, which is often found alongside mCHG. mCHH-enriched genes were those genes enriched for mCHH, but could also contain mCG and mCHG (Chad E Niederhuth et al., 2016). Results
To assess the effect of AZA and ZEB genome-wide from deeply sequenced samples, the percent methylation of each sample was plotted for all cytosines and each context of DNA methylation (Figure 1A, Table S2). A concentration-dependent decrease in DNA methylation was observed in both AZA- and ZEB-treated DNA. Showing no sign of saturation up to a concentration of 100 µM, the relationship between DNA methylation and chemical concentration was highly correlated for DNA treated with either AZA (r2= 0.99)
.CC-BY-NC-ND 4.0 International licensepeer-reviewed) is the author/funder. It is made available under aThe copyright holder for this preprint (which was not. http://dx.doi.org/10.1101/048884doi: bioRxiv preprint first posted online Apr. 15, 2016;
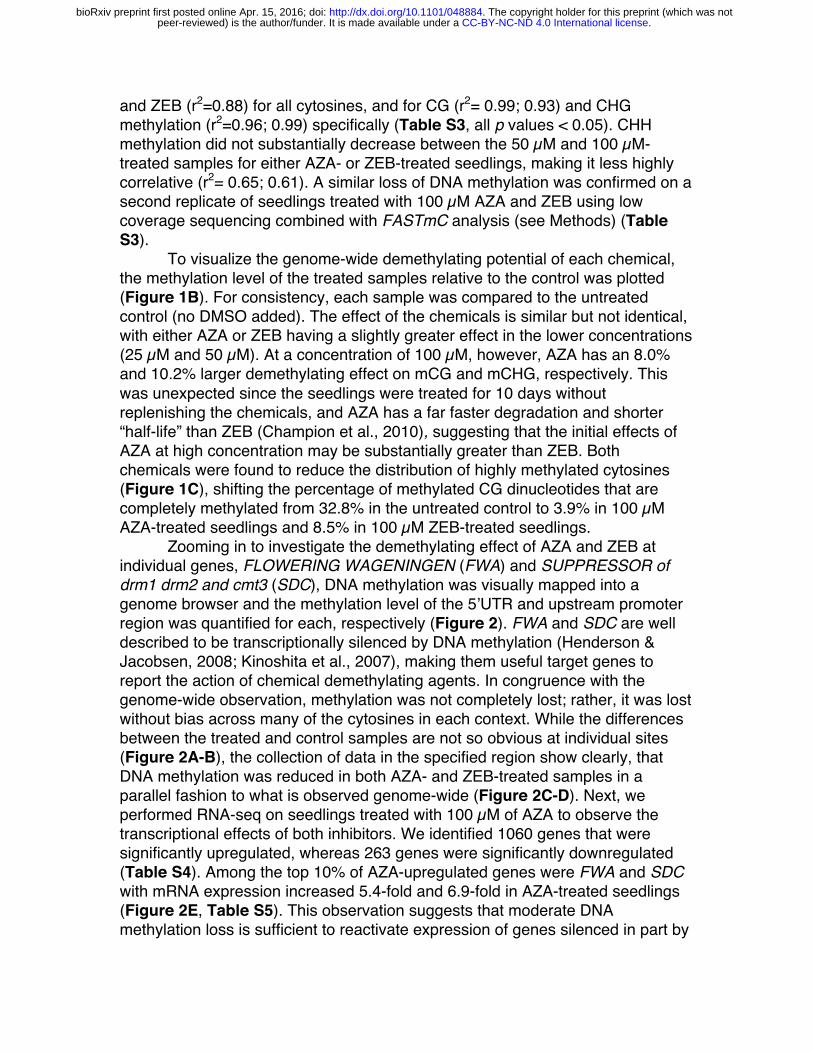
and ZEB (r2=0.88) for all cytosines, and for CG (r2= 0.99; 0.93) and CHG methylation (r2=0.96; 0.99) specifically (Table S3, all p values < 0.05). CHH methylation did not substantially decrease between the 50 µM and 100 µM-treated samples for either AZA- or ZEB-treated seedlings, making it less highly correlative (r2= 0.65; 0.61). A similar loss of DNA methylation was confirmed on a second replicate of seedlings treated with 100 µM AZA and ZEB using low coverage sequencing combined with FASTmC analysis (see Methods) (Table S3).
To visualize the genome-wide demethylating potential of each chemical, the methylation level of the treated samples relative to the control was plotted (Figure 1B). For consistency, each sample was compared to the untreated control (no DMSO added). The effect of the chemicals is similar but not identical, with either AZA or ZEB having a slightly greater effect in the lower concentrations (25 µM and 50 µM). At a concentration of 100 µM, however, AZA has an 8.0% and 10.2% larger demethylating effect on mCG and mCHG, respectively. This was unexpected since the seedlings were treated for 10 days without replenishing the chemicals, and AZA has a far faster degradation and shorter “half-life” than ZEB (Champion et al., 2010), suggesting that the initial effects of AZA at high concentration may be substantially greater than ZEB. Both chemicals were found to reduce the distribution of highly methylated cytosines (Figure 1C), shifting the percentage of methylated CG dinucleotides that are completely methylated from 32.8% in the untreated control to 3.9% in 100 µM AZA-treated seedlings and 8.5% in 100 µM ZEB-treated seedlings.
Zooming in to investigate the demethylating effect of AZA and ZEB at individual genes, FLOWERING WAGENINGEN (FWA) and SUPPRESSOR of drm1 drm2 and cmt3 (SDC), DNA methylation was visually mapped into a genome browser and the methylation level of the 5’UTR and upstream promoter region was quantified for each, respectively (Figure 2). FWA and SDC are well described to be transcriptionally silenced by DNA methylation (Henderson & Jacobsen, 2008; Kinoshita et al., 2007), making them useful target genes to report the action of chemical demethylating agents. In congruence with the genome-wide observation, methylation was not completely lost; rather, it was lost without bias across many of the cytosines in each context. While the differences between the treated and control samples are not so obvious at individual sites (Figure 2A-B), the collection of data in the specified region show clearly, that DNA methylation was reduced in both AZA- and ZEB-treated samples in a parallel fashion to what is observed genome-wide (Figure 2C-D). Next, we performed RNA-seq on seedlings treated with 100 µM of AZA to observe the transcriptional effects of both inhibitors. We identified 1060 genes that were significantly upregulated, whereas 263 genes were significantly downregulated (Table S4). Among the top 10% of AZA-upregulated genes were FWA and SDC with mRNA expression increased 5.4-fold and 6.9-fold in AZA-treated seedlings (Figure 2E, Table S5). This observation suggests that moderate DNA methylation loss is sufficient to reactivate expression of genes silenced in part by
.CC-BY-NC-ND 4.0 International licensepeer-reviewed) is the author/funder. It is made available under aThe copyright holder for this preprint (which was not. http://dx.doi.org/10.1101/048884doi: bioRxiv preprint first posted online Apr. 15, 2016;

DNA methylation. Whether there is complete loss of DNA methylation in some cell types, which leads to reactivation of transcription, or if there is partial loss of DNA methylation in all cell types, remains to be investigated. In any case, and if the perturbation affects DNA in the germline, treatment with DNA demethylating agents could lead to phenotypic variations in subsequent generations. Stochastic transmission of a reactivated reporter gene has been described (Baubec, Finke, Mittelsten Scheid, & Pecinka, 2014). Next, to visualize the effect of AZA and ZEB based on chromosomal position, the methylation level was plotted in 50 kb bins across chromosome 1 for all sequence contexts and chemical concentrations (Figure 3A). DNA methylation was reduced across chromosome 1 in a concentration-dependent manner, most notably for CG and CHG in the pericentromeric region. To illustrate the magnitude of demethylation along the genome, the methylation level of AZA and ZEB-treated DNA relative to that in the control DNA was plotted for each window across chromosome 1 (Figure 3B) and all chromosomes (Figure S1). CG methylation, maintained at higher levels than mCHG and mCHH across the genome (Cokus et al., 2008; Lister et al., 2008; Zhang et al., 2006; Zilberman et al., 2007), is consistently affected across the entire chromosome at approximately the same level per sample. CHG and CHH methylation are less consistently distributed throughout the genome, and their loss is most obvious in the pericentromere. To eliminate bias from unmethylated regions and compare the demethylating effect in the pericentromere and chromosome arms, the genome was further broken up into 100 bp windows, and the 100 µM AZA-treated and mock-treated control methylation levels were plotted pairwise for both regions on chromosome 1 (Figure 3C-D). Highly methylated regions in both the pericentromere and chromosome arms are found at the same demethylating level in AZA-treated seedlings. Given the evidence that RNA-independent DNA methyltransferases are the primary mediators of DNA methylation in the pericentromere, whereas gene body DNA methylation and RdDM primarily function in the chromosome arms (Stroud et al., 2013; Zemach et al., 2013), this result suggests that chemical demethylating agents act without bias on the different enzymes. Of note, loci with high CHH methylation tended to lose 50% to 75% of it in the AZA-treated sample (Figure 3C), whereas, CG methylation is less impacted, hovering between 25% and 50% loss (Figure 3D). Similar results were found in analyzing the 100µM ZEB-treated sample against the untreated control (Figure S3).
The associated effects of DNA methylation on genes depend upon the methylation profile within the genes. Genes that are only methylated in the CG context (gene body methylated (gbM)) are associated with higher gene expression (Tran et al., 2005; Zhang et al., 2006; Zilberman et al., 2007). We classified genes into three categories based on the sequence contexts that were methylated: 1) gbM, 2) CHG-enriched (mCHG) genes – which contain significant numbers of methylated CHG, but not CHH sites, and 3) CHH-enriched (mCHH) genes – which contain significant numbers of methylated cytosines in all
.CC-BY-NC-ND 4.0 International licensepeer-reviewed) is the author/funder. It is made available under aThe copyright holder for this preprint (which was not. http://dx.doi.org/10.1101/048884doi: bioRxiv preprint first posted online Apr. 15, 2016;

sequence contexts (see Methods) (Chad E Niederhuth et al., 2016). To investigate the effect of AZA and ZEB on these different gene classes, average methylation was plotted across the gene bodies and in the surrounding 1500 base pairs up- and downstream. In gbM genes, DNA methylation at CGs is reduced in a concentration-dependent manner for both AZA and ZEB (Figure S2A), whereas, for the obvious reason of lack of mCHG or mCHH between the transcriptional start and stop, the effect of the drug is negligible here. Similarly, mCHH genes and transposons experience a concentration-dependent loss of DNA methylation (Figure S2C-D). Comparing the AZA and ZEB samples treated with the same high concentration of 100 µM reveals that DNA methylation in all sequence features is more reduced by AZA, except for the CHH context in mCHH genes (Figure 4A-C). Similarly, the difference in methylation level of AZA- and ZEB-treated seedlings across transposons (Figure 4C) is less drastic for CHH methylation. This could suggest that at 100 µM, the effect of each drug is saturated—having annihilated the pool of de novo methyltransferases. Alternatively, the reason for a greater impact on CHH may be due to indirect effects, as some regions that are CHH methylated depend on CG and CHG methylation (Stroud et al., 2013). There is no evidence that the chemical agents affect CHH methyltransferases distinctly from CG or CHG methyltransferases.
Surveying the RNA-seq data, mCHH and mCHG genes were far more likely to be upregulated than gbM genes (Figure 4D). Methylation in all three contexts is a sign of transcriptional repression (Law & Jacobsen, 2010), can reduce gene expression of reporter genes (Dieguez, Bellotto, Afsar, Mittelsten Scheid, & Paszkowski, 1997; Hohn, Corsten, Rieke, Muller, & Rothnie, 1996), and previous studies have demonstrated that both AZA and ZEB reactivate transcription of silenced genetic elements in plants (Baubec et al., 2014; Chang & Pikaard, 2005). Therefore, it was not unexpected that over half of the upregulated genes were categorized in TAIR10 as transposable element (TE) genes, a disproportionate amount in comparison to the totality of annotated genes in A. thaliana (Figure 4F). TE genes were broken up into categories based on the TAIR10 annotation. Out of all TE genes, 12.9% were upregulated—with CACTA-like elements as significantly greater expressed (28.9%) and Copia-like elements as the least affected (4.7%) (Figure 4E). CACTA-like elements are a category of mobile endogenous genetic elements that are primarily localized in the pericentromeric region of chromosomes (Miura et al., 2004) and are known to be active in mutants of ddm1 (Brzeski & Jerzmanowski, 2003; Jeddeloh, Stokes, & Richards, 1999). Given the observation that DNA methylation is lost equivalently in highly methylated areas of the chromosome in AZA-treated DNA, their drastic upregulation further supports the conclusion that loss of methylation in the pericentromere drives CACTA-like genes transcriptional reactivation. Discussion In this study, we have provided information on the genome-wide effect of the commonly used chemical demethylating agents, 5-azacytidine and
.CC-BY-NC-ND 4.0 International licensepeer-reviewed) is the author/funder. It is made available under aThe copyright holder for this preprint (which was not. http://dx.doi.org/10.1101/048884doi: bioRxiv preprint first posted online Apr. 15, 2016;

zebularine. Known to have analogous modes of action, the effect of the two chemicals was not expected to be substantially different. Our analysis demonstrates that DNA methylation is indeed depleted across the entire genome in all sequence contexts of DNA methylation in Arabidopsis when treated with either chemical. In previous studies, it had been estimated that at 40 µM, ZEB is a more effective demethylating agent than AZA (Baubec, Pecinka, Rozhon, & Mittelsten Scheid, 2009). Our estimates of relative methylation loss show that AZA may have a larger effect than ZEB at higher concentrations, whereas, at lower concentrations, the difference is less clear and may warrant further investigation. The differences in these results may be explained by differences in growth medium composition, treatments of the plant material, growth conditions and duration of treatment. It could also suggest that certain loci are more susceptible at lower concentrations than others with regards to transcriptional reactivation. In addition, we found that highly methylated areas of pericentromeres and chromosome arms are comparably affected by demethylating agents and that CHH methylation is proportionally more impacted than CG or CHG when treated with the chemical demethylating agent AZA. This could be due to faster depletion of all of the CHH methyltransferases compared to other methyltransferases or due to indirect effects as CHH methyltransferases rely in part on CG and CHG methylation. Examining demethylation of gbM genes, mCHH genes, and transposons, there is a comparable, concentration-dependent loss of DNA methylation for all sequence contexts across each genetic element type. RNA-seq data reveal that these chemicals have a disproportionate impact on mCHH genes and transposons. This is understandable as limiting the deleterious effect of transposable element transcription has been proposed as one of the primary functions of DNA methylation (Matzke, Mette, Aufsatz, Jakowitsch, & Matzke, 1999; Selker et al., 2003; Yoder, Walsh, & Bestor, 1997). CACTA-like transposable element genes are the most highly upregulated category of TE genes when treated with AZA. Their low copy number and localization to the pericentromeres in col-0 accession suggests that their transposition throughout the genome has deleterious effects and is therefore suppressed (Miura et al., 2004). Thus, although it has been shown that DNA methylation is largely recovered in adult plant tissue treated with demethylating agents (Baubec et al., 2009), it is likely that the offspring of plants treated with AZA or ZEB will harbor the adverse effects of CACTA-like transposon insertions if transposition occurs in the germline. Although AZA has been shown to be less stable than ZEB, it causes approximately the same magnitude of DNA methylation loss genome-wide after 10 days of seedling growth—except at high concentrations, where it actually seems to have a greater effect. This may be due to ZEB incorporating less frequently into the DNA double helix (Ben-Kasus, Ben-Zvi, Marquez, Kelley, & Agbaria, 2005; Jones & Taylor, 1980; Liu et al., 2015) or binding less strongly to DNA methyltransferases (Champion et al., 2010). Indeed, a recent assay of ZEB-
.CC-BY-NC-ND 4.0 International licensepeer-reviewed) is the author/funder. It is made available under aThe copyright holder for this preprint (which was not. http://dx.doi.org/10.1101/048884doi: bioRxiv preprint first posted online Apr. 15, 2016;
treated Arabidopsis did not detect deoxyzebularine (the processed, deoxyribonucleotide version of ZEB) in DNA at a sensitivity of ~1 deoxyzebularine to 5000 deoxycytidine, confirming that it does not incorporate into DNA efficiently. Furthermore, the primary DNA repair pathways that are activated in ZEB- and AZA-treated plants were confirmed to differ; where nucleotide excision is the dominant pathway to repair AZA-induced DNA damage, homologous recombination was found to mainly mediate ZEB-induced damage repair (Liu et al., 2015). These results support the conclusion that there is a difference in the rate at which AZA and ZEB incorporate into the genome and are repaired as irregular bases.
Although there may indeed be a difference in the rate at which ZEB and AZA integrate into DNA, the analysis from this study suggests that this difference does not manifest in different patterns of DNA methylation loss caused by either chemical. Both chemicals act in a concentration-dependent manner without bias, reducing DNA methylation wherever it is found in the genome. Acknowledgements
We would like to thank Ortrun Mittelsten Scheid for critical comments and suggestions on this study. This work was supported by the National Science Foundation (NSF) (MCB – 1402183), by the Office of the Vice President of Research at UGA, and by The Pew Charitable Trusts to R.J.S. C.E.N was supported by a NSF postdoctoral fellowship (IOS – 1402183). Raw and processed data is associated with the NCBI GEO accession GSE80300 Work Cited Baubec,T.,Finke,A.,MittelstenScheid,O.,&Pecinka,A.(2014).Meristem-specific
expressionofepigeneticregulatorssafeguardstransposonsilencinginArabidopsis.EMBORep,15(4),446-452.doi:10.1002/embr.201337915
Baubec,T.,Pecinka,A.,Rozhon,W.,&MittelstenScheid,O.(2009).Effective,homogeneousandtransientinterferencewithcytosinemethylationinplantgenomicDNAbyzebularine.PlantJ,57(3),542-554.doi:10.1111/j.1365-313X.2008.03699.x
Ben-Kasus,T.,Ben-Zvi,Z.,Marquez,V.E.,Kelley,J.A.,&Agbaria,R.(2005).Metabolicactivationofzebularine,anovelDNAmethylationinhibitor,inhumanbladdercarcinomacells.BiochemPharmacol,70(1),121-133.doi:10.1016/j.bcp.2005.04.010
Bewick,A.J.,Hofmeister,B.T.,Lee,K.,Zhang,X.,Hall,D.W.,&Schmitz,R.J.(2015).FASTmC:ASuiteofPredictiveModelsforNonreference-BasedEstimationsofDNAMethylation.G3(Bethesda),6(2),447-452.doi:10.1534/g3.115.025668
Bewick,A.J.,Ji,L.,Niederhuth,C.E.,Willing,E.-M.,Hofmeister,B.T.,Shi,X.,...Schmitz,R.J.(2016).OntheOriginandEvolutionaryConsequencesofGeneBodyDNAMethylation.bioRxiv.doi:10.1101/045542
Brzeski,J.,&Jerzmanowski,A.(2003).DeficientinDNAmethylation1(DDM1)definesanovelfamilyofchromatin-remodelingfactors.JBiolChem,278(2),823-828.doi:10.1074/jbc.M209260200
.CC-BY-NC-ND 4.0 International licensepeer-reviewed) is the author/funder. It is made available under aThe copyright holder for this preprint (which was not. http://dx.doi.org/10.1101/048884doi: bioRxiv preprint first posted online Apr. 15, 2016;

Cao,X.,Aufsatz,W.,Zilberman,D.,Mette,M.F.,Huang,M.S.,Matzke,M.,&Jacobsen,S.E.(2003).RoleoftheDRMandCMT3methyltransferasesinRNA-directedDNAmethylation.CurrBiol,13(24),2212-2217.
Champion,C.,Guianvarc'h,D.,Senamaud-Beaufort,C.,Jurkowska,R.Z.,Jeltsch,A.,Ponger,L.,...Guieysse-Peugeot,A.L.(2010).Mechanisticinsightsontheinhibitionofc5DNAmethyltransferasesbyzebularine.PLoSOne,5(8),e12388.doi:10.1371/journal.pone.0012388
Chang,S.,&Pikaard,C.S.(2005).TranscriptprofilinginArabidopsisrevealscomplexresponsestoglobalinhibitionofDNAmethylationandhistonedeacetylation.JBiolChem,280(1),796-804.doi:10.1074/jbc.M409053200
Christman,J.K.,Mendelsohn,N.,Herzog,D.,&Schneiderman,N.(1983).Effectof5-azacytidineondifferentiationandDNAmethylationinhumanpromyelocyticleukemiacells(HL-60).CancerRes,43(2),763-769.
Cokus,S.J.,Feng,S.,Zhang,X.,Chen,Z.,Merriman,B.,Haudenschild,C.D.,...Jacobsen,S.E.(2008).ShotgunbisulphitesequencingoftheArabidopsisgenomerevealsDNAmethylationpatterning.Nature,452(7184),215-219.doi:10.1038/nature06745
Creusot,F.,Acs,G.,&Christman,J.K.(1982).InhibitionofDNAmethyltransferaseandinductionofFrienderythroleukemiacelldifferentiationby5-azacytidineand5-aza-2'-deoxycytidine.JBiolChem,257(4),2041-2048.
Dieguez,M.J.,Bellotto,M.,Afsar,K.,MittelstenScheid,O.,&Paszkowski,J.(1997).Methylationofcytosinesinnonconventionalmethylationacceptorsitescancontributetoreducedgeneexpression.MolGenGenet,253(5),581-588.
Finnegan,E.J.,Brettell,R.I.,&Dennis,E.S.(1993).TheroleofDNAmethylationintheregulationofplantgeneexpression.Exs,64,218-261.
Gal-Yam,E.N.,Egger,G.,Iniguez,L.,Holster,H.,Einarsson,S.,Zhang,X.,...Tanay,A.(2008).FrequentswitchingofPolycombrepressivemarksandDNAhypermethylationinthePC3prostatecancercellline.ProcNatlAcadSciUSA,105(35),12979-12984.doi:10.1073/pnas.0806437105
Henderson,I.R.,&Jacobsen,S.E.(2008).TandemrepeatsupstreamoftheArabidopsisendogeneSDCrecruitnon-CGDNAmethylationandinitiatesiRNAspreading.GenesDev,22(12),1597-1606.doi:10.1101/gad.1667808
Hohn,T.,Corsten,S.,Rieke,S.,Muller,M.,&Rothnie,H.(1996).Methylationofcodingregionaloneinhibitsgeneexpressioninplantprotoplasts.ProcNatlAcadSciUSA,93(16),8334-8339.
Jackson,J.P.,Lindroth,A.M.,Cao,X.,&Jacobsen,S.E.(2002).ControlofCpNpGDNAmethylationbytheKRYPTONITEhistoneH3methyltransferase.Nature,416(6880),556-560.doi:10.1038/nature731
Jeddeloh,J.A.,Stokes,T.L.,&Richards,E.J.(1999).MaintenanceofgenomicmethylationrequiresaSWI2/SNF2-likeprotein.NatGenet,22(1),94-97.doi:10.1038/8803
Ji,L.,Neumann,D.A.,&Schmitz,R.J.(2015).CropEpigenomics:Identifying,Unlocking,andHarnessingCrypticVariationinCropGenomes.MolPlant,8(6),860-870.doi:10.1016/j.molp.2015.01.021
Johannes,F.,Porcher,E.,Teixeira,F.K.,Saliba-Colombani,V.,Simon,M.,Agier,N.,...Colot,V.(2009).Assessingtheimpactoftransgenerationalepigenetic
.CC-BY-NC-ND 4.0 International licensepeer-reviewed) is the author/funder. It is made available under aThe copyright holder for this preprint (which was not. http://dx.doi.org/10.1101/048884doi: bioRxiv preprint first posted online Apr. 15, 2016;

variationoncomplextraits.PLoSGenet,5(6),e1000530.doi:10.1371/journal.pgen.1000530
Jones,P.A.,&Taylor,S.M.(1980).Cellulardifferentiation,cytidineanalogsandDNAmethylation.Cell,20(1),85-93.
Kafri,T.,Ariel,M.,Brandeis,M.,Shemer,R.,Urven,L.,McCarrey,J.,...Razin,A.(1992).Developmentalpatternofgene-specificDNAmethylationinthemouseembryoandgermline.GenesDev,6(5),705-714.
Kim,D.,Pertea,G.,Trapnell,C.,Pimentel,H.,Kelley,R.,&Salzberg,S.L.(2013).TopHat2:accuratealignmentoftranscriptomesinthepresenceofinsertions,deletionsandgenefusions.GenomeBiol,14(4),R36.doi:10.1186/gb-2013-14-4-r36
Kinoshita,Y.,Saze,H.,Kinoshita,T.,Miura,A.,Soppe,W.J.,Koornneef,M.,&Kakutani,T.(2007).ControlofFWAgenesilencinginArabidopsisthalianabySINE-relateddirectrepeats.PlantJ,49(1),38-45.doi:10.1111/j.1365-313X.2006.02936.x
Law,J.A.,&Jacobsen,S.E.(2010).Establishing,maintainingandmodifyingDNAmethylationpatternsinplantsandanimals.NatRevGenet,11(3),204-220.doi:10.1038/nrg2719
Lister,R.,O'Malley,R.C.,Tonti-Filippini,J.,Gregory,B.D.,Berry,C.C.,Millar,A.H.,&Ecker,J.R.(2008).Highlyintegratedsingle-baseresolutionmapsoftheepigenomeinArabidopsis.Cell,133(3),523-536.doi:10.1016/j.cell.2008.03.029
Liu,C.H.,Finke,A.,Diaz,M.,Rozhon,W.,Poppenberger,B.,Baubec,T.,&Pecinka,A.(2015).RepairofDNADamageInducedbytheCytidineAnalogZebularineRequiresATRandATMinArabidopsis.PlantCell,27(6),1788-1800.doi:10.1105/tpc.114.135467
Mathieu,O.,Reinders,J.,Caikovski,M.,Smathajitt,C.,&Paszkowski,J.(2007).TransgenerationalstabilityoftheArabidopsisepigenomeiscoordinatedbyCGmethylation.Cell,130(5),851-862.doi:10.1016/j.cell.2007.07.007
Matzke,M.A.,Mette,M.F.,Aufsatz,W.,Jakowitsch,J.,&Matzke,A.J.(1999).Hostdefensestoparasiticsequencesandtheevolutionofepigeneticcontrolmechanisms.Genetica,107(1-3),271-287.
Miura,A.,Kato,M.,Watanabe,K.,Kawabe,A.,Kotani,H.,&Kakutani,T.(2004).GenomiclocalizationofendogenousmobileCACTAfamilytransposonsinnaturalvariantsofArabidopsisthaliana.MolGenetGenomics,270(6),524-532.doi:10.1007/s00438-003-0943-y
Niederhuth,C.E.,Bewick,A.J.,Ji,L.,Alabady,M.,Kim,K.D.,Page,J.T.,...Schmitz,R.J.(2016).WidespreadnaturalvariationofDNAmethylationwithinangiosperms.bioRxiv.doi:10.1101/045880
Niederhuth,C.E.,&Schmitz,R.J.(2014).Coveringyourbases:inheritanceofDNAmethylationinplantgenomes.MolPlant,7(3),472-480.doi:10.1093/mp/sst165
Ohm,J.E.,McGarvey,K.M.,Yu,X.,Cheng,L.,Schuebel,K.E.,Cope,L.,...Baylin,S.B.(2007).Astemcell-likechromatinpatternmaypredisposetumorsuppressorgenestoDNAhypermethylationandheritablesilencing.NatGenet,39(2),237-242.doi:10.1038/ng1972
.CC-BY-NC-ND 4.0 International licensepeer-reviewed) is the author/funder. It is made available under aThe copyright holder for this preprint (which was not. http://dx.doi.org/10.1101/048884doi: bioRxiv preprint first posted online Apr. 15, 2016;

Pecinka,A.,&Liu,C.H.(2014).Drugsforplantchromosomeandchromatinresearch.CytogenetGenomeRes,143(1-3),51-59.doi:10.1159/000360774
Quinlan,A.R.,&Hall,I.M.(2010).BEDTools:aflexiblesuiteofutilitiesforcomparinggenomicfeatures.Bioinformatics,26(6),841-842.doi:10.1093/bioinformatics/btq033
Reinders,J.,Wulff,B.B.,Mirouze,M.,Mari-Ordonez,A.,Dapp,M.,Rozhon,W.,...Paszkowski,J.(2009).CompromisedstabilityofDNAmethylationandtransposonimmobilizationinmosaicArabidopsisepigenomes.GenesDev,23(8),939-950.doi:10.1101/gad.524609
Santi,D.V.,Norment,A.,&Garrett,C.E.(1984).CovalentbondformationbetweenaDNA-cytosinemethyltransferaseandDNAcontaining5-azacytosine.ProcNatlAcadSciUSA,81(22),6993-6997.
Saze,H.,&Kakutani,T.(2007).Heritableepigeneticmutationofatransposon-flankedArabidopsisgeneduetolackofthechromatin-remodelingfactorDDM1.Emboj,26(15),3641-3652.doi:10.1038/sj.emboj.7601788
Schmitz,R.J.,He,Y.,Valdes-Lopez,O.,Khan,S.M.,Joshi,T.,Urich,M.A.,...Ecker,J.R.(2013).Epigenome-wideinheritanceofcytosinemethylationvariantsinarecombinantinbredpopulation.GenomeRes,23(10),1663-1674.doi:10.1101/gr.152538.112
Schultz,M.D.,He,Y.,Whitaker,J.W.,Hariharan,M.,Mukamel,E.A.,Leung,D.,...Ecker,J.R.(2015).HumanbodyepigenomemapsrevealnoncanonicalDNAmethylationvariation.Nature,523(7559),212-216.doi:10.1038/nature14465
Schultz,M.D.,Schmitz,R.J.,&Ecker,J.R.(2012).'Leveling'theplayingfieldforanalysesofsingle-baseresolutionDNAmethylomes.TrendsGenet,28(12),583-585.doi:10.1016/j.tig.2012.10.012
Selker,E.U.,Tountas,N.A.,Cross,S.H.,Margolin,B.S.,Murphy,J.G.,Bird,A.P.,&Freitag,M.(2003).ThemethylatedcomponentoftheNeurosporacrassagenome.Nature,422(6934),893-897.doi:10.1038/nature01564
Slotkin,R.K.,Vaughn,M.,Borges,F.,Tanurdzic,M.,Becker,J.D.,Feijo,J.A.,&Martienssen,R.A.(2009).EpigeneticreprogrammingandsmallRNAsilencingoftransposableelementsinpollen.Cell,136(3),461-472.doi:10.1016/j.cell.2008.12.038
Stroud,H.,Greenberg,M.V.,Feng,S.,Bernatavichute,Y.V.,&Jacobsen,S.E.(2013).ComprehensiveanalysisofsilencingmutantsrevealscomplexregulationoftheArabidopsismethylome.Cell,152(1-2),352-364.doi:10.1016/j.cell.2012.10.054
Takuno,S.,&Gaut,B.S.(2012).Body-methylatedgenesinArabidopsisthalianaarefunctionallyimportantandevolveslowly.MolBiolEvol,29(1),219-227.doi:10.1093/molbev/msr188
Tran,R.K.,Henikoff,J.G.,Zilberman,D.,Ditt,R.F.,Jacobsen,S.E.,&Henikoff,S.(2005).DNAmethylationprofilingidentifiesCGmethylationclustersinArabidopsisgenes.CurrBiol,15(2),154-159.doi:10.1016/j.cub.2005.01.008
Trapnell,C.,Hendrickson,D.G.,Sauvageau,M.,Goff,L.,Rinn,J.L.,&Pachter,L.(2013).DifferentialanalysisofgeneregulationattranscriptresolutionwithRNA-seq.NatBiotechnol,31(1),46-53.doi:10.1038/nbt.2450
.CC-BY-NC-ND 4.0 International licensepeer-reviewed) is the author/funder. It is made available under aThe copyright holder for this preprint (which was not. http://dx.doi.org/10.1101/048884doi: bioRxiv preprint first posted online Apr. 15, 2016;

Urich,M.A.,Nery,J.R.,Lister,R.,Schmitz,R.J.,&Ecker,J.R.(2015).MethylC-seqlibrarypreparationforbase-resolutionwhole-genomebisulfitesequencing.NatProtoc,10(3),475-483.doi:10.1038/nprot.2014.114
Widschwendter,M.,Fiegl,H.,Egle,D.,Mueller-Holzner,E.,Spizzo,G.,Marth,C.,...Laird,P.W.(2007).Epigeneticstemcellsignatureincancer.NatGenet,39(2),157-158.doi:10.1038/ng1941
Yoder,J.A.,Walsh,C.P.,&Bestor,T.H.(1997).Cytosinemethylationandtheecologyofintragenomicparasites.TrendsGenet,13(8),335-340.
Zemach,A.,Kim,M.Y.,Hsieh,P.H.,Coleman-Derr,D.,Eshed-Williams,L.,Thao,K.,...Zilberman,D.(2013).TheArabidopsisnucleosomeremodelerDDM1allowsDNAmethyltransferasestoaccessH1-containingheterochromatin.Cell,153(1),193-205.doi:10.1016/j.cell.2013.02.033
Zhang,X.,Yazaki,J.,Sundaresan,A.,Cokus,S.,Chan,S.W.,Chen,H.,...Ecker,J.R.(2006).Genome-widehigh-resolutionmappingandfunctionalanalysisofDNAmethylationinarabidopsis.Cell,126(6),1189-1201.doi:10.1016/j.cell.2006.08.003
Zilberman,D.,Gehring,M.,Tran,R.K.,Ballinger,T.,&Henikoff,S.(2007).Genome-wideanalysisofArabidopsisthalianaDNAmethylationuncoversaninterdependencebetweenmethylationandtranscription.NatGenet,39(1),61-69.doi:10.1038/ng1929
Figure Legends Figure 1 | AZA and ZEB treatment result in non-selective, concentration-dependent loss of DNA methylation genome-wide A. The genome-wide methylation level of the control seedlings (0 µM) and seedlings treated with 25 µM, 50 µM, and 100 µM of either AZA of ZEB. B. The methylation level of AZA- and ZEB-treated seedlings relative to the untreated control (treated/control) shown side-by-side for each context of DNA methylation. Both AZA and ZEB were compared to the untreated control methylation levels. C. A frequency distribution of the methylation levels of individual methylated cytosines for both AZA and ZEB treatments and the controls. In mock-treated samples, many methylated CG sites are 100% methylated, whereas in treated samples, most of the sites are not completely methylated. Figure 2 | FWA and SDC methylation level decreases and mRNA expression increases in response to chemical demethylating agents A-B. Browser screenshots of the methylation mapped to the Arabidopsis genome show single base pair resolution data on individual cytosines for SDC and FWA. The height and color of the bar illustrates the methylation level and context of each cytosine, whereas the direction of the bar indicates the strand (shown in legend). The genes themselves are mapped below the methylation data with the UTRs in blue, coding regions in yellow, and introns as the black line connecting them.
.CC-BY-NC-ND 4.0 International licensepeer-reviewed) is the author/funder. It is made available under aThe copyright holder for this preprint (which was not. http://dx.doi.org/10.1101/048884doi: bioRxiv preprint first posted online Apr. 15, 2016;
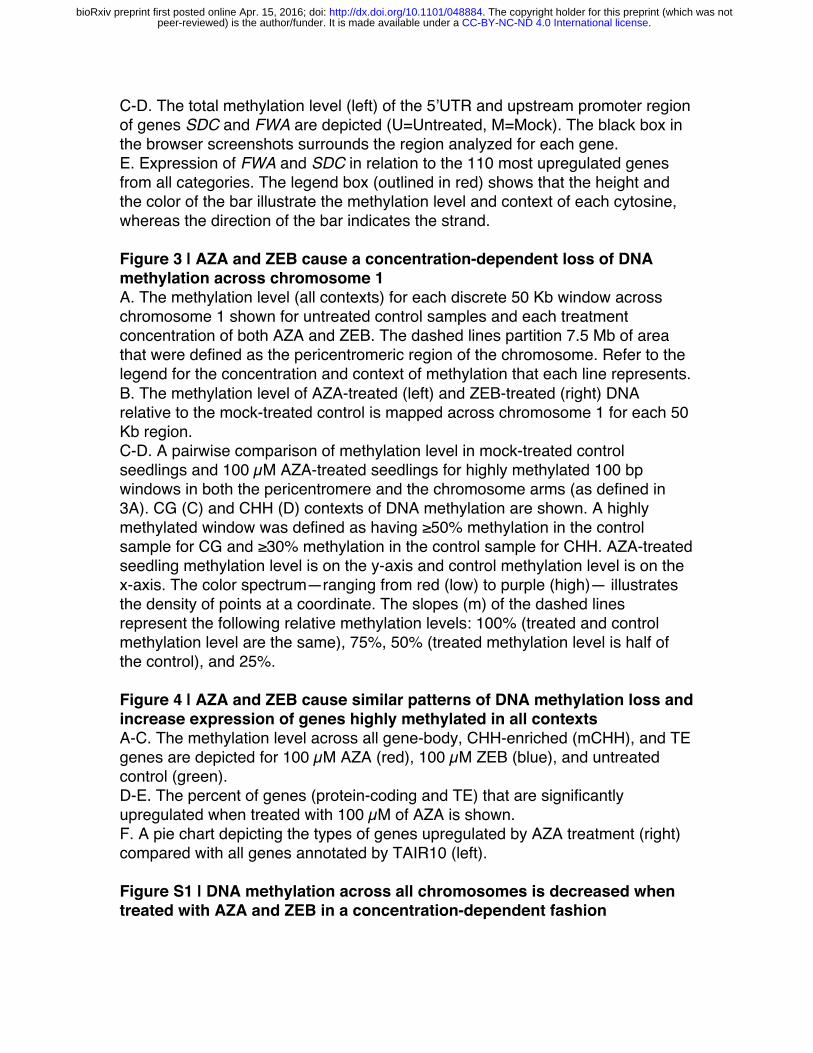
C-D. The total methylation level (left) of the 5’UTR and upstream promoter region of genes SDC and FWA are depicted (U=Untreated, M=Mock). The black box in the browser screenshots surrounds the region analyzed for each gene. E. Expression of FWA and SDC in relation to the 110 most upregulated genes from all categories. The legend box (outlined in red) shows that the height and the color of the bar illustrate the methylation level and context of each cytosine, whereas the direction of the bar indicates the strand. Figure 3 | AZA and ZEB cause a concentration-dependent loss of DNA methylation across chromosome 1 A. The methylation level (all contexts) for each discrete 50 Kb window across chromosome 1 shown for untreated control samples and each treatment concentration of both AZA and ZEB. The dashed lines partition 7.5 Mb of area that were defined as the pericentromeric region of the chromosome. Refer to the legend for the concentration and context of methylation that each line represents. B. The methylation level of AZA-treated (left) and ZEB-treated (right) DNA relative to the mock-treated control is mapped across chromosome 1 for each 50 Kb region. C-D. A pairwise comparison of methylation level in mock-treated control seedlings and 100 µM AZA-treated seedlings for highly methylated 100 bp windows in both the pericentromere and the chromosome arms (as defined in 3A). CG (C) and CHH (D) contexts of DNA methylation are shown. A highly methylated window was defined as having ≥50% methylation in the control sample for CG and ≥30% methylation in the control sample for CHH. AZA-treated seedling methylation level is on the y-axis and control methylation level is on the x-axis. The color spectrum—ranging from red (low) to purple (high)— illustrates the density of points at a coordinate. The slopes (m) of the dashed lines represent the following relative methylation levels: 100% (treated and control methylation level are the same), 75%, 50% (treated methylation level is half of the control), and 25%. Figure 4 | AZA and ZEB cause similar patterns of DNA methylation loss and increase expression of genes highly methylated in all contexts A-C. The methylation level across all gene-body, CHH-enriched (mCHH), and TE genes are depicted for 100 µM AZA (red), 100 µM ZEB (blue), and untreated control (green). D-E. The percent of genes (protein-coding and TE) that are significantly upregulated when treated with 100 µM of AZA is shown. F. A pie chart depicting the types of genes upregulated by AZA treatment (right) compared with all genes annotated by TAIR10 (left). Figure S1 | DNA methylation across all chromosomes is decreased when treated with AZA and ZEB in a concentration-dependent fashion
.CC-BY-NC-ND 4.0 International licensepeer-reviewed) is the author/funder. It is made available under aThe copyright holder for this preprint (which was not. http://dx.doi.org/10.1101/048884doi: bioRxiv preprint first posted online Apr. 15, 2016;

A-B. Relative methylation level shown across chromosomes 2-4 (chromosome 1 shown in Figure 3B) for AZA-treated (S1A) and ZEB-treated (S1B) seedlings. Figure S2 | AZA and ZEB induce a concentration-dependent decrease in DNA methylation in all types of genetic elements A-D. DNA methylation maps across four different categories of methylated genetic elements: gbM genes (A), CHG-enriched (mCHG) genes (B), CHH-enriched (mCHH) genes (C), transposons (D). The colors (top) represent the different treatment concentrations. The demethylating agent and sequence context is given above each vertical column of graphs. Figure S3 | Pairwise comparison of highly methylated 100 bp windows between ZEB-treated and control seedlings A pairwise comparison of methylation level in untreated seedlings and the 100 µM ZEB-treated seedlings for highly methylated 100 bp windows in both the pericentromere and the chromosome arms (as defined in Figure 3A). CG and CHH contexts of DNA methylation are shown. A highly methylated window was defined as having ≥50% methylation in the control sample for CG and ≥30% methylation in the control sample for CHH. ZEB-treated seedling methylation level is on the y-axis and control methylation level is on the x-axis. The color spectrum—ranging from red (low) to purple (high)— illustrates the density of points at a coordinate. The slopes (m) of the dashed lines represent the following relative methylation levels: 100% (treated and control methylation level are the same), 75%, 50% (treated methylation level is half of the control), and 25%.
.CC-BY-NC-ND 4.0 International licensepeer-reviewed) is the author/funder. It is made available under aThe copyright holder for this preprint (which was not. http://dx.doi.org/10.1101/048884doi: bioRxiv preprint first posted online Apr. 15, 2016;

B
C
25µM
50µM
100µ
M
AZA ZEB
3.03.5
12141618
3.54.0
0.80.91.01.1
allCC
GC
HG
CH
H0 25 50 75 100 0 25 50 75 100
Concentration (µM)
Mock 100µM
010203040
Perc
enta
ge
010203040
0 25 50 75 100 25 50 75 100
CG methylation level (%)
Perc
enta
ge
A
AZA
ZEB
0
Met
hyla
tion
leve
l (%
)
0
25
50
75
AZAZEB
0
25
50
75
AZAZEB
0
20
40
60
80
AZAZEB
CG
CHG
CHH
Trea
ted
rela
tive
to c
ontro
l mC
(%)
.CC-BY-NC-ND 4.0 International licensepeer-reviewed) is the author/funder. It is made available under aThe copyright holder for this preprint (which was not. http://dx.doi.org/10.1101/048884doi: bioRxiv preprint first posted online Apr. 15, 2016;

0
20
40
60
80U
M
AZAZEB
U M
AZA
ZEB
FWA
met
hyla
tion
leve
l (%
)
0
20
40
60
80
SDC
met
hyla
tion
leve
l (%
)
Mock
Untreated
100 µM AZA
100 µM ZEB
Mock
A
B
C
D
CG CHG CHH
0.0
2.5
5.0
7.5
10.0
12.5
log 2 f
old
chan
ge e
xpre
ssio
n
FWASDC
Top 110 AZA-upregulated genes
E
Untreated
SDC
FWA
100 µM AZA
100 µM ZEB
CHH
(+) strand(-) strand
CG CHG
.CC-BY-NC-ND 4.0 International licensepeer-reviewed) is the author/funder. It is made available under aThe copyright holder for this preprint (which was not. http://dx.doi.org/10.1101/048884doi: bioRxiv preprint first posted online Apr. 15, 2016;

Chromosome Arms
AZA mC
level (%)
Control mC level (%)
Pericentromere density High
Low
CHHCG
A
B
Pericentromere100
75
50
25
00Mb 10Mb 20Mb 30Mb
AZA ZEB
Met
hyla
tion
leve
l (%
)
0Mb 10Mb 20Mb 30Mb
CG CHG CHHControl25µM50µM100µM
Pericentromere
Chr1 Chr1
Control mC level (%)
Chromosome ArmsPericentromere
AZA mC
level (%)
5075
100125
50µM
Trea
ted
rela
tive
to c
ontro
l mC
(%) CG
CHG
CHH
100µM25µM
CG
CHG
CHH
C
m=100%m=75%m=50%m=25%
50 10050 1000
100
50
0
100
50
30 10030 100
100bp windowsD
5075
100125
5075
100125
5075
100125
5075
100125
5075
100125
Relativemethylation
m=100%m=75%m=50%m=25%
Relativemethylation
.CC-BY-NC-ND 4.0 International licensepeer-reviewed) is the author/funder. It is made available under aThe copyright holder for this preprint (which was not. http://dx.doi.org/10.1101/048884doi: bioRxiv preprint first posted online Apr. 15, 2016;

0
10
20
All T
E ge
nes
Cop
ia−l
ikeM
utat
or−l
ikeG
ypsy
−like
hAT−
like
pseu
doge
neC
ACTA
−like
Perc
enta
ge lo
g 2 2-fo
ld c
hang
e
0.0
2.5
5
7.5
10
all g
enes
mC
HG
gen
es
mC
HH
gen
es
gbM
gen
es
Perc
enta
ge lo
g 2 2-fo
ld c
hang
e
B
TAIR10 genes
Other RNAProtein CodingPseudogeneTE gene
Significantly upregulated in AZA−treated
E
CG CHG CHH
1020304050
1
2
3
.25
.50
.75
1.00
−1500 TSS TTS +1500 −1500 TSS TTS +1500 −1500 TSS TTS +1500
gbM genes
30
40
50
60
10
15
20
25
2
3
4
−1500 TSS TTS +1500 −1500 TSS TTS +1500 −1500 TSS TTS +1500
mC
HH
genes
100µM AZAControl 100µM ZEB
30
40
50
60
10
15
20
25
2.5
3.5
4.5
5.5
−1500 +1500 −1500 +1500 −1500 +1500
transposons
AD
Met
hyla
tion
leve
l (%
)M
ethy
latio
n le
vel (
%)
Met
hyla
tion
leve
l (%
)
C
n=33556 n=1060F
TSS TTS TSS TTS TSS TTS
.CC-BY-NC-ND 4.0 International licensepeer-reviewed) is the author/funder. It is made available under aThe copyright holder for this preprint (which was not. http://dx.doi.org/10.1101/048884doi: bioRxiv preprint first posted online Apr. 15, 2016;


![Azacytidine Enhances Efficacy of Tyrosine Kinase …...methylation in leukemia, lymphoma and multiple myeloma [73,74]. Moreover, over expression of bone marrow proteoglycan 2 (PRG2)](https://static.fdocuments.us/doc/165x107/5f3350b79b285c36e55d3a8a/azacytidine-enhances-efficacy-of-tyrosine-kinase-methylation-in-leukemia-lymphoma.jpg)