A combination of urinary biomarker panel and PancRISK ...
23
RESEARCH ARTICLE A combination of urinary biomarker panel and PancRISK score for earlier detection of pancreatic cancer: A case–control study Silvana Debernardi ID 1 , Harrison O’Brien 1 , Asma S. Algahmdi ID 1 , Nuria Malats ID 2,3 , Grant D. Stewart ID 4 , Marija Pljes ˇ a-ErcegovacID 5 , Eithne CostelloID 6 , William Greenhalf ID 6 , Amina Saad 7 , Rhiannon Roberts ID 7 , Alexander Ney ID 8 , Stephen P. Pereira ID 8 , Hemant M. Kocher ID 7 , Stephen Duffy ID 9 , Oleg Blyuss ID 10,11,12 , Tatjana Crnogorac-Jurcevic 1 * 1 Centre for Cancer Biomarkers and Biotherapeutics, Barts Cancer Institute, Queen Mary University of London, London, United Kingdom, 2 Centro Nacional de Investigaciones Oncolo ´ gicas, Madrid, Spain, 3 Centro de Investigacio ´ n Biome ´ dica en Red de Ca ´ ncer, Madrid Spain, 4 Department of Surgery, University of Cambridge, Cambridge, United Kingdom, 5 Institute of Medical and Clinical Biochemistry, Faculty of Medicine, University of Belgrade, Belgrade, Serbia, 6 Molecular and Clinical Cancer Medicine, University of Liverpool, Liverpool, United Kingdom, 7 Centre for Tumour Biology, Barts Cancer Institute, Queen Mary University of London, London, United Kingdom, 8 Institute for Liver and Digestive Health, University College London, London, United Kingdom, 9 Centre for Cancer Prevention, Wolfson Institute of Preventive Medicine, Queen Mary University of London, London, United Kingdom, 10 School of Physics, Astronomy and Mathematics, University of Hertfordshire, Hatfield, United Kingdom, 11 Department of Paediatrics and Paediatric Infectious Diseases, Institute of Child Health, Sechenov First Moscow State Medical University, Moscow, Russia, 12 Department of Applied Mathematics, Lobachevsky State University of Nizhny Novgorod, Nizhny Novgorod, Russia * [email protected] Abstract Background Pancreatic ductal adenocarcinoma (PDAC) is one of the deadliest cancers, with around 9% of patients surviving >5 years. Asymptomatic in its initial stages, PDAC is mostly diagnosed late, when already a locally advanced or metastatic disease, as there are no useful biomark- ers for detection in its early stages, when surgery can be curative. We have previously described a promising biomarker panel (LYVE1, REG1A, and TFF1) for earlier detection of PDAC in urine. Here, we aimed to establish the accuracy of an improved panel, including REG1B instead of REG1A, and an algorithm for data interpretation, the PancRISK score, in additional retrospectively collected urine specimens. We also assessed the complementar- ity of this panel with CA19-9 and explored the daily variation and stability of the biomarkers and their performance in common urinary tract cancers. Methods and findings Clinical specimens were obtained from multiple centres: Barts Pancreas Tissue Bank, Uni- versity College London, University of Liverpool, Spanish National Cancer Research Center, Cambridge University Hospital, and University of Belgrade. The biomarker panel was assayed on 590 urine specimens: 183 control samples, 208 benign hepatobiliary disease samples (of which 119 were chronic pancreatitis), and 199 PDAC samples (102 stage I–II and 97 stage III–IV); 50.7% were from female individuals. PDAC samples were collected PLOS MEDICINE PLOS Medicine | https://doi.org/10.1371/journal.pmed.1003489 December 10, 2020 1 / 23 a1111111111 a1111111111 a1111111111 a1111111111 a1111111111 OPEN ACCESS Citation: Debernardi S, O’Brien H, Algahmdi AS, Malats N, Stewart GD, Pljes ˇa-Ercegovac M, et al. (2020) A combination of urinary biomarker panel and PancRISK score for earlier detection of pancreatic cancer: A case–control study. PLoS Med 17(12): e1003489. https://doi.org/10.1371/ journal.pmed.1003489 Academic Editor: Michele T. Yip-Schneider, Indiana University School of Medicine, UNITED STATES Received: April 30, 2020 Accepted: November 19, 2020 Published: December 10, 2020 Copyright: © 2020 Debernardi et al. This is an open access article distributed under the terms of the Creative Commons Attribution License, which permits unrestricted use, distribution, and reproduction in any medium, provided the original author and source are credited. Data Availability Statement: All relevant data are within the manuscript and its Supporting Information files. Funding: The study was funded by Pancreatic Cancer Research Fund (PCRF) (www.pcrf.org.uk). The award was assigned to TCJ. The DIAMOND study is part supported by infrastructure from the Cambridge NIHR Biomedical Campus and CRUK Cambridge Cancer Centre. The salary of SD was
Transcript of A combination of urinary biomarker panel and PancRISK ...

RESEARCH ARTICLE
A combination of urinary biomarker panel
and PancRISK score for earlier detection of
pancreatic cancer: A case–control study
Silvana DebernardiID1, Harrison O’Brien1, Asma S. AlgahmdiID
1, Nuria MalatsID2,3, Grant
D. StewartID4, Marija Pljesa-ErcegovacID
5, Eithne CostelloID6, William GreenhalfID
6,
Amina Saad7, Rhiannon RobertsID7, Alexander NeyID
8, Stephen P. PereiraID8, Hemant
M. KocherID7, Stephen DuffyID
9, Oleg BlyussID10,11,12, Tatjana Crnogorac-Jurcevic1*
1 Centre for Cancer Biomarkers and Biotherapeutics, Barts Cancer Institute, Queen Mary University of
London, London, United Kingdom, 2 Centro Nacional de Investigaciones Oncologicas, Madrid, Spain,
3 Centro de Investigacion Biomedica en Red de Cancer, Madrid Spain, 4 Department of Surgery, University
of Cambridge, Cambridge, United Kingdom, 5 Institute of Medical and Clinical Biochemistry, Faculty of
Medicine, University of Belgrade, Belgrade, Serbia, 6 Molecular and Clinical Cancer Medicine, University of
Liverpool, Liverpool, United Kingdom, 7 Centre for Tumour Biology, Barts Cancer Institute, Queen Mary
University of London, London, United Kingdom, 8 Institute for Liver and Digestive Health, University College
London, London, United Kingdom, 9 Centre for Cancer Prevention, Wolfson Institute of Preventive Medicine,
Queen Mary University of London, London, United Kingdom, 10 School of Physics, Astronomy and
Mathematics, University of Hertfordshire, Hatfield, United Kingdom, 11 Department of Paediatrics and
Paediatric Infectious Diseases, Institute of Child Health, Sechenov First Moscow State Medical University,
Moscow, Russia, 12 Department of Applied Mathematics, Lobachevsky State University of Nizhny Novgorod,
Nizhny Novgorod, Russia
Abstract
Background
Pancreatic ductal adenocarcinoma (PDAC) is one of the deadliest cancers, with around 9%
of patients surviving >5 years. Asymptomatic in its initial stages, PDAC is mostly diagnosed
late, when already a locally advanced or metastatic disease, as there are no useful biomark-
ers for detection in its early stages, when surgery can be curative. We have previously
described a promising biomarker panel (LYVE1, REG1A, and TFF1) for earlier detection of
PDAC in urine. Here, we aimed to establish the accuracy of an improved panel, including
REG1B instead of REG1A, and an algorithm for data interpretation, the PancRISK score, in
additional retrospectively collected urine specimens. We also assessed the complementar-
ity of this panel with CA19-9 and explored the daily variation and stability of the biomarkers
and their performance in common urinary tract cancers.
Methods and findings
Clinical specimens were obtained from multiple centres: Barts Pancreas Tissue Bank, Uni-
versity College London, University of Liverpool, Spanish National Cancer Research Center,
Cambridge University Hospital, and University of Belgrade. The biomarker panel was
assayed on 590 urine specimens: 183 control samples, 208 benign hepatobiliary disease
samples (of which 119 were chronic pancreatitis), and 199 PDAC samples (102 stage I–II
and 97 stage III–IV); 50.7% were from female individuals. PDAC samples were collected
PLOS MEDICINE
PLOS Medicine | https://doi.org/10.1371/journal.pmed.1003489 December 10, 2020 1 / 23
a1111111111
a1111111111
a1111111111
a1111111111
a1111111111
OPEN ACCESS
Citation: Debernardi S, O’Brien H, Algahmdi AS,
Malats N, Stewart GD, Pljesa-Ercegovac M, et al.
(2020) A combination of urinary biomarker panel
and PancRISK score for earlier detection of
pancreatic cancer: A case–control study. PLoS
Med 17(12): e1003489. https://doi.org/10.1371/
journal.pmed.1003489
Academic Editor: Michele T. Yip-Schneider,
Indiana University School of Medicine, UNITED
STATES
Received: April 30, 2020
Accepted: November 19, 2020
Published: December 10, 2020
Copyright: © 2020 Debernardi et al. This is an open
access article distributed under the terms of the
Creative Commons Attribution License, which
permits unrestricted use, distribution, and
reproduction in any medium, provided the original
author and source are credited.
Data Availability Statement: All relevant data are
within the manuscript and its Supporting
Information files.
Funding: The study was funded by Pancreatic
Cancer Research Fund (PCRF) (www.pcrf.org.uk).
The award was assigned to TCJ. The DIAMOND
study is part supported by infrastructure from the
Cambridge NIHR Biomedical Campus and CRUK
Cambridge Cancer Centre. The salary of SD was

from patients before treatment. The samples were assayed using commercially available
ELISAs. Statistical analyses were performed using non-parametric Kruskal–Wallis tests
adjusted for multiple comparisons, and multiple logistic regression. Training and validation
datasets for controls and PDAC samples were obtained after random division of the whole
available dataset in a 1:1 ratio. The substitution of REG1A with REG1B enhanced the per-
formance of the panel to detect resectable PDAC. In a comparison of controls and PDAC
stage I–II samples, the areas under the receiver operating characteristic curve (AUCs)
increased from 0.900 (95% CI 0.843–0.957) and 0.926 (95% CI 0.843–1.000) in the training
(50% of the dataset) and validation sets, respectively, to 0.936 in both the training (95% CI
0.903–0.969) and the validation (95% CI 0.888–0.984) datasets for the new panel including
REG1B. This improved panel showed both sensitivity (SN) and specificity (SP) to be >85%.
Plasma CA19-9 enhanced the performance of this panel in discriminating PDAC I–II
patients from controls, with AUC = 0.992 (95% CI 0.983–1.000), SN = 0.963 (95% CI 0.913–
1.000), and SP = 0.967 (95% CI 0.924–1.000). We demonstrate that the biomarkers do not
show significant daily variation, and that they are stable for up to 5 days at room tempera-
ture. The main limitation of our study is the low number of stage I–IIA PDAC samples (n =
27) and lack of samples from individuals with hereditary predisposition to PDAC, for which
specimens collected from control individuals were used as a proxy.
Conclusions
We have successfully validated our urinary biomarker panel, which was improved by substi-
tuting REG1A with REG1B. At a pre-selected cutoff of >80% SN and SP for the affiliated
PancRISK score, we demonstrate a clinically applicable risk stratification tool with a binary
output for risk of developing PDAC (‘elevated’ or ‘normal’). PancRISK provides a step
towards precision surveillance for PDAC patients, which we will test in a prospective clinical
study, UroPanc.
Author summary
Why was this study done?
• Pancreatic ductal adenocarcinoma (PDAC) is one of the most lethal cancers, with
around 9% of individuals surviving more than 5 years.
• The poor outcome is largely due to late diagnosis; however, if the disease is detected at
an early stage, when tumours are still small and resectable, 5-year survival can increase
to up to 70%.
• The development of a non-invasive test for the early detection of PDAC is therefore a
major clinical need, likely to improve the chances of patients’ survival.
What did the researchers do and find?
• We have previously identified a panel of 3 protein biomarkers (LYVE1, REG1A, and
TFF1) in urine that showed promise in detecting resectable PDAC.
PLOS MEDICINE Urinary biomarkers and PancRISK for earlier pancreatic cancer detection
PLOS Medicine | https://doi.org/10.1371/journal.pmed.1003489 December 10, 2020 2 / 23
paid by Pancreatic Cancer Research Fund (PCRF).
SPP was partly supported by the National Institute
for Health Research University College London
Biomedical Research Centre. The funders had no
role in study design, data collection and analysis,
decision to publish, or preparation of the
manuscript.
Competing interests: I have read the journal’s
policy and the authors of this manuscript have the
following competing interests: G.D.S. has received
educational grants from Pfizer, AstraZeneca, and
Intuitive Surgical; consultancy fees from Pfizer,
Merck, EUSA Pharma, and CMR Surgical; travel
expenses from Pfizer; and speaker fees from Pfizer.
Abbreviations: AUC, area under the receiver
operating characteristic curve; CI, confidence
interval; CP, chronic pancreatitis; FPC, familial
pancreatic cancer; NOD, new onset diabetes;
PanIN, pancreatic intraepithelial neoplasia; PC,
prostate cancer; PDAC, pancreatic ductal
adenocarcinoma; RCC, renal cell carcinoma; ROC,
receiver operating characteristic; SN, sensitivity;
SP, specificity; TCC, transitional cell cancer.

• In this study, we have improved this panel by substituting REG1A with REG1B, vali-
dated this panel in an additional number of retrospectively collected samples, and
shown the ability of our urinary panel to distinguish control individuals and patients
with benign hepatobiliary diseases from early stage PDAC patients with specificity and
sensitivity >85%.
• Different cutoffs were tested for the PancRISK score, an algorithm that enables the strat-
ification of patients into those with ‘normal’ or ‘elevated’ risk for developing PDAC:
PancRISK-Fam can be useful for surveillance of asymptomatic individuals with genetic
predisposition for PDAC, and PancRISK-Sym for symptomatic patients (such as those
with chronic pancreatitis) who are at risk of developing PDAC.
What do these findings mean?
• The urine biomarker panel and the affiliated PancRISK score were successfully validated
in the large number of retrospectively collected samples and present a promising
approach for completely non-invasive early detection of PDAC.
• After testing in a prospective cohort, this patient stratification approach could be imple-
mented in clinical practice, with the potential to improve the current diagnostic pathway
for PDAC patients.
Introduction
Pancreatic ductal adenocarcinoma (PDAC) remains one of the most aggressive and incurable
malignancies. With over 80% of cases diagnosed at advanced stages, PDAC patients have a
median survival of 5–6 months, and 5-year survival rates around 9% have been reported glob-
ally [1–3]. However, if PDAC is detected earlier, when still localised, the 5-year survival rate
can be greatly improved, up to 32% [3], approaching 70% following resection in incidentally
diagnosed stage I tumours [4,5]. Currently, no useful biomarkers for earlier detection of
PDAC exist; the only biomarker in clinical practice, serum CA19-9, is not specific or sensitive
enough for screening purposes [6], and is mainly used as a prognostic marker and for moni-
toring response to treatment [7–9]. A large number of PDAC biomarkers have been investi-
gated, alone or in combination with CA19-9; however, none seems to have reached
prospective clinical testing [10–15].
While blood has traditionally been the main source of biomarkers, urine represents a prom-
ising alternative biological fluid [16,17]. It allows a completely non-invasive sampling, high
volume collection, and ease of repeated measurements; it has a lesser dynamic range, with a
less complex proteome than blood [18,19]. Furthermore, it is expected that the continuous
ultrafiltration of blood by the kidneys would result in accumulation, and thus higher concen-
tration, of at least some of the biomarkers in urine [16]. Despite this, urine remains relatively
unexplored in the biomarker arena, due to the potential influence on biomarker levels of con-
founding factors such as impaired kidney function. While only a few biomarker discovery
studies in PDAC urine samples are published to date, including ours [20–26], the urine prote-
ome has also shown the potential to provide biomarkers for other non-urological cancers such
as colon cancer [27], ovarian cancer [28], lung cancer [29], and cholangiocarcinoma [30].
PLOS MEDICINE Urinary biomarkers and PancRISK for earlier pancreatic cancer detection
PLOS Medicine | https://doi.org/10.1371/journal.pmed.1003489 December 10, 2020 3 / 23

In the present study, we validated our improved urinary panel not only on an increased
number of cancer specimens, but also on samples obtained from symptomatic patients with
chronic pancreatitis (CP) and other benign hepatobiliary diseases, which represent a challenge
in early detection of PDAC because of the overlapping symptoms.
Furthermore, we tested how robust our biomarkers are by studying daily variations in their
levels and their stability in urine. Finally, the obtained sensitivity (SN) and specificity (SP) data
were used to select the most appropriate cutoffs for our recently developed algorithm, Pan-
cRISK [31], which was further tested in combination with CA19-9. PancRISK is a logistic
regression model based on our 3 biomarkers, urine creatinine, and age, which enables stratifi-
cation of patients into those with ‘normal’ or ‘elevated’ risk for developing PDAC.
Methods
Clinical specimens
Sample selection. In this case–control study [32], we utilised retrospectively collected
urine and plasma samples for the validation of a urinary biomarker panel previously discov-
ered using mass spectrometry [21]. Of the 590 urine specimens analysed, 183 were from con-
trol individuals (control group) who had no known pancreatic conditions or malignancies or
history of renal diseases at the time of collection, 208 were from patients with benign hepato-
biliary diseases (benign group), and 199 were from PDAC patients. All samples were collected
before surgery or chemotherapeutic treatment and were age- and sex-matched wherever possi-
ble. benign samples included 119 CP cases, 54 gallbladder diseases, 20 cystic lesions of the pan-
creas, and 15 cases with abdominal pain and gastrointestinal symptoms suggestive of
pancreatic origin (S1 Table). Of the 590 samples, 332 (81 control, 89 benign, and 162 PDAC)
have been previously analysed [21]. The demographic details of the samples are described in
Table 1. Centre of origin, details of diagnosis, and sample overlap are reported in S1 Table.
Matched plasma specimens were available for 350 samples (92 control, 108 benign, and 150
PDAC) (see Tables 1 and S1 for details). A smaller subset of these (10 control, 10 benign, and
14 PDAC) was used to measure the levels of our urinary biomarkers in plasma.
In addition, 67 urine specimens included in the study were collected from patients with
common urological tract malignancies: 18 from patients with prostate cancers (PC) (median
age 69 years, range 52–83), 29 from patients with renal cell carcinoma (RCC) (median age 67
years, range 20–85), and 20 from patients with bladder transitional cell cancer (TCC) (median
age 65 years, range 44–81). Finally, a total of 64 urine specimens from 4 control donors (3
females, 1 male) were used to establish the daily variation in the concentration of the biomark-
ers (n = 24).
Table 1. Demographics and clinical characteristics of patients and control individuals.
Sample type Control Benign PDAC
Sample
(n)
Sex (n) Age range in years
by sex (median)
Sample
(n)
Sex (n) Age range in years
by sex (median)
Sample
(n)
Sex (n) Age range in years
by sex (median)
Cancer stage (n)
Urine (total
n = 590)
183 F = 115 26–89 (58) 208 F = 101 26–82 (53) 199 F = 83 42–88 (68) I–IIA = 27; IIB = 75;
III = 76; IV = 21M = 68 30–87 (55) M = 107 29–82 (55) M = 116 29–87 (67)
F + M 26–89 (57) F + M 26–82 (54) F + M 29–88 (67)
Plasma (total
n = 350)
92 F = 58 26–84 (60) 108 F = 57 26–77 (52) 150 F = 66 42–82 (68) I–IIA = 20; IIB = 60;
III = 65; IV = 5M = 34 30–87 (52.5) M = 51 29–73 (54) M = 66 29–83 (67)
F + M 26–87 (58) F + M 26–77 (53) F + M 29–83 (67)
F, female; M, male; PDAC, pancreatic ductal adenocarcinoma.
https://doi.org/10.1371/journal.pmed.1003489.t001
PLOS MEDICINE Urinary biomarkers and PancRISK for earlier pancreatic cancer detection
PLOS Medicine | https://doi.org/10.1371/journal.pmed.1003489 December 10, 2020 4 / 23

Ethics statement. Clinical specimens were obtained from multiple centres after the
respective institutional review board approvals: Barts Pancreas Tissue Bank
(bartspancreastissuebank.org.uk; South Central Hampshire B Ethics Committee, ref number
13/SC/0592; project 2017/11/QM/TC/C/P approved by Tissue Access Committee); University
College London (UCL); the Department of Molecular and Clinical Cancer Medicine, Liverpool
University; and the Spanish National Cancer Research Center (Centro Nacional de Investiga-
ciones Oncologicas [CNIO], Madrid, Spain). Samples from patients with bladder TCC were
provided by the Institute of Medical and Clinical Biochemistry, Faculty of Medicine, Univer-
sity of Belgrade, and PC and RCC samples were obtained from the DIAMOND study, Cam-
bridge University Hospitals NHS Trust (Ethics 03/18). All clinical specimens were obtained
after individual written informed consent. The ethical approval for this study was obtained
from London Brent Research Ethics Committee, reference number 05/Q0408/65.
Preservation and storage. Both collection and storage of urine and plasma samples were
performed according to standard operating procedures, as previously described [21]. Clean-
catch midstream urine was kept on ice upon collection, aliquoted before freezing within 2 hours
from collection, and maintained at −80˚C for long-term storage. For testing the potential effect
of bacterial growth on the urine biomarkers, 20 control urine samples were collected as
described above but with the addition of 20 mg/ml boric acid to the containers before collection.
Blood samples were obtained at the same time as urine specimens. Blood was collected in EDTA
vacutainer tubes and processed within 4 hours: after centrifugation at 1,500g for 10 minutes at
room temperature, 0.5-ml aliquots of supernatant plasma were transferred into clean sterile
1.0-ml cryotubes and stored at −80˚C. Specimens were shipped between centres on dry ice.
Urine biomarkers and plasma CA19-9 measurements
All the assays have been performed following the protocol described below. An aliquot of fro-
zen urine or plasma for each sample was thawed at 4˚C before the experiments. Samples were
processed in groups of 40 to fill 1 ELISA plate. Each measurement was performed in duplicate,
and further repeats were run when there was a discrepancy between the duplicates. Commer-
cially sourced ELISA kits were used for assaying the biomarkers: Cloud-Clone (Cat#
SEB049HU) for TFF1 (1:100 and 1:300 urine dilutions), Sino Biological (Cat# ABIN2010491)
for REG1B (1:500 and 1:1,000 urine dilutions), RayBiotech (Cat# ELH-LYVE1-001) for
LYVE1 (1:10 and 1:20 urine dilutions), and RayBiotech (Cat# ELH-CA19-9-001) for CA19-9
(1:5 and 1:10 urine dilutions), all following the manufacturer’s instructions. TMB Substrate Set
and Stop Solution from BioLegend (Cat# 421101 and 423001) were used for REG1B quantifi-
cation. Plasma samples were diluted 1:5 and 1:10 for all 4 ELISAs. Optical density was deter-
mined using the FLUOstar Omega Microplate Reader. The limits of detection reported were
3.91, 8, and 56 pg/ml for TFF1, REG1B, and LYVE1, respectively. The minimum detectable
level of CA19-9 was 0.3 U/ml. Intra- and inter-assay coefficients of variation were <10% and
<12%, respectively, for all the assays. Plasma CA19-9 was also measured at The Doctors Labo-
ratory, London, using the Roche platform (Cobas 601E [ECLIA] technology) according to rou-
tine protocols. Urine creatinine was measured at the Clinical Biochemistry Laboratory of the
University of Westminster using an ILab Aries analyser from Instrumentation Laboratory
according to the manufacturer’s protocol (limit of detection: 0.6 mmol/l). All the assays were
performed by research staff who were blinded to the sample diagnosis.
Statistical analysis
The biomarker values obtained by ELISAs were normalised and analysed as described previ-
ously [23]. Briefly, for multiple comparisons between the experimental groups, Kruskal–Wallis
PLOS MEDICINE Urinary biomarkers and PancRISK for earlier pancreatic cancer detection
PLOS Medicine | https://doi.org/10.1371/journal.pmed.1003489 December 10, 2020 5 / 23
tests (with Dunn’s correction) were used. Spearman correlation was used to calculate the cor-
relation between plasma and urine CA19-9. Both analyses were performed and graphs plotted
using GraphPad Prism (version 8). The chi-squared test and analysis of variance were used to
assess the difference in proportions of males and females and age across diagnosis groups.
The urine biomarker risk score PancRISK was previously developed based on a risk model
with 5 predictors (LYVE1, REG1, TFF1, creatinine, and age) [29]. As in this study, we aimed
to evaluate the performance of the model in a separate dataset and to compare it to CA19-9;
data on 590 patient samples (183 control, 208 benign, and 199 PDAC) will allow us to achieve
reliable estimates of the measures of discrimination. As 10 events per variable are needed for a
powered study [33], at least 60 (5 predictors + CA19-9) samples for each group (control,
benign hepatobiliary diseases, and PDAC) are required in order to estimate the SP and SN of
the urine panel tested, which is satisfied in this study.
All protein concentration data were natural-log-transformed and mean-centred prior to
the analysis. The biomarker panel was investigated for its ability to discriminate between
PDAC at different stages and control and benign specimens using a receiver operating charac-
teristics (ROC) curve analysis approach. Internal validation was performed by splitting the
whole dataset into the training and validation sets in a 1:1 ratio. Logistic regression was applied
to the training and the validation sets obtained after random division of the whole available
dataset in a 1:1 ratio: one group comprising control and PDAC samples, the other comprising
benign and PDAC samples (details and number of samples per group are provided in S2
Table). For both analyses, the model was fitted for the corresponding training set using the 5
predictors: 3 urinary biomarkers together with creatinine and age, creating a PancRISK score.
Bootstrap cross-validation was used for the internal validation to ensure that overfitting was
avoided. The performance characteristics of PancRISK were evaluated and compared in terms
of the area under the ROC curve (AUC). The SP at a fixed SN was used in the analysis of con-
trol and PDAC samples, and SN at fixed SP for the analysis of benign and PDAC samples. The
performance of the models used in this study was assessed at clinically relevant SN cutoffs for
the analysis of asymptomatic patients and SP cutoffs for the analysis of symptomatic patients
(both set at>80%). Confidence intervals (95% CIs) for AUCs were derived based on DeLong’s
asymptotically exact method to evaluate the uncertainty of an AUC [34]; SN and SP and 95%
CI were derived using non-parametric stratified resampling with the percentile method (2,000
bootstrap replicates) as described by Carpenter and Bithell [35]. AUCs were compared using
the DeLong’s 1-sided test for correlated/paired AUCs [34].
Positive and negative predictive values (PPV and NPV) for a number of prevalence esti-
mates were calculated using the standard approach [36].
In a subset of the data, where both urine and plasma were available, we compared the Pan-
cRISK score to CA19-9 performance and a combination of both. Logistic regression was
applied to the panel, to CA19-9, and to their combination. Performance characteristics
included AUC as well as SP at fixed SN and SN at fixed SP for the comparisons of control and
benign samples with PDAC samples, respectively. In addition to the conventional 37-U/ml
cutoff for CA19-9, we also investigated the potential complementarity of PancRISK and CA19-
9 at other possible cutoffs.
All analyses were performed in R version 3.5.1 (R Foundation for Statistical Computing;
http://www.r-project.org/foundation/) using the ROCR [37] and pROC packages [38].
The flow diagram of this study and the REMARK checklist document are provided as S1
Appendix and S2 Appendix, respectively.
The analysis was performed according to the prespecified plan summarised in the flow dia-
gram reported in S1 Appendix. No data-driven changes took place after the analysis started.
PLOS MEDICINE Urinary biomarkers and PancRISK for earlier pancreatic cancer detection
PLOS Medicine | https://doi.org/10.1371/journal.pmed.1003489 December 10, 2020 6 / 23

Results
Urine REG1B outperforms REG1A in detecting early stage PDAC
In our previous study [23], proteomic data identified both REG1A and REG1B as potential uri-
nary biomarker candidates, with the latter showing better differential. However, the previous
panel included REG1A, as commercially available REG1B ELISA only became available
towards the end of the study. To more firmly establish which of these 2 biomarkers has a supe-
rior performance, a more detailed comparison of the 2 proteins was performed using a subset
of 306 samples. REG1A values used for the comparison were taken from Radon et al. [23]. The
detailed information on the samples and the data are reported in S1 Table. It is evident that
while their performance was similar, REG1B outperformed REG1A in the comparison
between control samples and stage I–IIA PDAC samples (p = 0.032, Kruskal–Wallis test) (S1
Fig). Therefore, all experiments subsequent were performed using REG1B as a constitutive
part of the biomarker panel.
Urine biomarker panel performance in detecting PDAC
The panel was tested in 590 retrospectively collected urine specimens (183 control, 208 benign,
and 199 PDAC). It is evident from Table 1 that the differences in proportions of males and
females and age across the experimental groups were statistically significant (p = 0.015 for dif-
ference in sex across diagnosis groups in plasma and p< 0.001 for the remaining compari-
sons); however, as our urinary biomarkers were selected as being differentially expressed in
the experimental groups in both sexes [21], and age is included as an additional predictor in all
the models, these differences in demographics do not impact our results.
While some of the samples overlap with our previous report [23], due to changes in the
TFF1 and LYVE1 commercially sourced ELISAs (in both cases different quantification ranges
in changed kit versions were seen), all the samples had to be re-assayed. Despite these differ-
ences, the analyses similarly confirmed a significantly higher concentration of all 3 biomarkers
in PDAC urine specimens at all stages (102 I–II and 97 III–IV), when compared with both
benign and control samples (Kruskal–Wallis test, p< 0.0001) (Fig 1). While the biomarker val-
ues were higher in earlier PDAC stages, this difference did not reach statistical significance. A
complete list of all raw data obtained from ELISAs for the 3 biomarkers is provided in S1 Table.
Performance of the panel in differentiating control individuals and those
with benign conditions from PDAC patients
Using a ROC curve analysis, the performances of the 3-biomarker panel in discriminating
between PDAC stages I–II, III–IV, and I–IV and control urine were established in a training
dataset (50% of the samples, comprising 84 control, 52 PDAC I–II, and 51 PDAC III–IV) (Fig
2A; S2 Table). The panel, adjusted for age and creatinine, resulted in an AUC of 0.936 (95% CI
0.903–0.969) in the training set and in AUCs of 0.936 (95% CI 0.888–0.984), 0.922 (95% CI
0.875–0.969), and 0.929 (95% CI 0.894–0.965) in the validation dataset (50% of the samples,
comprising 99 control, 50 PDAC I–II, and 46 PDAC III–IV) in comparisons between control
samples and PDAC I–II, III–IV, and I–IV stage samples, respectively (Fig 2A and 2C; S2 Table).
The performance of the panel in discriminating patients with PDAC stages I–II, III–IV,
and I–IV from patients with benign hepatobiliary diseases in a training dataset (50% of the
samples, comprising 112 benign, 48 PDAC I–II, and 49 PDAC III–IV) is shown on Fig 2B: an
AUC of 0.862 (95% CI 0.813–0.911) in the training set and AUCs of 0.871 (95% CI 0.816–
0.927), 0.824 (95% CI 0.753–0.894), and 0.849 (95% CI 0.797–0.901) in the validation dataset
(50% of the samples, comprising 96 benign, 54 PDAC I–II, and 48 PDAC III–IV) were
PLOS MEDICINE Urinary biomarkers and PancRISK for earlier pancreatic cancer detection
PLOS Medicine | https://doi.org/10.1371/journal.pmed.1003489 December 10, 2020 7 / 23

obtained when benign samples were compared to PDAC stages I–II, III–IV, and I–IV, respec-
tively (Fig 2C).
In order to select the most appropriate cutoffs for the PancRISK score, we explored the
dynamic changes in SN and SP in the validation set after presetting their values (Tables 2 and
3). The resulting SP at fixed SN in the comparison of control samples with PDAC I–II samples
and SN at fixed SP in the comparison of benign samples with PDAC I–II samples are reported
in Tables 2 and 3, respectively.
Because the precise prevalence of PDAC is not known, positive and negative predictive val-
ues (PPV and NPV) for a number of prevalence estimates were calculated in the validation set
for control samples and benign samples versus PDAC samples (S3 Table). A high negative pre-
dictive value, excluding the majority of patients with benign conditions that will have a ‘nor-
mal’ risk for pancreatic cancer, is demonstrated.
Performance of the biomarkers in combination with CA19-9
Plasma CA19-9 levels were available for 92 control, 108 benign, 80 PDAC I–II, and 70 PDAC
III–IV samples. Using this subset of samples, we first evaluated the performance of the panel
with and without CA19-9 in discriminating between control and PDAC stage I–II samples
(Fig 3A). The AUC for CA19-9 (at a 37-U/ml cutoff) in combination with the panel was 0.992
(95% CI 0.983–1.000) (SN = 0.963, 95% CI 0.913–1.000; SP = 0.967, 95% CI 0.924–1.000),
which was significantly greater than the AUCs obtained for the urine panel and plasma CA19-
9 alone (p = 0.04 and p< 0.001, respectively) (Fig 3C).
In the comparison of benign versus PDAC I–II samples, the AUC for the combination of
plasma CA19-9 and the panel increased significantly to 0.919 (95% CI 0.881–0.958) (SN = 0.80,
95% CI 0.713–0.888, and SP = 0.898, 95% CI 0.833–0.954) when compared to plasma CA19-9
and the urinary panel alone (p< 0.001 and p = 0.004, respectively) (Fig 3B and 3D).
Fig 1. The levels of the 3 biomarkers in control, benign, and pancreatic ductal adenocarcinoma (PDAC) samples. Violin plots are shown for each protein. The
number of samples per group is shown in parentheses. All data were creatinine normalised. Upper bars: Kruskal–Wallis test, Dunn’s multiple comparisons.
https://doi.org/10.1371/journal.pmed.1003489.g001
PLOS MEDICINE Urinary biomarkers and PancRISK for earlier pancreatic cancer detection
PLOS Medicine | https://doi.org/10.1371/journal.pmed.1003489 December 10, 2020 8 / 23

Improved performance was also observed when the urinary panel was analysed in combina-
tion with plasma CA19-9 in discriminating between control samples and both late stage
PDAC (stage III–IV; S2A and S2C Fig) and all stage PDAC (S2B and S2D Fig). In the latter,
AUCs for CA19-9 alone and for the panel significantly increased when in combination
(p = 0.002 and p< 0.001, respectively) (S2D Fig). CA-19-9 also increased the performance of
the panel in discriminating benign versus stages III–IV and I–IV (S3 Fig).
Due to limited number of stage I–IIA PDAC samples, where the tumour has not yet spread
to the lymph nodes (n = 27 for urine, n = 20 for matched urine and plasma), we could only per-
form an exploratory analysis, but the addition of CA19-9 did not significantly improve the
panel in distinguishing cancer from control samples (AUC = 0.977, 95% CI 0.948–1.000)
Fig 2. Performance of urine biomarker panel. Comparison of pancreatic ductal adenocarcinoma (PDAC) stages I–II,
III–IV, and I–IV to control samples (A and C) and to benign samples (B and C). Receiver operating characteristic
(ROC) curves of the 3-biomarker panel in the validation set (50% of the samples) for PDAC I–II, III–IV, and I–IV in
the comparison with control (A) and benign (B) samples. Performance of the biomarkers in the training and validation
sets is expressed as area under the ROC curve (AUC) (C).
https://doi.org/10.1371/journal.pmed.1003489.g002
Table 2. Performance of the urinary panel with different cutoffs: Specificity at fixed sensitivity in the validation
set.
Sensitivity cutoff Specificity
Control versus PDAC I–II Control versus PDAC III–IV Control versus PDAC I–IV
0.80 0.939 (0.808–1.000) 0.889 (0.626–1.000) 0.919 (0.748–0.990)
0.85 0.919 (0.677–0.980) 0.727 (0.556–0.950) 0.828 (0.657–0.960)
0.90 0.818 (0.596–0.970) 0.646 (0.505–0.879) 0.707 (0.556–0.909)
0.95 0.636 (0.040–0.909) 0.596 (0.424–0.748) 0.586 (0.414–0.727)
PDAC, pancreatic ductal adenocarcinoma.
https://doi.org/10.1371/journal.pmed.1003489.t002
PLOS MEDICINE Urinary biomarkers and PancRISK for earlier pancreatic cancer detection
PLOS Medicine | https://doi.org/10.1371/journal.pmed.1003489 December 10, 2020 9 / 23

Table 3. Performance of the urinary panel with different cutoffs: Sensitivity at fixed specificity in the validation
set.
Specificity cutoff Sensitivity
Benign versus PDAC I–II Benign versus PDAC III–IV Benign versus PDAC I–IV
0.80 0.796 (0.574–0.944) 0.646 (0.479–0.813) 0.725 (0.569–0.853)
0.85 0.667 (0.426–0.889) 0.604 (0.438–0.750) 0.637 (0.480–0.794)
0.90 0.519 (0.315–0.759) 0.542 (0.375–0.708) 0.529 (0.382–0.706)
0.95 0.370 (0.093–0.574) 0.417 (0.250–0.626) 0.382 (0.196–0.579)
PDAC, pancreatic ductal adenocarcinoma.
https://doi.org/10.1371/journal.pmed.1003489.t003
Fig 3. Evaluation of the urinary panel in combination with plasma CA19-9 for PDAC I–II discrimination. Performance in
distinguishing early stage PDAC (stage I–II) (n = 80) from control samples (n = 92) (A and C) and benign samples (n = 108) (B and
D). ROC curves of CA19-9 and biomarker panel alone and in combination (A and B); summary of the performances (C and D).
AUC, area under the receiver operating characteristic curve; CI, confidence interval; PDAC, pancreatic ductal adenocarcinoma;
ROC, receiver operating characteristic; SN, sensitivity; SP, specificity.
https://doi.org/10.1371/journal.pmed.1003489.g003
PLOS MEDICINE Urinary biomarkers and PancRISK for earlier pancreatic cancer detection
PLOS Medicine | https://doi.org/10.1371/journal.pmed.1003489 December 10, 2020 10 / 23

(Fig 4A and 4C) or benign samples (AUC = 0.860, 95% CI 0.770–0.950) (p = 0.369 and
p = 0.149, respectively) (Fig 4B and 4D).
Subset analysis of the performance of the panel in differentiating PDAC
from CP patients
The performance of the panel in discriminating patients with PDAC from 119 patients with
CP, a subset of the benign hepatobiliary disease samples, was calculated for the training and
validating datasets (S4 Fig). The panel, adjusted for age and creatinine, resulted in an AUC of
0.873 (95% CI 0.818–0.929) in the training set (50% of the samples) (S4A Fig) and in AUCs of
0.818 (95% CI 0.740–0.896), 0.808 (95% CI 0.725–0.891), and 0.814 (95% CI 0.744–0.883) in
the validation dataset (50% of the samples) in the comparisons between CP and PDAC I–II,
Fig 4. Evaluation of the urinary panel in combination with plasma CA19-9 for PDAC I–IIA discrimination. Performance in
distinguishing PDAC stage I–IIA (n = 20) from control samples (n = 92) (A and C) and benign samples (n = 108) (B and D). ROC
curve of CA19-9 and biomarker panel alone and in combination (A and B); summary of the performances (C and D). AUC, area
under the receiver operating characteristic curve; CI, confidence interval; PDAC, pancreatic ductal adenocarcinoma; ROC, receiver
operating characteristic; SN, sensitivity; SP, specificity.
https://doi.org/10.1371/journal.pmed.1003489.g004
PLOS MEDICINE Urinary biomarkers and PancRISK for earlier pancreatic cancer detection
PLOS Medicine | https://doi.org/10.1371/journal.pmed.1003489 December 10, 2020 11 / 23

III–IV, and I–IV stages, respectively (S4B Fig). SNs, calculated at fixed SP cutoffs in the valida-
tion set, were slightly lower than those for discriminating benign samples from PDAC
samples.
The performance of the panel with or without CA19-9 in discriminating PDAC stages I–II,
III–IV, and I–IV in 64 CP samples with data available for plasma CA19-9 was also calculated;
the results are reported in S5 Fig. As already noted for control and benign samples, CA19-9
enhanced the performance of the panel in the discrimination of CP from each PDAC stage
group, with AUCs very close to those achieved using the whole benign group of samples
(S5D–S5F Fig).
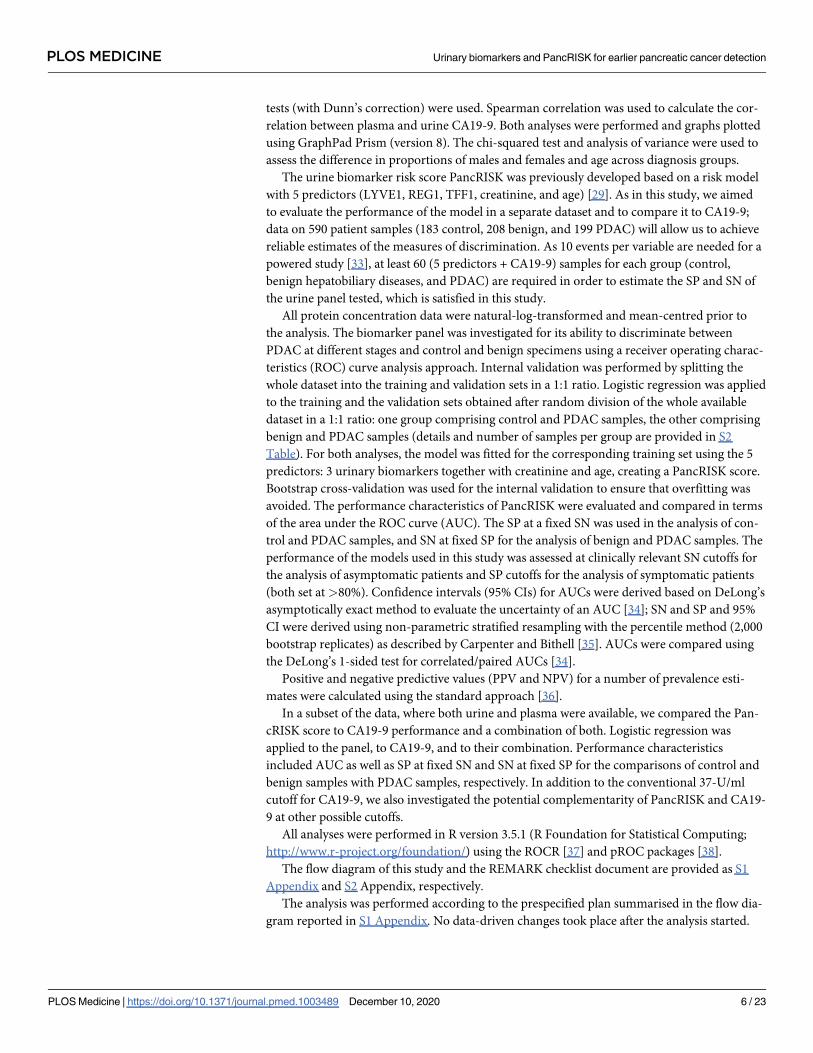
Performance of PancRISK in combination with different CA19-9 cutoffs
Based on obtained data (Tables 2 and 3), we have constructed 2 versions of PancRISK. The
first one, PancRISK-Fam, is aimed at stratifying the asymptomatic patients at risk (familial his-
tory, genetic syndromes), for which we have therefore set the SN cutoff at 0.85 in order to
detect the cases. For the second one, called PancRISK-Sym, we have preset the SP cutoff at
0.80, as it is aimed at stratification of symptomatic patients. The patients with ‘normal’ risk
should not undergo further invasive workup, while the ones with ‘elevated’ risk should con-
tinue to be investigated. Tables 4 and 5 show the performance of PancRISK-Fam and
Table 4. Performance of the PancRISK in combination with different CA19-9 cutoffs: PancRISK-Fam
(sensitivity = 0.85).
Population and PancRISK
group
Lower CA19-9 cutoff group
and nUpper CA19-9 cutoff group
and nSpecificity and
sensitivity
Control (n = 92) CA19-9 < 37 U/ml CA19-9� 37 U/ml Specificity:
0.891 (0.811–0.940)PancRISK = ‘normal’ 82 3
PancRISK = ‘elevated’ 7 0
PDAC (n = 150) CA19-9 < 37 U/ml CA19-9� 37 U/ml Sensitivity:
0.967 (0.924–0.986)PancRISK = ‘normal’ 5 17
PancRISK = ‘elevated’ 16 112
Control (n = 92) CA19-9 < 40 U/ml CA19-9� 40 U/ml Specificity:
0.902 (0.824–0.948)PancRISK = ‘normal’ 83 2
PancRISK = ‘elevated’ 7 0
PDAC (n = 150) CA19-9 < 40 U/ml CA19-9� 40 U/ml Sensitivity:
0.960 (0.915–0.982)PancRISK = ‘normal’ 6 16
PancRISK = ‘elevated’ 16 112
Control (n = 92) CA19-9 < 45 U/ml CA19-9� 45 U/ml Specificity:
0.902 (0.824–0.948)PancRISK = ‘normal’ 83 2
PancRISK = ‘elevated’ 7 0
PDAC (n = 150) CA19-9 < 45 U/ml CA19-9� 45 U/ml Sensitivity:
0.960 (0.915–0.982)PancRISK = ‘normal’ 6 16
PancRISK = ‘elevated’ 19 109
Control (n = 92) CA19-9 < 60 U/ml CA19-9� 60 U/ml Specificity:
0.913 (0.838–0.955)PancRISK = ‘normal’ 84 1
PancRISK = ‘elevated’ 7 0
PDAC (n = 150) CA19-9 < 60 U/ml CA19-9� 60 U/ml Sensitivity:
0.960 (0.915–0.982)PancRISK = ‘normal’ 6 16
PancRISK = ‘elevated’ 23 105
PDAC, pancreatic ductal adenocarcinoma.
https://doi.org/10.1371/journal.pmed.1003489.t004
PLOS MEDICINE Urinary biomarkers and PancRISK for earlier pancreatic cancer detection
PLOS Medicine | https://doi.org/10.1371/journal.pmed.1003489 December 10, 2020 12 / 23
PancRISK-Sym, respectively, when combined with CA19-9 at different cutoffs (37 U/ml, 40 U/
ml, 45 U/ml, and 60 U/ml). The tables demonstrate that increasing the CA19-9 cutoff led to a
small decrease in SN but increase in SP of PDAC detection.
Expression of CA19-9 and 3 biomarkers in urine and plasma
Since CA19-9 can improve the performance of our biomarkers (except for stages I–IIA), we
next wanted to establish the possibility of detecting CA19-9 in urine. We measured CA19-9 in
matched plasma and urine samples by both Roche Cobas instrument and RayBiotech ELISAs
in a subset of 78 samples (22 control, 9 benign, and 47 PDAC) (S4 Table). Only plasma CA19-
9 was able to distinguish PDAC samples from both control samples (p< 0.0001) and benign
samples (p = 0.002) (S6A Fig), whereas, despite the visible pattern, none of the differences
between these experimental groups reached statistical significance in urine with either the
Roche Cobas method (S6B Fig) or ELISA (S6C Fig). There was no correlation between plasma
and urine CA19-9 measured by Roche or ELISA (Spearman correlation of 0.525, CI 95%
0.337–0.673, p< 0.0001, and 0.367, CI 95% 0.151–0.550, p< 0.001, respectively).
Similarly, when a smaller subset of the matched plasma samples (10 control, 10 benign, 14
PDAC) was used to measure the levels of our urinary biomarkers, we observed a lower perfor-
mance of our biomarkers in plasma than in urine (S7 Fig).
Table 5. Performance of the PancRISK in combination with different CA19-9 cutoffs: PancRISK-Sym
(specificity = 0.80).
Population and PancRISK
group
Lower CA19-9 cutoff group
and nUpper CA19-9 cutoff group
and nSpecificity and
sensitivity
Benign (n = 108) CA19-9 < 37 U/ml CA19-9� 37 U/ml Specificity:
0.676 (0.583–0.757)PancRISK = ‘normal’ 73 14
PancRISK = ‘elevated’ 14 7
PDAC (n = 150) CA19-9 < 37 U/ml CA19-9� 37 U/ml Sensitivity:
0.947 (0.898–0.973)PancRISK = ‘normal’ 8 41
PancRISK = ‘elevated’ 13 88
Benign (n = 108) CA19-9 < 40 U/ml CA19-9� 40 U/ml Specificity:
0.685 (0.593–0.765)PancRISK = ‘normal’ 74 13
PancRISK = ‘elevated’ 14 7
PDAC (n = 150) CA19-9 < 40 U/ml CA19-9� 40 U/ml Sensitivity:
0.947 (0.898–0.973)PancRISK = ‘normal’ 8 41
PancRISK = ‘elevated’ 14 87
Benign (n = 108) CA19-9 < 45 U/ml CA19-9� 45 U/ml Specificity:
0.704 (0.612–0.782)PancRISK = ‘normal’ 76 11
PancRISK = ‘elevated’ 14 7
PDAC (n = 150) CA19-9 < 45 U/ml CA19-9� 45 U/ml Sensitivity:
0.940 (0.890–0.968)PancRISK = ‘normal’ 9 40
PancRISK = ‘elevated’ 16 85
Benign (n = 108) CA19-9 < 60 U/ml CA19-9� 60 U/ml Specificity:
0.741 (0.651–0.814)PancRISK = ‘normal’ 80 7
PancRISK = ‘elevated’ 14 7
PDAC (n = 150) CA19-9 < 60 U/ml CA19-9� 60 U/ml Sensitivity:
0.940 (0.890–0.968)PancRISK = ‘normal’ 9 40
PancRISK = ‘elevated’ 20 81
PDAC, pancreatic ductal adenocarcinoma.
https://doi.org/10.1371/journal.pmed.1003489.t005
PLOS MEDICINE Urinary biomarkers and PancRISK for earlier pancreatic cancer detection
PLOS Medicine | https://doi.org/10.1371/journal.pmed.1003489 December 10, 2020 13 / 23
The 3 protein biomarkers are stable in urine
With the aim of developing a robust biomarker panel for future clinical use, it is important to
test the daily variation in the concentration and the stability of the 3 proteins in urine. For this,
the biomarker levels were measured by ELISA in urine samples from 4 control donors, which
were collected twice a day, in the morning before breakfast (AM) and in the afternoon after
lunch (PM) over a 4-day period and immediately frozen after collection (S5 Table). No signifi-
cant differences in any of the 3 proteins between collection times and over the 4 days could be
seen (Kruskal–Wallis test) (S8A Fig).
Furthermore, the stability of the 3 biomarkers was assessed after keeping the urine samples
at room temperature up to 5 days after collection in tubes with or without the addition of 20
mg/ml boric acid to supress bacterial growth (S5 Table). The concentration of all 3 biomarkers
displayed no statistically significant variation (Kruskal–Wallis test) over the 5-day period in
both types of tubes (S8B and S8C Fig) even when the Combur dipstick test (Diagnostics
Roche) indicated bacterial growth after 3 days in urine collected in containers without boric
acid.
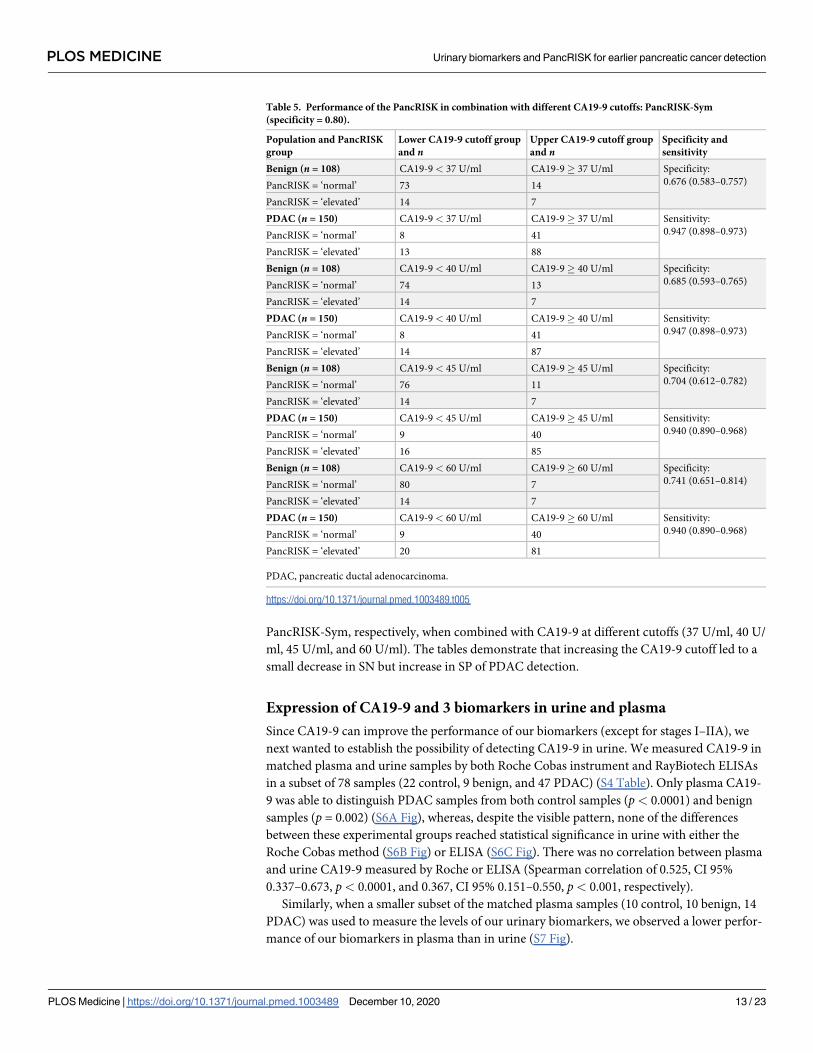
Biomarker expression in other cancers
Finally, we tested the expression of the 3 biomarkers in common urinary tract cancers: 18 PC,
29 RCC, and 20 bladder TCC. The full set of data for each individual biomarker is shown in S6
Table. We compared the expression of the 3 biomarkers in other cancers with that in stage I–II
PDAC (Fig 5).
We found that none of the biomarkers are significantly elevated in PC and in bladder TCC,
while in RCC, LYVE1 and TFF1 levels were not significantly different to those in PDAC. This
was due to the very high values of both LYVE1 and TFF1 in 3 patients, while an additional 2
patients demonstrated high values of either LYVE1 or TFF1 (S6 Table). These data indicate
the overall good SP of our biomarkers for PDAC (Fig 5).
Fig 5. Biomarkers in common genitourinary cancers. The violin plots show the levels of the 3 urinary biomarkers in prostate cancer (PC), renal cell carcinoma (RCC),
and bladder transitional cell carcinoma (TCC) compared with pancreatic ductal adenocarcinoma (PDAC) stages I–II. All data were creatinine normalised. The number
of samples for each group is shown in parentheses. Upper bars: Kruskal–Wallis test, Dunn’s multiple comparisons; ns, not significant.
https://doi.org/10.1371/journal.pmed.1003489.g005
PLOS MEDICINE Urinary biomarkers and PancRISK for earlier pancreatic cancer detection
PLOS Medicine | https://doi.org/10.1371/journal.pmed.1003489 December 10, 2020 14 / 23

Discussion
In this study we report on the performance of our enhanced urinary biomarker panel compris-
ing LYVE1, REG1B, and TFF1 in a larger cohort of specimens, demonstrating its robust per-
formance in discriminating patients with early stages of PDAC from control individuals and
patients with benign hepatobiliary diseases. We also show that the performance of the panel
was improved when combined with plasma CA19-9, and that the biomarkers do not show sig-
nificant daily variation and are stable in urine.
LYVE1 (lymphatic vessel endothelial hyaluronan receptor 1) is a receptor that binds to both
soluble and immobilised hyaluronan. It is involved in lymphatic hyaluronan transport [39]
and has an active role in lymphangiogenesis and endothelial remodelling [40]. REG1B (regen-
erating family member 1 beta) belongs to a family of REG (regenerating) glycoproteins, a
group of calcium-dependent proteins expressed in pancreatic acinar cells. They act as both
autocrine and paracrine growth factors and have been described in patients with pancreatitis
and during pancreatic islet regeneration [41,42]. TFF1 (trefoil factor 1) belongs to a family of
gastrointestinal secretory peptides that interact with mucins and are expressed at increased lev-
els during reconstitution and repair of mucosal injury. They protect epithelial cells from apo-
ptotic death and increase their motility, but also play similar pivotal roles in cancer cells, and
are thus involved in the development and progression of various cancer types [43,44].
All 3 biomarkers have been reported as upregulated in PDAC precursor lesions, i.e., pancre-
atic intraepithelial neoplasias (PanINs), and involved in cancer progression and metastasis.
Using a transgenic model of PanINs, Shen et al. recently demonstrated the association of early
lesions and lymphatic vessels with marked lymphangiogenesis and endothelial remodelling
[40], and we have previously shown, in familial pancreatic cancer (FPC), that the overexpres-
sion of TFF1 was already present in early PanINs before cancer developed [45]. Both REG1A
and REG1B upregulation was demonstrated in precursor lesions, which resulted in an acceler-
ated cell proliferation and tumour growth [46].
While in our previous study [23] the panel included REG1A, we have now modified it by
replacing REG1A with REG1B, as the latter protein outperforms REG1A in discriminating
control samples from PDAC stage I–IIA samples. Of note, both proteins have previously been
proposed as candidate biomarkers for pancreatic cancer [46–48]. Li et al. [46] showed that
they are absent in normal tissue but are highly expressed in PDAC. While REG1A expression
increases with progression from PanINs to cancer, REG1B is already highly expressed in the
earliest PanINs, which is in agreement with our data showing that REG1B is an earlier marker.
The same authors also reported a decreased tissue expression of the 2 proteins in late stage
PDAC, and that the serum levels of both REG1A and REG1B were significantly higher in
PDAC patients than in control individuals, but not in CP patients [46]. In contrast, our data
show that urinary REG1B levels in PDAC are significantly higher than in both control individ-
uals and patients with benign diseases (including CP).
Recently, Klett et al. [49] designed a pancreatic cancer classifier based on transcriptome
analysis. Among the 17 genes, TFF1 was selected for its ability to distinguish normal pancreas
from PanIN and PDAC tissues. The latter discrimination was validated in plasma (although
only 40 samples were interrogated), thus supporting our finding that TFF1 is a good biomarker
for PDAC detection.
The combination of plasma or serum CA19-9 with other biomarkers has been extensively
explored [26,47,48,50]. Recently, Capello et al. [50] analysed CA19-9 with different combina-
tions of 17 plasma proteins, while Mayerle et al. [26] combined CA19-9 with 9 different metab-
olites. Lee et al. [51] reported an improved CA19-9 performance when combined with CEMIP
(cell migration inducing hyaluronidase). In the present study, as we showed previously [31],
PLOS MEDICINE Urinary biomarkers and PancRISK for earlier pancreatic cancer detection
PLOS Medicine | https://doi.org/10.1371/journal.pmed.1003489 December 10, 2020 15 / 23

we found that plasma CA19-9 enhanced the performance of the panel in discriminating con-
trol samples and benign samples from stage I–II and late stage PDAC samples; however, this
was not the case for the PDAC I–IIA samples, indicating superior performance of our urine
panel for earlier detection of pancreatic cancer. Mellby et al. [12] drew a similar conclusion,
based on a serum biomarker panel comprising 29 proteins, which showed the ability to dis-
criminate early stage PDAC from control samples without inclusion of CA19-9.
Most of the biomarker studies published in PDAC are based on serum or plasma analyses.
Only recently, a few publications have emerged highlighting the potential of urine in bio-
marker studies in the pancreatic field as well [52–55]. Roy et al. showed that urine MMP2
(matrix metallopeptidase 2) and TIMP-1 (tissue inhibitor of metalloproteinase 1) combined
can differentiate PDAC (n = 50) from control samples (n = 60), with 91% SN and 75% SP [52],
and Hogendorf et al. [53] showed that neutrophil gelatinase-associated lipocalin (NGAL),
measured in urine can distinguish PDAC (n = 21) from CP (n = 15), with both SN and SP of
80%. Urinary PGEM (prostaglandin E2 metabolite) was recently proposed as a biomarker of
PDAC risk prediction [54]. Yip-Schneider et al. [55] compiled a urinary panel with 3 of the
previously reported biomarkers: LYVE1, TIMP-1, and PGEM. They tested the ability of these
biomarkers to predict the progression of high-grade intraductal papillary mucinous neoplasm
(IPMN) to cancer: While no statistically significant differences in expression levels for any of
the 3 proteins were seen between low- and high-grade IPMN, in line with our findings, LYVE1
showed a significant difference in distinguishing control samples from PDAC samples.
In the present report we also show that our biomarkers are stable in urine, which is in line
with previous proteomic studies, as reviewed by Kalantari et al. [56] and Tantipaiboonwong
et al. [29]. While adding boric acid to the collection tubes can be beneficial in sample transport
and for long-term storage, our results indicate that even with bacterial contamination our bio-
markers are not affected. Such information is important for the development of a robust assay
with the aim of future translation into the clinical setting.
Our aim was to develop a test for earlier non-invasive detection of PDAC using urine sam-
ples. We therefore tested if CA19-9 can also be detected in urine. However, although a pattern
of increased expression of CA19-9 was seen in urine from PDAC patients, none of the differ-
ences among the experimental groups (control, benign diseases, and PDAC) reached statistical
significance. Results similar to ours were also observed by another group, although they
assayed only 5 urine samples [57]. Interestingly, urinary CA19-9 was found to be superior to
its serum counterpart in the diagnosis of low-grade and early stages of TCC of urinary bladder
[58]. Increased levels of CA19-9 were seen in urine due to urothelial obstruction [59] and
renal injury [60], indicating the local production and secretion of this glycolipid into urine.
Our inability to detect significant differences in CA19-9 expression in our experiments using
pancreatic samples could therefore be due to either limited passage of this molecule through
the glomerular barrier or post-translational modification or proteolytic processing that lead to
masking, alteration, or loss of the epitopes recognised by currently available antibodies.
In order to achieve truly non-invasive PDAC detection, we are now testing additional ana-
lytes in urine to potentially combine with our protein panel [25,61].
One of the challenges in early detection of PDAC is the selection of the appropriate cohorts
at risk, as screening in the general population is not feasible [62,63]. Current guidelines recom-
mend screening of asymptomatic individuals with a history of FPC and predisposing genetic
syndromes [64]. Additional amenable cohorts include patients with CP, cystic lesions of the
pancreas, and new onset diabetes (NOD) [62]. We propose to test our biomarkers and Pan-
cRISK in all the above cohorts. For individuals with genetic predisposition, we would apply
the PancRISK-Fam threshold based on SN, to maximise the chances of detecting PDAC, while
in patients with symptoms suggestive of PDAC (such as CP), we would fix the threshold in
PLOS MEDICINE Urinary biomarkers and PancRISK for earlier pancreatic cancer detection
PLOS Medicine | https://doi.org/10.1371/journal.pmed.1003489 December 10, 2020 16 / 23

PancRISK-Sym based on SP. The patients deemed by PancRISK to have an elevated risk of
PDAC development would then undergo further, typically invasive and costly clinical workup,
e.g., imaging. The simple urine testing with a binary PancRISK outcome would be straightfor-
ward to employ and would likely serve as a cost-effective triaging (sieving) tool, further enrich-
ing the populations at risk.
Despite the promising results, our study has several limitations. We interrogated a small
number of urine samples collected from patients with PDAC I–IIA (n = 27), which was unfor-
tunately unavoidable, since the large majority of patients are still diagnosed with advanced
cancer. Also, we only tested our panel in a limited number of benign cystic lesions of the pan-
creas and have not performed the direct comparison to their invasive counterparts, again due
to the unavailability of such samples. Similarly, our panel needs to be tested in urine collected
from FPC and NOD cohorts as soon as they become available. A further drawback is the use of
commercially available ELISAs, an issue which we already faced previously [31] and experi-
enced again. Due to changes in ELISAs, we had to repeat all the measurements for both TFF1
and LYVE1. Since starting with the biomarker studies more than a decade ago, we have
observed significant variability in ELISA performance for all 3 proteins, not only between dif-
ferent companies but also within the same manufacturer due to changes in the reagents and
the capture and detection antibodies.
Conclusions
In summary, we successfully validated the performance of our urinary biomarker panel in
detecting PDAC earlier. Our PancRISK score is designed to enable further stratification of
patients already predisposed to develop PDAC, thus enriching the population that should
undergo follow-up, i.e., invasive clinical workup. We are now further evaluating the biomark-
ers and affiliated PancRISK score in a large prospective observational study, UroPanc (http://
www.pcrf.org.uk/pages/uropanc-clinical-study.html).
Supporting information
S1 Fig. Comparison of REG1A and REG1B performance. Violin plots showing the levels of
REG1A and REG1B in 306 urine samples (79 control, 87 benign, and 140 PDAC [16 stage I–
IIA, 70 stage I–II, and 70 stage III–IV]). All data were creatinine normalised. Upper bars:
Kruskal–Wallis test, Dunn’s multiple comparisons; ns, not significant.
(TIF)
S2 Fig. Evaluation of the urinary panel in combination with plasma CA19-9: Control ver-
sus late and all stage PDAC samples. Performance in distinguishing control samples (n = 92)
from late stage PDAC (stage III–IV) (n = 70) (A and D) and from PDAC at all stages (n = 150)
(B and D). ROC curve for CA19-9 and biomarker panel alone and in combination (A and B);
summary of the performances (C and D).
(TIF)
S3 Fig. Evaluation of the urinary panel in combination with plasma CA19-9: Benign versus
late and all stage PDAC samples. Performance in distinguishing benign samples (n = 108)
from late stage PDAC (stage III–IV) (n = 70) (A and D) and from PDAC at all stages (n = 150)
(B and D). ROC curve of CA19-9 and biomarker panel alone and in combination (A and B);
summary of the performances (C and D).
(TIF)
S4 Fig. Performance of urine biomarker panel in distinguishing CP from PDAC. Compari-
son of PDAC stages I–II, III–IV, and I–IV to CP: (A) ROC curve of the 3-biomarker panel in
PLOS MEDICINE Urinary biomarkers and PancRISK for earlier pancreatic cancer detection
PLOS Medicine | https://doi.org/10.1371/journal.pmed.1003489 December 10, 2020 17 / 23
the validation sets (50% of the samples). (B) Performance of the biomarkers in the training
and validation sets expressed as area under the ROC curve (AUC). (C) SN of the urinary panel
with different SP cutoffs.
(TIF)
S5 Fig. Evaluation of the urinary panel in combination with plasma CA19-9: CP versus
PDAC samples. Performance in distinguishing CP samples (n = 64) from PDAC stage I–II
(n = 80) (A and D), PDAC stage III–IV (n = 70) (B and E), and PDAC at all stages (n = 150) (C
and F). ROC curve of CA19-9 and biomarker panel alone and in combination (A–C); sum-
mary of the performances (D–F).
(TIF)
S6 Fig. Comparison between plasma and urine CA19-9. Violin plots showing (A and B)
plasma and urine CA19-9 measured by Roche Cobas and (C) urine CA19-9 measured by
ELISA (78 samples comprising 22 control, 9 benign, and 47 PDAC I–IV). The number of sam-
ples for each group is shown in parentheses. All data were creatinine normalised. Upper bars:
Kruskal–Wallis test, Dunn’s multiple comparisons; ns, not significant.
(TIF)
S7 Fig. Comparison of LYVE1, REG1B, and TFF1 in matched plasma and urine samples.
The performance of the 3 biomarkers in plasma (A) compared to urine (B). The number of
samples per group is shown in parentheses. Urine data were creatinine normalised. Upper
bars: Kruskal–Wallis test, Dunn’s multiple comparisons; ns, not significant.
(TIF)
S8 Fig. Urine biomarker stability test. (A) Daily level variations of LYVE1, REG1B, and TFF1
in urine collected twice a day, in the morning (AM) and in the afternoon (PM) for 2 days, in
the afternoon on the third day, and in the morning on the fourth day, in 4 control individuals.
(B and C) Level of LYVE1, REG1B, and TFF1 in urine specimens left at room temperature for
up to 5 days when collected (B) in sterile tubes without boric acid or (C) in tubes containing
boric acid. All data were creatinine normalised. Each colour represents an individual.
(TIF)
S1 Table. Sample details and ELISA results for 590 samples.
(XLSX)
S2 Table. Validation and training datasets.
(DOCX)
S3 Table. Positive and negative predictive values.
(DOCX)
S4 Table. CA19-9 measurements in urine and plasma.
(DOCX)
S5 Table. ELISA results for stability test.
(DOCX)
S6 Table. ELISA results of 3 urinary tract cancers.
(DOCX)
S1 Appendix. Flow diagram and analysis plan.
(DOCX)
PLOS MEDICINE Urinary biomarkers and PancRISK for earlier pancreatic cancer detection
PLOS Medicine | https://doi.org/10.1371/journal.pmed.1003489 December 10, 2020 18 / 23

S2 Appendix. REMARK checklist.
(DOCX)
Acknowledgments
We are grateful to all members of Barts Pancreas Tissue Bank; Ahmet Imrali, Vickna Balarajah,
Mohamed Zardab, Konstantinos Stasinos, Dayem Ullah, Richard Grose, and Claude Chelala
for setting up the framework for collection and distribution of samples; and all patients and
families who donated samples as well as medical and nursing teams who facilitated the collec-
tion. We are grateful to Vincent J. Gnanapragasam (University of Cambridge) for access to the
samples from the DIAMOND study, as well as to Francesco Real and the Spanish centres con-
tributing to the PanGenEU study.
Author Contributions
Conceptualization: Silvana Debernardi, Eithne Costello, William Greenhalf, Stephen P. Per-
eira, Oleg Blyuss, Tatjana Crnogorac-Jurcevic.
Data curation: Silvana Debernardi, Oleg Blyuss.
Formal analysis: Silvana Debernardi, Stephen Duffy, Oleg Blyuss, Tatjana Crnogorac-
Jurcevic.
Funding acquisition: Tatjana Crnogorac-Jurcevic.
Investigation: Silvana Debernardi, Harrison O’Brien, Asma S. Algahmdi.
Project administration: Silvana Debernardi.
Resources: Nuria Malats, Grant D. Stewart, Marija Pljesa-Ercegovac, Eithne Costello, William
Greenhalf, Amina Saad, Rhiannon Roberts, Alexander Ney, Stephen P. Pereira, Hemant M.
Kocher.
Software: Oleg Blyuss.
Supervision: Stephen Duffy, Tatjana Crnogorac-Jurcevic.
Validation: Harrison O’Brien, Asma S. Algahmdi.
Visualization: Silvana Debernardi, Oleg Blyuss.
Writing – original draft: Silvana Debernardi.
Writing – review & editing: Nuria Malats, Grant D. Stewart, Marija Pljesa-Ercegovac, Eithne
Costello, William Greenhalf, Alexander Ney, Stephen P. Pereira, Hemant M. Kocher, Oleg
Blyuss, Tatjana Crnogorac-Jurcevic.
References1. Arnold M, Rutherford MJ, Bardot A, Ferlay J, Andersson TM, Myklebust TA, et al. Progress in cancer
survival, mortality, and incidence in seven high-income countries 1995–2014 (ICBP SURVMARK-2): a
population-based study. Lancet Oncol. 2019; 20(11):1493–505. https://doi.org/10.1016/S1470-2045
(19)30456-5 PMID: 31521509
2. Bray F, Ferlay J, Soerjomataram I, Siegel RL, Torre LA, Jemal A. Global cancer statistics 2018: GLO-
BOCAN estimates of incidence and mortality worldwide for 36 cancers in 185 countries. CA Cancer J
Clin. 2018; 68(6):394–424. https://doi.org/10.3322/caac.21492 PMID: 30207593
3. Siegel RL, Miller KD, Jemal A. Cancer statistics, 2018. CA Cancer J Clin. 2018; 68(1):7–30. https://doi.
org/10.3322/caac.21442 PMID: 29313949
PLOS MEDICINE Urinary biomarkers and PancRISK for earlier pancreatic cancer detection
PLOS Medicine | https://doi.org/10.1371/journal.pmed.1003489 December 10, 2020 19 / 23

4. Shimizu Y, Yasui K, Matsueda K, Yanagisawa A, Yamao K. Small carcinoma of the pancreas is curable:
new computed tomography finding, pathological study and postoperative results from a single institute.
J Gastroenterol Hepatol. 2005; 20(10):1591–4. https://doi.org/10.1111/j.1440-1746.2005.03895.x
PMID: 16174079
5. Huang L, Jansen L, Balavarca Y, Molina-Montes E, Babaei M, van der Geest L, et al. Resection of pan-
creatic cancer in Europe and USA: an international large-scale study highlighting large variations. Gut.
2019; 68(1):130–9. https://doi.org/10.1136/gutjnl-2017-314828 PMID: 29158237
6. Ballehaninna UK, Chamberlain RS. The clinical utility of serum CA 19–9 in the diagnosis, prognosis and
management of pancreatic adenocarcinoma: an evidence based appraisal. J Gastrointest Oncol. 2012;
3(2):105–19. https://doi.org/10.3978/j.issn.2078-6891.2011.021 PMID: 22811878
7. Ziske C, Schlie C, Gorschluter M, Glasmacher A, Mey U, Strehl J, et al. Prognostic value of CA 19–9
levels in patients with inoperable adenocarcinoma of the pancreas treated with gemcitabine. Br J Can-
cer. 2003; 89(8):1413–7. https://doi.org/10.1038/sj.bjc.6601263 PMID: 14562009
8. Humphris JL, Chang DK, Johns AL, Scarlett CJ, Pajic M, Jones MD, et al. The prognostic and predictive
value of serum CA19.9 in pancreatic cancer. Ann Oncol. 2012; 23(7):1713–22. https://doi.org/10.1093/
annonc/mdr561 PMID: 22241899
9. Poruk KE, Gay DZ, Brown K, Mulvihill JD, Boucher KM, Scaife CL, et al. The clinical utility of CA 19–9 in
pancreatic adenocarcinoma: diagnostic and prognostic updates. Curr Mol Med. 2013; 13(3):340–51.
https://doi.org/10.2174/1566524011313030003 PMID: 23331006
10. Jimenez-Luna C, Torres C, Ortiz R, Dieguez C, Martinez-Galan J, Melguizo C, et al. Proteomic biomark-
ers in body fluids associated with pancreatic cancer. Oncotarget. 2018; 9(23):16573–87. https://doi.org/
10.18632/oncotarget.24654 PMID: 29662668
11. Park J, Lee E, Park KJ, Park HD, Kim JW, Woo HI, et al. Large-scale clinical validation of biomarkers for
pancreatic cancer using a mass spectrometry-based proteomics approach. Oncotarget. 2017; 8
(26):42761–71. https://doi.org/10.18632/oncotarget.17463 PMID: 28514751
12. Mellby LD, Nyberg AP, Johansen JS, Wingren C, Nordestgaard BG, Bojesen SE, et al. Serum bio-
marker signature-based liquid biopsy for diagnosis of early-stage pancreatic cancer. J Clin Oncol. 2018;
36(28):2887–94. https://doi.org/10.1200/JCO.2017.77.6658 PMID: 30106639
13. Honda K, Katzke VA, Husing A, Okaya S, Shoji H, Onidani K, et al. CA19-9 and apolipoprotein-A2 iso-
forms as detection markers for pancreatic cancer: a prospective evaluation. Int J Cancer. 2019; 144
(8):1877–87. https://doi.org/10.1002/ijc.31900 PMID: 30259989
14. Young MR, Wagner PD, Ghosh S, Rinaudo JA, Baker SG, Zaret KS, et al. Validation of biomarkers for
early detection of pancreatic cancer: summary of the Alliance of Pancreatic Cancer Consortia for Bio-
markers for Early Detection Workshop. Pancreas. 2018; 47(2):135–41. https://doi.org/10.1097/MPA.
0000000000000973 PMID: 29346214
15. Pang Y, Holmes MV, Chen Z, Kartsonaki C. A review of lifestyle, metabolic risk factors, and blood-
based biomarkers for early diagnosis of pancreatic ductal adenocarcinoma. J Gastroenterol Hepatol.
2019; 34(2):330–45. https://doi.org/10.1111/jgh.14576 PMID: 30550622
16. Thongboonkerd V. Recent progress in urinary proteomics. Proteomics Clin Appl. 2007; 1(8):780–91.
https://doi.org/10.1002/prca.200700035 PMID: 21136734
17. Dinges SS, Hohm A, Vandergrift LA, Nowak J, Habbel P, Kaltashov IA, et al. Cancer metabolomic
markers in urine: evidence, techniques and recommendations. Nat Rev Urol. 2019; 16(6):339–62.
https://doi.org/10.1038/s41585-019-0185-3 PMID: 31092915
18. Adachi J, Kumar C, Zhang Y, Olsen JV, Mann M. The human urinary proteome contains more than
1500 proteins, including a large proportion of membrane proteins. Genome Biol. 2006; 7(9):R80. https://
doi.org/10.1186/gb-2006-7-9-R80 PMID: 16948836
19. Good DM, Thongboonkerd V, Novak J, Bascands JL, Schanstra JP, Coon JJ, et al. Body fluid proteo-
mics for biomarker discovery: lessons from the past hold the key to success in the future. J Proteome
Res. 2007; 6(12):4549–55. https://doi.org/10.1021/pr070529w PMID: 17970587
20. Napoli C, Sperandio N, Lawlor RT, Scarpa A, Molinari H, Assfalg M. Urine metabolic signature of pan-
creatic ductal adenocarcinoma by (1)h nuclear magnetic resonance: identification, mapping, and evolu-
tion. J Proteome Res. 2012; 11(2):1274–83. https://doi.org/10.1021/pr200960u PMID: 22066465
21. Davis VW, Schiller DE, Eurich D, Bathe OF, Sawyer MB. Pancreatic ductal adenocarcinoma is associ-
ated with a distinct urinary metabolomic signature. Ann Surg Oncol. 2013; 20(Suppl 3):S415–23.
https://doi.org/10.1245/s10434-012-2686-7 PMID: 23096698
22. Lusczek ER, Paulo JA, Saltzman JR, Kadiyala V, Banks PA, Beilman G, et al. Urinary 1H-NMR metabo-
lomics can distinguish pancreatitis patients from healthy controls. JOP. 2013; 14(2):161–70. https://doi.
org/10.6092/1590-8577/1294 PMID: 23474563
PLOS MEDICINE Urinary biomarkers and PancRISK for earlier pancreatic cancer detection
PLOS Medicine | https://doi.org/10.1371/journal.pmed.1003489 December 10, 2020 20 / 23

23. Radon TP, Massat NJ, Jones R, Alrawashdeh W, Dumartin L, Ennis D, et al. Identification of a three-
biomarker panel in urine for early detection of pancreatic adenocarcinoma. Clin Cancer Res. 2015; 21
(15):3512–21. https://doi.org/10.1158/1078-0432.CCR-14-2467 PMID: 26240291
24. Debernardi S, Massat NJ, Radon TP, Sangaralingam A, Banissi A, Ennis DP, et al. Noninvasive urinary
miRNA biomarkers for early detection of pancreatic adenocarcinoma. Am J Cancer Res. 2015; 5
(11):3455–66. PMID: 26807325
25. Arasaradnam RP, Wicaksono A, O’Brien H, Kocher HM, Covington JA, Crnogorac-Jurcevic T. Noninva-
sive diagnosis of pancreatic cancer through detection of volatile organic compounds in urine. Gastroen-
terology. 2018; 154(3):485–7.e1. https://doi.org/10.1053/j.gastro.2017.09.054 PMID: 29129714
26. Mayerle J, Kalthoff H, Reszka R, Kamlage B, Peter E, Schniewind B, et al. Metabolic biomarker signa-
ture to differentiate pancreatic ductal adenocarcinoma from chronic pancreatitis. Gut. 2018; 67(1):128–
37. https://doi.org/10.1136/gutjnl-2016-312432 PMID: 28108468
27. Ward DG, Nyangoma S, Joy H, Hamilton E, Wei W, Tselepis C, et al. Proteomic profiling of urine for the
detection of colon cancer. Proteome Sci. 2008; 6:19. https://doi.org/10.1186/1477-5956-6-19 PMID:
18558005
28. Ye B, Skates S, Mok SC, Horick NK, Rosenberg HF, Vitonis A, et al. Proteomic-based discovery and
characterization of glycosylated eosinophil-derived neurotoxin and COOH-terminal osteopontin frag-
ments for ovarian cancer in urine. Clin Cancer Res. 2006; 12(2):432–41. https://doi.org/10.1158/1078-
0432.CCR-05-0461 PMID: 16428483
29. Tantipaiboonwong P, Sinchaikul S, Sriyam S, Phutrakul S, Chen ST. Different techniques for urinary
protein analysis of normal and lung cancer patients. Proteomics. 2005; 5(4):1140–9. https://doi.org/10.
1002/pmic.200401143 PMID: 15693063
30. Duangkumpha K, Stoll T, Phetcharaburanin J, Yongvanit P, Thanan R, Techasen A, et al. Urine proteo-
mics study reveals potential biomarkers for the differential diagnosis of cholangiocarcinoma and peri-
ductal fibrosis. PLoS ONE. 2019; 14(8):e0221024. https://doi.org/10.1371/journal.pone.0221024
PMID: 31425520
31. Blyuss O, Zaikin A, Cherepanova V, Munblit D, Kiseleva EM, Prytomanova OM, et al. Development of
PancRISK, a urine biomarker-based risk score for stratified screening of pancreatic cancer patients. Br
J Cancer. 2020; 122:692–6. https://doi.org/10.1038/s41416-019-0694-0 PMID: 31857725
32. Lijmer JG, Mol BW, Heisterkamp S, Bonsel GJ, Prins MH, van der Meulen JH, et al. Empirical evidence
of design-related bias in studies of diagnostic tests. JAMA. 1999; 282(11):1061–6. 10.1001/
jama.282.11.1061 https://doi.org/10.1001/jama.282.11.1061 PMID: 10493205
33. Peduzzi P, Concato J, Kemper E, Holford TR, Feinstein AR. A simulation study of the number of events
per variable in logistic regression analysis. J Clin Epidemiol. 1996; 49(12):1373–9. https://doi.org/10.
1016/s0895-4356(96)00236-3 PMID: 8970487
34. DeLong ER, DeLong DM, Clarke-Pearson DL. Comparing the areas under two or more correlated
receiver operating characteristic curves: a nonparametric approach. Biometrics. 1988; 44(3):837–45.
PMID: 3203132
35. Carpenter J, Bithell J. Bootstrap confidence intervals: when, which, what? A practical guide for medical
statisticians. Stat Med. 2000; 19(9):1141–64. https://doi.org/10.1002/(sici)1097-0258(20000515)
19:9<1141::aid-sim479>3.0.co;2-f PMID: 10797513
36. Altman DG, Bland JM. Diagnostic tests 2: predictive values. BMJ. 1994; 309(6947):102. https://doi.org/
10.1136/bmj.309.6947.102 PMID: 8038641
37. Sing T, Sander O, Beerenwinkel N, Lengauer T. ROCR: visualizing classifier performance in R. Bioin-
formatics. 2005; 21(20):3940–1. https://doi.org/10.1093/bioinformatics/bti623 PMID: 16096348
38. Robin X, Turck N, Hainard A, Tiberti N, Lisacek F, Sanchez JC, et al. pROC: an open-source package
for R and S+ to analyze and compare ROC curves. BMC Bioinformatics. 2011; 12:77. https://doi.org/10.
1186/1471-2105-12-77 PMID: 21414208
39. Jackson DG. Immunological functions of hyaluronan and its receptors in the lymphatics. Immunol Rev.
2009; 230(1):216–31. https://doi.org/10.1111/j.1600-065X.2009.00803.x PMID: 19594639
40. Shen CN, Goh KS, Huang CR, Chiang TC, Lee CY, Jeng YM, et al. Lymphatic vessel remodeling and
invasion in pancreatic cancer progression. EBioMedicine. 2019; 47:98–113. https://doi.org/10.1016/j.
ebiom.2019.08.044 PMID: 31495721
41. Wu H, Zheng Q, Rengabhashyam P, Zenilman ME. A brief history of pancreatic reg: implications as to
its clinical importance. Einstein Q J Biol Med. 2000; 17(4):178. PMID: 21687811
42. Zhang YW, Ding LS, Lai MD. Reg gene family and human diseases. World J Gastroenterol. 2003; 9
(12):2635–41. https://doi.org/10.3748/wjg.v9.i12.2635 PMID: 14669303
PLOS MEDICINE Urinary biomarkers and PancRISK for earlier pancreatic cancer detection
PLOS Medicine | https://doi.org/10.1371/journal.pmed.1003489 December 10, 2020 21 / 23

43. Emami S, Rodrigues S, Rodrigue CM, Le Floch N, Rivat C, Attoub S, et al. Trefoil factor family (TFF)
peptides and cancer progression. Peptides. 2004; 25(5):885–98. https://doi.org/10.1016/j.peptides.
2003.10.019 PMID: 15177885
44. Perry JK, Kannan N, Grandison PM, Mitchell MD, Lobie PE. Are trefoil factors oncogenic? Trends Endo-
crinol Metab. 2008; 19(2):74–81. https://doi.org/10.1016/j.tem.2007.10.003 PMID: 18054496
45. Crnogorac-Jurcevic T, Chelala C, Barry S, Harada T, Bhakta V, Lattimore S, et al. Molecular analysis of
precursor lesions in familial pancreatic cancer. PLoS ONE. 2013; 8(1):e54830. https://doi.org/10.1371/
journal.pone.0054830 PMID: 23372777
46. Li Q, Wang H, Zogopoulos G, Shao Q, Dong K, Lv F, et al. Reg proteins promote acinar-to-ductal meta-
plasia and act as novel diagnostic and prognostic markers in pancreatic ductal adenocarcinoma. Onco-
target. 2016; 7(47):77838–53. https://doi.org/10.18632/oncotarget.12834 PMID: 27788482
47. Chan A, Prassas I, Dimitromanolakis A, Brand RE, Serra S, Diamandis EP, et al. Validation of biomark-
ers that complement CA19.9 in detecting early pancreatic cancer. Clin Cancer Res. 2014; 20(22):5787–
95. https://doi.org/10.1158/1078-0432.CCR-14-0289 PMID: 25239611
48. Makawita S, Dimitromanolakis A, Soosaipillai A, Soleas I, Chan A, Gallinger S, et al. Validation of four
candidate pancreatic cancer serological biomarkers that improve the performance of CA19.9. BMC
Cancer. 2013; 13:404. https://doi.org/10.1186/1471-2407-13-404 PMID: 24007603
49. Klett H, Fuellgraf H, Levit-Zerdoun E, Hussung S, Kowar S, Kusters S, et al. Identification and validation
of a diagnostic and prognostic multi-gene biomarker panel for pancreatic ductal adenocarcinoma. Front
Genet. 2018; 9:108. https://doi.org/10.3389/fgene.2018.00108 PMID: 29675033
50. Capello M, Bantis LE, Scelo G, Zhao Y, Li P, Dhillon DS, et al. sequential validation of blood-based pro-
tein biomarker candidates for early-stage pancreatic cancer. J Natl Cancer Inst. 2017; 109(4):djw266.
https://doi.org/10.1093/jnci/djw266 PMID: 28376157
51. Lee HS, Jang CY, Kim SA, Park SB, Jung DE, Kim BO, et al. Combined use of CEMIP and CA 19–9
enhances diagnostic accuracy for pancreatic cancer. Sci Rep. 2018; 8(1):3383. https://doi.org/10.1038/
s41598-018-21823-x PMID: 29467409
52. Roy R, Zurakowski D, Wischhusen J, Frauenhoffer C, Hooshmand S, Kulke M, et al. Urinary TIMP-1
and MMP-2 levels detect the presence of pancreatic malignancies. Br J Cancer. 2014; 111(9):1772–9.
https://doi.org/10.1038/bjc.2014.462 PMID: 25137018
53. Hogendorf P, Durczynski A, Skulimowski A, Kumor A, Poznanska G, Strzelczyk J. Neutrophil gelati-
nase-associated lipocalin (NGAL) concentration in urine is superior to CA19-9 and Ca 125 in differentia-
tion of pancreatic mass: preliminary report. Cancer Biomark. 2016; 16(4):537–43. https://doi.org/10.
3233/CBM-160595 PMID: 27002756
54. Cui Y, Shu XO, Li HL, Yang G, Wen W, Gao YT, et al. Prospective study of urinary prostaglandin E2
metabolite and pancreatic cancer risk. Int J Cancer. 2017; 141(12):2423–9. https://doi.org/10.1002/ijc.
31007 PMID: 28815606
55. Yip-Schneider MT, Soufi M, Carr RA, Flick KF, Wu H, Colgate CL, et al. Performance of candidate uri-
nary biomarkers for pancreatic cancer—correlation with pancreatic cyst malignant progression? Am J
Surg. 2019; 219(3):492–5. https://doi.org/10.1016/j.amjsurg.2019.09.013 PMID: 31554598
56. Kalantari S, Jafari A, Moradpoor R, Ghasemi E, Khalkhal E. Human urine proteomics: analytical tech-
niques and clinical applications in renal diseases. Int J Proteomics. 2015; 2015:782798. https://doi.org/
10.1155/2015/782798 PMID: 26693351
57. Ben-Ishay O, Or Haim S, Kaplan M, Kluger Y. CA19-9 levels in saliva and urine of patients with ductal
adenocarcinoma of the pancreas correlates with serum CA19-9 Levels—a prospective preliminary
study. JOP. 2016; 17(1):66–9.
58. Roy S, Dasgupta A, Kar K. Comparison of urinary and serum CA 19–9 as markers of early stage urothe-
lial carcinoma. Int Braz J Urol. 2013; 39(5):631–8. https://doi.org/10.1590/S1677-5538.IBJU.2013.05.
04 PMID: 24267106
59. Kajbafzadeh AM, Elmi A, Talab SS, Emami H, Esfahani SA, Saeedi P. Urinary and serum carbohydrate
antigen 19–9 as a biomarker in ureteropelvic junction obstruction in children. J Urol. 2010; 183(6):2353–
60. https://doi.org/10.1016/j.juro.2010.02.031 PMID: 20400153
60. Amini E, Pishgar F, Hojjat A, Soleimani M, Asgari MA, Kajbafzadeh AM. The role of serum and urinary
carbohydrate antigen 19–9 in predicting renal injury associated with ureteral stone. Ren Fail. 2016; 38
(10):1626–32. https://doi.org/10.1080/0886022X.2016.1202732 PMID: 27756162
61. Schilling K, Larner F, Saad A, Roberts R, Kocher HM, Blyuss O, et al. Urine metallomics signature as
an indicator of pancreatic cancer. Metallomics. 2020; 12(5):752–7. https://doi.org/10.1039/d0mt00061b
PMID: 32211672
PLOS MEDICINE Urinary biomarkers and PancRISK for earlier pancreatic cancer detection
PLOS Medicine | https://doi.org/10.1371/journal.pmed.1003489 December 10, 2020 22 / 23

62. Singhi AD, Koay EJ, Chari ST, Maitra A. Early detection of pancreatic cancer: opportunities and chal-
lenges. Gastroenterology. 2019; 156(7):2024–40. https://doi.org/10.1053/j.gastro.2019.01.259 PMID:
30721664
63. Pereira SP, Oldfield L, Ney A, Hart PA, Keane MG, Pandol SJ, et al. Early detection of pancreatic can-
cer. Lancet Gastroenterol Hepatol. 2020; 5(7):698–710. https://doi.org/10.1016/S2468-1253(19)30416-
9 PMID: 32135127
64. Benzel J, Fendrich V. Familial pancreatic cancer. Oncol Res Treat. 2018; 41(10):611–8. https://doi.org/
10.1159/000493473 PMID: 30269130
PLOS MEDICINE Urinary biomarkers and PancRISK for earlier pancreatic cancer detection
PLOS Medicine | https://doi.org/10.1371/journal.pmed.1003489 December 10, 2020 23 / 23