
A climate change partnership of GEF, UNDP, SPREP and the … · 2008-07-30 · A climate change...
67
Pacific Islands Renewable SPREP Energy Project PIREP our islands, our lives… Pacific Regional Energy Assessment 2004 An Assessment of the Key Energy Issues, Barriers to the Development of Renewable Energy to Mitigate Climate Change, and Capacity Development Needs for Removing the Barriers SAMOA National Report A climate change partnership of GEF, UNDP, SPREP and the Pacific Islands U DP N The Secretariat of the Pacific Regional Environment Programme Volume 11
Transcript of A climate change partnership of GEF, UNDP, SPREP and the … · 2008-07-30 · A climate change...
Pacific Islands Renewable SPREP Energy Project
PIREPour islands, our lives…
Pacific Regional Energy Assessment
2004An Assessment of the Key Energy Issues,
Barriers to the Development of Renewable Energyto Mitigate Climate Change, and Capacity
Development Needs for Removing the Barriers
SAMOANational Report
A climate change partnership of GEF, UNDP, SPREP and the Pacific Islands
U
D P
N
Th
e Se
cret
aria
t of
th
e Pa
cifi
c R
egio
nal
En
viro
nm
ent
Pro
gram
me
Volume 11

SPREP IRC Cataloguing-in-Publication Data
Wade, Herbert Pacific Regional Energy Assessment 2004 :an assessment of the key energy issues, barriersto the development of renewable energy tomitigate climate change, and capacity developmentneeds to removing the barriers : Samoa NationalReport / Herbert Wade; Johnston Peter; Vos John.– Apia, Samoa : SPREP, 2005.
xiii, 54 p. : figs., tables ; 29 cm. – (Pacific IslandsRenewable Energy Project. Technical report ; no.11)
“This report is based on data gathered by aPIREP team consisting of Sili’a Kilepoa Ualesi, Tala Tevita,John Vos, Peter Johnston and Herbert Wade”.
ISBN: 982-04-0297-2
1. Energy development – Samoa. 2. Energy sources,Renewable – Samoa. 3. Energy research – Samoa4. Conservation of energy resources – Samoa. 5. Conservationof natural resources – Samoa. 6.Energy consumption- Climate factors – Samoa. I. Ualesi, Sili’a Kilepoa. II. Tevita,Tala. III. Vos, John. IV. Johnston, Peter. V. Pacific IslandsRenewable Energy Project (PIREP). VI. Secretariat of thePacific Regional Environment Programme - (SPREP).VII. Title. VIII. Series.
333.794159614

i
Currency Equivalent: 1.0 WS$ ($SAT) or tala = US$ 0.35 (January-April 2004) Fiscal Year: January – December
Time Zone: GMT / UTC minus 11 hours This report is based on data gathered by a PIREP team consisting of:
Ms Sili’a Kilepoa Ualesi, National PIREP Coordinator; Ms Tala Tevita, National PIREP Consultant;
Mr John Vos, International PIREP Consultant; and Mr Peter Johnston, International PIREP Consultant,
with additional inputs from Mr. Herbert Wade, International PIREP Consultant / Team Leader
The three international consultants visited Samoa separately at various times between November 2003 and early May 2004, each spending several days to over a week in the country. Information for the report was gathered both during and after the visits by the national consultant. The national coordinator provided generous support and assistance during the several visits. All discussions were held on the island of Upolu. The report reviews the status of energy sector activities in Samoa through May 2004. A May 2004 draft of this report was reviewed by the Samoan National PIREP Coordinating Committee, Secretariat of the Pacific Regional Environment Programme, South Pacific Applied Geoscience Commission, United Nations Development Programme and others. However, the contents are the responsibility of the undersigned and do not necessarily represent the views of the Government of the Independent State of Samoa, the national PIREP committee, SPREP, UNDP, SOPAC, the Global Environment Facility or the many individuals who kindly provided information on which the study is based.
Peter Johnston John Vos Herbert Wade October 2004

ii
ACRONYMS AAGR Average Annual Growth Rate AC Alternating Current ACP African, Caribbean, Pacific countries ADB Asian Development Bank ADO Automotive Diesel Oil BOC British Oxygen Company BP British Petroleum CCA Common Country Assessment (of the UN) CDM Clean Development Mechanism CIA Central Intelligence Agency (USA) CIF Cost+insurance+freight COPS Coconut Oil Products of Samoa CPI Consumer Price Index CROP Council of Regional Organisations of the Pacific CURES Citizens United for Renewable Energy and Sustainability DC Direct Current DLSE Department of Lands, Survey and Environment DPK Dual Purpose Kerosene DSM Demand Side Management for efficient electricity use EC European Community EDF European Development Fund EEZ Exclusive Economic Zone EIA Environmental Impact Assessment ENSO El Niño/El Niña oceanic climate cycle EPC Electric Power Corporation ESCAP Economic and Social Commission for Asia and the Pacific (UN) EU European Union EWG Energy Working Group of CROP FY Fiscal Year GDP Gross Domestic Product GEF Global Environment Facility GHG Greenhouse Gas GMT/UTC Greenwich Mean Time/Universal Time Coordinate GNP Gross National Product HF High Frequency Hp Horsepower IMF International Monetary Fund IUCN International Union for the Conservation of Nature JICA Japan International Cooperation Agency kV Kilo-Volts (thousands of volts) kVA Kilo-Volt-Amperes (Thousands of Volt Amperes of power) kW Kilo-Watt (Thousands of Watts of power) kWh Kilo-Watt-Hour (Thousands of Watt Hours of energy) kWp Kilo-Watts peak power (at standard conditions) from PV panels LPG Liquefied Petroleum Gas MDG Millennium Development Goals MNRE Ministry of Natural Resources and Environment MOU Memorandum of Understanding MWTI Ministry of Works, Transport and Infrastructure NASA US National Aeronautics and Space Administration

iii
NCCP National Climate Change Policy NORAD Norwegian Agency for International Development OPEC Organisation of Petroleum Exporting Countries OTEC Ocean Thermal Energy Conversion PACER Pacific Agreement on Close Economic Relations PEDP Pacific Energy Development Programme (UN 1982-1993) PIC Pacific Island Country PICCAP Pacific Islands Climate Change Assistance Programme (GEF/UNDP) PICTA Pacific Islands Trade Agreement PIEPSAP Pacific Islands Energy Policies and Strategic Action Planning PIFS Pacific Islands Forum Secretariat PIREP Pacific Island Renewable Energy Project (GEF/UNDP) PPA Pacific Power Association PREA Pacific Regional Energy Assessment (1992) PREGA Promotion of Renewable Energy, Energy Efficiency and GHG Abatement (ADB) PUMA Planning and Urban Management Agency PV Photovoltaic REEP Renewable Energy and Energy Efficiency Programme (ADB) RET Renewable Energy Technology RFP Request for Proposals SAMFRIS Samoa Forest Resource Information System SFP Samoa Forest Products SHS Solar Home Systems SOPAC South Pacific Applied Geoscience Commission SPC Secretariat of the Pacific Community SPREP Secretariat of the Pacific Regional Environment Programme SWH Solar water Heater SWOT Strengths, Weaknesses, Opportunities and Threats ULP Unleaded Petrol UN United Nations UNDP United Nations Development Programme UNEP United Nations Environment Programme UNESCO United Nations Educational, Scientific and Cultural Organization UNFCCC United Nations Framework Convention on Climate Change US United States USAID United States Agency for International Development USGIC United States Geothermal Industries Corporation USP University of the South Pacific V Volts VAGST Value Added Goods and Service Tax WB World Bank WCD World Commission on Dams Wh Watt hours of energy WSSD World Summit on Sustainable Development

iv
Energy Conversions, CO2 Emissions and Measurements
The following conventions are used in all volumes of the PIREP country reports unless otherwise noted.
Kg CO2 equivalent e Fuel Unit
TypicalDensitykg / litre
Typical Density l / tonne
Gross EnergyMJ / kg
Gross Energy
MJ / litre
Oil Equiv.: toe / unit
(net) per GJ per litre
Biomass Fuels: Fuelwood (5% mcwb) tonne 18.0 0.42 94.0 Coconut residues (air dry) a Shell (15% mcwb) harvested tonne 14.6 0.34 Husk (30% mcwb harvested tonne 12.0 0.28 Average (air dry) b tonne 14.0 0.33 Coconut palm (air dry) tonne 11.5 0.27 Charcoal tonne 30.0 0.70 Bagasse tonne 9.6 96.8 Vegetable & Mineral Fuels: Crude oil tonne 42.6 1.00 Coconut oil tonne 0.920 1,100 38.4 0.90 LPG tonne 0.510 1,960 49.6 25.5 1.17 59.4 1.6 Ethanol tonne 27.0 0.63 Gasoline (super) tonne 0.730 1,370 46.5 34.0 1.09 73.9 2.5 Gasoline (unleaded) tonne 0.735 1,360 46.5 34.2 1.09 73.9 2.5 Aviation gasoline (Avgas) tonne 0.695 1,440 47.5 33.0 1.12 69.5 2.3 Lighting Kerosene tonne 0.790 1,270 46.4 36.6 1.09 77.4 2.8 Aviation turbine fuel (jet fuel) tonne 0.795 1,260 46.4 36.9 1.09 70.4 2.6 Automotive diesel (ADO) tonne 0.840 1,190 46.0 38.6 1.08 70.4 2.7 High sulphur fuel oil (IFO) tonne 0.980 1,020 42.9 42.0 1.01 81.5 3.4 Low sulphur fuel oil (IFO) tonne 0.900 1,110 44.5 40.1 1.04 81.5 3.4 Electricity Hydro c MWh 0.25 Fuelwood d MWh 0.93
Diesel Conversion Efficiency: Actual efficiencies are used where known. Otherwise: litres / kWh: Efficiency: Average efficiency for small diesel engine (< 100kW output) 0.46 22% Average efficiency of large modern diesel engine(> 1000 kW output) 0.284 36% Average efficiency of low speed, base load diesel (Pacific region) 0.30 - 0.33 28% - 32% Area: 1.0 km2 = 100 hectares = 0.386 mile2 1.0 acre = 0.41 hectares Volume 1 US gallon = 0.833 Imperial (UK) gallons = 3.785 litres 1.0 Imperial gallon = 4.546 litres Mass: 1.0 long tons = 1.016 tonnes Energy: 1 kWh = 3.6 MJ = 860 kcal = 3,412 Btu = 0.86 kgoe (kg of oil equivalent) 1 toe = 11.83 MWh = 42.6 GJ = 10 million kcal = 39.68 million Btu 1 MJ = 238.8 kcal = 947.8 Btu = 0.024 kgoe = 0.28 kWh GHGs 1 Gg (one gigagramme) = 1000 million grammes (109 grammes) = one million kg = 1,000 tonnes CO2 equiv CH4 has 21 times the GHG warming potential of the same amount of CO2; N2O 310 times
Notes: a) Average yield of 2.93 air dry tonnes residues per tonne of copra produced (Average NCV 14.0 MJ/kg) b) Proportion: kernel 33%, shell 23%, husk 44% (by dry weight). c) Assumes conversion efficiency of 30% (i.e., equivalent of diesel at 30%). d) Assumes conversion efficiency of 9% (biomass - fuelled boiler). e) Point source emissions Sources:
1) Petroleum values from Australian Institute of Petroleum (undated) except bagasse from AGO below 2) CO2 emissions from AGO Factors and Methods Workbook version 3 (Australian Greenhouse Office; March 2003) 3) Diesel conversion efficiencies are mission estimates. ` 4) CO2 greenhouse equivalent for CH4 and N2O from CO2 Calculator (Natural Resources Canada,

v
EX ECUT IVE SUMMARY
1. Country Context Physical Description. Samoa, northeast of Fiji, has 2934 km2 of land area, mostly in the islands of Savai’i (58% of land) and Upolu (38%). The climate is warm, humid and tropical with distinct wet and dry seasons. The annual rainfall is 2.88 metres, with considerable variation by location. Mean annual temperatures vary from a low of 20°C to a high of 30°C with limited seasonal variation. Sunshine averages 2500 hours annually. Severe cyclones can cause considerable damage, a potentially serious issue for biomass energy development. Population. In 2001 Samoa had a population of 176848 with national average growth of 0.56% per year, and urban growth of 1.5% per year since 1991. In 2001, 22% of the population resided in the Apia urban area, 30% in northwest Upolu, 24% elsewhere in Upolu, and most of the remaining 24% in Savai’i. There is a high rate of migration to New Zealand, Australia and the United States and considerable internal migration into Apia and northwest Upolu from the rest of the country. Environmental Commitments and Issues. Samoa is party to a number of international and regional treaties and conventions, including several with energy implications, particularly the United Nations Framework Convention on Climate Change (UNFCCC) and the Kyoto Protocol. Environmental issues related to energy use include air pollution from incineration of rubbish and cooking in outside kitchens. About 70% of Samoa’s population and infrastructure are located in the environmentally vulnerable coastal zone. Only four of the coastline is resilient to coastal hazards. Political Development. New Zealand administered Samoa under a United Nations mandate, and later as a UN Trust Territory, until January 1962 when it became the first Pacific nation to re-establish independence in the 20th century. There is a parliamentary democracy under a Head of State. All citizens aged 21 years and over are eligible to elect members of a 49 member unicameral parliament (the Fono, for which only chiefs (matai) may stand for election, who in turn elect the Prime Minister. National elections were last held in March 2001 and the next election will be no later than March 2006. There has been a continuity of leadership unusual in the region and consistency in energy policies since the 1980s, particularly petroleum issues. Economic Overview. In 2003, an International Monetary Fund study concluded that the Samoan economy has been transformed into ‘one of the best-managed in the Pacific islands’ … with ‘perhaps the most successful example of reform in the region. … Since the [reform] strategy was launched [in 1996], Samoa has achieved macroeconomic stabilization and enjoyed broad-based economic growth, resulting in improved social indicators. Large reductions in trade restrictions and financial liberalization have also enhanced the economy's competitiveness.” Although the economy is narrowly based and highly vulnerable to climate and weather-related and other external shocks, from 1995-2002, gross domestic product per capita grew 3.3% per year in real terms. The economy is heavily dependent on private remittances and investment through official transfers. The Asian Development Bank expects economic growth for 2004-2005 to be about 3-4% per year. The ADB notes that Samoa has made steady progress towards the Millennium Development Goals but efforts need to be strengthened to ensure better access to essential and quality education, health care services and safe water supply. Institutional and Legal Arrangements for Energy. The Energy Unit of the Ministry of Finance (MoF) is responsible for energy planning, policy and coordination, and energy project coordination. The MoF is also responsible for petroleum supply arrangements. The Minister of Works, Transport and Infrastructure oversees the state-owned Electric Power Company (EPC). The Ministry of Natural Resources and Environment is responsible for environmental aspects of energy use including greenhouse gas (GHG) emissions and climate change matters. Various studies since the 1990s provide a good overview of energy issues in Samoa: i) the 1992 World Bank/UN/Forum/ADB Pacific Regional Energy Assessment reviewed the national energy sector overall; ii) Greenpeace’s 1995 Towards Energy Independence in Western Samoa studied energy efficiency in electric power and transport; iii) the ADB’s 1999 Samoa Energy Sector Overview emphasised electric power and general energy issues; and iv) the government’s 1999 Overview of the Energy Sector in Samoa emphasised petroleum supply issues. All of the reports noted the need for

vi
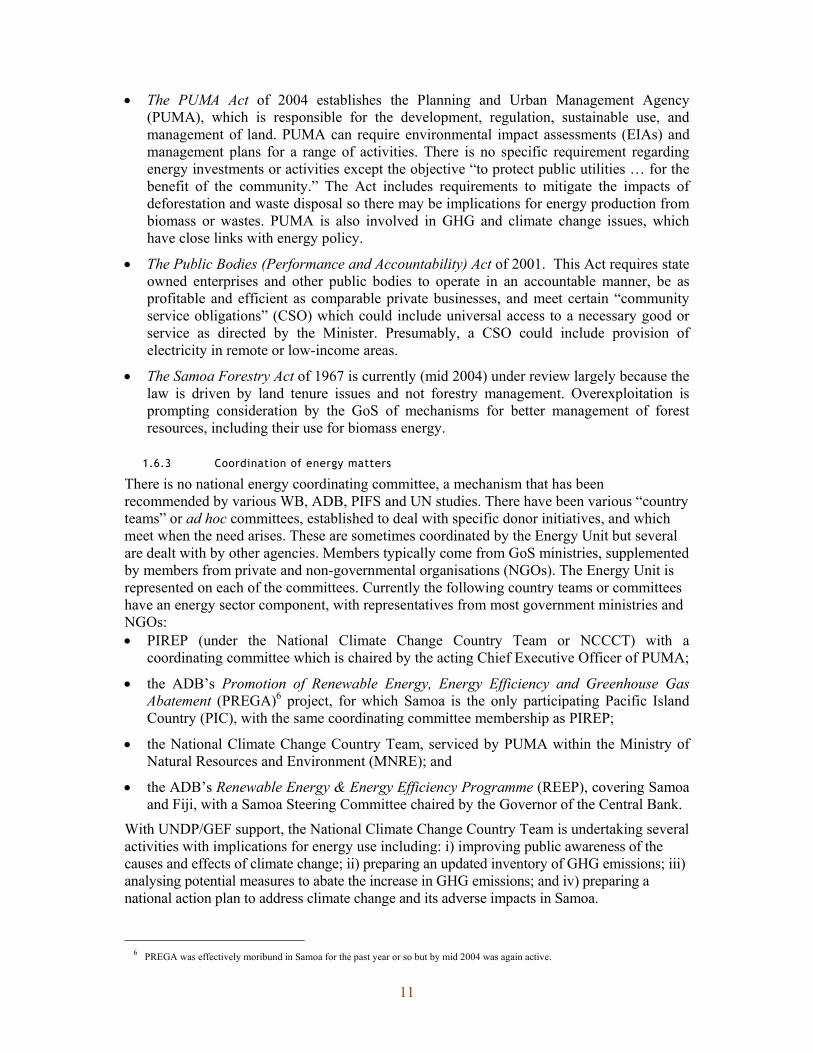
better energy management and policies due to growing dependence on imported petroleum. They also considered an improved institutional structure, improved energy efficiency and better petroleum fuel prices to be more important, or more practical, than an emphasis on renewable energy. Subsequently, the government has developed a comprehensive Samoa National Energy Policy that has not (at the time of writing) been endorsed by cabinet as formal policy. Regarding power sector policy, the ADB noted in 1999 a policy vacuum within EPC, which is being addressed through the wider national reform process. With petroleum, Samoa has had a consistent and successful policy for the past twenty years: to assure access to, and ownership of petroleum storage to provide maximum bargaining strength when negotiating petroleum supply arrangements. There is no national energy coordinating committee, but there are a number of country teams or ad hoc committees dealing with specific donor initiatives regarding energy or climate change. Several Acts deal directly or indirectly with energy issues: i) the Price Control Act with procedures for controlling prices of petroleum fuels and other commodities; ii) the EPC Act governing activities of the electric power utility; iii) the Foreign Investment Act which reserves some businesses for Samoans; iv) the Petroleum Act regarding supply, transport and storage of petroleum and tendering for its supply; v) the PUMA Act on the development, regulation, sustainable use, and management of land, requiring environmental impact assessments and management plans for a range of activities; vi) the Public Bodies (Performance and Accountability) Act which requires state owned enterprises to meet community service obligations, including universal access to a necessary good or service; and vii) the Samoa Forestry Act regarding management of forest resources.
2. Energy Supply, Demand and the GHG Inventory Energy Supply and Demand. About half of Upolu’s electricity is from hydro, other commercial energy needs met primarily from petroleum fuels. Cooking with biomass probably accounts for half of gross energy demand but there are no reliable or recent data to confirm this. There has been limited use in Samoa of solar photovoltaics (PV) on a very small scale. From 1989-1998, petroleum imports grew 7.3% annually, since dropping to 6%. After the government constructed new oil storage facilities, Mobil won a tender to become the sole supplier resulting in savings of about 18% compared to earlier arrangements. Shell began supply under a new contract in late 2003. Recent wholesale prices of gasoline and distillate in Apia, excluding taxes and duties, are more than 25% lower than the PIC average. In 2001, 93% of Samoa’s households were electrified and most of those un-electrified live relatively close to distribution lines. In 2002 EPC had 20,455 customers of whom 85% were domestic (households) accounting for 104 kWh per month on average and 30% of all sales. EPC has eight small hydroelectric plants (950–2000 kW, mostly run-of-river) at five locations on Upolu totalling 11.5 MW of effective capacity and about 18 MW of diesel. Dry season hydro capacity is 4.2 MW. Overall, the derated dry season capacity of all systems is about 22 MW of which 81% is diesel and 19% hydro. The peak Upolu load in 2002 was 15.8 MW. The Savai’i peak was 2.85 MW with 4.5 MW of (derated) capacity. A 2003 Japan International Cooperation Agency (JICA) study estimates that generation will grow in the next few years at 6.5% per year. The EPC tariff has not changed in five years and there is an increasing gap between real costs and revenue. There is limited data on household energy use. In 2001, 62% of households reported fuel wood as the main cooking fuel, ranging from 24% in Apia to 85% in Savai’i. Kerosene, liquid petroleum gas, electricity and charcoal were the main cooking energy sources for 14%, 12%, 11% and 1% respectively. 93% of households use electricity for lighting, the rest benzine or kerosene. For 2003 an estimate has been made of commercial energy end-use by sector. Distillate was used for electricity generation (36%), heavy machinery (25%), fishing (15%) and ground transport (24%). Petrol use was for transport (80%) and fishing (20%). Kerosene (including jet fuel) was for transport (90%) and household cooking and lighting (ten percent.). About two thirds of LPG use was by households and one third for commerce. Overall, about 45% of the 73 tonnes of oil equivalent consumed was for transport, 30% for electricity production, 16% for commerce and industry and 2% for households.

vii
Future Commercial Energy Demand and GHG Reductions. The government estimates that Samoa emitted 102.8 gigagrammes (Gg) of CO2-equivalent greenhouse gases (GHGs) in 1994, which is consistent with Greenpeace estimates of 97 Gg in 1993. By 2003, emissions reached 187 Gg, an average annual growth rate of 7% since 1994, equivalent to a doubling time of ten years. Assuming that population continues to grow less than 1% per annum, and the economy grows at 3-4%, then fuel use and GHGs are likely to increase about 6.3% per year, with emissions of 345 Gg by 2013. This is a ‘business-as-usual’ estimate, assuming no significant new investment in renewable energy or energy efficiency. In principle, by 2013 Samoa could reduce emissions through renewable energy investments by 81 Gg, equivalent to 43% of 2003 emissions and 23% of projected 2013 emissions. This is based on proven technologies and more-or-less known resources but does not consider economic, financial, political, social, technical, environmental or other practical constraints.
3. Potential for Renewable Energy Technologies Geothermal Energy. There may be potential for 4-5 MW of geothermal power plant in Savai’i, but this is based on very limited study. Hydroelectricity. About 12 MW of hydroelectric capacity have been developed on Upolu. Several studies of Savai’i’s potential suggest potential sites with capacities of 1.5-5.0 MW. In 2003 JICA noted the lack of systematic water gauging but is confident of potential in the Sili River basin of Savai’i for about 23.6 GWh per year. The ADB has approved a loan for hydro development at the site but this has not been finalised. In Upolu, JICA assessed four sites in 2003. Excluding existing hydro and an augmentation scheme under construction, these could provide an average of about 30 GWh, so existing hydro, and practical potential, could meet about one third of EPC’s projected 2015 demand. Ocean Based Energy Technologies. There is very little knowledge of Samoa’s ocean based energy potential, whether ocean temperature gradients, tidal or wave. In the early 1990s Norwegians mapped the wave resource through data buoys moored off Upolu and other islands. In the open sea, annual mean wave power levels were 20-25 kW/m but only 16 kW/m on the coast, which is of more practical significance. Estimates based on satellite measurements suggest the northern shores average 8-9 kW/m. Wind Energy. There has been little assessment of Samoa’s wind energy potential. A Forum Secretariat project to assess the potential in five Pacific Island Countries (PICs) in the mid-1990s excluded Samoa. There may be a sufficient resource on Upolu for electricity generation, but this is uncertain. Solar Energy. Most parts of Samoa probably receive a daily average of over 5.0 kWh/m² with relatively small seasonal variation, sufficient for water heating and household electricity generation. Biomass Energy. Estimates of Samoa’s total forest cover, mainly humid tropical rainforests with 75% on Savai’i, range from about 35% to 45% but data collection has been poor. Recent work suggests that the lower estimates are more accurate. Most commercial forest has been cleared for timber or agriculture or damaged by cyclones, with over 80% of forest non-commercial. There are four saw milling companies, all in Savai’i. Logging has declined from a recent peak of 16,000 m3 to 9000 m3 in 2003. As a rule of thumb, for 9000 m3 logs cut, 4500 m3 are extracted producing about 2500 m3 of waste. In 2001 it was estimated that extraction would be total in two to five years at current logging rates. Commercial logging will thus soon cease due to overexploitation but new plantation resources will not be ready for harvesting as sawlogs for a decade, limiting the practical potential of energy from woody biomass waste. There are about 22,000 hectares of land under coconut, many trees damaged by hurricanes but most within their economic bearing age. Coconut oil or its esters can be used as a ‘biofuel’ to substitute for distillate. In the late 1990s, Samoa exported sufficient copra (4800 tonne) and coconut oil 3900 tonnes) to produce the equivalent in energy terms of nine million litres of distillate, (assuming that it would be attractive to produce oil for fuel rather than copra or oil for export). Actual production could be substantially higher with improved use of the available coconut resource.
4. Experience with Renewable Energy Technologies in Samoa Geothermal. No boreholes have been drilled to assess the geothermal resource and no serious surface studies have been undertaken. There is no experience with geothermal energy in Samoa.

viii
Hydro. The only hydroelectric power generation in Samoa has been on Upolu with six run-of-river systems ranging from 950-1750 kW plus 4 MW with water storage at Afulilo. Actual peak output is 11.5 MW, dropping to 4.2 MW in the dry season. In 2002, hydro produced 43 GWh. Ocean Energy. There has been no experience with ocean energy in Samoa. Wind. There were apparently small-scale wind energy trials in Samoa in the 1980s but the PIREP team found no information. Solar. Large hotels in Samoa have solar water heaters but there is little demand for home use, where traditionally bathing is in cool water. In 1986, EPC electrified Safotu (Savai’i) with PV through a USAID grant. There were 30 household systems, each with three 13 watt fluorescent lights. Families paid WS$200 for installation and were to pay WS$10 weekly for the service. For various reasons (lack of EPC support, lack of spare parts, insufficient training, low payments), the systems failed and the community is now grid-connected. Biomass. Fuelwood remains the dominant, although declining, source of household energy use for cooking. Nearly twenty years ago, Samoa used biomass for copra drying (about 38 kilotonnes of coconut residue), producing steam for coconut oil production (11 kT), electricity production (1 kT) and steam production for timber drying (11 kT) at Asau, and soap and coconut cream manufacture (0.5 kT). Biomass is no longer used for power generation and biomass for agricultural drying is believed to be small. EPC experimented with coconut oil as a diesel fuel in the 1980s, and is working with UNDP to study the feasibility of large-scale use now. In the 1980s, ethanol was studied for blending with petrol but nothing eventuated. A few biogas plants were built, also in the 1980s, using piggery waste. Recently there have been trials of waste management and biogas production at Tafai’gata landfill on Upolu. Although methane will initially be flared, it may eventually be used if trials are successful.
5. Barriers to the Implementation of Renewable Energy Technologies Fiscal. Fiscal policy does not appear to be a major barrier to renewable energy or energy efficiency but minor issues include: i) exemptions on duties and taxes for distillate used by EPC for electricity generation; ii) cross-subsidies of fuel prices through a national price for distillate, petrol and kerosene; and iii) cross subsidies for EPC electrification from Upolu to Savai’i (which has considerably higher supply costs). Financial. EPC has been financially precarious for some time, partly because the tariff does not cover actual costs, a barrier to good planning and maintenance in general. Funding for the Energy Unit has been minimal. Legislative, Regulatory and Policy. Barriers include: i) the lack of appropriate legislation, approved energy strategies and policies, guidelines and regulations, as well as mechanisms to implement those policies, etc. which do exist; ii) the apparent lack of explicit criteria by which EPC performance can be measured; and iii) possible community service obligations of EPC under the PUMA Act. Institutional. Issues include: i) structure, responsibilities and budget of the Energy Unit, which is appropriately within the MoF but consists of only one person; ii) lack of a coordination mechanism within government for energy matters; and iii) questionable data management within EPC. Technical. The key technical barriers seem to be poor knowledge of energy resources and how to exploit them: i) limited measurement, database development or analysis of Samoa’s hydro potential and little monitoring of the wind, solar and geothermal resource; ii) seasonal variability of water flows restricting hydro development; iii) limited knowledge of gasification technologies suitable for Samoa; and iv) limited knowledge of Samoa’s biofuel potential other than coconut oil. Market. The local market is too small for: i) local manufacture of most renewable energy technologies (RETs); and ii) possibly effective local product support and after market maintenance. Knowledge and Public Awareness. Senior staff are more aware of energy issues than their counterparts in many PICs but issues include: i) low level of public awareness regarding renewable energy; and ii) the lack of training available within Samoa on renewable energy issues.

ix
Environmental and Social. Barriers identified include: i) long-term secure access to customary land for renewable energy development; ii) unwillingness of landowners to pay for hydroelectricity developed on their land; iii) reportedly lack of cooperation among parties interested in renewable energy development; and iv) coastal zone vulnerability and poor land management practices.
6. Capacity Development Needs for the Reduction of Barriers Fiscal. There is a need in a number of PICs for capacity-building efforts regarding the effect of fiscal policies on renewable energy. Although this may not be serious in Samoa, there is a need to understand the effect on large scale RETs of: i) hidden cross-subsidies in fuel and electricity charges and costs; and ii) the practicality of special green interest rates for the establishment of energy services, both improved efficiency of energy and renewable energy. Financial. EPC’s financial capacity development needs are being addressed by ADB. An independent assessment of the MOF’s Energy Unit structure and financial needs would be useful. Legislative, Regulatory and Policy. Funding agencies often expect a clear policy / legislative / regulatory framework before approving new energy assistance, or as part of that assistance. Samoa needs assistance to develop: i) capacity to further develop its energy policy with clear priorities, timeframes, and indicators of success; ii) a clear policy for electrification of unelectrified households; and iii) guidelines for EPC’s objectives, including energy efficiency and renewable energy. Institutional. In addition to needs raised above the government: i) might consider a permanent energy coordinating committee with the Energy Unit as Secretariat (although not strictly a capacity development issue, the lack is an institutional barrier); and ii) should seek assistance for EPC to develop its data management and analysis skills. Technical. A key barrier is human resource limitations, undermining efforts to assimilate and effectively use information from past studies than technical barriers per se. Nonetheless, there are technical issues regarding the suitability of technologies for Samoa. Samoa’s capacity to assess these could be enhanced through: i) better knowledge of renewable energy resources; ii) knowledge of practicality of local vegetable oils as fuels on the scale of about 0.5-5 ML per year; and iii) access to technical reports on technologies of immediate relevance. Market. The market for small-scale RETs is small due to the size of the country and nearly universal electrification. Nonetheless, it would be useful to assess the demand for solar water heating and ways to create and serve a market for locally built systems. Knowledge and Public Awareness. There have been no PIC studies on the effectiveness of awareness campaigns on energy efficiency or renewable energy but studies elsewhere suggest that impacts of broad-based campaigns are limited and temporary. Well-focused information for businesses and the public on opportunities for renewable energy and energy efficiency is however, useful for capacity development. Environmental and Social. Access to land with secure arrangements for the long term is a serious barrier to RETs. Samoa should investigate, and enhance its capacity to address, options involving landowners as active partners in the development of EPC hydro projects. Hardware investments. Hydro offers immediate opportunities for substantially reducing GHG emissions, followed by biofuels and geothermal. The team endorses environmentally appropriate small hydro for Upolu and Savai’i. It also supports the current assessment of coconut oil for large-scale power generation. Beyond this, it is inappropriate to make firm suggestions based on several short visits and a superficial study of Samoa’s energy sector issues.
7. Environmental Implications of Large Scale Use of Renewable Energy The biggest energy and GHG impacts are likely to be from hydro, biofuels, and possibly geothermal, any of which could have negative environmental impacts if poorly planned. Small Hydro. The government has documented negative environmental impacts of the Afulilo augmentation project. Proposed new hydro development in Samoa are all run-of-river. A number of international organisations involved in hydro development agree that run-of-river hydro less than 10 MW in scale can be environmentally and socially low-impact if planned, built and operated in line with the recommendations of the World Commission on Dams.

x
Geothermal. If carefully planned and implemented, geothermal power plants can meet stringent clean air standards, emitting well under 1% of the GHGs of fossil-fuel power plants, no nitrogen oxides, and very low amounts of sulphur dioxide. The potentially negative impact of drilling wells can be minimised through slant drilling and drilling several wells from one pad. Biodiesel. The impact of biofuels should be no more severe than current agricultural practices. Biofuels are very low in emissions and biodegrade readily. Biogas. An environmental impact assessment of the trial biogas project concluded that it is unlikely to create any significant negative impacts that cannot be mitigated.
8. Capacity Development Implementation and Co-financing Opportunities ADB’s Renewable Energy and Energy Efficiency Programme could provide co-financing opportunities linked to PIREP for both energy efficiency and renewable energy. The following tasks are proposed to be included in national or regional co-financing arrangements. • Energy pricing. Guidelines for evaluation of large scale RETs in which the financial component
takes into consideration hidden cross-subsidies in fuel and electricity charges due to a national electricity tariff and national fuel prices.
• Green interest rates. Assessment of the need for, and practicality of, special interest rates for locally-owned businesses for the establishment of energy services.
• Resource Assessment. Assessment of Samoa’s renewable energy resources, in particular wind, geothermal and OTEC. Capacity building efforts are needed to develop skills for assessment of these resources.
• EPC Capacity Development. EPC staff should be identified for specialist training in RE development for grid power.
• Energy Unit Capacity Development. The size and capacity of the Energy Unit needs to increase to deal with standards, certification, policy and renewable energy finance.
• Public Information Programmes. Funds are required to provide focused energy information for businesses and the public on opportunities for renewable energy and energy efficiency development.
• Clean Development Mechanism. The Clean Development Mechanism could possibly be tapped for GHG emission credits for Samoan renewable energy projects, possibly bundled with projects from other Pacific Island Countries.
xi
TABLE OF CONTENTS
EXECUTIVE SUMMARY .................................................................................................V
1 COUNTRY CONTEXT ............................................................................................1 1.1 PHYSICAL DESCRIPTION ...................................................................................1 1.2 POPULATION..............................................................................................2 1.3 ENVIRONMENTAL COMMITMENTS AND ISSUES ...............................................................2 1.4 POLITICAL DEVELOPMENT .................................................................................4 1.5 ECONOMIC OVERVIEW .....................................................................................4 1.6 INSTITUTIONAL AND LEGAL ARRANGEMENTS FOR ENERGY...................................................7
2 ENERGY SUPPLY, DEMAND AND THE GHG INVENTORY ....................................................... 12 2.1 ENERGY SUPPLY AND DEMAND........................................................................... 12 2.2 FUTURE COMMERCIAL ENERGY DEMAND AND GHG REDUCTIONS.......................................... 19
3 POTENTIAL FOR RENEWABLE ENERGY TECHNOLOGIES ........................................................ 22 3.1 THE POTENTIAL FOR GEOTHERMAL ENERGY.............................................................. 22 3.2 THE POTENTIAL FOR HYDROELECTRIC POWER............................................................ 23 3.3 THE POTENTIAL FOR OCEAN BASED ENERGY TECHNOLOGIES ............................................. 24 3.4 THE POTENTIAL FOR WIND ENERGY ..................................................................... 25 3.5 THE POTENTIAL FOR SOLAR ENERGY..................................................................... 25 3.6 THE POTENTIAL FOR BIOMASS ENERGY .................................................................. 26
4 EXPERIENCE WITH RENEWABLE ENERGY TECHNOLOGIES IN SAMOA............................................ 29 4.1 EXPERIENCE WITH GEOTHERMAL ENERGY ................................................................ 29 4.2 EXPERIENCE WITH HYDROPOWER ........................................................................ 29 4.3 EXPERIENCE WITH OCEAN ENERGY....................................................................... 30 4.4 EXPERIENCE WITH WIND ENERGY ........................................................................ 30 4.5 EXPERIENCE WITH SOLAR ENERGY ....................................................................... 30 4.6 EXPERIENCE WITH BIOMASS ENERGY ..................................................................... 31
5 BARRIERS TO THE IMPLEMENTATION OF RENEWABLE ENERGY TECHNOLOGIES................................. 34 5.1 FISCAL BARRIERS........................................................................................ 34 5.2 FINANCIAL BARRIERS .................................................................................... 34 5.3 LEGISLATIVE, REGULATORY AND POLICY BARRIERS....................................................... 35 5.4 INSTITUTIONAL BARRIERS................................................................................ 35 5.5 TECHNICAL BARRIERS ................................................................................... 36 5.6 MARKET BARRIERS ...................................................................................... 36 5.7 KNOWLEDGE AND PUBLIC AWARENESS BARRIERS ......................................................... 36
xii
5.8 ENVIRONMENTAL AND SOCIAL BARRIERS.................................................................. 36
6 CAPACITY DEVELOPMENT NEEDS FOR THE REDUCTION OF BARRIERS.......................................... 38 6.1 FISCAL BARRIERS........................................................................................ 38 6.2 FINANCIAL BARRIERS .................................................................................... 38 6.3 LEGISLATIVE, REGULATORY AND POLICY BARRIERS....................................................... 38 6.4 INSTITUTIONAL BARRIERS................................................................................ 39 6.5 TECHNICAL BARRIERS ................................................................................... 39 6.6 MARKET BARRIERS ...................................................................................... 40 6.7 KNOWLEDGE AND PUBLIC AWARENESS BARRIERS ......................................................... 40 6.8 ENVIRONMENTAL AND SOCIAL BARRIERS.................................................................. 40 6.9 HARDWARE INVESTMENTS................................................................................ 40
7 ENVIRONMENTAL IMPLICATIONS OF LARGE SCALE USE OF RENEWABLE ENERGY............................... 41 7.1 ENVIRONMENTAL ISSUES AND SMALL HYDRO.............................................................. 41 7.2 ENVIRONMENTAL ISSUES AND GEOTHERMAL .............................................................. 41 7.3 ENVIRONMENTAL ISSUES AND BIODIESEL.................................................................. 42 7.4 ENVIRONMENTAL ISSUES AND BIOGAS ENERGY AT THE TAFAI’GATA LANDFILL SITE......................... 42
8 CAPACITY DEVELOPMENT IMPLEMENTATION AND CO-FINANCING OPPORTUNITIES ............................. 43
9 ANNEXES ..................................................................................................... 45 ANNEX 1 – PERSONS SEEN ........................................................................................ 45 ANNEX 2 - REFERENCES .......................................................................................... 47 ANNEX 3 – EPC GENERATION UNITS (EPC 2003) ................................................................ 50 ANNEX 4 – 1998 AND 2008 ADB ENERGY BALANCE ESTIMATES FOR SAMOA....................................... 51

xiii
Map of Samoa and its location in the Pacific
Source: Source: www.lib.utexas.edu/maps

1
1 COUNTRY CONTEXT
1.1 Physical Description
The Independent State of Samoa (see map above) lies northeast of Fiji extending between 13°15’ and 14°5’ South Latitude and 171°23’ and 172°48’ West Longitude. Samoa has 2,934 square kilometres (km2) of land area, primarily the two main islands of Savai’i and Upolu plus a number of smaller islands: Apolima, Manono, Fanuatapu, Namu’a, Nu’utele, Nu’usafe’e, Nu’ulua and Nu’ulopa. There is an exclusive economic zone of 120,000 km2. Samoa’s climate is warm, humid and tropical with distinct wet and dry seasons, from November through April and May through October respectively. The annual rainfall averages 2.88 metres, ranging from 2.5m in the west of both islands, and in north/northeast of Savai’i, to about 6m in the uplands. During the wet season, rainfall varies from about 1.5m in the drier parts of the islands to 4m in the uplands; during the dry season it varies from 0.75m to about 2m. About 75% of precipitation occurs during the wet season. The mean annual temperatures vary from a low of 20°C to a high of 30°C with only limited seasonal variation. Samoa’s warmest months are February through March, and the coolest are July and August. The all-time maximum was 35ºC recorded at Faleolo, the minimum of 11.1ºC recorded at Afiamalu. Prevailing south-easterly trade winds cause slightly higher temperatures in the north-west parts of the islands (Source: Government of Samoa [GoS], 1990). According to the GoS website, humidity averages 80% and there is an average of 2,500 hours of sunshine annually. Severe cyclones in recent years have caused considerable damage, including decimation of coconut plantations, a potentially serious issue for biomass energy. summarises the geologic formations and soils of Samoa. The Fagaloa Volcanics occur in north-eastern and south-western parts of Upolu and in north-eastern parts of Savai’i. The areas are deeply dissected with boulders and stones occurring chiefly on steep and very steep slopes and on the bases of the slopes. Salani Volcanics occur throughout both islands chiefly on upper foothills and uplands. Mulifanua, Lefaga and Puapua Volcanics form the parent materials of the greater part of Upolu and Savai’i. Aopo Volcanics are restricted to relatively recent flows and their youthfulness is expressed in flattish, stony and bouldery surfaces. Vini Volcanics occur on the offshore islands, east of Upolu and in southern Savai’i. Colluvium occurs on the lower parts of hilly and steep land particularly on Upolu. The materials include many stones and boulders, which move down slope. Alluvium deposited by the main rivers is not extensive in Samoa, but forms the parent material of the most versatile soils.
Table 1-1 - Geological Formations and Relationship to Landscape and Soils Geological formation
Dissection of landscape
Average soil depth
Soil surface
Soil texture
Fagaloa Volcanics Strong > 100 cm Boulders Clay, silty clay
Salani Volcanics Moderate 50-100 cm Stones & boulders Clay, silty clay Mulifanua and Lefaga Volcanics Slight 15-50 cm Boulders & stones Clay, silty clay, silty
clay loam Puapua volcanics Very slight 15-50 cm Boulders, stones
& rocks Silty clay loam, silt
loam, silty clay
Aopo Volcanics Very slight 0-25 cm Rock, boulders & stones
Sandy gravels, silt loam
Vini Tuffs Moderate > 100cm Few stones Clay, silty clay loam Source: Land Resource Planning Study Western Samoa (GoS, 1990)

2
Coral sand stripes along the coastline lie in front of swamps and depressions in which organic deposits overlie coral or basaltic sands. Locally they are intersected by estuarine deposits under tidal influence. Shallow upland peats occur in a few small areas in Upolu and in central-eastern Savai’i.
1.2 Population
Although Savai’i has 58% of Samoa’s land area (Table 1-2), it has only 24% of the population, compared to 38% of land and 76% of population for Upolu. At the time of the last national census in 2001 (Table 1-3), Samoa had 23,079 households and a population of 176,848 with an annual average growth rate (AAGR) of only 0.56% since the 1991 census. Urbanisation grew at nearly 1.5% per annum. Most Samoans live in 330 villages, of which 52% have between 100 and 499 inhabitants, typically 13-66 households per village. In 2001, 22% of the population resided in the Apia urban area (Samoa’s only urban centre), 30% in northwest Upolu (the airport vicinity), 24% in the rest of Upolu, and nearly all of the remaining 24% in Savai’i. The number of households grew by 4% over the ten-year intercensal period and the average household size in 2001 was 7.7 persons compared with 7.3 persons ten years earlier. Table 1-3 shows Samoa’s population from 1911 through 2001, the declines in 1917 and 1921 being due to influenza. Over the ninety-year period, the AAGR has been 1.7%. This has dropped to 0.6% from 1981 to 2001, due largely to emigration to New Zealand, Australia and the United States. There has been considerable internal migration into Apia and northwest Upolu from the rest of the country. Upolu increased from 70% to 76% of population between 1991 and 2001. Samoa has a young population, half being 19 years old or younger. Future population growth will depend substantially on the extent of continued access to New Zealand and other countries. Although there are no official projections of future population growth, the AAGR is likely to remain well under 1%, with continued high migration rates.1
1.3 Environmental Commitments and Issues
Samoa is a party to a large number of international and regional treaties and conventions including the United Nations Framework Convention on Climate Change (UNFCCC,
1 An estimated 100,000 Samoans officially live in New Zealand. Under existing treaty arrangements, a quota of 1,100 are able to emigrate to New Zealand annually. There is also considerable unofficial migration allowed to reunite families. This results in: i) slow growth of the population in Samoa; ii) a population of expatriate Samoans growing rapidly at around 6% per annum; and iii) the remittance base of expatriate Samoans continues to expand, thus sustaining the flows of remittances (ADB, 2002a).
Table 1-2 - Island Areas, Types, Population & Power Supply
Island Area (km2) Island type Population
2001 Electricity supply
Savai’i 1,708 Raised Volcano (several extinct)
42,824 0.49%
Diesel-generated, grid connected
Upolu 1,123 Raised volcanic (several extinct)
134,024 1.5%
Diesel & hydro, grid connected.
Manono 2.89 Raised, terraced coral islands n/a Connected to Upolu
via marine cable Apolima 1.01 Raised Volcanic n/a Diesel mini-grid All others 0.2-1.08 Raised volcanic None None Source: GoS, 1990 & 2001
Table 1-3 -Population of Samoa, 1911 - 2001 Census Year Samoan Total AAGR
(%) 1911 33,554 38,084 0.51 1917 35,404 37,331 - 0.33 1921 32,601 36,422 -0.61 1926 36,688 40,231 2.09 1936 52,232 55,946 3.91 1945 62,422 68,197 2.43 1951 80,153 84,909 4.08 1956 91,883 97,327 2.93 1961 113,101 114,427 3.51 1966 130,110 131,377 2.96 1971 144,111 146,627 2.31 1976 150,089 151,983 0.73 1981 153,920 156,349 0.57 1986 156,000 157,408 0.14 1991 158,212 161,298 0.49 2001 n/a 176,848 0.56 Source: census reports

3
(ratified 29th December 1994) and the Kyoto Protocol. Its first national communication to the UNFCCC was submitted in 1999 and the second national communication, which will include a more detailed greenhouse gas (GHG) inventory, will commence during 2004. Other agreements to which Samoa is a party include the Convention on Biological Diversity (ratified June 1994), Convention for the Protection of the Ozone Layer, Montreal Protocol on Substances that Deplete the Ozone Layer, UN Convention on the Law of the Sea, the Cartagena Protocol on Biosafety, the Convention on the Conservation and Management of Highly Migratory Fish Stocks in the Western and Central Pacific Ocean, the Stockholm Convention on Persistent Organic Pollutants, the Basel Convention on the Control of Transboundary Movements of Hazardous Wastes and their Disposal, the International Convention for the Protection of Pollution from Ships and its Protocol, the Convention on the Conservation of Nature in the South Pacific, the Convention for the Protection of the Natural Resources and Environment of the South Pacific Region and the Convention to Ban the importation into Forum Island Countries of Hazardous and Radioactive Wastes and to Control the Transboundary Movement and Management of Hazardous Wastes within the South Pacific Region, the Waigani Convention. Table 1-4 summarises the status and date of signing of some key environmental conventions.
Table 1-4 - Status of Ratification of Environmental Treaties and Conventions by Samoa
Status in Samoa
Protection of natural resources (SPREP
Convention)
Conservation of nature
(Apia Convention)
Hazardous wastes
(Waigani Convention)
Nuclear free Pacific
(Rarotonga Treaty)
GHG reductions
(Kyoto Protocol)
Ozone depleting substances
(Montreal Protocol, et al.)
Signed Ratified Entered into force
25 Nov 86 23 Jul 90 22 Aug 90
- 20 Jul 90 26 Jun 90
16 Sep 95 23 May 01 21 Oct 01
06 Aug 85 20 Oct 86 11 Dec 86
16 Mar 98 15 Nov 00
n/a *
– 21 Dec 92 17 June 93
Notes: Treaties & conventions are briefly described in Volume 1, the PIREP Regional Overview report. * The Kyoto Protocol is in force from 15 February 2004 for European Union members only. Sources: Websites for conventions, Pacific Island Forum Secretariat & SPREP (Jan-March 2004).
1.3.1 Environmental issues
Environmental issues related to energy use in Samoa include air pollution. According to the GoS (2002), “ambient air quality has become a major concern particularly in the Apia urban and industrial areas. The emission of smoke from daily incineration of rubbish and cooking in outside kitchens is a normal experience in Samoa particularly in the rural areas. Manufacturing establishments also emit contaminants from incomplete combustion of carbon-based fuels. With the lack of any legislative controls for these emissions, any increase in the number of these sources would mean more contaminants in the air. … In the Apia urban area alone, a number of industries such as bakeries, food processing factories, timber treatment plants, diesel fuelled power plants, and landfills are contributing to the presence of soot, sulphur dioxides, oxides of nitrogen, hydrocarbons, carbon monoxide and lead etc. ...” A Vulnerability and Adaptation Study (BECA/GoS, 2001) completed with UNFCCC support indicated that about 70% of Samoa’s population and infrastructure are located in the environmentally vulnerable coastal zone. Mapping of areas vulnerable to natural hazards under a World Bank (WB) funded project indicated that 65% of all sites assessed for sensitivity to coastal hazards were highly vulnerable, 20% medium and 11% very highly sensitive. Only 4% of the coastline is resilient to coastal hazards. The GoS (2002) concludes that integrated land use planning, including energy infrastructure, should be a priority.

4
1.4 Political Development
New Zealand occupied the German protectorate of Western Samoa at the outbreak of World War I in 1914. It administered the islands, initially as a United Nations (UN) mandate and later as a UN Trust Territory, until 1 January 1962 when Western Samoa became the first Pacific nation to re-establish independence in the 20th century. Independence is celebrated on 1 June. Samoa dropped “Western” from its name in 1997. Samoa has a parliamentary democracy under a Head of State, Malietoa Tanumafili II. The Head of Government since 1999 has been Prime Minister (PM), the Hon. Malielegaoi Tuilaepa Sailele. All citizens aged 21 years and over are eligible to elect members of the unicameral parliament (referred to as the Fono or Legislative Assembly), who in turn elect the PM. The Fono has 49 members, 47 being representatives of 41 territorial constituencies and two representing individual voters. Only chiefs or Matai may stand for election to the Fono, within which members serve five-year terms. The Head of State appoints Cabinet Ministers on the PM’s advice, and Cabinet appoints Chief Executive Officers, the civil servants who administer the various ministries. National elections were last held on 3 March 2001 and the next election is to be held no later than March 2006. The current PM was the Minister of Finance for the previous four consecutive terms (Table 1-5). This has allowed a continuity of leadership unusual in the region and a consistency in energy policies since the 1980s (particularly petroleum issues, which are discussed in chapter 2). As Minister of Finance, the PM initially developed and implemented a Statement of Economic Strategy (SES) under which the GoS restructured its economic policies after 1995 adopting a more outward looking, market driven economy. The Finance Minister also has the main responsibility for energy policy matters through the Finance ministry’s Energy Unit.
1.5 Economic Overview
In a recent review of selected economic and financial issues, the International Monetary Fund (IMF, 2003) summarises the recent successes of the Samoan economy and reform process:
In 1996, Samoa launched a wide-ranging economic reform program that has transformed its economy into one of the best-managed in the Pacific islands. The Samoan Statement of Economic Strategy (SES) provides perhaps the most successful example of reform in the region, with the SES providing the overall macroeconomic framework for the development of separate strategies focusing on health, education, and rural development. Several major reforms of the civil service, financial sector, and tax and tariff systems have already been implemented. Since the strategy was launched, Samoa has achieved macroeconomic stabilization and enjoyed broad-based economic growth, resulting in improved social indicators. Large reductions in trade restrictions and financial liberalization have also enhanced the economy's competitiveness. The challenge going forward is for Samoa to build on this success by implementing the "second-generation" reforms (i.e a second round of reforms) needed to support private sector-led growth. These reforms should focus in particular on further enhancing public sector efficiency (especially in state-owned enterprises), improving the quality of infrastructure, and increasing the availability of land for commercial development.
Table 1-6 provides a range of recent economic indicators.
Table 1-5 - Samoan Political Leadership Since 1989 Year Prime Minister Minister of Finance 2000 - present
Hon. Malielegaoi Tuilaepa Sailele Hon. Misa Telefoni
1999 - 2000
Hon. Malielegaoi Tuilaepa Sailele
Hon. Malielegaoi Tuilaepa Sailele
1995 - 1999
Hon. Tofilau Eti Alesana
Hon. Malielegaoi Tuilaepa Sailele
1992 - 1995
Hon. Tofilau Eti Alesana
Hon. Malielegaoi Tuilaepa Sailele
1989 - 1992
Hon. Tofilau Eti Alesana
Hon. Malielegaoi Tuilaepa Sailele

5
Table 1-6 - Selected Economic Indicators, 1995–2002 (million tala, except where noted) 1995 1996 1997 1998 1999 2000 2001 2002 Real GDP (market prices) 685.2 744.2 738.0 755.6 772.5 819.4 874.7 885.3 Real GDP/capita (tala; 2002 prices) 4,153 4,499 4,427 4,498 4,560 4,800 4,950 4,965 Nominal GDP (current prices) 496.1 556.1 625.9 659.4 691.5 761.3 834.0 885.3 Annual Average Inflation Rate (%) 1 5.4 6.8 2.2 0.3 1 3.8 8.1 Total Exports 13.9 24.8 26.4 40.3 48.7 45.1 52.6 46.3 Total Imports 228 243.7 256.2 285.7 348.5 348.7 448.8 454.2 Balance of Payments: Trade Balance -214.1 -218.9 -229.8 -215.9 -299.8 -303.1 -396.2 -407.9 Current Account Balance -49.4 -27.4 -32.7 -37.3 -64.1 -19.6 -95.5 -65.3 Capital Account Balance 49.7 41.1 48.6 46.9 58.1 23.1 84.4 66.3 Overall Balance 0.3 13.7 15.9 9.6 -6.0 3.5 -11.1 0.9 Trade Balance as % of GDP -43.2 -39.4 -36.7 -32.7 -43.4 -39.9 -47.5 -46.1 Overall Balance as % of GDP 0.06 2.5 2.5 1.5 -0.9 0.5 -1.3 0.1 Exchange Rates: value of WS$1.00 USD (US $) 0.3957 0.4108 0.3615 0.3322 0.3313 0.2993 0.2816 0.3109 AUD (Australian $) 0.5312 0.5166 0.5536 0.5429 0.5051 0.5355 0.5501 0.5524 Gross Tourism Revenues 86.6 96 98.3 115.2 125.8 134 139.6 152.6 Tourist Arrivals (thousands) 67.9 72.9 68 77.9 85.1 87.7 88.3 88.9 Remittances from abroad 87.2 90.5 107.5 109.9 125.2 149.3 147.9 188.1 Remittances as % GDP 17.6 16.3 17.2 16.7 18.1 19.6 17.7 21.2 Net Foreign Assets 114.4 131.1 158 182.8 182.8 186 174.8 175.8 Import Cover (months) 5.9 6.2 7.2 7.2 6.3 5.3 4.1 4.7 Money Supply 168.7 180.4 204.6 215.4 249.2 289.9 307.6 336 Domestic Credit 62.5 66.4 65.5 62.6 108.1 154.1 186.7 219 Government (net) -41.5 -56.4 -77.4 -106.2 -100.1 -97.6 -96.7 -94.3 Private Sector 100.4 118.7 139.4 165.5 194.6 233 266.6 294.7 Total External Debt 439.1 412.3 428.4 472.4 446.7 483 503.2 n/a Official Government Debt 385.1 372.1 393.3 443 443.6 480.1 503.2 481.2 Official GoS Debt,% of GDP 77.6 66.9 62.8 67.2 64.2 63.1 60.3 54.4
–- Dec.1999 –- –- Dec. 2000 –- –- Dec. 2001 –- –- Dec. 2002 –- Petroleum Fuel Prices (WS sene) Retail FOB Retail FOB Retail FOB Retail FOB Petrol 122.2 25.8 152.6 32.5 123.2 21.6 142.6 28.9 Kerosene 114.9 26.7 165.5 41.4 132.8 24.9 132.2 30.8 Diesel 120.2 24.1 165 36.6 120.8 24.8 146.1 31.3 Government Financial Statistics 1997/98
Actual 1998/99
Actual 1999/00
Actual 2000/01
Actual 2001/02
Actual 2002/03
Actual Jul-Dec 02 Prov
2003/04 Budget
Total Revenue & Grant 234.4 267.9 251 262.5 290.8 303.5 150.4 318.4 Total Expenditure 221.6 265.8 256.2 280.8 308.6 309.1 146.9 332.4 Current Expenditure 142.1 163.9 169.7 163.7 183.3 202.2 89.1 208.0 Current Balance 31.9 19.8 24.7 33.6 15.4 27.2 22.3 43.3 Overall Balance 12.9 2.2 -5.2 -18.3 -17.8 -5.5 -3.5 -14.1 Overall Balance as % of GDP 2 0.3 -0.7 -2.3 -2.1 -0.6 -0.8 -1.5 Current Expend. as % of GDP 21.9 24.4 23.2 19.9 21.2 21.9 19.4 21.4 Total Expend. as % of GDP 34.1 39.7 35.6 34.9 36.0 33.8 32 34.2 Population (thousands) 164.5 165.4 166.7 168.0 169.4 170.7 176.7 178.3 Sources: Ministry of Finance & Central Bank of Samoa Some data revised by national PIREP committee Sept. 2004
Between 1995 and 2002, Gross Domestic Product (GDP) per capita has increased at 3.3% per year in real 1994 terms to WS$ 3,875, about US$ 1,200. The Samoan economy is narrowly based and highly vulnerable to climate and weather-related and other external shocks. Exports amounted to only $14.3 million in 2001/02 (roughly 6% of GDP) and are heavily based on fish products that account for roughly two-thirds of total exports. The remainder of exports are primarily made up of coconut and taro based products. An automobile parts plant, which is the dedicated supplier wiring harnesses for an automobile factory in Australia, is Samoa's only major manufacturing plant. The economy is heavily dependent on private remittances to finance personal consumption while investment needs are met primarily through official transfers. Private transfers from nationals living abroad, together with tourist receipts, are equivalent to about 75% of total imports.

6
A recent Asian Development Bank report (ADB, 2004) characterises the Samoan economy as the best managed among the thirteen Pacific Developing Member Countries (PDMCs). Real GDP growth was 2.8% in 2002 and estimated at 5.0% in 2003,2 led by the services sector, particularly commerce, public administration, and transport and communications. Some manufacturing activities also grew strongly as the strengthening of the world economy stimulated manufacturing of automotive wiring harnesses. Tourist arrivals picked up from 2002 levels. Remittances were up substantially, constituting nearly 20% of GDP and providing a major stimulus to the economy. The outlook for 2004-2005 is approximately 3-4% annual growth (Figure 1-1). This will be driven by construction projects in the public sector, which will peak in 2005-2006 during construction for the 2007 South Pacific Games. As shown in Table 1-7, the GoS is signatory to the three Pacific regional trade and economic trade agreements, the most important of which are the Pacific Islands Trade Agreement (PICTA) and the Pacific Agreement on Closer Economic Relations (PACER; between PICTA signatories and Australia and New Zealand). The GoS has also signed the Cotonou Agreement, providing membership in the African, Caribbean and Pacific (ACP) group of countries, and thus access to development assistance from the European Union.
1.5.1 Millennium Development Goals
In September 2000, 147 countries adopted the Millennium Development Goals (MDGs), a set of targets with quantifiable indicators, now widely used to assess development progress. The ADB (2003b) has reported on the progress of its PDMCs toward meeting the MDGs. For Samoa, the ADB concluded:
Samoa has made good and steady progress towards the MDGs. It has already achieved certain targets such as universal primary education and has made significant improvements in secondary enrolment rates. It has the highest secondary enrolment ratios among PDMCs. Gender disparity in education and literacy rates has been eliminated. Child and maternal mortality rates have decreased and are among the lowest in the PDMCs. Nevertheless, there is no reason for complacency. Efforts need to be strengthened and further attention directed to ensuring that all parts of the population have access to essential and quality education, health care services and safe water supply. … There is no extreme poverty of hunger in Samoa. However, pockets of hardship exist in various areas and need to be addressed.
1.5.2 Financial system
Samoa's financial system is highly concentrated, consisting of three commercial banks and two large public non-commercial financial institutions. Three commercial banks – ANZ Bank
2 The GoS (2004a) calculated a slightly lower real growth of GDP in 2003, 3.5%. In current prices, GDP was WS$ 897.7 million or WS$ 4,990 per capita.
Figure 1-1 – Growth in Real GDP, 1997 - 2004
Source: Asian Development Outlook (ADB, 2004)
Table 1-7 - Samoa and Regional Economic Treaties Status SPARTECA PACER PICTA
Signed Ratified Entered into force
14 July 1980 24 Feb 1981 26 Mar 1981
18 Aug 2001 10 Oct 2001 03 Oct 2002
18 Aug 2001 10 Oct 2001 13 April 2003
Source: Note from Pacific Islands Forum Secretariat (PIFS, January 2004)

7
Samoa (ANZ), Westpac, and the National Bank of Samoa (NBS) – together account for roughly 40% of financial system assets and 55% of domestic credit (Table 1-1). ANZ and Westpac are foreign-owned, while the NBS is owned by domestic investors. A fourth bank, the Commercial Bank of Samoa, started operating in June 2003. The two largest non commercial financial institutions, the National Provident Fund (NPF) and the Development Bank of Samoa (DBS), play a significant role in the financial sector in terms of both asset size and loans outstanding. At the end of 2002, the commercial banks had net foreign assets totalling WS$ 4.7 million, total assets of WS$ 26.2 m and liabilities of WS$ 21.5 million. Interest rates from 1997-2002 are summarised in Table 1-9. No loans are known to have been made for energy service companies or renewable energy systems and there are no special “green” interest rates available.
1.5.3 Investment
The ADB refers to “seemingly sluggish private investment” in recent years and notes that the GoS has announced its intention to facilitate commercial agriculture and tourism development by reforming management of communal land, which accounts for 98% of the coastal areas. This policy could involve government leasing of communal land for subleasing to investors.
1.6 Institutional and Legal Arrangements for Energy
1.6.1 Institutional arrangements
Under recent reforms within the GoS’s Institutional Strengthening Programme, 28 separate GoS departments have been replaced with 14 ministries. The Energy Unit of the Ministry of Finance (MOF) is responsible for overall energy sector planning, energy policy and its coordination, and project coordination. The Ministry of Finance (MoF), working through the Tenders Board and cooperating closely with the Prime Minister’s office, is also responsible for petroleum supply arrangements.
Table 1-8 - Structure of Samoa’s Financial System, 2002
Institution Assets Domestic credit
Commercial banks 44.0 61.7 NBFIs 41.2 49.1 National Provident Fund 25.3 30.3 Development Bank of Samoa 7.3 12.6 Others 8.6 6.2 Monetary Authorities 14.9 -10.8 Total 100% 100% Source: IMF, 2003; Note: NBFI = non-bank financial institutions
Table 1-9 - Samoa Interest Rates (percent; end of period)
Institution 1997 -98
1998 -99
1999 -00
2000 -01
2001 -02
Commercial banks: Time deposit (24m) Lending rate *
7.5 12.9
7.5 12.6
7.5 12.3
7.3 11.7
7.3 11.5
Other lending rates: Provident Fund Public Trust Life Assur. Corp
12-14 12-15 10-14
12-14 12-15 10-14
12-14 12-15 10-14
12-14 12-15 12-15
12-14 12-15 12-15
Source: IMF, 2003; * to public enterprise, business & individuals

8
The Minister of Works, Transport and Infrastructure includes among its responsibilities the Electric Power Corporation (EPC), which provides grid- electrification through grids throughout the country. The Ministry of Natural Resources and Environment (MNRE) is responsible for environmental aspects of energy use including greenhouse gas (GHG) emissions and climate change more generally. Table 1-10 indicates the main GoS energy sector responsibilities. • Energy Unit. In May 2004, the Energy Unit consisted of a single professional officer,
with a part-time assistant and occasional support from others within the MoF (although this was then under review). Considering responsibilities, which include processing fuel price increases and overseeing donor-supported energy projects, the Energy Unit appears to be seriously understaffed.
• Petroleum product supply. Since 1998, Samoa has had fuel supply arrangements under which a tenderer is given exclusive rights to import petroleum fuels (excluding liquid petroleum gas or LPG) for a specified period. In 1998, Mobil Oil won the tender and provided fuel until the contract ended in 2003. Shell Petroleum Products Supplies won the current tender and began supply in October 2003. Samoa is able to tender for exclusive supply as it owns all oil storage facilities in the country, an action that has improved its bargaining position with international suppliers. Two companies, Origin and British Oxygen Company (BOC), supply LPG.
• Petroleum Pricing. The MOF sets and monitors wholesale and retail prices of key fuels (petrol, kerosene, and diesel fuel) every month based on international fuel prices according to pricing formula agreed during the bidding process. For some years, an external consultant has assisted the GoS to monitor fuel prices. A maximum price is also set by the GoS for LPG although the MOF apparently is not directly involved in this.3
• Electricity. The EPC is responsible for the supply of electricity throughout Samoa. It is operated commercially but wholly owned by the GoS with policies determined by a board of directors chaired by the Minister of Works. The eight members are appointed by Cabinet.
There are, of course, other offices within the GoS with energy responsibilities: The Attorney General’s office has responsibility for drafting and/or reviewing and presenting new energy or regulatory related legislation; the transport section of MWTI is responsible for regulating the transport sector; and the Customs Department has responsibility for recording and taxing fuel imports. Under the reform process, projects which would in the past have been implemented by MWTI or other GoS departments or ministries, are now carried out by the private sector. MWTI manages contracts but is no longer involved in construction or maintenance. This policy will affect future energy projects: the Energy Unit may coordinate or manage but neither it nor MWTI will be directly involved in implementation.
3 The Ministry of Commerce, Industry and Labour (MCIL) formally administers price control but effectively, prices of petrol, distillate and kerosene are determined by the MOF.
Table 1-10 - Energy Responsibilities in Samoa (April 2004) Ministry of Finance
Energy Unit
Ministry staff & Tenders Board
Electric Power Corporation
Ministry of Natural Resources & Environment
Energy policy, planning, data, coordination & projects. Processing fuel price templates
Petroleum Supply Fuel price Control
Electricity supply
Environmental impact assessments Envir. standards GHGs & carbon credits Piloting RE (e.g. biogas)
Source: GoS

9
1.6.2 Policies and Laws Regarding Energy
Energy policy development
There have been several studies of energy sector issues in Samoa since the early 1990s that, overall, provide a good overview of energy sector policy issues: • Samoa: Issues and Options in the Energy Sector (Volume 13 of the ‘Pacific Regional
Energy Assessment (PREA); prepared jointly by the WB with UNDP/ESCAP’s Pacific Energy Development Programme plus ADB and the Pacific islands Forum Secretariat, PIFS), which reviewed the energy sector overall (WB, et. al., 1992);
• Towards Energy Independence in Western Samoa: An Integrated Energy Study, which looked primarily at opportunities for energy efficiency improvements for electric power and transport (Greenpeace, 1995);
• Samoa Energy Sector Overview and Policy Recommendations: Final Report, which emphasised the electric power sector and general energy issues (ADB, 1999); and
• Overview of the Energy Sector in Samoa (Economic and Energy Analysis of Australia for GoS), which emphasised petroleum supply issues (GoS, 1999a).
Although these reports differ in their coverage and approaches, all emphasise the need for high quality energy management and improved policies due to the continued, and growing, dependence of Samoa on imported petroleum fuels. Improved energy efficiency and access to petroleum fuels on reasonable terms are considered by these studies as more important, or more practical, than an emphasis on renewable energy. Following these reports and their recommendations, and internal efforts, the Energy Unit of the MoF has put considerable effort into developing a comprehensive Samoa National Energy Policy (SNEP, GoS, draft 2003), which has gone through several drafts in the past year. The SNEP builds on an earlier draft National Energy Policy Statement prepared with the assistance of the Forum Secretariat (PIFS, 1996) and a more recent Pacific Islands Energy Policy and Plan (PIEPP) developed in 2001 by the Council of Regional Organisations (CROP) Energy Working Group (CROP EWG, 2001). Development of the SNEP has involved considerable local consultation and an external review in late 2003 with the assistance of UNDP, Apia (Johnston, 2003). The document covers petroleum supply, electric power, transport, renewable energy, energy for remote areas, energy efficiency and conservation, dissemination of information, environmental aspects of energy use, and development of human and institutional capacity. For each of these topics, key issues are identified, summary policies discussed, and strategies developed. Although the SNEP was considered by the Cabinet Development Committee, it had not been formally endorsed by the Minister or Cabinet by May 2004 when this report was being prepared. Funds have not been sought or allocated to implement the policy, and there is no clear sense of priorities or a timeframe for action. The ADB study (1999) argued that, “the priority now is not so much to articulate fresh policy, but to formalise it, consolidate procedures, and above all to assign responsibilities for carrying it out. Perhaps the main conclusion of the present study is that continued senior-level input, broadened to include stakeholders across the government, is required to carry forward the progress that has been made.” This view is essentially endorsed within the assessment report submitted by Samoa to the World Summit on Sustainable Development (WSSD; GoS, 2002) which argues for “the development of an energy policy supported by an improved institutional structure [within Treasury], with strengthened involvement of other departments that are necessary for its effective implementation.”

10
Regarding power sector policy, according to the ADB (1999) “the EPC operates without a clear Board-directed statement of corporate objectives or corporate intent. The resulting policy vacuum undermines performance, since: 1) no explicit performance criteria are available to guide management or the Board; and 2) government emphasis on ‘accountability’ is of little real significance if there are no objective criteria by which to measure the performance of the utility.” This apparently remains the case. ADB (1997, 1999) has strongly recommended the development of an EPC Statement of Corporate Intent, containing an expression of objectives and a set of measurable indicators. 4 Within the petroleum sector, Samoa has had a consistent policy approach for the past twenty years: to assure access to, and eventually ownership of, petroleum storage in order to provide maximum bargaining strength when negotiating petroleum supply arrangements. A draft National Climate Change Policy (NCCP, GoS, undated) has vague statements supporting RE but, at least in the form seen by the PIREP team, no energy policy statements, priorities or action plans. A draft forestry sector plan contains provision for biomass supply and conservation measures (e.g. provisions for growing coconuts and reforestation through community tree planning scheme), which could be relevant for biomass energy development. It has not been finalised and, like the SNEP, its status at the time of writing is uncertain. Legislation relevant to the energy sector. There are several Acts of the Legislative Assembly of Samoa that deal directly or indirectly with energy issues.5 These are: • The Price Control Act establishes the procedures under which the maximum prices of
certain commodities, including wholesale and retail prices of petroleum fuels, are controlled. This is formally administered by the Ministry of Commerce, Industry and Labour.
• The EPC Act of 1972, revised in 1980 with subsequent amendments, established the electric power utility. It does not give EPC exclusive rights for the generation of electricity but EPC issues permits required to generate electricity. EPC owns the grid and can refuse the use of the grid by outside generators. The legislation does not establish any financial performance targets or other measurable indicators of performance.
• The Foreign Investment Act (under the Ministry of Commerce, Industry and Labour) reserves several businesses exclusively for Samoans: public transport, vehicle hire, retailing of food, groceries, household goods (other than electrical appliances) and sawmilling, the last possibly an indirect barrier to biomass energy development. All other types of businesses are open to foreign investors, although there are certain conditions. It is understood that amendments to the Act are pending and will ease access to communal land for investors.
• The Petroleum Act of 1984 makes provision for the supply, transport and storage of petroleum. It gives the Financial Secretary (now the MOF Chief Executive Officer) the power to award tenders and determine levies for petroleum fuels. The MOF is responsible for oil storage licensing, inspection, monitoring and safety regulation but, as far as the PIREP team is aware, there is no legislation regarding petroleum fuel standards or oil storage and transportation standards, legislation which various studies have recommended over the past twenty years.
4 EPC (comments on draft PIREP report) notes that EPC complies with the reforms that had been adopted by the GoS in the recent past when EPC moved from traditional to output budgeting. Corporate plans were a pre-requisite for this and EPC now has a Corporate plan detailing its objectives, activities to achieve these objectives and performance measures for measuring the performance of everybody: the Board of Directors, Management and staff. 5 It is understood that the GoS may also be considering legislation for more effective regulation of all state-owned enterprises, including a framework specific to public utilities such as the EPC.
11
• The PUMA Act of 2004 establishes the Planning and Urban Management Agency (PUMA), which is responsible for the development, regulation, sustainable use, and management of land. PUMA can require environmental impact assessments (EIAs) and management plans for a range of activities. There is no specific requirement regarding energy investments or activities except the objective “to protect public utilities … for the benefit of the community.” The Act includes requirements to mitigate the impacts of deforestation and waste disposal so there may be implications for energy production from biomass or wastes. PUMA is also involved in GHG and climate change issues, which have close links with energy policy.
• The Public Bodies (Performance and Accountability) Act of 2001. This Act requires state owned enterprises and other public bodies to operate in an accountable manner, be as profitable and efficient as comparable private businesses, and meet certain “community service obligations” (CSO) which could include universal access to a necessary good or service as directed by the Minister. Presumably, a CSO could include provision of electricity in remote or low-income areas.
• The Samoa Forestry Act of 1967 is currently (mid 2004) under review largely because the law is driven by land tenure issues and not forestry management. Overexploitation is prompting consideration by the GoS of mechanisms for better management of forest resources, including their use for biomass energy.
1.6.3 Coordination of energy matters
There is no national energy coordinating committee, a mechanism that has been recommended by various WB, ADB, PIFS and UN studies. There have been various “country teams” or ad hoc committees, established to deal with specific donor initiatives, and which meet when the need arises. These are sometimes coordinated by the Energy Unit but several are dealt with by other agencies. Members typically come from GoS ministries, supplemented by members from private and non-governmental organisations (NGOs). The Energy Unit is represented on each of the committees. Currently the following country teams or committees have an energy sector component, with representatives from most government ministries and NGOs: • PIREP (under the National Climate Change Country Team or NCCCT) with a
coordinating committee which is chaired by the acting Chief Executive Officer of PUMA;
• the ADB’s Promotion of Renewable Energy, Energy Efficiency and Greenhouse Gas Abatement (PREGA)6 project, for which Samoa is the only participating Pacific Island Country (PIC), with the same coordinating committee membership as PIREP;
• the National Climate Change Country Team, serviced by PUMA within the Ministry of Natural Resources and Environment (MNRE); and
• the ADB’s Renewable Energy & Energy Efficiency Programme (REEP), covering Samoa and Fiji, with a Samoa Steering Committee chaired by the Governor of the Central Bank.
With UNDP/GEF support, the National Climate Change Country Team is undertaking several activities with implications for energy use including: i) improving public awareness of the causes and effects of climate change; ii) preparing an updated inventory of GHG emissions; iii) analysing potential measures to abate the increase in GHG emissions; and iv) preparing a national action plan to address climate change and its adverse impacts in Samoa.
6 PREGA was effectively moribund in Samoa for the past year or so but by mid 2004 was again active.

12
2 ENERGY SUPPLY, DEMAND AND THE GHG INVENTO RY
2.1 Energy Supply and Demand
Samoa is overwhelmingly dependent on imported petroleum fuels for its modern commercial energy needs. Roughly half of Upolu’s electricity generation is from hydro but other energy needs are met mainly from petroleum fuels. As in most PICs, a considerable amount of cooking is done using woody biomass fuels. Estimates suggest that these could constitute as much as half of Samoa’s total gross energy demand but there are no recent data based on large-scale household energy use measurements or surveys. Biomass energy use for the past twenty years has been based on estimates of unknown accuracy and reliability. There has been limited experience with solar photovoltaics (PV) on a very small scale.
2.1.1 Petroleum supply
From 1989 through 1998, Samoa’s petroleum fuel imports grew at an AAGR of 7.3% (GoS, 1999a), with growth in both imports and sales dropping to about 6% per year since then (Figure 2-1; Table 2–1). During the 1990s, fuel was supplied by both Mobil (which dominated the diesel, petrol and domestic kerosene markets) and British Petroleum (BP, which supplied jet fuel7 and some ground products). Both companies supplied the two main islands and owned storage facilities on Upolu and Savai’i. For some years, Samoa had considered building and owning oil storage facilities to improve Samoa’s negotiating position when tendering, or issuing Requests for Proposals (RFP), for product supply. In 1996, Samoa negotiated concessional loans totalling US$3.27 million from the OPEC (Organisation of Petroleum Exporting Countries) Fund for constructing new GoS-owned storage facilities at the site of an existing Mobil terminal in Apia, at Faleolo International Airport, and at Asau in Savai’i. The Savai’i facility replaced old BP storage which was not of an acceptable standard. Following an RFP, which went to four oil companies, Mobil became the sole supplier and terminal operator for five years. In late 1999, the government calculated cumulative savings of 18% compared to the earlier supply arrangements (GoS, 1999a).
7 Jet fuel, or Jet A1, is high quality kerosene. Duel purpose kerosene (DPK) can be used both as jet fuel and for domestic use. Petrol is also referred to as gasoline, motor gasoline (mogas), Bensine and ULP for unleaded petrol.
Figure 2-1 – Imports & Sales of Petroleum Fuels Solid line = imports; dashed line = sales
0
20
40
60
80
100
1999 2000 2001 2002 2003
Sources: Sales from Shell; imports from Customs
Table 2-1 - Petroleum Product Sales, 1999-2003 (million litres)
Product 1999 2000 2001 2002 2003 Petrol ULP 26.30 26.35 26.14 25.77 27.25 Diesel ADO 25.47 28.75 33.70 37.65 36.04 Kerosene DPK 8.28 12.91 12.30 12.63 13.55 AvGas 0.68 0 0 0 0 LPG 0.9 1.1 1.35 1.46 1.58 Total 61.63 69.11 73.49 77.51 78.42 Source: Shell Oil, 2004; LPG from BOC & Origin, 2004 Notes: ULP = unleaded petrol; DPK = dual purpose kerosene; LPG converted at 1960 litres/tonne; 1999-2000 LPG approximate

13
In 2003, as the contract with Mobil was ending, the GoS issued another RFP for five years of petroleum fuel supply and terminal operations. This was won by Shell, which began supply in October 2003. Recent wholesale prices of gasoline (mogas) and distillate (ADO), excluding taxes and duties) are shown in Figure 2-2, provided by the PIFS. In late 2003, prices in Apia were more than 25% lower than the PIC average for gasoline and ADO. For kerosene (Figure 2-3), wholesale and retail prices (again, free of taxes and duties) are also below average for the region.
Figure 2-2 – PIC Wholesale Petroleum Fuel Prices (excluding import duties and taxes; Nov/Dec 2003)
Source: Pacific Fuel Price Monitor, Edition 7 (PIFS; 12 May 2004)
Figure 2-3 – Wholesale & Retail Kerosene Prices (excluding import duties & taxes; Nov/Dec 2003)
Source: as for Figure 2.2
2.1.2 LPG
Liquid petroleum gas (LPG) was marketed in Samoa from 1977 by Samoa Industrial Gas, a partly government-owned company. It was later renamed BOC, the parent company being British Oxygen Company, the GoS retaining 27% ownership until 2000. During the 1990s, BOC considered a joint venture with Boral Gas of Australia. This did not eventuate and Boral entered the market in 1997 as a competitor to BOC. Boral’s LPG business was renamed Origin Energy after a reorganisation. Today, LPG is imported by BOC and Origin. Although

14
volumes are small, they have more than doubled between 1997 and 2003, with an AAGR of more than 12%. BOC imports LPG from Australia, Origin from Australia, New Zealand or Fiji depending on price at the time. Following the introduction of competition, the retail price of a 20 lb (9 kg) canister of LPG fell from WS$43 to $32 in 1998, along with improved service for consumers. In early 2004, the retail price is WS$49, reportedly cheaper than the Australian price of US$25 (about WS$70). Samoa has not provided LPG prices to the PIFS so Samoa is not included in the LPG tables of the Pacific Fuel Price Monitor. Accordingly, comparisons with other PICs cannot be made. Both suppliers of LPG reportedly claim that the price control system is unfair and restricts expansion.
2.1.3 Electric power
The 2001 census indicated that 93% of Samoa’s 23,079 households were electrified. Most of the remaining 1,600 or so households live relatively close to distribution lines. Some have not connected mainly because of the high initial costs. Although the connection fee is only WS$10 for those close to a grid where a new transformer is not necessary, it is very costly for those who require a transformer or live several hundred metres from the grid. In 2002, EPC reported 20,455 customers8 of which over 85% were domestic (households) but they accounted for only 30% of sales. In 1999, the last year for which comparisons are readily available, of 22,557 customers, 17,216 (76%) were on Upolu, 5,211 (23%) on Savai’i and 130 (under 1%) on Manono. Table 2-2 shows EPC sales by customer category from 2001 through 2003. In 2002, domestic consumers used about 104 kWh per month.
Table 2-2 - EPC Sales in GWh, 2001-2003 Year Schools Religion Industrial Hotel Govt Domestic Commercial Total 2001 2.935 3.516 5.913 2.999 9.637 30.276 23.581 78.857 2002 2.650 5.352 5.852 3.088 9.759 21.859 32.980 81.540 2003 2.676 6.131 5.716 3.225 9.855 22.089 34.787 84.479 % of sales 2001-03 3.3 6.1 7.1 3.8 11.9 30.3 38.5 100 No. Customers (2002) 161 881 36 17 167 17,467 1,726 20.445 KWh / customer per month in 2002 1,904 506 13,546 15,137 4,870 104 1,592 – Source: JICA, 2003 and national consultant spreadsheets from EPC, 2004 GWh = million kWh
From 1994 through 2003, EPC generation has grown at an AAGR of 5.2% and sales by 6.6% (Table 2-3). The percentage provided by hydro varies depending on rainfall but there has been a downward trend (Figure 2-4) as demand for power has increased whereas hydro capacity has not.
8 These should be considered indicative only. EPC reported 25,913 customers in 2000, 20,455-20,483 in 2001 and 17,467 in 2002. Although the earlier years may include 2,000 or more ‘permanently disconnected customers’, there is no obvious reason the numbers should decline so much over several years. JICA (2003) and others have noted that EPC data tend to be inconsistent and unreliable.
Table 2-3 - EPC Generation and Sales in GWh ——— Generation ——— ——— Sales ——— Year Hydro Diesel Total Total Upolu Savai’i
1992 n/a n/a n/a 39.51 37.41 2.10 1993 n/a n/a n/a 44.91 42.44 2.47 1994 52.07 6.75 58.82 47.65 44.16 3.49 1995 49.98 13.46 63.43 52.56 49.12 3.44 1996 42.78 25.99 68.77 57.72 53.20 4.50 1997 53.91 19.84 73.75 64.29 58.99 5.26 1998 38.64 35.50 74.14 65.36 59.14 6.17 1999 43.98 30.21 74.19 67.68 60.84 6.80 2000 41.65 36.47 78.13 71.35 63.40 7.96 2001 34.76 50.39 85.15 78.68 70.10 8.59 2002 42.57 48.44 91.00 82.89 75.16 8.73 2003 45.87 47.20 93.07 84.48 n/a n/a Source: JICA, 2003 and national consultant from EPC, 2004 n/a = not available

15
The total installed nameplate generating capacity of the Upolu system is about 30.6 MW (See Annex C for details). This consists of eight small hydroelectric plants (950 – 2000 kW; mostly run-of-river) on Upolu totalling 12.2 MW at five locations, and 18.4 MW of diesel generators at Tanugamanono power station near Apia. Due to age and other mechanical limitations, the plants have been derated to 11.5 MW and 17.6 MW for the hydro and diesel plants respectively. For hydro, dry season capacity is further reduced to 4.2 MW. Derated dry season capacity is therefore 81% diesel and 19% hydro with a total capacity of 21.8 MW. The peak load in 2002 was 15.8 MW, about 73% of derated dry season capacity. The Savai’i peak load in 2002 was 2.85 MW and the installed derated capacity was 4.47 MW. Peak loads for 2003 were not available. There are also private diesel generators used for back-up or standby supply, primarily at major grocery wholesalers and other businesses dealing with large volumes of refrigerated goods.
2.1.4 EPC growth
A recent study by the Japan International Cooperation Agency (JICA, 2003) reviewed past forecasts of EPC’s future generation and considered likely economic growth. For 2001–2015, JICA recommends that EPC should assume generation growth of 6.5% per year, with a low estimate of 4% and a high of 8%. EPC itself forecasts 6% growth in maximum demand (MW) and energy (GWh).
2.1.5 EPC tariff
Electricity sales are exempt from the 12.5% Value Added Goods and Service Tax (VAGST) which is imposed on most goods and services in Samoa. The current tariff, unchanged in 5 years, is shown in Table 2-4. According to ADB (1999), “A 40% increase in the electricity tariff, from 43 sene/kWh to 60 sene/kWh, was approved in September 1998. The previous tariff had held since 1993. … Although the current-tala tariff level has risen infrequently in large jumps, the level in constant tala has remained below what it was in 1980, even after the large increase that was approved in 1998. Though an analysis of costs has not been carried out, the scale of EPC’s financial difficulties suggests that costs have risen significantly in constant-tala terms, and that the gap between real costs and real revenues has widened over the past ten years.”9 It is understood that EPC hopes to amend its tariff, adding an automatic fuel adjustment charge, in part because of the slow and tedious process of otherwise receiving approval for needed tariff increases. Figure 2-5 illustrates how tariffs have not kept pace with real costs.
9 EPC notes that it carried out the recommendations of the ADB study regarding losses in 2003 and improvements have been huge.
Figure 2-4 – Hydro Generation as % of Total GWh
0
20
40
60
80
100
1994
1995
1996
1997
1998
1999
2000
2001
2002
2003
Source: EPC
Table 2-4 - EPC Tariff in 2004
kWh/m WS$/kWh 1-50 0.50 51-200 0.60 > 200 0.72

16
Figure 2-5 – EPC Tariff History
0
10
20
30
40
50
60
70
1980 1981 1982 1983 1984 1985 1986 1987 1988 1989 1990 1991 1992 1993 1994 1995 1996 1997 1998
Nom
inal
Tar
iff L
evel
0
2
4
6
8
10
12
14
16
18
Infla
tion-
Adju
sted
Tar
iff L
evel
NominalReal
Source: ADB, 1999
2.1.6 Rural electrification
EPC is responsible for rural electrification throughout Samoa. The GoS provided WS$ 3.4 million to EPC for the July 2003-June 2004 period to meet its community service obligations (GoS, 2003a), which include some rural electrification costs, plus WS$1 million to compensate EPC for its VAGST payments on fuel. EPC apparently meets up to WS$1,000 per consumer, with the government proving the remainder. However, GoS funds used for installation materials and labour must be reimbursed.
2.1.7 Biomass energy
For 1989, the PREA estimated that biomass accounted for 63,090 tonnes of oil equivalent (toe) of gross energy production (and end-use consumption) in Samoa, about 59% of total energy supply. Of the total biomass consumed, fuel wood for household use accounted for 63%, copra production 21%, timber mill 7%, coconut oil mill 6%, and cocoa production 3%. There were some commercial sales of fuel wood around Apia, at a reported cost of WS$80/tonne. For 1998, the ADB (1999) estimated 65,930 toe of biomass energy consumption, equivalent to 48% of total energy supply, adjusting the earlier PREA estimate for population growth. In 2001 (Table 2.5), nearly 62% of Samoan households continue to use biomass as their main cooking fuel. It seems reasonable that biomass might account for roughly half of Samoa’s total energy supply but this is no more than a crude estimate.10
10 The GoS report to the WSSD (GoS, 2002) states that “The previously dominant traditional energy supply (the non-cash economy supply of woodfuel and coconut residues still used by households and agro-industries) now accounts for less than half of Samoa’s primary energy supply.”
Figure 2.6 – Fuelwood for Sale in Apia
Photo by Thomas Jensen, 2004

17
In 2004, there are limited commercial sales of fuel wood at Apia’s main market, at Fugalei, and at small markets along side the roads. Fuel wood costs WS$ 7-$8 a basket (about 12-20 kg) enough for one weekend earth oven (umu) or two to three typical weekday meals. Timber mills reportedly sell sawdust and cut-offs at WS$ 100-$200 per truck load.
2.1.8 Household energy use
Table 2-5 and Table 2-6 summarise patterns of household energy use derived from the 2001 population and household census. 62% of households reported in 2001 that they use fuel wood as their main cooking fuel, ranging from 24% in Apia to 85% in Savai’i. There is anecdotal evidence, and some survey evidence, that demand for fuel wood has declined in recent years.11 Kerosene, LPG, electricity and charcoal were the main energy sources for cooking in 2001 for 14%, 12%, 11% and 1% respectively of households.
Table 2-5 - Main Source of Energy for Household Cooking in 2001 Region Electricity Gas Kerosene Firewood Charcoal Total hh % of all hh Apia urban area 1,212 1,189 1,555 1,298 49 5,303 23% NW Upolu 667 959 1,121 4,174 48 6,969 30% Rest of Upolu 379 327 380 4,149 71 5,306 23% Savai’i 348 194 235 4,700 24 5,501 24% Total 2,606 2,669 3,291 14,321 192 23,079 100% % of hh using 11% 12% 14% 62% 1% 1% – Source: 2001 census report Note: hh = households
In 2001, 93% of households used electric lighting, ranging from 97% in the Apia area to 93% in Savai’i, 92% in northwest Upolu and 90% in the rest of Upolu. Essentially all other households used benzine or kerosene for lighting. As Table 2-7 shows, the percentage of households with television jumped dramatically from only 22% in 1991 to 63% in 2001.
11 About 74% of all households reportedly cooked with fuelwood in 1997. The source is the national consultant, apparently from a 1997 household and income expenditure survey (which would have had a much smaller sample size than the 2001 census). No records are kept of fuelwood sales but discussions with market vendors (national consultant, early 2004) also suggest that demand has diminished over time.
Table 2-6 - Main Source of Energy for Household Lighting in 2001
Region Electricity Benzine or kero Other Total %
Apia urban 5,126 154 23 5,303 23 NW Upolu 6,399 515 55 6,969 30 Rest of Upolu 4,802 478 26 5,306 23 Savai’i 5,120 359 22 5,501 24 Total 21,447 1,506 126 23,079 100 households using 93% 7% 1% 100% – Source: 2001 census report
Table 2-7 - Households with Appliances Using Electricity in 1991 and 2001
% with appliance Household
Assets 1991 2001 1991 2001
Refrigerator n/a 12,118 n/a 53 Television 4936 14,443 22 63
Radio 18643 20,434 84 89 Video 4480 9,804 20 42
Computer n/a 1,217 n/a 5 Internet n/a 696 n/a 3 Phone n/a 5,189 n/a 22
Total hh 22,195 23,079 Sources: census reports of 1991 & 2001

18
2.1.9 Transport energy use
Throughout the region, data on the number of vehicles on the road are unreliable. However, in Samoa records are kept of newly registered vehicles and those deleted from registration. Together that allows at least an estimate of the recent growth in vehicle use. From 1989-1998 transport fuel use grew at well over 7% per annum and accounted for the bulk of growth in petroleum use. It was projected (ADB, 1999; GoS, 1999a) that transport would increase from 34% of petroleum consumption in 1989 to 50% in 2008. Table 2-8 shows an AAGR in vehicle registrations from 1998-2002 of 8.8% suggesting that the estimated vehicle growth is reasonably accurate and that transport energy use has probably continued to increase at least as rapidly as during the 1989-1998 period.
2.1.10 Energy balance
Samoa’s 2003 commercial energy use (i.e. petroleum use and hydroelectricity) by sector is shown in Table 2-9, based on actual fuel sales and hydropower generation. The end uses for ADO were approximately 36% for electricity generation, 25% for heavy machinery, 15% for fishing, and 24% for ground transport. Petrol use was about 80% for transport and 20% for fishing. Kerosene (including jet fuel) was 90% aviation transport and 10% for household cooking and lighting. About 65% of LPG use was by households and 35% for commercial purposes.
Table 2-9 - Consumption of Commercial Energy in Samoa by Sector (ToE; 2003) Sales — Consumption by Sector in Thousand Tonnes of Oil Equivalent —
Source ML '000 tonnes Transport Electricity House-
holds Commercial & industry
‘000 TOE
GHGs (Gg)
Motor spirit 25.1 18.32 15.98 3.99 19.97 62.75 Jet fuel / DPK 12.4 9.76 9.58 1.06 0 10.64 32.24 Distillate 33.2 27.90 7.23 10.85 12.05 30.13 89.64 LPG 1.6 0.81 0.62 0.33 0.95 2.52 Fuel total 72.3 56.79 32.79 10.85 0.62 16.37 61.69 187.15 Hydro (GWh) 45.87 – 11.47 11.47 – Total 32.79 22.32 1.68 16.37 73.16 187.15 % of total ToE n/a 44.8 30.5 2.3 22.4 100.0 – Source: Estimates of petroleum fuel end use are from interviews by national consultant, Tala Tevita, in April 2004 with Peter Ripley, Operations Manager of Petroleum Products Supplies/Shell for petroleum fuels. For LPG, she interviewed Maurice Fisher (General Manager of BOC), and Nerony Lam Sam (Manager of Origin) in March 2004. Hydro data are from EPC. Notes: Tonnes, toe, hydro and GHG converted from data provided. Excludes losses and transformations n/a = not applicable
About 45% of the 2003 commercial energy consumption of 73 toe was used for transport, 30% for electricity production, 16% for commerce and industry and 2% for households. This is broadly consistent with the transport and household energy use patterns discussed previously.
Table 2-8 - Registered Vehicles 1998 - 2002 1998 1999 2000 2001 2002 Deletions: Private Cars 69 78 9 93 13 Vans 80 188 15 63 11 Pick Ups 108 111 291 17 30 Trucks 9 13 10 10 5 Heavy Equipment 10 18 9 21 5 Public Transport 42 20 320 604 174 Other 20 25 11 953 21 Total 338 453 665 1761 259 New Registrations: Private Cars 2010 2088 2097 2190 2203 Vans 895 1083 1098 1161 1172 Pick Ups 1771 1882 2173 2190 2220 Trucks 899 912 922 932 937 Heavy Equipment 76 94 103 124 129 Public Transport 712 732 1052 1656 1830 Other 1427 1452 1463 2416 2437 Total 7,790 8,243 8,908 10,669 10,928 Growth Rate 6% 8% 20% 2% Source: National consultant from Police Department records (March 2004)

19
2.2 Future Commercial Energy Demand and GHG Reductions
2.2.1 Greenhouse gases
Greenpeace (1995) estimated that GHG emissions from fuel used in transport and electricity production in Samoa were about 97 gigagrammes (Gg) of carbon dioxide (CO2) in 1993.12 Samoa’s first communication to the UNFCCC (GoS, 1999b) calculated 1994 GHG emissions from the energy sector, all from petroleum fuel combustion, as 102.2 Gg of CO2, 0.017 Gg of methane (CH4) and 0.001 Gg of nitrous oxide (N20), or total CO2-equivalent emissions of 102.8 Gg.13 This is broadly consistent with the Greenpeace estimates. The GoS estimate was based on imports during the year as provided by Customs records, not actual consumption during the year. The two can easily vary by 10% or more in a small country depending on dates of tanker offloading early or late in the year, and changes in stock levels from year to year. In Samoa from 1999-2003, however (Figure 2.1), the difference has not exceeded 3%. In 2003, based on the petroleum fuel sales data of Table 2-1, and CO2 equivalents, the CO2 equivalent GHG emissions in 2003 were about 187 Gg, suggesting an AAGR of 7% in emissions since 1994. In fact, Samoa’s petroleum fuel imports grew at an AAGR of 7.3% from 1989-1998 (GoS, 1999a), which suggests that the 2003 PIREP and 1994 GoS UNFCC GHG estimates have been estimated using consistent approaches.
2.2.2 Growth in energy demand
Samoa’s population is likely to continue growing slowly, well under 1% per annum (Section 0) with more rapid growth in Apia and northwest Upolu than elsewhere in the country. Although the economy is narrowly based, it is well managed and seems likely to grow at about 3-4% for the next few years, with per capita real growth in the range of perhaps 2.5%-3.5% (section 1.5). Electrification was 93% in 2001. Today, nearly 95% of Samoa’s households are probably electrified. Nonetheless, generation and sales of electricity are expected to grow by about 6% per year (section 2.1.3) as the population becomes more affluent. Transport energy use has grown by about 9% per year for the past 15 years and is likely to continue to grow considerably faster than economic growth or other fuel growth. It is assumed that air transport fuel use will continue to grow faster than the economy as tourism expands and more expatriate Samoans visit. Assuming that the apparent shift away from fuel wood continues, both LPG and kerosene for household use should grow at a faster rate than the population.14 Table 2-10 shows the pattern of likely commercial energy use over the next decade assuming that there is no new investment in renewable energy except for hydro construction already underway. Overall, petroleum fuel use and GHGs both can be expected to grow at about 6.3% per year with emissions reaching 345 Gg of CO2 equivalent by 2013.
12 The report estimates 73.2 Gg of CO2 from transport. It is not explicit regarding electricity but the data in the report suggest about 24 Gg. Greenpeace used energy modelling software called LEAP, not UNFCCC guidelines for its calculations. Note that Gg, rather than tonnes, is the official IPCC unit for emissions. 13 CH4 has 21 times the GHG warming potential of CO2, N20 310 times. See Annex 2. 14 Future GHG emissions are not very sensitive to the assumed growth rate of LPG or kerosene use for households.

20
Table 2-10 - Commercial Energy Demand & GHG Emissions in 2003 and Projections for 2013
2003 2013 Product Consumption 1
(ML; actual) Share
(%) GHGs
(Gg CO2) Consumption (ML; projected)
Share (%)
AAGR (%)
GHGs (Gg CO2)
Motor spirit 25.1 35 62.75 46.4 35 8% 116.00 Jet fuel /DPK 12.4 17 32.24 20.2 15 5% 52.52 ADO for electricity ADO for other use
12.0 21.2
17 29
32.40 57.24
21.5 41.7
16 31
4.6% 2 7%
58.05 112.59
LPG 1.6 48 2.52 3.8 3 9% 6.08 Fuel total 34.8 48 92.16 133.6 100 6.3 345.24 Hydroelectricity 45.87 GWh – – 56 GWh – 2% - Notes: 1) Consumption in 2003 from Table 2.9. AAGR rates of fuel use are estimates by the PIREP team. 2) The Afulilo hydro augmentation project (section 4.2) is under construction and will produce about 10 GWh/yr. At EPC’s 2002 use of 0.27 l/kWh (JICA, 2003), this would displace 2.7 ML of ADO, reducing AAGR for ADO from 6.0% to 4.6%.
As discussed in Chapter 3, Samoa has potential for further energy production from renewable indigenous resources, including hydropower development, biomass energy and possibly wind and geothermal. Ignoring promising technologies that are very unlikely to be commercialised in the next decade or so, such as sea wave or ocean thermal energy, provides indicative, order-of-magnitude estimates of the potential from renewable resources and their associated GHG reductions.
Table 2-11 - Indicative Energy Savings & GHG Savings from Renewable Energy, 2013
Technology Potential fuel savings,
energy or power production
Potential CO2 savings
(Gg / year) Comments
Hydro, Savai’i 7.32 ML of ADO 19.76 Sili phases 1 & 2 are developed by 2013 Hydro, Upolu 7.56 ML of ADO 20.41 All schemes studied by JICA are developed Geothermal, Savai’i 4.725 of ADO 12.76 5 MW resource; perhaps with undersea cable Bio-diesel 10.0 ML of ADO 27.00 All copra & oil (1997/98 exports) used as fuel. Fuel ethanol ? 0 Not assessed but possible from many crops Other biomass 0.085 ML of ADO 0.25 Considered minor by London/SOPAC study Solar PV 0.021 ML of ADO 0.06 600 PV systems Wind 0.39 ML of ADO 1.05 5 x 250 kW systems Total 81.29 Savai’i hydro. It is assumed that all of the hydro potential considered by JICA (Section 3.2) is developed by 2013, which is optimistic. This would provide (if 2013 were an ‘average’ year), 23.6 GWh. At 0.31 l/kWh, this would displace 7.32 ML of distillate. Upolu hydro. Excluding a hydro augmentation scheme under construction (which is already included in the GHG projections of Table 2.10 for 2013), and assuming all of the potential identified by JICA (2003) is developed (Table 3.3), there would be about 28 GWh from new hydro. It is optimistically assumed that Alaoa, estimated by JICA to close in 2009, remains operating. At the Upolu fuel use of 0.27 l/kWh, this would displace 7.56 ML of ADO. Geothermal. It is assumed (see Section 3.1) that 5 MW is available and developed on Savai’i. Assume 3.5 GWh of generation per MW per year replacing ADO generation at Savai’i consumption of 0.31 l/kWh, or 5.425 ML displaced. If geothermal & hydro together produce more than the Savai’i demand, it is assumed that there is a power cable linking the islands. Bio-diesel. Assume (Section 3.6) that 10.5 ML of coconut oil are used as ‘biodiesel’ fuel, displacing 10 ML of ADO for either transportation use or power generation or a combination of both. Other biomass. Assume (Section 3.6) every 100 m3 of logs produce about 45 m3 of processed wood & 55 m3 of potential biomass for fuel. FAO suggests that all wood exports will end by 2005 and not resume until 2015. Nonetheless assume 10,000 m3 of logs produced in 2013, producing 4,500 m3 of waste of which 10%, or 550 m3, is available for energy use. . Assuming 400 kg/m3 and 14 MJ/kg, this is equivalent to 2.5 million MJ, about enough to for a 110 kW plant producing 275,000 kWh per year. If this replaced small inefficient diesel plants using 0.31 l/kWh, it would displace 85,000 litres of ADO per year. Solar PV. Assume half of the 1,200 or so families without electricity use individual solar PV systems of 150 Wp & 0.375 kWh/day. Assume 300 days/yr operation. This would be about 67,500 kWh/year. Assuming this replaced small inefficient diesel plants using 0.31 l/kWh, this would displace 21,000 litres of ADO per year. Wind. Assume that NW Upolu does have reasonable wind speeds and 5 systems of 250 kW each are developed. Assume 1,000 kWh/kW installed, replacing small diesel sets using 0.31 l/kWh. This would replace 0.39 ML of ADO per year.

21
Table 2-11 suggests that in principle, by 2013 Samoa could reduce CO2 equivalent GHG emissions through renewable energy investments by about 81 Gg, equivalent to 43% of 2003 emissions and 23% of projected 2013 emissions. This estimate is based on proven technologies and more-or-less known resources but does not consider economic, financial, political, social, technical, environmental or other practical constraints. The assumptions for biomass-based energy generation are very speculative as both the timber and copra industries are in decline. If there were plantations dedicated to biomass energy, or a large amount of coconut waste were available, this could increase considerably but probably not enough to have a major impact. The estimates suggest that, even if geothermal power (at the scale thought to be available) were developed on Savai’i, all economically viable hydro sites are exploited by 2013, and a considerable amount of coconut oil were used for diesel fuel displacement, Samoa will nonetheless become increasingly dependent on petroleum fuel imports.

22
3 POTENT IAL FOR RENEWABLE ENERGY TECHNO LO GIES
The technical potential for energy production from renewable energy technologies (RETs) from local renewable resources in Samoa is considerable. Compared to many PICs, much of the potential resource is relatively accessible but much will be impractical to harness in practice for economic or social reasons. This chapter summarises knowledge of the potential resources and associated technologies for geothermal, hydro, ocean based energy, wind, solar and biomass for liquid fuels (coconut oil) and combustion (forest resources).
Figure 3-1 – Hydro Development and Renewable Energy Potential in Samoa
Source: adapted from PREA, 1992; Note: The petroleum tank farm at Asau has since been relocated to Salelologa.
3.1 The Potential for Geothermal Energy
An American company (Layman, 2001) has applied for a geothermal development license for four sites covering over 900 km2 in north, south, east and west Savai’i (Figure 3.1). The application notes that Savai’i resembles Hawaii in its formation and makeup: a basaltic shield volcano of young geologic age, with an active volcanic rift system. It is suggested that there may be potential for a 4-5 MW geothermal power plant. The license has not been granted with progress reportedly suspended pending further GoS consideration. In 2002 SOPAC, in collaboration with the US Geothermal Industries Corporation (USGIC) prepared a funding proposal for further assessment of the geothermal resource in five PICs (SOPAC, 2002), including Samoa. No funding has thus far been found. For Samoa, the proposal concluded:
… volcanism along the Samoan Ridge has created large shield volcanoes and smaller cones. The activity on the westernmost major island, Savai’i, was most intense from the Pliocene to the middle Pleistocene and is thought to have been decreasing since then. Nevertheless, three volcanoes on Savai’i have erupted in historic times, with the most recent event being that of Mt. Matavanu in 1911. Accordingly, the environs of these volcanoes are judged to be highly prospective for the discovery of one or more geothermal reservoirs. A thorough search of Savai’i [is proposed] for surface evidence of subsurface heat. Any thermal waters or gases found should be sampled and the geothermometric equilibration temperatures should be calculated. Geologic mapping in these areas should also be accomplished at the same time. If the results of the reconnaissance
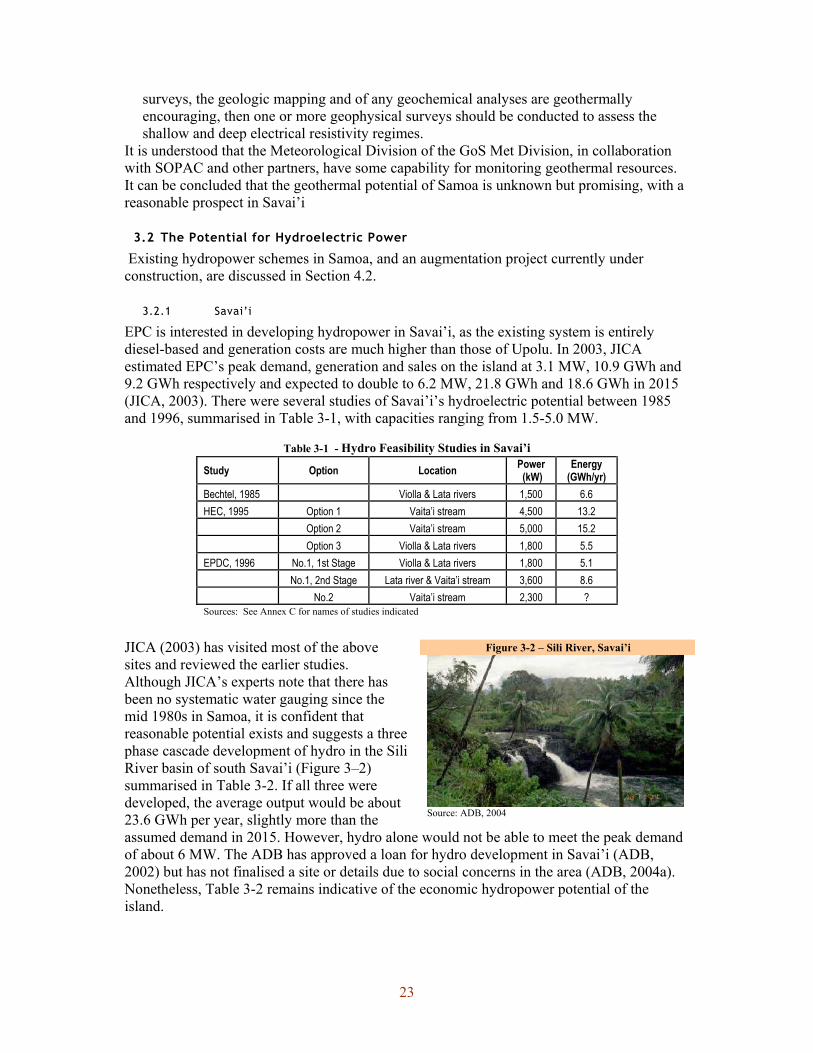
23
surveys, the geologic mapping and of any geochemical analyses are geothermally encouraging, then one or more geophysical surveys should be conducted to assess the shallow and deep electrical resistivity regimes.
It is understood that the Meteorological Division of the GoS Met Division, in collaboration with SOPAC and other partners, have some capability for monitoring geothermal resources. It can be concluded that the geothermal potential of Samoa is unknown but promising, with a reasonable prospect in Savai’i
3.2 The Potential for Hydroelectric Power
Existing hydropower schemes in Samoa, and an augmentation project currently under construction, are discussed in Section 4.2.
3.2.1 Savai’i
EPC is interested in developing hydropower in Savai’i, as the existing system is entirely diesel-based and generation costs are much higher than those of Upolu. In 2003, JICA estimated EPC’s peak demand, generation and sales on the island at 3.1 MW, 10.9 GWh and 9.2 GWh respectively and expected to double to 6.2 MW, 21.8 GWh and 18.6 GWh in 2015 (JICA, 2003). There were several studies of Savai’i’s hydroelectric potential between 1985 and 1996, summarised in Table 3-1, with capacities ranging from 1.5-5.0 MW.
Table 3-1 - Hydro Feasibility Studies in Savai’i
Study Option Location Power (kW)
Energy (GWh/yr)
Bechtel, 1985 Violla & Lata rivers 1,500 6.6 HEC, 1995 Option 1 Vaita’i stream 4,500 13.2 Option 2 Vaita’i stream 5,000 15.2 Option 3 Violla & Lata rivers 1,800 5.5 EPDC, 1996 No.1, 1st Stage Violla & Lata rivers 1,800 5.1 No.1, 2nd Stage Lata river & Vaita’i stream 3,600 8.6 No.2 Vaita’i stream 2,300 ? Sources: See Annex C for names of studies indicated
JICA (2003) has visited most of the above sites and reviewed the earlier studies. Although JICA’s experts note that there has been no systematic water gauging since the mid 1980s in Samoa, it is confident that reasonable potential exists and suggests a three phase cascade development of hydro in the Sili River basin of south Savai’i (Figure 3–2) summarised in Table 3-2. If all three were developed, the average output would be about 23.6 GWh per year, slightly more than the assumed demand in 2015. However, hydro alone would not be able to meet the peak demand of about 6 MW. The ADB has approved a loan for hydro development in Savai’i (ADB, 2002) but has not finalised a site or details due to social concerns in the area (ADB, 2004a). Nonetheless, Table 3-2 remains indicative of the economic hydropower potential of the island.
Figure 3-2 – Sili River, Savai’i
Source: ADB, 2004
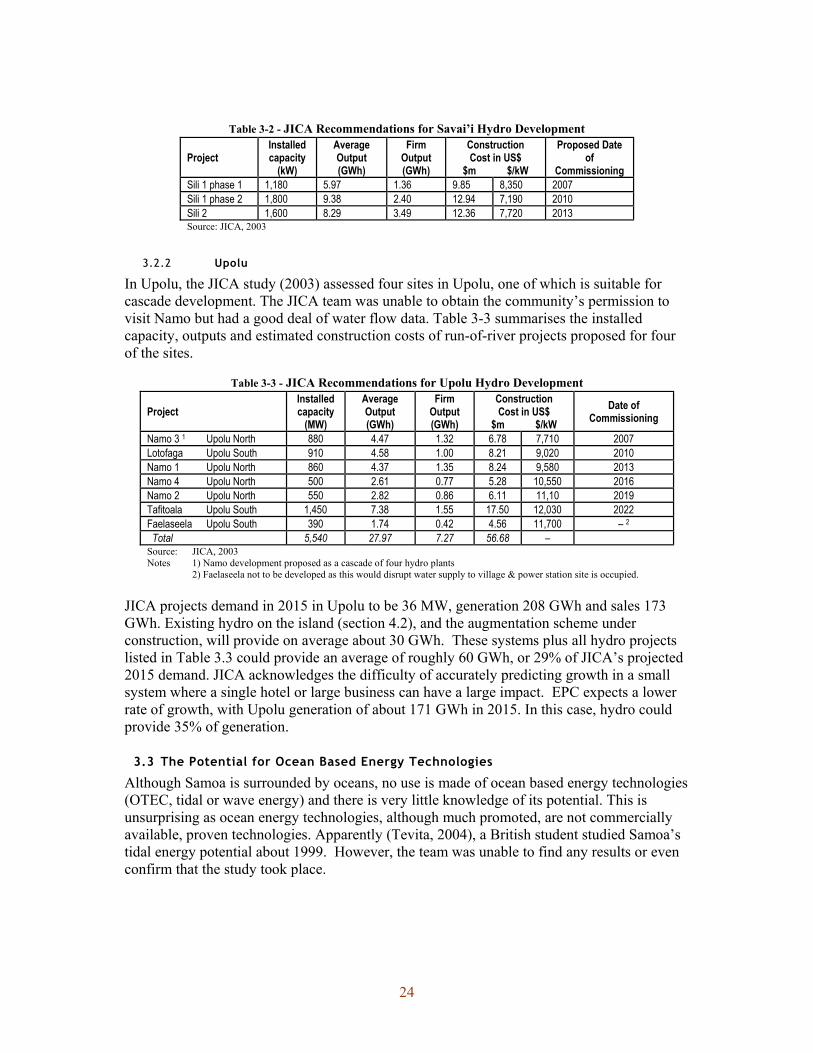
24
Table 3-2 - JICA Recommendations for Savai’i Hydro Development
Project Installed capacity
(kW)
Average Output (GWh)
Firm Output (GWh)
Construction Cost in US$
$m $/kW
Proposed Date of
Commissioning Sili 1 phase 1 1,180 5.97 1.36 9.85 8,350 2007 Sili 1 phase 2 1,800 9.38 2.40 12.94 7,190 2010 Sili 2 1,600 8.29 3.49 12.36 7,720 2013 Source: JICA, 2003
3.2.2 Upolu
In Upolu, the JICA study (2003) assessed four sites in Upolu, one of which is suitable for cascade development. The JICA team was unable to obtain the community’s permission to visit Namo but had a good deal of water flow data. Table 3-3 summarises the installed capacity, outputs and estimated construction costs of run-of-river projects proposed for four of the sites.
Table 3-3 - JICA Recommendations for Upolu Hydro Development
Project Installed capacity
(MW)
Average Output (GWh)
Firm Output (GWh)
Construction Cost in US$
$m $/kW Date of
Commissioning
Namo 3 1 Upolu North 880 4.47 1.32 6.78 7,710 2007 Lotofaga Upolu South 910 4.58 1.00 8.21 9,020 2010 Namo 1 Upolu North 860 4.37 1.35 8.24 9,580 2013 Namo 4 Upolu North 500 2.61 0.77 5.28 10,550 2016 Namo 2 Upolu North 550 2.82 0.86 6.11 11,10 2019 Tafitoala Upolu South 1,450 7.38 1.55 17.50 12,030 2022 Faelaseela Upolu South 390 1.74 0.42 4.56 11,700 – 2 Total 5,540 27.97 7.27 56.68 – Source: JICA, 2003 Notes 1) Namo development proposed as a cascade of four hydro plants 2) Faelaseela not to be developed as this would disrupt water supply to village & power station site is occupied.
JICA projects demand in 2015 in Upolu to be 36 MW, generation 208 GWh and sales 173 GWh. Existing hydro on the island (section 4.2), and the augmentation scheme under construction, will provide on average about 30 GWh. These systems plus all hydro projects listed in Table 3.3 could provide an average of roughly 60 GWh, or 29% of JICA’s projected 2015 demand. JICA acknowledges the difficulty of accurately predicting growth in a small system where a single hotel or large business can have a large impact. EPC expects a lower rate of growth, with Upolu generation of about 171 GWh in 2015. In this case, hydro could provide 35% of generation.
3.3 The Potential for Ocean Based Energy Technologies
Although Samoa is surrounded by oceans, no use is made of ocean based energy technologies (OTEC, tidal or wave energy) and there is very little knowledge of its potential. This is unsurprising as ocean energy technologies, although much promoted, are not commercially available, proven technologies. Apparently (Tevita, 2004), a British student studied Samoa’s tidal energy potential about 1999. However, the team was unable to find any results or even confirm that the study took place.

25
Oceanor of Norway monitored Samoa’s sea wave potential in the early 1990s through a NORAD-funded regional wave energy resource assessment (SOPAC, 1996). The aim was to map the resource (wave height, wave periods and wave energy), through data buoys moored off the shores of several islands, including Upolu. Figure 3-3 shows the results. In the open sea, annual mean wave power levels are in the region of 20-25 kW/m, which is similar to Fiji waters. However, power levels on the coast, which is more significant for practical exploitation of the resource, are significantly lower. A waverider buoy to the south of Upolu measured a long term average of about 16 kW/m (red data point) and Geosat satellite altimeter calculations (black data points) suggest that the northern shores averaged 8-9 kW/m. For areas producing 10 kW/m, assuming 25% conversion efficiency, it would require 0.4 km of wave front for an average annual output of 1 MW. As far as the PIREP team could determine, there has been no measurement of deep sea versus surface ocean temperatures to enable estimates of near-shore ocean thermal energy (OTEC) potential. Despite frequent announcements of sea wave and OTEC demonstration projects, it is highly unlikely that Samoa or other PICs will deploy ocean energy technologies at any scale for the next decade or so.
3.4 The Potential for Wind Energy
There has been little assessment and monitoring of the wind energy resource potential in Samoa. For parts of north western Upolu exposed to easterly trade winds (Figure 3.1), the mean wind speed is 5.13 m/s (GoS, undated)15 A Forum Secretariat Southern “Pacific Wind and Solar Monitoring Project”, that measured wind speeds specifically for energy potential in five PICs in the mid-1990s, did not include Samoa. The team concludes that there may be a wind resource on Upolu sufficient for electricity generation, and this should be ascertained.
3.5 The Potential for Solar Energy
Samoa has abundant sunshine and is estimated that most parts of the country receive a daily average insolation of over 5.0 kWh/m² (EPC, 1985). The insolation is distributed all year round with relatively small variation. There is sufficient solar insolation for commercial and domestic water heating and for household electricity generation.
15 The information is from an undated Meteorological Division paper which summarises weather and climate conditions for about 30 years through 2000. For the NW Upolu site near the international airport, the daily peak was between 10:00 am and 6:00 pm and the maximum recorded wind speed was 18 m/s.
Figure 3-3 – Samoa’s Wave Energy Potential
Source: Oceanor studies (SOPAC 1996)

26
UNDP/UNESCO (Zieroth, 2003) have investigated the practicality of 24-hour solar PV electricity supply for the island of Apolima (Figure 3-4), with nine households and a church. The community is currently supplied by a 25 kVA generator (derated to 20-22 kW) which uses over one litre of distillate per kWh produced, more than triple that of a well-maintained small genset. The maximum load is about 12 kW with a demand of 350 kWh/month. Based on the 2003 study, UNDP and EPC are considering a decentralised PV system which will cost an estimated US$80,000 for equipment and US$117,000 overall, including detailed design, training and establishment of a renewable energy service company (RESCO) to manage the project. (UNDP/EPC, 2004). Technically, solar energy is a good option for Apolima and the life-cycle and operating costs appear to be lower than the current diesel operation.
3.6 The Potential for Biomass Energy
Total forest cover in Samoa has been estimated by the UN Food and Agriculture Organisation (FAO) at 104,790 hectares; with deforestation of about 2,500 hectares annually from the 1980s until the mid 1990s, although this has since decreased. Leavasa & Pouli, 2000 estimate 106,600 hectares (Table 3-4), about 36% of Samoa’s total land area. Because Samoa’s forest resource data collection has been poor, and its last forest inventory was carried out in 1967, the FAO has been supporting a Samoa Forest Resource Information System (SAMFRIS) through November 2004, with a possible extension, to update and improve knowledge of the resource. SAMFRIS is digitising and interpreting 1998/99 aerial photographs, adding information from various sources, and developing a database and maps showing forests, other woodlands (including large coconut plantations), other land, and inland waters. It may be extended to include agriculture. Currently, the GoS Forestry Division estimates forest cover at 45%, whereas others suggest 40 ± 5%, but informed sources suggest this will drop to 35%, consistent with Leavasa and Pouli, as SAMFRIS data become available (Tevita, interviews with Forestry, 2004). SOPAC (2003) describes the forests of Samoa as mainly humid tropical rainforests, differentiated by elevation into lowland, foothill and upland forests. Common species include Pometia spp. and Terminalia spp. in the lowland and foothill forests. Substantial areas are under coconut, and there are smaller areas of mangrove. Deforestation has been a serious problem since heavy exploitation of indigenous forests started in the 1970s. Most commercial forest has been cleared for timber or agriculture or damaged by cyclones. Currently, over 80% of forest is regarded as non-commercial. Overall, about 75% of total forest area is on Savai’i, comprising merchantable indigenous forests (15%), non-merchantable indigenous forests (83%), and plantations (2%). New Zealand Aid initiated a reforestation programme around 1979 under which over 500 hectares were to be replanted annually with land leased from customary owners and returned upon the lease termination. However, little attention was paid to the effective marketing of Samoan species and the NZ support ended in 1996. Reportedly (Tevita, 2004), $5 million has been approved by AusAID to support a Community Forest Replanting Scheme.
Figure 3-4 – Apolima Island (at Left)
Source: Zieroth, 2003
Table 3-4 – Estimate of Forest Cover in Samoa, 2000
Type of forest Area (hectares)
% of all land
Productive 15,923 5.4 Non-productive 87,396 29.8 Plantation 3,277 1.1 Total 106,596 36.3 Source: Leavasa & Pouli (2000) in SOPAC (Dec. 2003)

27
There are currently four sawmilling companies, all operating in Savai’i, that have logging concessions in indigenous forests. In 2001, the estimated time to log the remaining area at the current logging rate ranged from 2 to 5 years, as shown in Table 3-5, extracted from the report to the WSSD (GoS, 2002). During the past six years, logging has peaked at 16,000 m3 declining to 9,000 m3 in 2003 as the resource has diminished and become less accessible. Until recently, some timber was dried (using off-cuts and wood waste for energy) and treated but this is apparently not now done. As a rule of thumb, for every 10,000 m3 logs cut 5,000 m3 are extracted yielding 2250 m3 (45%) sawn timber plus 2750 m3 (55%) waste. Commercial logging is expected to cease by 2005 due to overexploitation but plantation resources will not be ready for harvesting as sawlogs for a further decade (Tevita, 2004). The Samoa Forest Sector Plan 2003 (GoS, 2003b) aims for wider participation from farmers in wood production through community forestry, including the propagation of 30,000 seedlings and training in woodlot management. It is hoped that 200 new woodlots will be established, and 500 existing ones monitored, by 2005.
3.6.1 Coconut
56% of land under coconut is in Upolu and 44% in Savai’i, totalling 53,200 acres (21,529 hectares) in 1999 (Agricultural Census, 1999), a drop of 6,111 ha from 1989. Cyclones in 1990 and 1991 heavily damaged coconut plantations. 60% of the coconut land was under coconut only, 28% under mixed crops, and 12% under scattered crops. The age distribution of trees is shown in Table 3-6. It appears that most are still within their economic bearing age of 60 years or under. In Samoa, coconut trees are used for furniture and handicraft and the nut for coconut oil. No coconut timber is exported. Coconut Oil Products of Samoa (COPS) produce coconut oil for export, with some low-quality oil used a boiler fuel. Although COPS has a target of 4,000 tonnes of exports per year, in 2002 exports were only 200 tonnes and in 2003 about 1200 tonnes. For the present, storage facilities at the wharf are limiting exports but lack of nuts is limiting production, which is a far larger constraint. There is considerable experience in the region, discussed in the PIREP regional overview report, with the use of coconut oil or its esters as a ‘biofuel’ which can substitute, alone or as a blend, for distillate for power generation and transport. In 1980 Samoa exported 25,000 tonnes of copra, down to 7,150 tonnes by the late 19990s, but still sufficient to produce about 4,820 tonnes of coconut oil (5.3 ML), equivalent in energy terms to 5.0 ML of distillate. During the same period Samoa exported 3,858 tonnes of coconut oil, equivalent in energy terms to about 4.0 ML of distillate. This suggests that, in principle, Samoa could produce the equivalent of at least 9 ML of distillate (assuming of course that it would be attractive to
Table 3-5 - Remaining Available Indigenous Forest Areas of Saw millers Logging Concession at the end of 2001
Sawmilling Company *
Remaining Available Area to Log **
(Hectares)
Est. Time to Log Remaining Area at
Current Logging Rate*** (Years)
Bluebird 938 2 Strickland Brothers 341 2.5 Savai’i Sawmillers 329 5 Samoa Forest / TVC 973 **** Source: Report for April to December 2001 Period of the Government of Samoa’s Indigenous Forest Monitoring Unit, Forestry Division, Ministry of Agriculture Notes: * All sawmilling companies operate in Savai’i. ** Areas of merchantable forests concession under the sawmilling companies’
licenses. *** Rate of logging varies with the respective capacities of the sawmilling
companies. **** Cannot be adequately determined as this company also operates outsides its
license in other village of Savai’i (Letui/Sasina) which have had forest conservation programmes).
Table 3-6 - Age Distribution of Coconut Trees in 1999
Tree Age in Years % of total
Not Stated 10 Less than 8 years 11 8-14 years 14 15-39 years 37 40-59 years 20 60 years and over 8 Total 100 Source: 1999 Agricultural Census

28
produce oil for fuel rather than copra or oil for export). However, with 23,000 ha under coconut, actual production could be substantially higher. In principle, almost any vegetable oil could probably be used as a substitute for ADO or kerosene. However, Samoa has had no history of producing other vegetable oils and these are not considered here. In 2003, a team from Imperial College, University of London, assessed the biomass energy potential of six PICs (SOPAC, 2003). For Samoa, they suggested several promising sources and technologies, shown in Table 3-7. The PIREP team feels they may be too optimistic.
Samoa could produce some energy (heat, electricity, liquid fuel) from wood waste and agricultural wastes, and a larger amount from copra. These are discussed further in chapter 4.
Table 3-7 - Promising Biomass Sources and Technologies for Samoa
Resource Tech. / Process & Product Remarks
Agricultural residues Combustion Various crop residues (coconut, copra waste, cocoa) offer some additional potential, both for domestic and small industrial applications
Forestry residues Combustion 80% of forest is economically unproductive. About 70,000 m3 of fuel wood (FAO estimate) used annually. Forests are not expected to play a major role in energy supply. (Italic emphasis added)
Sawmill waste Combustion With better management, offers good possibilities. Currently it partly wasted. Coconut Biodiesel, charcoal Good possibilities for small applications
MSW & other waste Biogas Innovative anaerobic digester has been installed in Apia. Unfortunately, it appears to have run into management problems and is currently stalled.
Source: SOPAC (2003); Note: MSW = municipal solid waste

29
4 EXPER IENCE WITH RENEWABLE ENERGY TECHNOLOGIES IN SAMOA
4.1 Experience with Geothermal Energy
No geothermal energy has been developed in Samoa. No boreholes have been drilled to assess the resource and no serious surface studies have been undertaken.
4.2 Experience with Hydropower
The only experience with hydroelectric power generation in Samoa has been on Upolu. Upolu consists of volcanic rock and coral having high water permeability so hydropower based on water storage in reservoirs behind dams is expensive and generally impractical. As described in Section 2.1.3, there are six run-of-river hydroelectric plants on Upolu, ranging from 950-1750 kW plus 4 MW (2 x 2 MW) with water storage at Afulilo (Taelefaga), providing up to 4 MW of year-round output. The installed nameplate hydro capacity is 12.2 MW, derated to 11.5 MW actual available power. The dry season capacity is 4.2 MW. Figure 3-1 in the previous chapter shows the locations of these hydro schemes, which are summarised below and in Table 4-1: • Alaoa. Located in the Vaisigano river basin, upstream of the Samasoni and Fale-ole-Fee
stations, this is the oldest operating hydro system in Samoa. There is a horizontal-shaft Turgo impulse turbine with a synchronous generator rated at 1,000 kW (Figure 4-1).
• Fale-ole-Fee. Located in the Vaisigano river basin, downstream of the Alaoa station, it contains a single horizontal shaft Pelton turbine with a 1,600 kW synchronous generator. The head pond is sufficient for two hours of operation at full capacity without any inflow.
• Samasoni. Located in the Vaisigano river basin, downstream of the Fale-ole-Fee station, it contains two Turgo impulse turbines with two 900 kW synchronous generators. The head pond is sufficient for one hour of operation at full capacity without any inflow.
• Lalomauga. Located in the Falefa river basin, this is the largest run-of-river system in Samoa with two horizontal shaft Francis turbines and two 1,760 kW generators. The head pond is sufficient for one hour of operation at full capacity without any inflow.
• Taelefaga. Afulilo/Taelefaga is Samoa’s only stored hydropower system, with two horizontal shaft Pelton turbines and two synchronous generators, each rated at 2,000 kW. The reservoir has an effective capacity of 10 million m3. Under an augmentation project funded by the ADB, a third 2,000 kW turbine will be installed by the end of 2004, and the reservoir capacity expanded by 50%.
Table 4-1 - Existing Hydropower in Upolu, 2003 ––––––- Capacity in kW ––––– Station Type Commissioned * No. Installed Derated Retirement
Taelefaga Dam-reservoir 1992 1 2
2,000 2,000
2,000 2,000 2042
Lalomauga Run of river 1984 1 2
1,850 1,850
1,700 1,600 2033
Samasoni Run of river 1981 1 2
950 950
640 720 2032
Fale-ole-Fee Run of river 1985 1 1,600 1,400 2031 Alaoa Run of river 1959 1 1,000 1,000 2009 Total Run of river – 8 12,200 11,060 – Source: JICA, 2003 Note: * These dates differ in some sections of the JICA report.

30
In 2002, the last year for which records were available to the team, the hydro systems produced 43 GWh of which 48% was from Taelefaga. The output of run-of-river hydro systems varies enormously with water flows. The average plant factor (i.e. the ratio of actual annual generated energy to potential annual generation at full operation) for 1994 through 2002 has ranged from 29% for Lalomauga No. 1 to 42% for Alaoa. For the Taelefaga stored system, it was 56%.
4.3 Experience with Ocean Energy
There has been no experience with OTEC, sea wave or tidal energy systems in Samoa.
4.4 Experience with Wind Energy
There were apparently very limited, small-scale trials of wind energy systems in Samoa in the 1980s but the PIREP team found no records of them.
4.5 Experience with Solar Energy
4.5.1 Solar thermal
All large hotels in Samoa have solar water heaters (SWH) purchased from overseas suppliers and often installed by the supplier. Maintenance is carried out by local electricians and plumbers but major repairs require overseas technicians. There has been little market demand for SWH for home use largely because the desire for piped hot water in homes has not developed using any energy source. Traditionally bathing is in cool water and the small quantity of hot water needed for dish washing is easily provided from other sources. There are SWH suppliers and maintenance personnel active in Samoa serving the commercial market and they are available to also service the household market should it be developed.
4.5.2 Solar photovoltaics
In 1986, EPC electrified the village of Safotu, Savai’i as a pilot use of photovoltaics. Thirty systems were installed with 25 single panel units on homes and one installation was made on the Catholic church using 5 panels. The systems used LX100GT 42Wp Solarex panels feeding a 12V 100 Ah @ C100 lead-acid storage battery through a discharge controller – no charge controller was included with the Solarex panels provided. Three high efficiency 13W fluorescent tube lights were installed. Students from the Polytechnic school were trained for the installation along with two people in the village. The villagers were also trained in basic maintenance including the use of a voltmeter and battery hydrometer for operational checks. Funding was through a USAID grant of US$16,375 and the families paid an installation fee of 200 Tala. Households were supposed to make weekly payments of 10 Tala that was to go into a bank account co-signed by the solar committee President and Secretary. This was intended to be used for maintenance and battery replacement but collection discipline was poor and such money as was collected was used for other purposes. The PV systems fell into
Figure 4-1 – Alaoa Hydro Intake Being Cleaned and Repaired Following Cyclone Heta, 2004
Photo: ADB

31
disrepair and the village is now grid-connected. According to the expatriate project manager16, the problems included: • Lack of ongoing support from EPC following a change in management.
• Lack of local spares in the village in Apia and villagers lack of ability to communicate effectively with Solarex in Australia.
• Training insufficient at all levels – particularly regarding system maintenance
As far as the team is aware, the only current significant use of solar PV is the Virgin Cove Resort in Sa’anapu, Upolu ,which apparently uses solar PV exclusively to generate its electricity.
4.6 Experience with Biomass Energy
As noted in Chapter 3, most Samoan families use fuel wood for weekend umus and fuel wood remains the dominant, although declining, source of household energy use for cooking. Nearly twenty years ago, a joint World Bank/UNDP study Western Samoa: Issues and Options in the Energy Sector (WB/UNDP, 1985) assessed biomass energy use and prospects. The study made the following observation and recommendations: • A 2.5 MW turbo generator at the Samoa Forest Products (SFP) sawmill at Asau, Savai’i
produced electricity from excess steam from a wood waste-fired boiler. Power surplus to the mill's requirements was distributed by SFP to consumers in Asau village and by EPC to northwest Savai’i. However, the facility was inefficient and frequently shut down due to insufficient timber waste or mechanical failure. It continued to operate for some years but was eventually closed.
• Due to high petroleum fuel costs, EPC secured financing for 5 MW of wood-fuelled steam power generation (2 x 2.5 MW) for Upolu. But the study recommended that Samoa should proceed with care. The cost in 1982 was US$11 million, including US$1 million for establishing a dedicated fuel wood plantation. The WB/UNDP study team expressed doubts that the delivered cost of fuel wood would be low enough to offset high investment costs. It was never built and it is now clear that it would not have been cost effective since fuel prices soon fell to a level below that which would have made the investment reasonable.
• The WB/UNDP mission was very positive about the highly-efficient Samoan-designed and constructed “Brugger” hot-air dryers for crop drying, and considered these to be a proven technology. Therefore the mission supported a proposed CHOGRM17-financed demonstration project which was to involve the retrofitting of diesel-fired boilers at three sites in Apia including installation and testing of the gasifier/burners, training, and dissemination of information. In 1984, Boilers and driers were retrofitted at three sites — Samoan Tropical Products, STEC Soap Factory, and the Cocoa Board — with Brugger biomass burners/gasifiers and hot air generators resulting in substantial fuel savings (PREA, 1992) but the PIREP team has no information regarding the fate of the Brugger dryers.
• The WB/UNDP mission had reservations about installing two 600 kW biomass gasifier/diesel systems for rural electricity generation to be financed from the Lomé II regional energy programme. They felt that a single 300 kW unit would be more
16 Mr. Johnathan Kahn, a U.S. Peace Corps Volunteer working with the EPC. 17 CHOGRM, the Commonwealth Heads of Government Regional Meeting (for Asia / Pacific) at that time had an Australian-funded Asia/Pacific regional energy demonstration programme with hardware and training elements.

32
appropriate in view of the disappointing performance of gasifiers much above 200 kW and the experimental nature of coconut shells and husks as a feedstock. The system was downsized and redesigned several times but was eventually cancelled by the GoS in 1987, replaced with an energy conservation project (Johnston, 1994).
• EPC tested coconut oil on a small scale as a substitute for ADO in the early 1980s. In view of EPC's other heavy commitments requiring skilled manpower and alternative uses for coconut oil, the mission recommended that this should be low priority, limited to keeping abreast with similar work elsewhere in the region. As far as the team could determine, EPC did not again consider coconut oil as a fuel again until after 2000.
• A GoS Rural Development Programme promoted an “improved charcoal stove project” to replace earlier designs, which cracked easily. The new portable charcoal stoves were made from concrete and retailed for about WS$5. Within a year, the project sold more than 4,000 stoves in the Apia area, using demonstrations and radio broadcasts to disseminate information. Later, production was passed to the private sector. The WB/UNDP mission commended this effort which was expected to improve cooking fuel efficiency, thus reducing the environmental impact of heavy fuel wood harvesting in the Apia area. The charcoal stove programme was apparently short-lived as less than 1% of households reportedly cooked mainly with charcoal in 2001. There is little evidence found anywhere in the Pacific that improved wood or charcoal stove programmes do in practice save fuel wood.
The PREA (1992) estimated the following industrial uses of biomass in 1989: • 37,800 tonnes of coconut residue for drying 22,250 tonnes of copra;
• 11,000 tonnes of biomass for raising steam for coconut oil production by Samoan Coconut Products (now Coconut Oil Products of Samoa);
• perhaps 580-1,160 tonnes of sawmill waste for electricity production at Asau, with most of the remaining 11,000 or so tonnes of wastes used for raising steam for timber drying; and
• about 500 tonnes of fuel wood for soap and coconut cream manufacture.
Biomass is not used now for power generation and the team has no information on biomass used for agricultural drying, although it is understood to be small.
4.6.1 Coconut oil
Samoan production of coconut oil has declined considerably in recent years. COPS operates intermittently, with a capacity of only 25 tonnes of oil per day, down from 75 tonnes in SCPL times when three mills were operating. In addition to low prices (currently COPS offers 54 sene per kg of copra), and competitive uses (coconut cream and desiccated coconut factories), copra production has declined due to less willingness to harvest coconuts and produce copra as lifestyles change. Harvesting coconuts is difficult in Samoa due to the rocky, fairly steep terrain, and the small average plot size, rendering the use of tractors and trailers impractical and/or uneconomic. EPC experimented with coconut oil as a possible diesel fuel in the 1980s, ran a few tests in the past year, and is currently working with UNDP to undertake a study of the feasibility of large-scale use of coconut oil (UNDP, 2003), which would require substantial investment in plantations and processing.

33
4.6.2 Ethanol
In the 1980s, an ADB-funded energy adviser in Samoa arranged a pre-feasibility study of ethanol as a transport fuel for blending with petrol. The feedstock was to be breadfruit. Although nothing eventuated, there are no doubt possibilities in Samoa for producing ethanol from a range of crops.
4.6.3 Biogas
Biogas, a gaseous fuel mixture of methane and carbon dioxide produced as organic matter decays in the absence of air (anaerobic digestion), can be produced from animal dung and vegetable wastes. During the 1970s-1980s, hundreds of biogas systems were built in the region, including a few in Samoa, for control of piggery waste and production of modest amounts of energy. The team is not aware of any that continue to operate in Samoa, except possibly at the University of the South Pacific (USP) Alafua campus.18 More recently, Samoa has been carrying out trials of waste management and biogas production at Tafai’gata landfill on Upolu (GoS, 2001a). This system involves controlled land filling and leachate collection, with different types of waste compacted daily and stored in different embankments. The waste is covered with soil monthly. Through inlets, air is led to the compacted waste and leachate and fed to an underground piping system. There are plans to install a pump to enhance aerobic decomposition and possibly produce methane. In separate trials, anaerobic digestion of biodegradable waste is being tested. Waste is fed into a 500 m3 unheated basin through a hand-fed, grid-connected cruncher, shown in Figure 4-2. Water and bacteria-rich sludge are added so some waste is converted to methane, while reducing the amount of waste (and storage area required) at the landfill. Although methane will initially be flared, it may eventually be used if trials are successful.
18 Through the United Nations University’s Integrated Bio-Systems Program, an “eco-farm” project was proposed in Samoa in 2000. One of the components was to be an “integrated system for raising pigs using agro-industrial waste and pig manure for generation of bio-energy and production of feed. …” which is very similar in concept to the SPC “integrated biogas” programme of the 1980s. The mission was not advised of the outcome of this project.
Figure 4-2 – Cruncher Being Fed Biodegradable Waste at Tafai’gata
Photo; John Vos, 2004

34
5 BARR IERS TO THE IMPLEMENTATION OF RENEWABLE ENERGY TECHNO LO GIES
In the previous chapters, a number of barriers to the development, use and commercialisation of RETs in Samoa have been raised implicitly or explicitly. This chapter brings together the earlier observations and considers further barriers. These have been identified through interviews, observation, reading earlier studies, and a workshop on strengths, weaknesses, opportunities and threats (SWOT) related to RE and RETs in Samoa. This chapter reflects the findings and views of the PIREP team. Significant barriers found by the team were verified through the SWOT workshop discussions and interviews. In general, the discussions during the SWOT workshop held in Samoa addressed national issues less specifically than most other workshops held as part of PIREP. For convenience, the barriers are categorised into: i) Fiscal; ii) Financial; iii) Legislative, Regulatory and Policy; iv) Institutional Barriers; v) Technical; vi) Market; vii) Knowledge and Public Awareness; and viii) Environmental and Social. There are numerous overlaps among categories so classifications are to some extent arbitrary. The barriers have not been prioritised but represent the primary group of barriers that must be overcome.
5.1 Fiscal Barriers
For the most part, Samoa does not seem to be handling fiscal matters in a way that erects serious fiscal barriers to RE or energy efficiency measures. Some minor issues could be small barriers: Exemptions on fuel taxes. EPC, for the time being, does not pay import duty / excise tax on distillate fuel used for electricity generation. Depending on how taxes are treated for fuels which might displace ADO (i.e. coconut or other vegetable oils), differential tax treatment could be a disincentive. Cross-subsidies of fuel prices. By maintaining a national price for price-controlled fuels (ADO, petrol and kerosene) there is a subsidy, probably small, for those who live away from the Apia and NW Upolu areas. In principle, this could bias choices for alternatives to petroleum fuels away from renewables, depending on whether project evaluations of alternatives took any implicit subsidies into account. In practice, with virtually the entire population on two islands, both well-served by roads and other infrastructure, this is unlikely to be a real issue or constraint. Cross subsidies for EPC electrification. The cost of generation of electricity is substantially higher on Savai’i than Upolu (although the team did not document the difference). A national tariff, as used by EPC, can bias investment decisions in remote areas away from RETs. However, in Samoa’s case, EPC is actively considering RE options in Savai’i based on their actual cost of generation, not revenue so this is not likely to be a barrier.
5.2 Financial Barriers
EPC, although it currently has a surplus, has been operating in a financially precarious manner for several decades, in part because the GoS has been reluctant to allow tariffs to reflect actual costs of generation and distribution (and also because of very high system losses). This is a barrier to good investment planning and maintenance in general but also to RE to the extent that EPC is unable to raise finance for its hydroelectric development programme. In the case of small scale PV for the electrification of Apolima, the main barrier to implementation at present is the high cost of a small project, for which donor finance can only cover perhaps a fifth of initial costs.

35
Within the Ministry of Finance, there has been the willingness for some years to allocate substantial GoS funds and concessional loans for developing initiatives to reduce the costs of petroleum fuels. In comparison, the funds allocated to the Energy Unit for overall energy management, data collection, analysis of supply options including RETs, etc. has been minimal. Overall, the emphasis on petroleum supply and pricing has been rational and effective but the lack of support to the Energy Unit has probably been a barrier to RE development.
5.3 Legislative, Regulatory and Policy Barriers
As in most other PICs, there have been numerous drafts over the years of energy policies, but there is no national energy policy which has been formally endorsed by the minister responsible for energy or by the Cabinet. The lack of appropriate legislation, approved energy strategies and policies, guidelines and regulations do form a barrier to the development of RE. As ADB argued in 1999, “the priority now is not so much to articulate fresh policy, but to formalise it, consolidate procedures, and above all to assign responsibilities for carrying it out.” Other specific barriers in Samoa are: • EPC. There are apparently no explicit criteria by which EPC’s performance can be
measured or to guide the board of directors. In this environment, decisions can be ad hoc. EPC’s legislation may need to be revised and updated.
• CSOs. Community Service Obligations of EPC under the PUMA Act (effective July 2004) should be clearly spelled out and understood by the EPC and GoS, including any financial obligations.
5.4 Institutional Barriers
In general, Samoa has been effective in obtaining donor and other finance for its development needs. Unlike several other PICs, the team is not aware of any cases (at least since the Lomé II energy programme of the 1980s), where institutional barriers within the GoS have decreased the ability to tap potential sources of finance, donor and other, for RET. Several issues include: • Structure of Energy Unit. Many energy sector issues require fiscal, financial,
investment and regulatory decisions; the MoF is an appropriate location for the Energy Unit. In May 2004, there was only one full-time professional officer in the Energy Unit with occasional assistance from others. Considering that Samoa does not have small, isolated communities far from the grid, there is no justification for an Energy Unit with staff devoted to rural energy project implementation, a structure common in other PICs. However, the second staff member should be assigned full-time to energy work, the responsibilities of the Energy Unit should be clarified, and there should be a budget allocation for supporting data collection and analysis.
• Coordination. There is no inter-ministerial mechanism for coordinating energy matters, but rather a number of temporary ad hoc national teams or coordinating groups tied to a specific donor-funded initiative. No one seems to be really in charge.
• EPC institutional problems. Studies by ADB, JICA and others have noted that there is little reliable data within EPC, no systematic data collection and limited institutional planning capacity. EPC has long been plagued by high losses. The need to devote its limited resources to basic management matters and supply side loss reduction leave little capacity for serious consideration of non-hydro RE development.

36
5.5 Technical Barriers
The key technical barriers to RE in Samoa seem to be a relatively poor knowledge of available energy resources and practical ways to exploit them. The barriers are therefore partly technical and partly knowledge related: • Limited knowledge of renewable energy resources. There has been limited
measurement, database development or analysis of Samoa’s hydro potential. There has been no monitoring of wind conditions specifically for wind energy. Thus far, there has been no serious study of Savai’i's geothermal potential. Solar energy knowledge is very limited and in mountainous Samoa varies greatly from place to place. There has been no measurement of OTEC potential. In general, there is limited technical information about Samoa’s RE resources.
• Seasonal variability of hydro. Because stored hydropower is generally not practical in Samoa, the seasonal variability of water flows is a barrier to greater use of the hydro potential.
• Limited knowledge of gasification technology. There is some interest now within EPC, as there was 20 years ago, of utilising biomass gasification technology for electricity generation. The lack of low-maintenance, commercially-proven gasification systems able to use coconut wastes has been a technical barrier to gasifier use in Samoa.
• Limited knowledge of biofuel potential. EPC is broadly aware of the technical issues regarding the use of coconut oil as a fuel. As far as the team knows, there has been no study in Samoa of other potential biofuels, whether vegetable oils or ethanol (other than a preliminary study of breadfruit for ethanol fuel production in the 1980s).
5.6 Market Barriers
• Small market size. With a population under 180,000, the local market is too small for local manufacture of most RETs (except possibly SWHs) and probably too small to attract suppliers who are willing and able to provide effective product support and after market maintenance services.
5.7 Knowledge and Public Awareness Barriers
Senior staff of the MoF, and the Governor of the Central Bank, seem to be far more aware of energy issues than most of their counterparts in other PICs. • Public awareness. The team does not know of any RE awareness activities underway,
although these are planned within the UNDP/GEF-supported climate change programme, and the team is unable to state the extent to which public awareness is a barrier to RE use in Samoa.
• Human resources. Although Samoa has a national university and hosts the agricultural campus of USP, there is little or no training or research within Samoa on RE issues and a limited number of Samoans with training in RE and energy issues in general
5.8 Environmental and Social Barriers
As elsewhere in the region, traditional landowners are very protective of their rights and it can be very difficult to get long-term, secure access to land for RE, especially if development is believed to benefit government, outsiders, or only a few landowners. Environmental issues are covered in more detail in Chapter 7. Several environmental and social barriers identified are the following:
37
• Land access. The proposed Sili hydroelectric project on Savai’i has been hampered by social concerns. The village council has withheld their consent for the use of the river (although formally, the GoS has legal authority to use the resource). Although the Prime Minister is confident that the project will go ahead19, this is not yet resolved. When a JICA team studied hydroelectric potential in 2003, landowners refused them access to the proposed Namo cascade project site on Upolu.
• Willingness to pay for hydroelectricity. The EPC consumers at the village of Maagiagi have successfully refused as a group to pay for electricity generated from hydropower plants on their land, despite earlier agreements, raising concerns about landowners’ willingness to pay for electricity from proposed hydro development (and other hydro already in place). Although perhaps not a major barrier to hydro development since the number of landowners involved do not represent a large user base, this attitude could seriously hamper the larger scale use of land needed for biomass and biofuel development.
• Lack of cooperation among various players. Development of renewable energy projects may be win-win situations but often cooperation among interested parties is poor.
• Coastal zone vulnerability. As noted in section 1.3, 70% of Samoa’s population and infrastructure are located in the environmentally vulnerable coastal zone, and any RE projects, especially biomass based, must be well planned if they are to be sustainable. Past poor land management could be a barrier to future use of biomass energy.
19 The PM was quoted in the Samoa Observer newspaper as saying the issues will be resolved and the project will proceed, 21 March 2004.

38
6 CAPAC ITY DEVELOPMENT NEEDS FOR THE REDUCT ION O F BARR IERS
This chapter examines the capacity development needs of Samoa. Addressing these may help to remove or reduce key barriers identified in Chapter 5.20 These are not prioritised. Many of the suggestions below do not fit exclusively, or even primarily, into one category. There is also some repetition with similar issues covered under more than one heading. Finally, it is easier to identify barriers than practical means to remove them (or they would already have been removed). The suggestions in this chapter are tentative and incomplete.
6.1 Fiscal Barriers
Section 5.1 did not identify any serious fiscal barriers to the development and commercialisation of RETs in Samoa. Nonetheless, it may be useful for Samoa to participate in several multi-country studies recommended in other PIREP country reports: • Energy pricing. It would be useful to prepare guidelines for the evaluation of large scale
RETs which take into consideration hidden cross-subsidies in fuel and electricity charges, due to a national electricity tariff and national fuel costs.
• Green interest rates. Although there is only limited scope for small-scale RE in Samoa, it would be useful to assess the need for, and practicality of, special interest rates, perhaps subsidised by the government, for (majority) locally-owned businesses for the establishment of energy services, focussing on improved efficiency of energy use, but including solar water heating. The study should also look at possible credit schemes for individuals who may wish to purchase more energy efficient appliances, SWHs or energy control systems but cannot afford the lump-sum cost.
6.2 Financial Barriers
Section 5.2 noted the weak financial situation of EPC but the team did not have the resources (or mandate) to identify EPC’s capacity development needs. In any case, EPC has worked closely with the ADB on financial capacity development. It might be useful to have an independent assessment, possibly through the new Danish-funded UNDP/SOPAC “Pacific Islands Energy Policy & Strategic Action Planning project” (PIEPSAP) of the MOF’s Energy Unit structure and financial needs.
6.3 Legislative, Regulatory and Policy Barriers
Section 5.3 concluded that the lack of legislation, approved energy policies, guidelines and regulations form a barrier to the development of RE in Samoa. Donors and lending agencies typically expect a clear policy/legislative/regulatory framework to be in place before approving new energy assistance, or sometimes can be developed as part of that assistance. • Energy policy. The Energy Unit has a workable draft energy policy but may require
assistance to convert it to a practical and GoS-endorsed framework for guiding energy sector development. The GoS should consider approaching PIEPSAP to work with the Energy Unit, EPC, and MNRE (the Climate Unit and others) to finalise the overall policy, establish priorities, and develop a transparent policy for electrification of unelectrified households. The rural electrification policy should include the possible role of RESCOs (if appropriate) in Apolima and possibly other isolated communities. This exercise should be linked to, or part of, the institutional study recommended above.
20 Some of the same or similar recommendations are made in other PIREP reports. In some cases, it may be appropriate to carry out similar studies concurrently in several countries, or through a regional effort. This is discussed in the regional overview report.

39
• EPC guidelines. If this is not already being addressed, guidelines should be developed for the board of directors by which EPC’s objectives can be developed and performance measured. It may be appropriate to specifically include energy efficiency (supply side management) and RE.
6.4 Institutional Barriers
Some institutional issues have been considered in sections 6.1 through 6.3. In addition: • Coordination. Considering the number of separate committees and teams established to
deal with individual donor funded energy initiatives, the GoS might consider a permanent energy coordinating committee with the Energy Unit as Secretariat.
• EPC data management. There have been past ADB studies that address the need for better data collection and management at EPC for general planning, operations and maintenance.21 The PIREP team endorses the conclusion that EPC data management and analysis should be improved.
6.5 Technical Barriers
Although there is limited technical information in Samoa on which to base appropriate energy sector investments, the barrier is more the human resource limitations which undermine efforts to assimilate and effectively use the information already available from many past studies than technical barriers per se. Nonetheless, there are technical issues related to the suitability of various technologies for use in Samoa and PICs in general; some are specific to Samoa but they can generally be addressed at a regional level with Samoa components: • Knowledge of the RE resource. It may also be appropriate to seek funding to monitor
promising wind sites on Upolu for a period of 18 months or more. If there are regional efforts to assess geothermal and ocean energy potential, then Samoa should participate.
• Biofuels. A regional study should be carried out of the practicality of using locally-manufactured vegetable oils from a range of crops as fuels on the scale of about 0.5 – 5 ML per year. This would be a broad assessment of suitable crops/feedstocks that might be grown, or are already grown, in the larger high islands of Polynesia and Melanesia. It should also include ethanol as a potential fuel for blending with petrol.
• Technical reports on RETs of immediate relevance. There have been a number of technical reports prepared over the years by donor agencies and others on RETs and their potential suitability for the PICs. Some are out-of-date, inaccessible, biased or too technical or academic in style. It may be useful for a series of short but authoritative technical reports to be prepared (by SOPAC, SPREP or the two jointly) and regularly updated which provide an overview of technical, economic, social, and environmental aspects of RETs of particular relevance to Samoa and other PICs. These might initially include solar and, wind, and biomass gasification.22
21 EPC feel that accurate financial and technical are currently available at the Corporation. The PIREP comments are consistent with those in several ADB reports in the past few years. 22 SOPAC published a number of technical reports in 2001 and 2002. Issues covered include: hydrogen fuel cells (report MR0416, 2001) OTEC (report MR0417, 2001), space solar power (MR0418, 2001) and geothermal (report MR0452, 2002). No coverage of solar PV, solar thermal, wind, hydro or biomass. It may be worthwhile exploring whether existing materials could be adapted/extended to cover specific PIC needs.

40
6.6 Market Barriers
Section 5.6 suggests that the market for small-scale RETs in Samoa will remain tiny due to the small size of the country and the high degree of electrification already attained. It may be worthwhile studying the demand for solar water heating and possibly ways to create and serve a market for locally built SWHs. Considering the likelihood of continued heavy dependence on petroleum fuels, it may be more effective to assess practical options for improved energy efficiency. As this is already being addressed by the ADB’s REEP and PREGA initiatives, no specific recommendations are being made by PIREP except to coordinate with the ADB efforts.
6.7 Knowledge and Public Awareness Barriers
No studies have been carried out in the region on the effectiveness of awareness campaigns on energy efficiency or renewable energy but studies in developed countries some years ago suggest that impacts of broad public awareness campaigns are generally very limited and temporary. Well focused and practical information for businesses and the public on opportunities for renewable energy and energy efficiency development is, however, useful for capacity development There was no opportunity to assess the extent and effectiveness of the extensive range of RE training already carried out by regional agencies, donors, NGOs others. During 2004, the UN’s Economic and Social Commission for Asia and the Pacific (ESCAP) is developing an RE training programme, in cooperation with regional organisations, specifically for PICs. No specific suggestions are offered here, except that private sector and NGO staff should be included in future RE training; thus far it has concentrated overwhelmingly on government officials.
6.8 Environmental and Social Barriers
The key barrier to RETs most frequently described as serious in Samoa is access to land with secure arrangements for the long term. EPC, the GoS and financial institutions should investigate options and opportunities to involve landowners as active partners rather than opponents in the development of grid-connected EPC hydro projects.
6.9 Hardware investments.
Table 2-11 indicates that hydropower development offers the most immediate opportunities for indigenous energy development in Samoa with the potential for substantially reducing GHG emissions from modern sector energy use, possibly followed by biofuels and geothermal. Choices regarding RET development in Samoa should not be made solely on the basis of their potential impact on GHG emissions, which in any case are nearly inconsequential.23 However, the team endorses the development of small hydro for both Upolu and Savai’i, where environmentally appropriate. It also supports the EPC/UNDP approach to GEF for a PDF A24 grant to assess the viability of coconut oil as a potential fuel for large scale power generation. Beyond this, the team feels that it is not appropriate to make any firm suggestions for investments based on several short visits and a superficial study of Samoa’s energy sector issues.
23 Samoa has no legal obligations to reduce GHGs and is an insignificant producer on a global or even regional scale. The Climate Analysis Indicators Tool (CAIT) of the World Resources Institute (WRI, 2003) calculates national emissions to the nearest 1/100 of 1% of the global total. Samoa’s emissions are shown as 0.00%. 24 This is a Project Development Fund grant of up to US$25,000, which could lead to a larger GEF project.

41
7 ENV IRONMENTAL IMPL ICAT IONS OF LARGE SCALE USE OF RENEWABLE ENERGY
For GHG emissions and energy production from RETs, Table 2-11 suggests that the biggest impacts in Samoa may come from investments in hydropower, biofuels, and possibly geothermal energy. Any of these, if poorly planned and executed, could have significant environmental impacts.
7.1 Environmental Issues and Small Hydro
The GoS notes that there are environmental concerns with the current augmentation project for the Afulilo hydroelectric system: “From the outset of this project, visible impacts on the water quality of the Fagaloa bay have been noticeable. These have been a result of discharges from the associated power plant along the coastline. Sediments have contributed to the discolouration of the Fagaloa bay. Anecdotal evidence suggests that the quality of the discharges deteriorate particularly during the dry months from May to October (WSSD report; GoS, 2002). Recent work still underway states that “the Afulilo augmentation project has major impacts on the environment. The Alafou community water shortage problem will be intensified with the loss of 32% of its normal surface water drainage. Fagaloa Bay, which receives tailrace water or outflow from the turbine engines, has seen some fish species disappearing. Increased flow could aggravate the existing problem although it is difficult to ascertain that the cause is entirely the result of the tailrace waters. The raising of the dam level will result in some vegetation being covered by water and in turn add to the rotting vegetation at the bottom of the reservoir, leading to smells and coloration of the water” (Tevita, 2003 slightly edited). Although there are arguments, and strong lobbying efforts globally, against large hydroelectric projects (i.e. above 10 MW) which rely on dams and storage reservoirs, all new hydro developments proposed in Samoa are far smaller and, unlike Afulilo, are run-of-river. The International Association for Small Hydro, the European Small Hydro Association and the International Energy Agency’s Renewable Energy Working Party all define small hydro as less than 10 MW. The International Rivers Network (IRN, which lobbies vigorously against large dams) says, “small hydro can, if responsibly implemented, be environmentally and socially low-impact. … To ensure that small hydro projects have low impacts and meet community priorities it is imperative that all small hydro schemes are planned, built and operated in line with the recommendations of the World Bank/IUCN-sponsored World Commission on Dams” (IRN, 2003).25 The PIREP team endorses this.
7.2 Environmental Issues and Geothermal
Citizens United for Renewable Energy and Sustainability (CURES), a recently formed international NGO network, has defined new renewable energies as including: “modern biomass, World Commission on Dams (WCD)-compliant small (up to 10MW) hydro, geothermal [emphasis added], wind, all solar, tidal, wave and other marine energy.” (CURES website: www.ee-netz.de/cures.html). Although geothermal has not always been considered renewable (as reservoirs eventually deplete, at least temporarily) or benign (due to hydrogen sulphide – H2S – and other toxic emissions), it is now more often considered as an environmentally friendly RET.
25 IUCN is the International Union for the Conservation of Nature. The guidelines are available from www.dams.org but also see a Citizen’s Guide to the World Commission on Dams, available from www.irn.org.

42
According to the US Department of Energy “geothermal power plants easily meet the most stringent clean air standards because they emit little carbon dioxide (fossil-fuel power plants produce roughly 1000 to 2000 times as much), no nitrogen oxides, and very low amounts of sulfur dioxide (SO2). Steam and flash plants emit mostly water vapour. Binary power plants run on a closed-loop system, so no gases are emitted.” For [plants containing H2S], the sulfur can be “separated, dewatered, and recycled as feedstock for sulfuric acid production. Future technology will use microbial processes to extract metals contained in the sulfur, allowing further reuse. At most geothermal hot-water power plants, H2S is present in such low concentrations that it requires no special controls to comply with environmental regulations. … A typical geothermal plant requires several wells. Although drilling these wells has an impact on the land, using advanced directional or slant drilling minimizes that impact. Several wells can be drilled from one pad, so less land is needed for access roads and fluid piping” (USDoE website, 2004).
7.3 Environmental Issues and Biodiesel
It is been assumed (Table 2-11) that only areas already under coconut are likely to be considered for coconut oil for fuel, so the impact should be no more severe than current agricultural practices. In terms of use, biodiesel fuels from coconut, oil palm or other vegetable oils are very low in emissions, as they contain almost no sulphur or hazardous materials. In case of spillage to the ground or marine environment, they biodegrade readily and do not cause contamination.
7.4 Environmental Issues and Biogas Energy at the Tafai’gata Landfill Site
An environmental impact assessment (EIA) of the anaerobic digestion trial project (Section 4.6.3) was prepared and submitted to the Department of Lands, Survey and Environment at the end of 2001. The aim of the project is to demonstrate the reduction in waste volumes discharged into landfill while deriving energy from the waste in the form of biogas. The EIA concluded that the project is unlikely to create any significant negative impacts that cannot be mitigated. (GoS, 2001a).
Figure 7-1 – Geothermal Power Emissions of SO2 & CO2
Source: www.eere.energy.gov/geothermal/environ_impacts.htm

43
8 CAPAC ITY DEVELOPMENT IMPLEMENTATION AND CO-F INANCING OPPO RTUNIT IES
The Renewable Energy and Energy Efficiency Programme (REEP) of the ADB may offer opportunities for co-financing of capacity development under PIREP. The specific projects that are to be funded under the REEP are not yet certain but at least one energy efficiency project and one renewable energy project will be proposed for funding. Projects would probably begin in 2006. Other projects will undoubtedly be funded in the future and the following specific tasks are proposed to be included in co-financing arrangements or in regional programmes under PIREP that can include Samoa’s participation. • Energy pricing. External assistance is needed to prepare guidelines for the evaluation of
large scale RETs in which the financial component takes into consideration hidden cross-subsidies in fuel and electricity charges caused by having a national electricity tariff and national fuel costs.
• Green interest rates. Although there is only limited scope for small-scale RE in Samoa, external assistance would be useful to assess the need for, and practicality of, special interest rates, perhaps subsidised by the government, for (majority) locally-owned businesses for the establishment of energy services, focussing on improved efficiency of energy use, but including solar water heating. The study should also look at possible credit schemes for individuals who may wish to purchase more energy efficient appliances, SWHs or energy control systems but cannot afford the up-front costs. This is at least partially to be accomplished by the Renewable Energy and Energy Efficiency Programme (REEP) of the ADB and any efforts should be coordinated with that programme.
• Resource Assessment. External assistance in addition to local efforts is needed to fully assess the renewable energy resources available to Samoa. In particular external expertise is needed for wind, geothermal and OTEC assessments. Capacity building efforts are needed to develop the skills for proper assessment of the solar and biomass resources and, in conjunction with the external experts, assessment of the wind resource.
• EPC Capacity Development. Although EPC has demonstrated a strong interest in using renewable energy for integration into the grid, their local technical expertise is weak and persons within EPC should be identified for specialist training in renewable energy development as it relates to grid power. This will require external support as well as a commitment on the part of EPC.
• Energy Unit Capacity Development. If renewable energy development and energy efficiency measures are to become a major focus for energy planning, the size and capacity of the Energy Unit within the Ministry of Finance will need to be substantially increased. Matters of standards, certification, policy and renewable energy finance must be dealt with at this level and a single planner with a trainee is not going to be adequate. To develop the Energy Unit for renewable energy and energy efficiency development will require not only local commitment in the form of staff positions but also external support for training of the new personnel.
• Public Information Programmes. Local commitment to funding and external assistance in the provision of focused energy information will be necessary if businesses and the public are to be made fully aware of the opportunities offered by renewable energy and energy efficiency development.
44
• Clean Development Mechanism. The Clean Development Mechanism (CDM) under the UNFCCC could possibly be tapped for GHG emission credits for Samoan renewable energy projects. However, even the simplified procedures for small projects are complex, and there has been limited success with small projects. In principle, it may be possible to bundle several projects (Samoa with other PICs) through the CDM.
45
9 ANNEXES
Annex A – Persons Seen
Aru Mathias Forestry Officer, FAO, [email protected] Aukuso Leavase Senior Forestry Planning and Monitoring
Officer, Forestry Division, MAFFM, P.O. Box 1874, Apia, [email protected]
Pau Ivane SAMFRIS, MAFFM, P.O. Box 1874, Apia, Ph: 21054
Teresa Fepulea’I Operations Manager, COPS Rodney Parker Mill Manager, COPS Tupuoloa…… Production Manager, COPS Meapelo Maiai Min of Natural Resources Nigel Dowdeswell Sustainable Project Management,
[email protected], Ph: 23006, Taule'a'e'ausumai Aumalaga Tiotio Chief Engineer, EPC,
[email protected] Muaausa Joseph Walter General Manager, EPC, Papali'I Tom Scanlan Governor, Central Bank of Samoa,
[email protected] Nonumalo Akerei Salesa Head of School (technology), Samoa
Polytechnic, [email protected] Dr. Nigel Walmsley Water Resources Specialist, Technical
Assistant to the National Authorising Officer Andrew Al Liki Managing Director, Bluebird Lumber &
Hardware, [email protected] Fiu Mata'ese Elisara-Laulu Executive Director/President of Sungo, O Le
Siosiomaga Society, Inc. Thomas Jensen Sustainable Energy Adviser, UNDP
Samoa/UNESCO Apia, [email protected]
Stephen Rogers Head of Office, Delegation of the European Commssion for the Pacific Office in Samoa
Leiataua Isikuki Punivalu Managing Director, Isikuki Punivalu @ Associates, Ltd.
James A. (Jim) Robinson Registered Engineer, ROBTECH ENG SUCS, [email protected]
Steve Baker General Manager, Westpac Bank Samoa Epa Tuioti co-managing director, KVA Consult, Ltd. Marco Kappenberger Rotary Club of Apia, Environment
Fellowship of Rotarians, [email protected] Tu'u'u Luafatasaga Dr. Ietitaia Setu Taule'alo Chief Executive Officer, Ministry of Natural
Resources and Environment Papalii Grant Percival Samoa Association of Manufacturers and
Exporters; email: [email protected] Iosefo Bourne Manager, research and statistics, Central
Bank, [email protected]

46
Aukusitino Rasch Manager Research & Development, Development Bank of Samoa, [email protected]
Ieti Tifaga Project Mgr., ESP-Ministry of Education, [email protected]
Lusia Sefo Leau Deputy CEO, Ministry of Finance, [email protected]
Tuuu Ieti Taulealo Ministry of Natural Resources & Environment, [email protected]
Paul Meredith Assistant CEO-Economic Policy and Planning, Ministry of Finance, [email protected]
Sami Lemalu Assistant CEO-Forestry, Ministry of Agriculture, Forestry, Fisheries and Meteorology, [email protected]
Mosese Vitolio Tui Principal, Don Bosco Technical School, [email protected]
Sili’a Kilepoa Ualesi Energy Coordinator, Ministry of Finance, [email protected]
Ierome Paletasala Research Officer, Ministry of Finance, [email protected]

47
Annex B - References
ADB, 1997 Institutional Strengthening & Power Development of the Electric Power Corporation, Western Samoa (ADB TA 2267-SAM, 1997; prepared by Hydro Electric Commission Enterprises Corporation (HECEC), in association with John Worrall Pty Ltd., Tasman Asia Pacific, and Gillis-Delaney-Brown; October) ADB, 1997a Institutional Support and Power Development Study for the EPC: Power Development Plan (Final Report, Vol. 2) ADB, 1999 Samoa Energy Sector Overview and Policy Recommendations: Final Report (TA 2985-SAM; Strengthening Capacity for Macroeconomic Analysis, Planning and Policy Formulation; Manila; February) ADB, 2000 Samoa 2000: Building on Recent Reforms (Economic report prepared for ADB, AusAID & GoS) ADB, 2001 Summary Environmental Impact Assessment: Afulilo Augmentation Project in Samoa (August) ADB, 2002 Technical Assistance to the Independent State of Samoa for Preparing the Savai’i Renewable Energy Project ADB, 2002a Discussion papers: A. Poverty and hardship Assessment; B. Strategies for Equitable Growth and Alleviation (Apia; 27 September) ADB, 2003a Country Strategy and Program Update Samoa: 2004-2006 (ADB TA 6002-REG; Manila; July) ADB, 2003b Millennium Development Goals in the Pacific: Relevance and Progress (Manila; March) ADB, 2004 Asian Development Outlook 2004 (Manila; 28 April) ADB, 2004a Preparing the Savai’i Renewable Energy Project: Mission Report (Fichtner Consultants, Germany; February) ADB, undated Samoa Country Data (from www.adb.org) BECA/GoS 2001 Coastal Hazard Zone Mapping, Final Report, Volume 1 (Auckland, New Zealand) CBS, 2003 Bulletin (Vol XXVIII, No. 3; September) CIA, 2003 World Factbook: Samoa chapter (updated August) CROP EWG, 2001 Pacific Islands Energy Policy and Plan (available from PIFS; chair of EWG) EPC, 1985 Photovoltaics in Samoa: Social Considerations for Rural Electrification GoS, ? Price Control Act GoS, ? The Foreign Investment Act (under review) GoS, 1967 Forestry Act (under review) GoS, 1972 EPC Act GoS, 1984 Petroleum Act GoS, 1990 Land Resource Planning Study Western Samoa (NZDEC Ltd & New Zealand department of Scientific & Industrial Research (DSIR) for Ministry of Lands, Survey and Environment; January) GoS, 1999 Agricultural Census of 1999 GoS, 1999a Overview of the Energy Sector in Samoa (prepared for GoS by Economic & Energy Analysis Pty., Ltd of Australia; 25 October) GoS, 1999b First National Communication to the UNFCCC (Ministry of Lands, Survey and Environment; October) GoS, 2001 2001 Census of Population and Housing (Statistics Office)

48
GoS, 2001a Environmental Impact Assessment of Anaerobic Digester Technology Trial at Tafai’gata Landfill (prepared for GoS by Sustainable Project Management of NZ & Tepa Suaesi; October) GoS, 2001b Public Bodies (Performance and Accountability) Act (Act 13 of 2001) GoS, 2002 World Summit on Sustainable Development Assessment Report, Government of Samoa GoS, 2002a Strategy for the Development of Samoa 2002-2004: Opportunities for All (Ministry of Finance; January) GoS, 2003 Samoa National Energy Policy (Draft 2; Treasury Energy Unit; October) GoS, 2003a 2003/2004 Budget Address (Ministry of Finance; 30 May) GoS, 2003b Samoa Forest Sector Plan 2003 (Forestry Division, MAFMM) GoS, 2004 Quarterly Economic Report (Issue 23; July-September 2003;Ministry of Finance; January) GoS, 2004a Quarterly Economic Report (Issue 24; October-December 2003;Ministry of Finance; April) GoS, 2004b Notes on Samoa’s Climate (Climate Unit; Meteorology Division; MAFMM) GoS, 2004c PUMA Act GoS, undated Draft National Climate Change Policy (probably 2003) GoS, undatedb Wind Conditions: Samoa (report for Samoa Shipping Services Ltd; Ministry of Agriculture; Meteorology Division; probably early 1980s) GoS, undatedc Note on Climate & Weather Conditions, 1971-2000 (climate unit, Meteorology Division, MAFFM) Greenpeace, 1995 Towards Energy Independence in Western Samoa: An Integrated Energy Study (prepared by Paul Waide for Greenpeace International) IMF, 2003 Samoa: Selected Issues and Statistical Appendix (IMF Country Report No. 03/196; Washington, DC; June) IRN, 2002 Citizen’s Guide to the World Commission on Dams JICA, 2003 Study on Electric Power Demand and Supply in the Independent State of Samoa (Draft Report Volume 1: Main Report; Nippon Koei Co Ltd for EPC & JICA; March) Johnston, Peter, 1994 An Evaluation of the European Community’s Lomé II Pacific Regional Energy Programme: Final Report (prepared for South Pacific Forum Secretariat; Suva; August) Johnston, Peter, 2003 Annotated Samoa National Energy Policy (prepared for UNDP Apia and the GoS Energy Unit; Suva; 15 October). Layman, 2001 Application for a Provisional geothermal development License Including a project Feasibility Study: Island of Savai’i, Independent State of Samoa (submitted to Ministry of Lands, Survey & Environment; 28 March) Leavasa, A. & Pouli, T. 2000. Country Summary Report – Samoa (FAO Workshop on Data Collection for the Pacific Region) Meretec, 2003 Power Sector Improvement Project, Supplementary Engineering Study – Catchment Diversion (Second draft for ADB & EPC; Loan 1886-SAM) PIFS, 1996 Western Samoa: National Energy Policy Statement (prepared by Forum Secretariat with Treasury Energy Unit) PIFS, 2001 Foreign Investment Climate in Individual Forum Island Countries: Samoa SOPAC, 2002 Pacific Island Regional Geothermal Assessment and Development Initiative - A Funding Proposal (Miscellaneous Report MR463; June). SOPAC, 2003 Samoa Biomass Resource Assessment Profile (prepared by ICEPT/EPMG Imperial College, University of London; December) SPC, 2003 Draft Database on Photovoltaic Systems Installed in Pacific Island Countries (Rural Energy & Development Unit, Noumea, April 2003

49
Tevita, Tala, 2003 Notes prepared for PREGA Study (to be available from ADB when completed) Tevita, Tala, 2004 Notes Prepared for PIREP Study (available from SPREP; March-May) UNCT, 2001 Common Country Assessment: Samoa (United Nations Country Team, Apia) UNDP, 2003 Samoa: Coconut Oil for Power Generation PDF Block A Proposal Brief (UNDP with EPC; Apia; November) UNDP, 2003a Human Development Report 2003, Millennium Development Goals: A Compact Among Nations to End Human Poverty (New York) UNDP/EPC, 2004 Apolima Island Photovoltaic (PV) Project - Concept Paper (UNDP with EPC & GoS; Final Version 24 April) USDoE, undated Environmental Impacts of Using Geothermal Energy (U.S. Department of Energy - Energy Efficiency and Renewable Energy; Geothermal Technologies Program; available from: www.eere.energy.gov/geothermal/environ_impacts.htm ) WB, 1990 Pacific Household and Rural Energy Seminar (WB/UNDP Energy Sector Management Assistance Programme & PEDP; Port Vila, Vanuatu, November) WB, 1991 “Dams and Reservoirs” in Volume II and “Hydroelectric Projects” in Volume III of Environmental Assessment Sourcebook (Technical paper Number 154, Washington, DC) WB, 2000 Project Appraisal Document on a Proposed Loan in the Amount of US$ 7.0 million Equivalent to the Independent State of Papua New Guinea for Gas Development and Utilization Technical Assistance Project (Report No: 20156- PNG) WB, 2003 Samoa at a Glance (September) WB, 200a Municipal Solid waste Incineration: Requirement for a Successful Project (World Bank Technical Paper No. 462; Washington; June) WB, et. al. 1992 Samoa: Issues and Options in the Energy Sector (Volume 13 of Pacific Regional Energy Assessment or PREA; prepared jointly by World Bank with UNDP/ESCAP PEDP plus ADB and Forum Secretariat) WB/UNDP, 1985 Western Samoa: Issues and Options in the Energy Sector (Joint WB / UNDP Energy Sector Management Programme; Report 5497-WSO; June) Xiaojiang Yu and Ros Taplin, undated A Survey: International Aid for Renewable Energy in the Pacific Islands Since the 1970s (prepared for GTZ about 1993, covering 8 PICs including Samoa) Zieroth, Gerhard, 2003 Feasibility Study: Possible Future Power Supply Options For Apolima Tai, Samoa (Final Report For UNDP/UNESCO Samoa; March)
Websites Visited Organisation: URL address: Topics: European Forest Institute (EFI)
www.efi.fi/cis/english/creports/papua_new_guinea.php
Forestry data
Forum Secretariat www.forumsec.org.fj Economic data; investment climate Food & Agriculture Organisation (FAO)
www.fao.org/DOCREP/003/X6900E/x6900e0q.htm & www.fao.org/DOCREP/003/X1576E/X1576E05.htm
Asia and Pacific National Forestry Programme updates for PNG
IEA International Small-Hydro Atlas
www.small-hydro.com/ Hydro data
UNESCO (portal.unesco.org/en/ev.php@URL_ID=17637&URL_DO=DO_TOPIC&URL_SECTION=201.html
Rays of Hope, covering school hybrid project
Tinytech www.tinytechindia.com Coconut Oil expelling technology

50
Annex C – EPC Generation Units (EPC 2003)
Power Station Generator Designation Type Nameplate
Rating (kW) De-Rated Capacity
(kW) Dry Season
Capacity (kW) Year
Installed
UPOLU ISLAND: No. 12 Diesel 3620 3200 1991 No. 4A Diesel 2200 2000 1996 No. 7B Diesel 4200 4000 1999 No. 5A Diesel 4200 4200 2002
Tanugamanono
No. 9A Diesel 4200 4200 2002
Sub-Total 18420 17600 17600
Total of Diesel generation 18420 17600 17600
No. 1 Hydro 2000 2000 1000 1993
Taelefaga No. 2 Hydro 2000 2000 1000 1993
Sub-Total 4000 4000 2000 Hydro 1750 1700 600 1985
Lalomauga
Hydro 1750 1700 600 1985
Sub-Total 3500 3400 1200 Fale-Ole-Fee Hydro 1740 1700 400 1981
Sub-Total 1740 1700 400 Alaoa Hydro 1045 1000 200 1959
Sub-Total 1045 1000 200 Hydro 950 700 200 1982
Samasoni
Hydro 950 700 200 1982
Sub-Total 1900 1400 400
Total of Hydro type 12185 11500 4200
TOTAL, UPOLU SYSTEM 30605 29100 21800
SAVAI’I ISLAND: No. 1A Diesel 800 800 2001 No. 2 Diesel 450 350 1992
No. 3A Diesel 800 800 2001 No. 4 Diesel 450 350 1992
No. 5A Diesel 960 960 1998 No. 6 Diesel 450 350 1992
Salelologa
No. 7A Diesel 800 400 1997
Sub-Total 4710 4010 No. 1 Diesel 140 120 1990 No. 2 Diesel 200 190 1990
Vaipouli
No. 3 Diesel 260 150 1994
Sub-Total 600 460
Total of Diesel generation Savai’i 5310 4470
TOTAL OF SAVAI’I SYSTEM 5310 4470 4470
MANONO ISLAND: No. 1 Diesel 42 36 1994
Manono No. 2 Diesel 42 36 1994
TOTAL MANONO 84 72 72
APOLIMA ISLAND:
Apolima No. 1 Diesel 25 22 1996 GRAND TOTAL 36024 33664 26364

51
Annex D – 1998 and 2008 ADB Energy Balance Estimates for Samoa These are slightly reformatted from Samoa Energy Sector Overview and Policy Recommendations: Final Report (prepared by Chris Cheatham; TA 2985-SAM; ADB; February 1999)
Original Units 1998
Fuelwood* Coconut
Residues* Total
Biomass* Hydro
Electricity Electricity Petrol*
* DPK-
Jet DPK-
Domestic ADO Avgas
*** LPG Total
Petroleum (tonnes) (tonnes) (tonnes) (GWh) (GWh) (kl) (kl) (kl) (kl) (kl) (kl) (kl) Primary Supplies: Production 37,321 152,276 189,597 36.10 Imports 28,200 7,000 1,820 33,370 300 600 71,290 GROSS AVAILABLE 37,321 152,276 189,597 36.10 0.00 28,200 7,000 1,820 33,370 300 600 71,290 Conversions: Power Generation - - -36.10 82.95 -11,729 -11,729 Transmission/Distribution Losses**** -15.90 NET SUPPLIED 37,321 152,276 189,597 0.00 67.05 28,200 7,000 1,820 21,641 300 600 59,561 Final Consumption: Domestic 23,992 96,138 120,129 25.41 1,820 600 2,420
Transport (including fishing) 28,200 7,000 21,541 300 57,041
Government/Commercial 26.49 Industrial 5.95 100 100 Agro-industries 13,330 56,138 69,468 Others 9.12 TOTAL 37,321 152,276 189,597 0.00 66.98 28,200 7,000 1,820 21,641 300 600 59,561
'000 TOE 1998
Fuelwood* Coconut
Residues* Total
Biomass* Hydro
Electricity Electricity Petrol*
* DPK-Jet DPK-
Domestic ADO Avgas
*** LPG Total
Petroleum Total
Energy Primary Supplies: Production 15.67 50.25 65.93 9.03 74.96 Imports 22.78 6.15 1.56 29.75 0.23 0.26 60.73 60.73 GROSS AVAILABLE 15.67 50.25 65.93 9.03 22.78 6.15 1.56 29.75 0.23 0.26 60.73 135.68 Conversions: Power Generation - - -9.03 20.75 -11.72 -11.72 - Transmission/Distribution Losses**** -3.98 -3.98 NET SUPPLIED 15.67 50.25 65.93 - 16.77 22.78 6.15 1.56 18.03 0.23 0.26 49.01 131.71 Final Consumption: Domestic 10.08 31.73 41.80 6.36 1.56 0.26 1.82 49.98
Transport (including fishing) 22.78 6.15 17.94 0.23 47.09 47.09
Government/Commercial 6.63 6.63 Industrial 1.49 0.09 0.09 1.58 Agro-industries 5.60 18.53 24.13 24.13 Others 2.28 2.28 TOTAL 15.67 50.25 65.93 - 16.75 22.78 6.15 1.56 18.03 0.23 0.26 49.01 131.69 * No direct measures of biomass consumption have been made. These figures are extrapolated from the 1989 values, using the population growth rate. ** Either Premium Motor Spirit or Unleaded Premium *** Assumed constant.

52
Original Units 2008
Fuelwood* Coconut Residues*
Total Biomass*
Hydro Electricity Electricity Petrol** DPK-
Jet DPK-
Domestic ADO Avgas*** LPG*** Total Petroleum
(tonnes) (tonnes) (tonnes) (GWh) (GWh) (kl) (kl) (kl) (kl) (kl) (kl) (kl) Primary Supplies: Production 39,191 159,904 199,095 57.52 Imports 36,872 7,000 1,815 53,619 300 600 100,206 GROSS AVAILABLE 39,191 159,904 199,095 57.52 0.00 36,872 7,000 1,815 53,619 300 600 100,206 Conversions:
Power Generation -57.52 148.56 -24,711 -24,711
Transmission/Distribution Losses**** -20.80 NET SUPPLIED 39,191 159,904 99,095 0.00 127.76 36,872 7,000 1,815 28,907 300 600 75,494 Final Consumption:
Domestic 25,193 92,000 117,193 48.47 1,815 600 2,415
Transport (including fishing) 36,872 7,000 28,744 300 72,916
Government/Commercial 50.53 Industrial 11.35 163 163 Agro-industries 13,997 53,722 67,719 Others 17.41 TOTAL 39,191 145,722 184,913 0.00 127.76 36,872 7,000 1,815 28,907 300 600 75,494
'000 TOE 2008
Fuelwood* Coconut Residues*
Total Biomass*
Hydro Electricity Electricity Petrol** DPK-
Jet DPK-
Domestic ADO Avgas*** LPG*** Total Petroleum
Total Energy
Primary Supplies: Production 16.46 52.77 69.23 14.39 83.62 Imports 29.78 6.15 1.59 47.80 0.23 0.26 85.81 85.81 GROSS AVAILABLE 16.46 52.77 69.23 14.39 - 29.78 6.15 1.59 47.80 0.23 0.26 85.81 169.43 Conversions: Power Generation -14.39 37.16 -22.77 -22.77 - Transmission/Distribution Losses**** -5.20 -5.20 NET SUPPLIED 16.46 52.77 69.23 - 31.96 29.78 6.15 1.59 25.03 0.23 0.26 63.04 164.23 Final Consumption: Domestic 10.58 33.31 43.90 12.12 1.59 0.26 1.85 57.87 Transport (including fishing) 29.78 6.15 24.88 0.23 61.04 61.04 Government/Commercial 12.64 12.64 Industrial 2.84 0.15 0.15 2.98 Agro-industries 5.88 19.46 25.33 25.33 Others 4.35 4.35 TOTAL 16.46 52.77 69.23 - 31.96 29.78 6.15 1.59 25.03 0.23 0.26 63.04 164.23 *No direct measures of biomass consumption have been made. These figures are extrapolated from the 1989 values, using the population growth rate. **Either Premium Motor Spirit or Unleaded Premium ***Assumed constant. ****Includes station use. Distribution losses including station use are assumed to decline from about 20 percent of gross generation in 1998 to 14 percent by 2008.


