A climate change partnership of GEF, UNDP, SPREP and … Millions of Watts (Megawatts) MWr Megawatts...
78
Pacific Islands Renewable SPREP Energy Project PIREP our islands, our lives… Pacific Regional Energy Assessment 2004 An Assessment of the Key Energy Issues, Barriers to the Development of Renewable Energy to Mitigate Climate Change, and Capacity Development Needs for Removing the Barriers KIRIBATI National Report A climate change partnership of GEF, UNDP, SPREP and the Pacific Islands U DP N The Secretariat of the Pacific Regional Environment Programme Volume 5
Transcript of A climate change partnership of GEF, UNDP, SPREP and … Millions of Watts (Megawatts) MWr Megawatts...

Pacific Islands Renewable SPREP Energy Project
PIREPour islands, our lives…
Pacific Regional Energy Assessment
2004An Assessment of the Key Energy Issues,
Barriers to the Development of Renewable Energyto Mitigate Climate Change, and Capacity
Development Needs for Removing the Barriers
KIRIBATINational Report
A climate change partnership of GEF, UNDP, SPREP and the Pacific Islands
U
D P
N
Th
e Se
cret
aria
t of
th
e Pa
cifi
c R
egio
nal
En
viro
nm
ent
Pro
gram
me
Volume 5
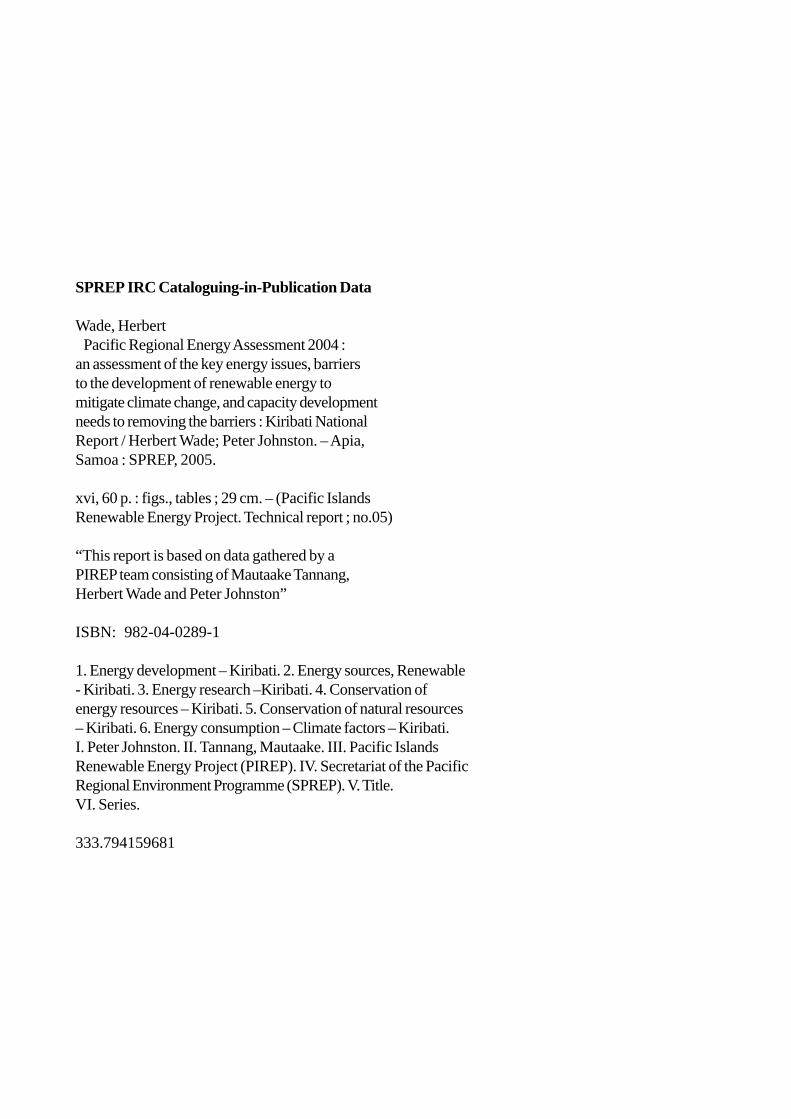
SPREP IRC Cataloguing-in-Publication Data
Wade, Herbert Pacific Regional Energy Assessment 2004 :an assessment of the key energy issues, barriersto the development of renewable energy tomitigate climate change, and capacity developmentneeds to removing the barriers : Kiribati NationalReport / Herbert Wade; Peter Johnston. – Apia,Samoa : SPREP, 2005.
xvi, 60 p. : figs., tables ; 29 cm. – (Pacific IslandsRenewable Energy Project. Technical report ; no.05)
“This report is based on data gathered by aPIREP team consisting of Mautaake Tannang,Herbert Wade and Peter Johnston”
ISBN: 982-04-0289-1
1. Energy development – Kiribati. 2. Energy sources, Renewable- Kiribati. 3. Energy research –Kiribati. 4. Conservation ofenergy resources – Kiribati. 5. Conservation of natural resources– Kiribati. 6. Energy consumption – Climate factors – Kiribati.I. Peter Johnston. II. Tannang, Mautaake. III. Pacific IslandsRenewable Energy Project (PIREP). IV. Secretariat of the PacificRegional Environment Programme (SPREP). V. Title.VI. Series.
333.794159681

i
Currency Equivalent: One Australian Dollar ≈ 0.79 US Dollars February 2004
Fiscal Year: January to December
Time Zone: GMT/UTC +12 (Gilberts), -11 (Phoenix), -10 (Line)
This report is based on data gathered by a PIREP team consisting of:
Mautaake Tannang, (National PIREP Coordinator),
Herbert Wade (International Consultant/Team Leader)
and
Peter Johnston, (International Consultant)
The international consultants visited Kiribati 9-14 February and 21-24 February, 2004
An earlier draft of this report was reviewed by the Kiribati Government, Secretariat of the Pacific Regional Environment Programme (SPREP), the United Nations Development Programme (UNDP) and others, however, the contents are the responsibility of the undersigned and do not necessarily represent the views of the Government of Kiribati, SPREP, UNDP, the Global Environment Facility or the individuals who kindly provided the information on which this assessment is based.
Herbert Wade
Peter Johnston
October 2004

ii
ACRONYMS AAGR Average Annual Growth Rate AC Alternating Current ACP African, Caribbean, Pacific countries ADB Asian Development Bank ANZ Australia New Zealand Banking Corporation BoK Bank of Kiribati CCA Common Country Assessment (of the UN) CIA Central Intelligence Agency (USA) CEMA Commodities Export Monitoring Authority CROP Council of Regional Organisations of the Pacific DBK Development Bank of Kiribati DANIDA Denmark International Development Agency DC Direct Current DSM Demand Side Management for efficient electricity use EC European Community EIA Environmental Impact Assessment EEZ Extended Economic Zone ENSO El Niño/El Niña oceanic climate cycle EPU Energy Planning Unit (GoK) ESCAP Economic and Social Commission for Asia and the Pacific (UN) EU European Union EWG Energy Working Group of CROP FSPK Foundation for the Peoples of the South Pacific, Kiribati GDP Gross Domestic Product GEF Global Environment Facility GHG Greenhouse Gas GMT/UTC Greenwich Mean Time/Universal Time Coordinate GNP Gross National Product GoK Government of Kiribati HF High Frequency Hp Horsepower IIEJ Institute of Energy Economics, Japan IMF International Monetary Fund JICA Japan International Cooperation Agency KCMC Kiribati Copra Marketing Company KOIL Kiribati Oil Company kV Kilo-Volts (thousands of volts) kVA Kilo-Volt-Amperes (Thousands of Volt Amperes of power) kW Kilo-Watt (Thousands of Watts of power) kWh Kilo-Watt-Hour (Thousands of Watt Hours of energy) kWp Kilo-Watts peak power (at standard conditions) from PV panels LPG Liquefied Petroleum Gas MCI&T Ministry of Commerce, Industry and Tourism MDG Millennium Development Goals MELAD Ministry of Environment, Lands and Agriculture MW&U Ministry of Works and Utilities MWE Ministry of Works and Energy (now the MPW&U) MW Millions of Watts (Megawatts) MWr Megawatts of wind capacity at the wind speed used for rating NDS National Development Strategy NOAA National Oceanographic and Atmospheric Administration (USA) OTEC Ocean Thermal Energy Conversion PIC Pacific Island Country PACER Pacific Agreement on Closer Economic Relations PEDP Pacific Energy Development Programme (UN 1982-1993) PICCAP Pacific Islands Climate Change Assistance Programme (GEF/UNDP) PICTA Pacific Island Countries Trade Agreement PIEPSAP Pacific Islands Energy Policies and Strategic Action Planning

iii
PIFS Pacific Islands Forum Secretariat PIREP Pacific Island Renewable Energy Project (GEF/UNDP) PPA Pacific Power Association PREA Pacific Regional Energy Assessment (1992) PREFACE Pacific Rural/Renewable Energy France-Australia Common Endeavour PUB Public Utilities Board PV Photovoltaic REC Rural Electrification Company (proposed to replace the SEC) RERF Revenue Equalisation Reserve Fund SEC Solar Energy Company SHS Solar Home System SOPAC South Pacific Applied Geoscience Commission SPC Secretariat of the Pacific Communities SPREP Secretariat of the Pacific Regional Environment Programme SWH Solar Water Heater SWOT Strengths, Weaknesses, Opportunities and Threats toe tonnes of oil equivalent TSKL Telecom Services of Kiribati Limited UNDP United Nations Development Programme UNEP United Nations Environment Programme UNESCO United Nations Educational, Scientific and Cultural Organization USP University of the South Pacific V Volts WB World Bank Wh Watt hours of energy
iv
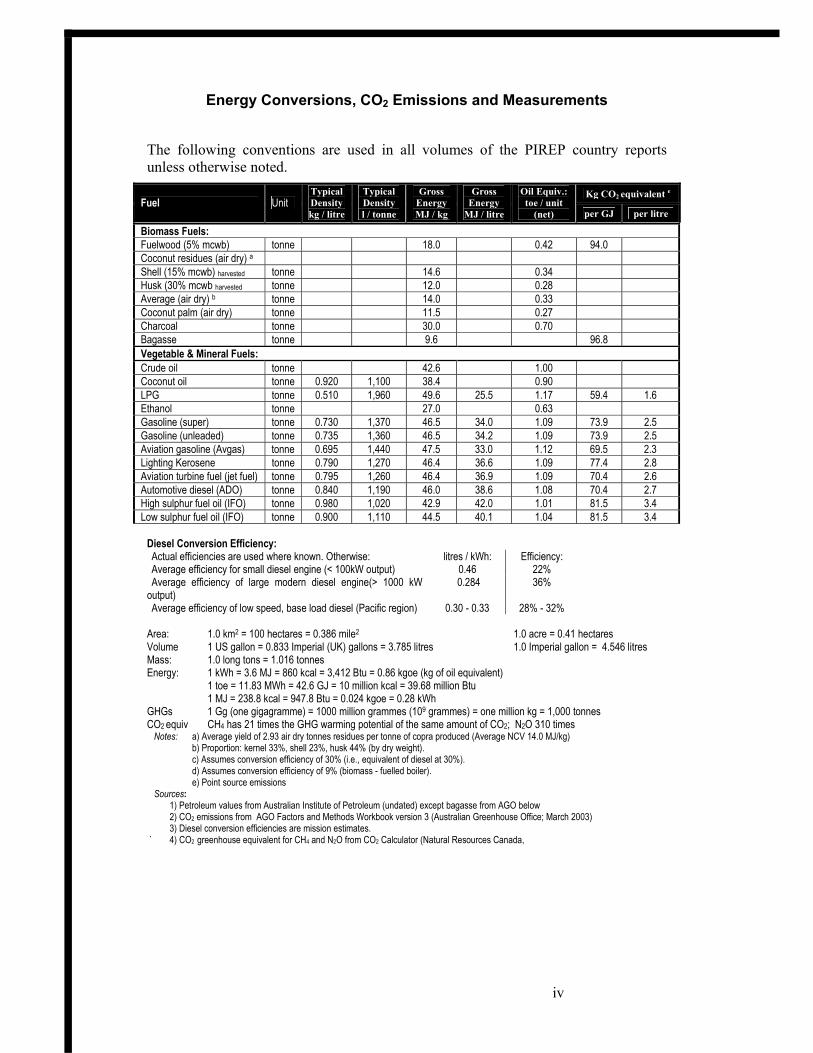
Energy Conversions, CO2 Emissions and Measurements
The following conventions are used in all volumes of the PIREP country reports unless otherwise noted.
Kg CO2 equivalent e Fuel Unit
TypicalDensitykg / litre
Typical Density l / tonne
Gross EnergyMJ / kg
Gross Energy
MJ / litre
Oil Equiv.:toe / unit
(net) per GJ per litre
Biomass Fuels: Fuelwood (5% mcwb) tonne 18.0 0.42 94.0 Coconut residues (air dry) a Shell (15% mcwb) harvested tonne 14.6 0.34 Husk (30% mcwb harvested tonne 12.0 0.28 Average (air dry) b tonne 14.0 0.33 Coconut palm (air dry) tonne 11.5 0.27 Charcoal tonne 30.0 0.70 Bagasse tonne 9.6 96.8 Vegetable & Mineral Fuels: Crude oil tonne 42.6 1.00 Coconut oil tonne 0.920 1,100 38.4 0.90 LPG tonne 0.510 1,960 49.6 25.5 1.17 59.4 1.6 Ethanol tonne 27.0 0.63 Gasoline (super) tonne 0.730 1,370 46.5 34.0 1.09 73.9 2.5 Gasoline (unleaded) tonne 0.735 1,360 46.5 34.2 1.09 73.9 2.5 Aviation gasoline (Avgas) tonne 0.695 1,440 47.5 33.0 1.12 69.5 2.3 Lighting Kerosene tonne 0.790 1,270 46.4 36.6 1.09 77.4 2.8 Aviation turbine fuel (jet fuel) tonne 0.795 1,260 46.4 36.9 1.09 70.4 2.6 Automotive diesel (ADO) tonne 0.840 1,190 46.0 38.6 1.08 70.4 2.7 High sulphur fuel oil (IFO) tonne 0.980 1,020 42.9 42.0 1.01 81.5 3.4 Low sulphur fuel oil (IFO) tonne 0.900 1,110 44.5 40.1 1.04 81.5 3.4
Diesel Conversion Efficiency: Actual efficiencies are used where known. Otherwise: litres / kWh: Efficiency: Average efficiency for small diesel engine (< 100kW output) 0.46 22% Average efficiency of large modern diesel engine(> 1000 kW output)
0.284 36%
Average efficiency of low speed, base load diesel (Pacific region) 0.30 - 0.33 28% - 32% Area: 1.0 km2 = 100 hectares = 0.386 mile2 1.0 acre = 0.41 hectares Volume 1 US gallon = 0.833 Imperial (UK) gallons = 3.785 litres 1.0 Imperial gallon = 4.546 litres Mass: 1.0 long tons = 1.016 tonnes Energy: 1 kWh = 3.6 MJ = 860 kcal = 3,412 Btu = 0.86 kgoe (kg of oil equivalent) 1 toe = 11.83 MWh = 42.6 GJ = 10 million kcal = 39.68 million Btu 1 MJ = 238.8 kcal = 947.8 Btu = 0.024 kgoe = 0.28 kWh GHGs 1 Gg (one gigagramme) = 1000 million grammes (109 grammes) = one million kg = 1,000 tonnes CO2 equiv CH4 has 21 times the GHG warming potential of the same amount of CO2; N2O 310 times Notes: a) Average yield of 2.93 air dry tonnes residues per tonne of copra produced (Average NCV 14.0 MJ/kg) b) Proportion: kernel 33%, shell 23%, husk 44% (by dry weight). c) Assumes conversion efficiency of 30% (i.e., equivalent of diesel at 30%). d) Assumes conversion efficiency of 9% (biomass - fuelled boiler). e) Point source emissions Sources:
1) Petroleum values from Australian Institute of Petroleum (undated) except bagasse from AGO below 2) CO2 emissions from AGO Factors and Methods Workbook version 3 (Australian Greenhouse Office; March 2003) 3) Diesel conversion efficiencies are mission estimates. ` 4) CO2 greenhouse equivalent for CH4 and N2O from CO2 Calculator (Natural Resources Canada,

v
EXECUTIVE SUMMARY
1. Country Context Physical Description. Kiribati includes one raised coral island (Banaba) and 32 atolls in three island groups (Gilbert, Line and Phoenix) that are spread over an ocean area 4,200 km east to west and 2,000 km north to south including a total land area of 811 km2. Both the Equator and the 180th meridian pass through Kiribati. The capital is on Tarawa in the Gilbert group. Kiribati exemplifies the development challenges facing a small, remote and resource-poor island state during a period of rapid global change.
Social. The 2000 census counted 84,494 residents representing an annual growth rate of 1.7%. The urban area of Tarawa grew at an annual rate of 5.2% while rural population fell at 0.6% per year over the past decade. In 2000, the 36,717 person Tarawa population represented 43% of the total population of Kiribati. The dense and growing population of the urban areas represents a major problem for service delivery and environmental protection. To relieve that pressure, the Government of Kiribati (GoK) has encouraged migration to Kiritimati for over 20 years. Emigration to the other Line Islands has also been encouraged though incentives have been dropped now that their population appears optimum. Now relocation to the Phoenix Islands is being encouraged. The rapid growth of the urban population on both Tarawa and Kiritimati also represents very rapid growth in the energy sector on those two islands. For the rest of Kiribati, the population is expected to remain fairly stable or even to decline. Any increase in outer island energy demand is expected to be more related to increased income than increased population.
Free education is provided from pre-school through to form six. Post secondary learning is available at the USP centre on Tarawa and vocational training is available in several technical areas at the Tarawa Technical Institute (TTI). The well respected Marine Training Centre provides high quality training for work in the European merchant marine and the Japanese fishing fleet. Remittances from seamen are a major source of cash on outer islands.
Environment. The climate is maritime equatorial with temperatures changing little over the years. Daytime averages are in the thirties and night time averages in the twenties. Rainfall varies from north to south with the Phoenix group in the south particularly dry with only around 800mm per year while the northernmost islands receive as much as 3000 mm/year. All of Kiribati, but especially the Line Islands, are affected by the El Niño/El Niña cycle (ENSO) and suffer cyclic droughts. Winds are moderate, seasonal and variable. Cyclones are not a problem in Kiribati with extended droughts the primary natural hazard. Rainwater is the main source of potable water with brackish atoll lens water often used for washing. South Tarawa provides piped water sourced from the atoll fresh water lens and appears to be near the limit that can be pumped from the lens without salt water encroachment. Kiribati is a signatory to most treaties and conventions relating to environmental protection and has a special interest in climate change prevention since even a modest rise in sea level endangers the low lying atoll islands.
Historical and Political. Kiribati was probably first settled over 2000 years ago. Kiribati is at the cross-roads of the Pacific and Polynesian, Micronesian, Asian and European cultures have all contributed to the development of modern Kiribati.
The first recorded European visit was in 1606 but there was little contact until the 1700s when trade began. Catholic and Protestant missionaries arrived in the mid

vi
1800s. Unfortunately, the slaving ships of South America – the Blackbirders – also visited in the mid 1800s and carried away many able bodied men from some islands of Kiribati. In 1892, the Gilbert Islands became a protectorate of Great Britain and in 1900 Banaba was annexed because of its major rock phosphate resource. The removal of the phosphate left the island without the resources needed to support the population and after World War II, most of the Banabans were moved to Rabi Island in Fiji. Also relocated were Phoenix island residents who were moved to the Solomon Islands due to water supply problems.
In 1916, the Gilbert and Ellice Islands became a crown colony. At the same time the the Line Islands were brought into the colony. The Phoenix Islands were added in 1937 completing the collection of islands that makes up present day Kiribati.
Kiribati was taken over by the Japanese during World War II and Tarawa was the site of a fierce World War II battle. After the war, Kiritimati Island was the site of the British-American atmospheric hydrogen bomb tests in the 1950s and 60s. There were no surface tests as was the case in the Marshall Islands, so no contamination remains.
Independence was gained on 12 July, 1979 with government organized in the Westminster format. The head of state is the president. A unicameral legislature has 42 seats with 39 elected to four -year terms by popular vote. The attorney general is an ex-officio member, one representative is appointed to represent Banaba and one other member is appointed. Today traditional government remains a strong force, particularly on the outer islands.
On outer islands, power is vested in an island council, typically elder men who represent the villages on the island.
Economic Overview. Phosphate, once the leading source of income, was mined out in 1979 though some income from a phosphate reserve fund established in 1956 is still present. Outer islands remain mostly in a traditional subsistence and barter economy, only Tarawa and Kiritimati can be considered as full participants in the money economy. Although by conventional poverty definitions, rural residents are often considered impoverished, there is strong evidence that the average quality of life as well as length of life is often better on rural islands than in urban Tarawa. True poverty, where there are problems in meeting basic human needs, is more common in urban areas than rural areas of Kiribati.
Drought is the primary variable factor in the subsistence economy and market prices for copra and the sale of fishing licenses to foreign fishing vessels are the variables in the money economy. As is typical of atolls, the agricultural base is narrow with coconuts, breadfruit, pandanus and giant taro the only significant land based food resources. The sea is the main resource and around 80% of households consider fishing as their main economic activity.
All islands of the Gilberts have airports and are reached by scheduled flights of 20-30 seat aircraft, typically once or twice a week. The nearest large markets are Honolulu and Brisbane, both around 4000 km from Tarawa. A major problem for the GoK is travel between Kiritimati and Tarawa. There is insufficient traffic to support direct flights and travel between the two urban centres of Kiribati is complicated and expensive with stopovers in Majuro and Honolulu typically required.
Total GDP in 2002 was around $67m dollars after subsistence fishing is added in. The growth rate of the economy has been very variable, dependent as it is on external markets and weather with an average annual growth of 1.4% though as high as 12.6%
vii
in one year (1998). Investment income is currently about a third of GDP. About 20% of the population participates in the formal wage economy that accounts for over 90% of GDP. Nearly 80% of paid employment is for the government or for government owned enterprises.
The National Development Strategy (2004-2007) is intended to allow Kiribati to reach the Millennium Development Goals through economic growth, equitable distribution of development benefits, improving the efficiency of public enterprises, expanding of practical training and health services, sustainable use of resources and protecting and effectively using financial reserves at the national level and in villages.
Both local and foreign private sector investment is encouraged. The Development Bank of Kiribati emphasizes loans for economic development while the Bank of Kiribati is a full service commercial bank.
Institutional and Legal Arrangements for Energy. The Ministry of Works and Utilities is responsible for meeting the energy needs of the country in a sustainable manner. The Ministry is to provide and maintain a resource centre that promotes the development of renewable energy resources and encourages energy efficiency.
The Energy Planning Unit (EPU) is responsible for energy policy development and coordination and providing advice and assistance in all energy activities.
The Public Utilities Board (PUB) is responsible for the provision of water, electricity and sewage services for South Tarawa.
The Solar Energy Company (SEC) is the provider of electrical services for rural areas through the sale or lease of solar photovoltaic systems. There has been approval in principle for the SEC to become the Rural Electrification Company with responsibilities to include conventional as well as renewable energy sources.
The Kiribati Oil Company (KOIL) imports, stores and distributes petroleum products. A maximum wholesale price is set by government with quarterly adjustment. Maximum retail prices are also set by government, typically immediately after a wholesale price adjustment is made.
The GoK has provided investment and operating subsidies for KOIL and PUB. The SEC has received major capital subsidies from external donors, primarily JICA and the EU, but operates without a subsidy.
A National Energy Policy has not been approved. Energy related legislation includes:
• The Public Utilities Act of 1977 revised in 1998
• The Prices Ordinance of 1976 revised in 1981
• The Environment Act of 1999 2. Energy Energy Supply. Though biomass used for cooking and crop drying provides around 25% of the gross national energy production, Kiribati is highly dependent on petroleum imports for electricity generation for urban areas, land transport, sea transport and air transport. Though solar power is a significant energy source for the outer islands, overall it produces less than 1% of the total energy used by Kiribati.
In 2003 about 4.9 ML of petrol, 2 ML of kerosene and 9 ML of ADO was delivered to Kiribati customers. Since the rural islands depend on solar and biomass for energy,

viii
the growth of petroleum imports is almost entirely due to increased population and services growth on Tarawa and, to a much smaller extent, on Kiritimati.
Petroleum is supplied by Mobil and BP from Fiji. Supply to the outer islands is by 200 litre drums and shipping problems sometimes cause shortages. Small quantities and long distances drive up the landed price making petroleum in Kiribati more expensive that most other PICs. LPG is not yet a major import fuel though its use is growing rapidly on Tarawa. LPG is provided both by KOIL and Kirigas, a private company that has about 40% of the market share.
Fuel used for aviation and the PUB are exempt from tax. Kerosene also is duty free. Petrol and ADO are taxed at $0.07 and $0.06 per litre respectively.
The power system on Tarawa is currently in the last stages of being upgraded under JICA funding. About 6.5MW of generation is installed with about 3.85 MW available and a new 1.25 MW addition will be made in 2004. The two main power plants are located in Betio and Bikenibeu. Tariffs are updated regularly to keep up with changes in fuel prices. In 2003, the tariffs were $0.37 per kWh for domestic customers and $0.47 for others.
Energy Demand
Energy use is dominated by Tarawa and Kiritimati. For the outer islands, the per-capita energy use is very low. Electricity in rural areas comes from solar home systems except for government housing around the island council offices where a small generator may be operated a few hours a day. Petroleum use is mainly kerosene used for lighting or cooking and to operate a few motorcycles and outboard powered boats. Traditional sailing canoes are used extensively for subsistence fishing keeping petrol use low on outer islands.
As in most of the PICs, it appears that traditional uses of biomass no longer provide most of the overall energy used by the country though it still dominates energy use on the outer islands. Coconut husks, shells and fuel wood are used for cooking and crop drying. Copra production usually produces more biomass waste than is used so there does not seem to be any problem of scarcity or deforestation though the premium firewood species, such as mangrove, have become scarce in some areas. Rough estimates put biomass use as about 4000 tonnes of oil equivalent per year, comparable to the fuel used for electricity production.
Tarawa electricity demand in 2003 was 55% government, 30% domestic and 15% commercial. Since there is no significant tourist industry, commercial uses are mostly for stores and offices. JICA predicts a slowing of the 8% electricity growth rate to 3% over the next decade but the PIREP team considers this too low and estimates a 4.5% growth for that period with the rate of demand growth on Kiritimati higher than that on Tarawa. With 2003 generation on Tarawa 15.9 GWh, that means a use of around 4.4 ML of ADO for electricity production. Production figures for Kiritimati were not available but generation is a fraction of that of Tarawa.
In 2003, at least 500 outer island households used solar energy for lighting and operating radios and other small appliances. The SEC operated about 325 of them and the rest were installed privately. By the end of 2005 with the completion of the EU outer islands electrification project, the number will have reached more than 2000 with most of them operated by the SEC. Typical installations include a 100 Wp panel and 100 Ah battery.

ix
Future Growth in Energy Demand and GHG Emissions. Since almost all the GHG emissions occur on the urban islands, any reduction in GHG emissions will have to be through energy efficiency improvements or the use of grid connected renewable energy systems. Easily the largest potential for GHG reduction is the conversion from diesel fuel to biofuels based on coconut oil. The team estimates that as much as 85% of ADO used for electricity in 2013 could be offset by the use of biofuels and another 15% by solar and wind. Since the use of electricity on a per-capita basis is quite low, it seems unlikely that energy efficiency measures would save more than 10% of electricity use (most of that by government) and 5% of transport use by 2013. 3. Potential for Renewable Energy Technologies Solar Though the resource varies somewhat from north to south with the southern islands having a larger and more constant resource, the level of solar energy for all of Kiribati is very good with estimates for some islands indicating over 6 kwh/m2/day is available for water heating or electricity generation. Since all of Kiribati is close to the equator, annual variation is not great though there is likely to be some cyclic change due to the El Niño/El Niña climate cycle.
Biomass. Biomass is sufficient to provide cooking and crop drying energy without fear of depletion on all islands except Tarawa. If the coconut resource is rehabilitated, a major replanting programme will be necessary to replace senile trees and a significant amount of biomass will be made available in the form of the senile trees that are cut down. However, using that resource for energy on the outer islands would require a major infrastructure investment and may not be the most economic use of the resource since converting the trees to finished wood products for construction or furniture manufacture has good economic potential.
Biofuel. Unlike many PICs, copra remains a major cash generating product for the outer islands. A new coconut oil mill owned by a government corporation operates on Tarawa with a current oil production capacity of about 700 tonnes/month. The production projected for 2004 is 2700 tonnes of oil. Production is currently limited by copra production on the outer islands that has fallen in recent years as the export price of oil at about $530/tonne FOB Tarawa has not been high enough to encourage a high level of production or investment in replanting of senile trees. The $530 per tonne is about the same cost as diesel fuel in 2003 and with petroleum prices expected to raise in the future, the local value for the oil as a diesel replacement may be greater than its value as a food product. Its large scale use as fuel for PUB generators could provide the impetus for rehabilitation of the copra resource and major economic gain for rural islands as well as reducing Kiribati’s dependence on petroleum imports whose prices cannot be controlled.
Biogas. There is some potential for biogas generation if community pigs can be kept penned in a small area and manure collected for biogas generation. However the potential for saving fuel is small and the social and financial investment needed to make it practical is high.
Wind. Wind power has been used for water pumping in the past but solar pumping has replaced it as more reliable. The wind energy resource is poorly understood and resource surveys need to be carried out before there is any consideration of investment for wind power for power generation. Wind installations are particularly difficult for atoll islands due to their lack of significant elevation and the dominance of tall coconut trees over most land areas. Installation of wind machines in shallow

x
lagoons or on the reef well away from trees may be required if wind power is to be practical for Kiribati.
Ocean Thermal Energy Conversion (OTEC). There is significant OTEC resource in Kiribati but there have yet to be any successful commercial trials of OTEC systems and it appears very unlikely that OTEC will be economically or technically feasible on Kiribati in the next decade.
Wave. The wave resource is not great and as there are no commercially available wave energy conversion systems, wave energy is not considered a practical resource for Kiribati over the next decade.
Tidal energy. Although there is a significant flow of tidal waters through lagoon channels during tidal flow periods, its intermittent nature and the small tidal range in Kiribati does not allow cost effective development of tidal energy. 4. Experiences with Renewable Energy Technologies The traditional use of biomass for cooking and copra drying remains the largest use of renewable energy in Kiribati. Solar water heating and solar electric generation using photovoltaics is the only other renewable energy used thus far in Kiribati though biofuels offer great potential.
Solar Photovoltaics. Kiribati was one of the first countries in the world to actively promote solar energy for electrification. The Solar Energy Company (SEC) was formed in 1984 by an NGO, the Foundation for the Peoples of the South Pacific (FSP), to sell solar equipment for household lighting and small appliance use. The ownership of the company was turned over to the government after its start up and sales to outer island households were made from Tarawa. The company was funded by a USAID grant and operated with limited success, selling less than 300 solar home systems in five years. In 1989, when the company faced bankruptcy, the structure of the company was changed from a sales company to a solar utility company whereby solar installations would be made and maintained by the company, with ownership retained by SEC and electricity services sold to users for a fee.
In 1992, JICA completed a trial project of 56 households on North Tarawa managed under the solar utility institutional concept. The early success of the approach resulted in the EU adding about 250 more households to the SEC’s holdings on three islands in 1994. The continued success of the SEC to operate and maintain the systems, providing services to the rural households with no external operating subsidies, encouraged the EU to fund a large scale project that would expand the utility to 2000 homes on all the islands of the Gilbert Island group. That expansion is expected to be completed in 2005. The SEC is already considering the next expansion phase to further increase coverage in the Gilbert Islands and possibly expand to the Line Islands. In addition to household electrification, solar PV powers street lighting, health centres, schools, community buildings (maneabas), communications systems and water pumps. Though most installations are on outer islands, solar street lighting has been used successfully on South Tarawa.
The main problem facing the SEC is the dispersed nature of their responsibility, spread as it is over the 18 islands of the Gilbert group, and the problem of obtaining and maintaining adequate technical and administrative capacity on the outer islands for reliable system maintenance and fee collection.

xi
Solar Thermal. Some solar water heating has been installed on the hotels and guest houses of Tarawa and Kiritimati Islands but there has been little use in households or for other purposes. The market is limited by the cost of the units, their poor record of success (due largely to using high mineral content ground water that results in rapid buildup of scale in the water heaters) and the small demand by households for piped hot water.
Wind Power. No wind power has been developed in Kiribati, but a wind resource assessment is recommended to determine if the resource is economically developable.
Biomass, biogas and biofuels. Except for traditional biomass use for cooking and copra drying, there has been no development of biomass, biofuel or biogas for energy production. 5. Barriers to Development and Commercialisation of RETs and Energy
Efficiency Measures Barriers to Renewable Energy Development.
The barriers to renewable energy development include:
• the relative cost of renewable energy tends to be high, particularly the initial investment;
• the real cost of electricity delivery by the PUB is not known making it difficult to determine the relative economics of using renewables for power generation on Tawara; there is almost total dependence on external funding for energy projects that results in long lead times and adds complexity to implementation;
• duties and taxes are applied inconsistently for renewable energy systems;
• no National Energy Policy has been developed to show a clear path for renewable energy development;
• limited capacity is present for energy planning and project development at the EPU;
• limited capacity is present for financial planning and analysis at the PUB, SEC and KOIL;
• record keeping and data management needs improvement in the energy companies;
• there is a lack of local training capacity in business management;
• there is a lack of trained or experienced personnel for management or technical positions in energy companies, especially on outer islands;
• there are difficult environmental conditions for energy equipment;
• the population is widely dispersed on numerous atoll islands;
• international shipping by air and by sea is not reliable or of good quality;
• problems of access to outer islands makes rural development difficult and costly;
• there is a small and fragmented energy market making development of private energy related businesses difficult; and

xii
• there is a lack of public awareness regarding renewable energy and energy efficiency.
6. Implementation and Capacity Development Needs for Barrier Reduction
Capacity development and capacity support is needed for:
• project development activities;
• fiscal policy development to rationalize taxes and duties for energy related activities;
• energy policy development;
• management capacity development;
• capacity development for technical training at the TTI;
• development of record keeping, storage and retrieval capacity at PUB, KOIL and SEC;
• assistance is needed by the EPU, SEC and PUB in the development of grid connected renewable energy systems;
• development of standards and certification processes for RETs;
• delivery of renewable energy information to decision makers;and
• public information programmes. 7. Implications of Large Scale Renewable Energy Development Solar energy and biofuels are known to have the potential for large scale renewable energy development. Wind power may also be cost effective in some locations but a resource assessment is necessary to determine that potential.
The widespread use of solar for rural electrification can improve education, communications, health and public safety. For the mid-term, it appears that individual SHS represent the best approach to rural electrification in Kiribati as long as the SEC is able to provide the level of services to each household that specifically meets the needs of that customer. Since battery storage must be used, there is a requirement to recycle batteries to prevent possible environmental damage from the lead contained in spent batteries. The SEC is arranging for recycling of batteries and no adverse environmental impact on rural areas is anticipated.
The greatest potential for GHG reduction by solar energy is with grid connected photovoltaics on Tarawa and Kiritimati Islands. There are large land areas available near the airport where residences and shops are not allowed due to the use of the land for water supply purposes. The development of solar photovoltaics in that area would not affect the quality of water or reduce water availability, so large arrays could be installed without adverse social or environmental impact. The use of a number of roof-top modular generators connected to the grid also creates no negative social or environmental impacts.
Since there is presently production of coconut oil in Kiribati in substantial volume, increasing production requires mainly rehabilitation of older stands of trees, improvements in transport efficiencies and an increase in the price offered for copra. The potential economic benefit for rural communities is great and social benefits can

xiii
be expected to follow as a result. No significant adverse environmental effects are anticipated from increased oil production and a substantial decrease in GHG emissions would result. 8. Implementation of the Capacity Development Opportunities The existing EU outer island electrification project is an opportunity for co-financing of capacity building efforts as is the JICA power development project on Tarawa. No other energy projects are in the pipeline at this time but further development of the power system on Kiritimati and expansion of the SEC operations are likely to occur in the future and will offer co-financing opportunities.

xiv
TABLE OF CONTENTS
EXECUTIVE SUMMARY ............................................................................. V 1. COUNTRY CONTEXT...................................................................................1
1.1 Physical ..........................................................................................................1 1.2 Social .............................................................................................................1
1.2.1 Education ................................................................................................................3 1.3 Environmental.................................................................................................3
1.3.1 Climate ...................................................................................................................3 1.3.2 Environmental Treaties and obligations ......................................................................4
1.4 Historical and Political ......................................................................................4 1.5 Economic........................................................................................................6
1.5.1 Millennium Development Goals ..................................................................................9 1.5.2 Investment and banking ...........................................................................................9
1.6 Institutional Context for Energy ...................................................................... 10 1.6.1 EPU ......................................................................................................................11 1.6.2 PUB ......................................................................................................................11 1.6.3 SEC.......................................................................................................................11 1.6.4 KOIL .....................................................................................................................12 1.6.5 Fuel price control ...................................................................................................12 1.6.6 Energy investments and aid ....................................................................................12 1.6.7 Energy policy .........................................................................................................13 1.6.8 Energy Legislation ..................................................................................................13 1.6.9 Inter-ministerial Energy Committees ........................................................................14
2 ENERGY............................................................................................. 15 2.1 Energy Supply............................................................................................... 15
2.1.1 Petroleum..............................................................................................................15 2.1.2 Fuel storage ..........................................................................................................17 2.1.3 Duties on petroleum fuels .......................................................................................17 2.1.4 Biomass ................................................................................................................18 2.1.5 Electricity Supply....................................................................................................18
2.2 Energy Demand ............................................................................................ 19 2.2.1 Petroleum..............................................................................................................19 2.2.2 Biomass ................................................................................................................19 2.2.3 Electricity on Tarawa ..............................................................................................20 2.2.4 Electrification away from South Tarawa....................................................................21
2.3 Future Growth in Energy Demand................................................................... 21 2.3.1 Petroleum..............................................................................................................21 2.3.2 Electricity ..............................................................................................................22
2.4 GHG Inventory .............................................................................................. 23 3 RENEWABLE ENERGY................................................................................ 25
3.1 Solar ............................................................................................................ 25 3.1.1 Solar photovoltaics .................................................................................................25 3.1.2 Solar thermal .........................................................................................................26
3.2 Biomass........................................................................................................ 26 3.2.1 Biomass ................................................................................................................26 3.2.2 Biofuel ..................................................................................................................26 3.2.3 Biogas...................................................................................................................28
3.3 Wind ............................................................................................................ 28 3.4 Ocean Energy ............................................................................................... 28
3.4.1 OTEC ....................................................................................................................28 3.4.2 Wave Energy .........................................................................................................29 3.4.3 Tidal energy ..........................................................................................................30
3.5 Geothermal................................................................................................... 30 3.6 Hydro........................................................................................................... 30
4 RENEWABLE ENERGY EXPERIENCE .................................................................. 31

xv
4.1 Solar Photovoltaic Experience ......................................................................... 31 4.1.1 Solar Pumping .......................................................................................................31 4.1.2 Solar Clinic Electrification ........................................................................................32 4.1.3 School, government and maneaba electrification.......................................................32 4.1.4 Telecom ................................................................................................................32 4.1.5 Street Lighting .......................................................................................................33 4.1.6 Private sales ..........................................................................................................33 4.1.7 Solar Energy Company experience ...........................................................................33
4.2 Lessons Learned ........................................................................................... 41 4.3 Proposed Renewable Energy Projects.............................................................. 42
4.3.1 Further electrification of the Gilberts ........................................................................42 4.3.2 Wind resource assessment for Tarawa and Kiritimati .................................................42 4.3.3 Electrification in Line and Phoenix............................................................................42 4.3.4 Biofuel development...............................................................................................42 4.3.5 Grid based solar .....................................................................................................43
5 BARRIERS TO DEVELOPMENT AND COMMERCIALIZATION OF RENEWABLE ENERGY.................... 44 5.1 Specific Barriers ............................................................................................ 44
5.1.1 Fiscal and Financial Barriers ....................................................................................44 5.1.2 Legislative, Regulatory and Policy Barriers ................................................................44 5.1.3 Institutional Barriers ...............................................................................................44 5.1.4 Technical Barriers...................................................................................................46 5.1.5 Physical Barriers.....................................................................................................46 5.1.6 Market Barriers ......................................................................................................46 5.1.7 Informational and Public Awareness Barriers ............................................................47
6 IMPLEMENTATION AND CAPACITY DEVELOPMENT NEEDS FOR BARRIER REDUCTION.................. 48 6.1 Reducing Barriers Through Capacity Development............................................ 48
6.1.1 Fiscal and Financial Barriers ....................................................................................48 6.1.2 Legislative, Regulatory and Policy Barriers ................................................................48 6.1.3 Institutional Barriers ...............................................................................................48 6.1.4 Technical Barriers...................................................................................................49 6.1.5 Physical Barriers.....................................................................................................49 6.1.6 Informational and Public Awareness Barriers ............................................................49
7 IMPLICATIONS OF LARGE SCALE RENEWABLE ENERGY DEVELOPMENT................................. 51 7.1 Solar development......................................................................................... 51
7.1.1 Rural electrification.................................................................................................51 7.1.2 Urban electrification ...............................................................................................51
7.2 Wind power for urban island power production ................................................ 51 7.3 Biofuel production to offset diesel imports ....................................................... 52
8 ENERGY EFFICIENCY OPPORTUNITIES................................................................ 53 8.1 Petroleum Use Efficiency................................................................................ 53 8.2 Electricity Efficiency ....................................................................................... 53
9 CAPACITY DEVELOPMENT CO-FINANCING OPPORTUNITIES .......................................... 54 10 ANNEXES............................................................................................ 56
Annex A: People Consulted by the PIREP Mission to Kiribati ........................................ 56 Annex B: References for Kiribati PIREP Report............................................................ 58

vi
1
1. COUNTRY CONTEXT
1.1 Physical
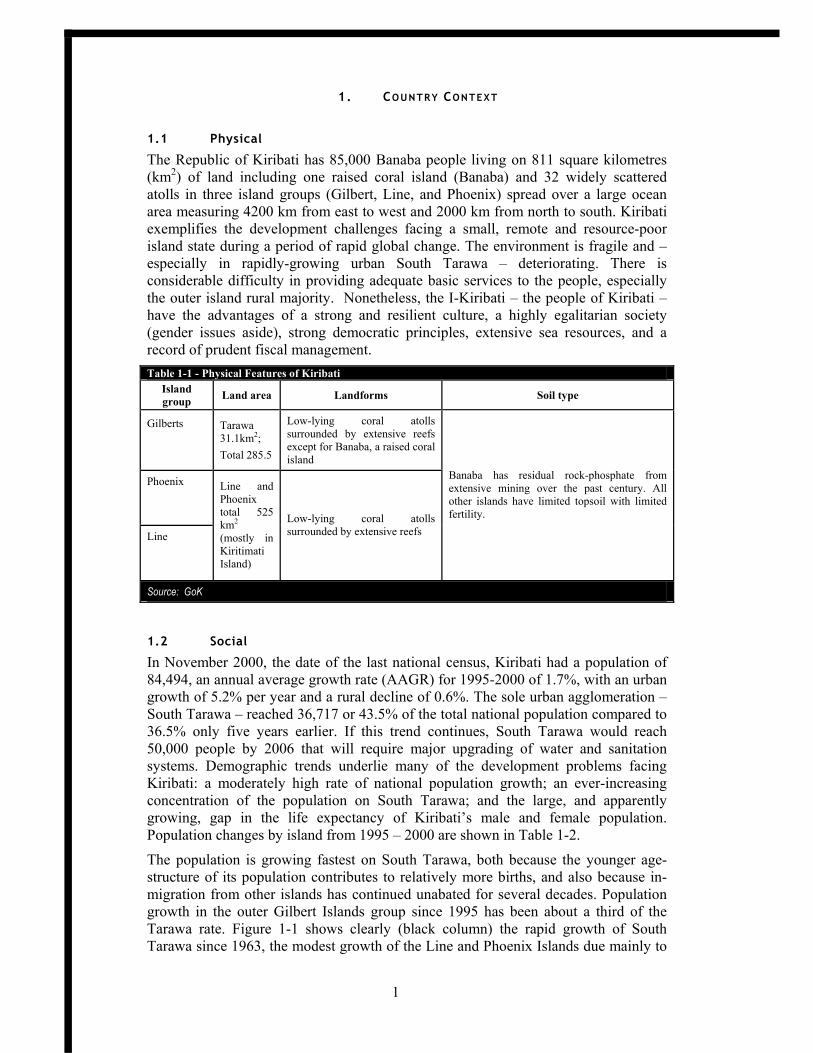
The Republic of Kiribati has 85,000 Banaba people living on 811 square kilometres (km2) of land including one raised coral island (Banaba) and 32 widely scattered atolls in three island groups (Gilbert, Line, and Phoenix) spread over a large ocean area measuring 4200 km from east to west and 2000 km from north to south. Kiribati exemplifies the development challenges facing a small, remote and resource-poor island state during a period of rapid global change. The environment is fragile and – especially in rapidly-growing urban South Tarawa – deteriorating. There is considerable difficulty in providing adequate basic services to the people, especially the outer island rural majority. Nonetheless, the I-Kiribati – the people of Kiribati – have the advantages of a strong and resilient culture, a highly egalitarian society (gender issues aside), strong democratic principles, extensive sea resources, and a record of prudent fiscal management. Table 1-1 - Physical Features of Kiribati
Island group Land area Landforms Soil type
Gilberts
Tarawa 31.1km2; Total 285.5
Low-lying coral atolls surrounded by extensive reefs except for Banaba, a raised coral island
Phoenix
Line
Line and Phoenix total 525 km2
(mostly in Kiritimati Island)
Low-lying coral atolls surrounded by extensive reefs
Banaba has residual rock-phosphate from extensive mining over the past century. All other islands have limited topsoil with limited fertility.
Source: GoK
1.2 Social
In November 2000, the date of the last national census, Kiribati had a population of 84,494, an annual average growth rate (AAGR) for 1995-2000 of 1.7%, with an urban growth of 5.2% per year and a rural decline of 0.6%. The sole urban agglomeration – South Tarawa – reached 36,717 or 43.5% of the total national population compared to 36.5% only five years earlier. If this trend continues, South Tarawa would reach 50,000 people by 2006 that will require major upgrading of water and sanitation systems. Demographic trends underlie many of the development problems facing Kiribati: a moderately high rate of national population growth; an ever-increasing concentration of the population on South Tarawa; and the large, and apparently growing, gap in the life expectancy of Kiribati’s male and female population. Population changes by island from 1995 – 2000 are shown in Table 1-2.
The population is growing fastest on South Tarawa, both because the younger age-structure of its population contributes to relatively more births, and also because in-migration from other islands has continued unabated for several decades. Population growth in the outer Gilbert Islands group since 1995 has been about a third of the Tarawa rate. Figure 1-1 shows clearly (black column) the rapid growth of South Tarawa since 1963, the modest growth of the Line and Phoenix Islands due mainly to

2
government’s relocation programmes, and the recent decline in population in the rest of Kiribati. The increased concentration of population (Figure 1-2) and economic activity on South Tarawa is having various negative effects on people’s lives on both South Tarawa and that of people on the rural islands.
According to the National Development Strategy 2004-2007 (NDS 2004-07), the population is believed to have grown by a further 6000 from 2000-2003, of which two-thirds of the growth is estimated to be in South Tarawa. The Government of Kiribati (GoK) has not formally projected future population growth or its distribution, however, NDS 2004-07 notes that demographers from the Secretariat of the Pacific Communities (SPC), using UN data showing high fertility rates and increased life expectancy, suggest a total population of 140,000-145,000 by 2025, of which around 70,000 could be in Tarawa, 20,000 in Kiritimati, and 50,000-55,000 spread among the other islands. This projection assumes an overall AAGR of 2.0-2.2% (compared to 1.7% from 1995-2000), Tarawa atoll growth of 2.8%/year (down considerably from the recent 5%), and Kiritimati growth of 7.4%/year (up dramatically from 1.2%). The
Table 1-2 - Population Size, Growth, Distribution and Density by Island (1995 and 2000) Island Population AAGR * Land
area Density
1995 2000 1990-1995
1995-2000
km2 Persons Per km2
North Tarawa 4,004 4,477 1.9 2.2 15.3 312 South Tarawa 28,350 36,717 2.2 5.2 15.8 2,324 TARAWA TOTAL 32,354 41,194 2.2 5.0 31.1 1,334 Banaba 339 276 3.5 -4.1 6.3 44 Makin 1,830 1691 0.8 -1.6 7.9 216 Butaritari 3,909 3,464 0.7 -2.4 13.5 257 Marakei 2,724 2,544 -1 -1.4 14.1 180 Abaiang 6,020 5,794 2.8 -0.8 17.5 331 Maiana 2,184 2,048 0 -1.3 16.7 123 Abemama 3,442 3,142 1.3 -1.8 27.4 114 Kuria 971 961 -0.4 -0.2 15.5 62 Aranuka 1,015 966 0.3 -1.0 11.6 83 Nonouti 3,042 3,176 1.6 0.9 19.9 159 North Tabiteuea 3,383 3,365 1.1 -0.1 25.8 130 South Tabiteuea 1,404 1,217 1.1 -2.9 11.9 102 Beru 2,784 2,732 -0.9 -0.4 17.7 155 Nikunau 2,009 1,733 0.1 -3.0 19.1 91 Onotoa 1,918 1,668 -1.8 -2.8 15.6 107 Tamana 1,181 962 -3.2 -4.1 4.7 200 Arorae 1,248 1,225 -2.9 -0.4 9.5 129 GILBERTS TOTAL 71,757 78,158 1.2 1.7 285.5 275 Teeraina 978 1,087 0.9 2.1 9.6 113 Tabuaeran 1,615 1,757 4.2 1.7 33.7 57 Kiritimati (Christmas Isl.) 3,225 3,431 4.8 1.2 388.4 9 Kanton 83 61 12.2 -6.2 9.2 7 Uninhabited 0 0 0 0 84.2 LINE and PHOENIX TOTAL 5,901 6,336 4.0 1.4 525 12 KIRIBATI TOTAL 77,658 84,494 1.4 1.7 810.5 105 Source: Report on the 2000 Census of Population (November 2001; * AAGR = average annual growth rate

3
remaining islands, essentially rural Kiribati, are expected to grow at an AAGR of 0.9-1.3 percent.
The GoK has encouraged migration to Kiritimati – with over ten times the land area of South and North Tarawa combined – for over twenty years. In the 1980s, emigration to the other islands of the Line group, Teeraina and Tabuaeran, was also encouraged with resettlement incentives but now that the populations have reached a level the government feels to be the optimum, those incentives have been dropped. Today, with the help of ADB funding, emigration to the Phoenix Islands is being promoted. Shipping to Kiritimati has recently improved, new airport facilities have been constructed and Kiritimati’s population has already increased from about 3500 to 5000 from 2000 to late 2002. If the longer-term projections are reasonably accurate, Kiritimati will double in population every ten years, suggesting a huge increase in its demand for energy. Tarawa, even at the projected decreased growth rate, would nearly double in population from 2000-2025, also suggesting a significant increase in its energy demand. The other islands, which are expected to remain nearly static in population, should continue to have relatively modest demands even if the quality of energy services increases significantly.
1.2.1 Education
Free education is available to children from pre-school through form six. Post-secondary education is available through a distance learning branch of USP and vocational-technical training in some fields is available through the Tarawa Technical Institute (TTI). Of particular value to the economy is the Marine Training Centre (MTC) where excellent training is provided for work in the European merchant marine and Japanese fishing fleet and remittances from seamen on foreign vessels forms a major source of cash for outer island families.
1.3 Environmental
1.3.1 Climate
The Equator passes through Kiribati with Tamana and Arorae and the entire Phoenix group south of the equator while the rest of the Gilberts and all the Line Islands are to the north. All islands therefore have a maritime tropical environment. The climate
Figure 1-1 - Kiribati Population By Location, 1963-2000
05000
100001500020000250003000035000400004500050000
1963 1968 1973 1978 1985 1990 1995 2000
Year
Num
ber o
f peo
ple
South Tarawa Rest of Kiribati Line & Phoenix Source: Report on 2000 Census
Figure 1-2 - Population Density 1995 & 2000
0
500
1000
1500
2000
2500
SouthTarawa
OtherTarawa
GilbertGroup
Line &Phoenix
1995 2000
Source: Report on 2000 Census

4
varies somewhat from north to south with more rainfall to the north on average with the Phoenix group averaging only around 800 mm/year while as much as 3000 mm/year may fall in the northern most islands. The entire country, but especially Kiritimati Island, finds its rainfall climate to be affected strongly by the El Niño/El Niña cycle (ENSO) as shown by the cyclic nature of droughts that correlate with the ENSO. Winds are variable and seasonal with October to March the “Aumeang” or northerly and easterly wind season, a wetter season, and April to September the “Aumaiaki” or southerly and easterly wind season. Typhoons are not a risk in Kiribati but extended droughts do occur so maintaining a fresh water supply is a continuing problem for residents. Rainwater is the primary source of potable water on most islands with often brackish atoll lens water often used for washing. South Tarawa has developed its public water supply based on ground water and appears to have reached the limit of pumping without serious salt water encroachment into the fresh water lens making water supply a high priority for the future. Temperatures changes little from month to month with daytime averages in the low 30’s and falling into the 20’s at night.
1.3.2 Environmental Treaties and obligations
Kiribati is party to various treaties and conventions related to environmental protection, including the United Nations Framework Convention on Climate Change (UNFCCC), the Kyoto Protocol, the Convention to Combat Desertification, and the Convention on Biological Diversity. An initial national communication to the UN FCCC, indicating greenhouse gas emissions, and vulnerability and adaptation to climate change, was submitted in 2000. Table 1.3 summarises the status and date of signing of some key environmental conventions. Table 1-3 - Status of Ratification of Environmental Treaties and Conventions by Kiribati
Status in Kiribati
Conservation of nature
(Apia Convention)
Hazardous wastes (Waigani
Convention)
Nuclear free Pacific
(Rarotonga Treaty)
GHG reductions (Kyoto
Protocol)
Ozone depleting substances
(Montreal Protocol, et. al.)
Signed Ratified Entered into force
√ n/a n/a
16 Sep 95 28 Jun 01 21 Oct 01
06 Aug 85 28 Oct 86 11 Dec 86
Acceded 17 Sep 00
Acceded to Vienna Convention, 07 Jan 93
Note: The above treaties and conventions are briefly described in volume 1, the PIREP Regional Overview report
1.4 Historical and Political
Probably first settled over 2000 years ago, the genetic heritage of the I-Kiribati includes both Micronesian and Polynesian ancestry though probably the early settlers were of Micronesian stock. Samoa visitations occurred centuries ago and in the 14th century Fiji and Tonga both invaded some of the islands of Kiribati adding Polynesian and Melanesian genes to the pool. In the 19th and 20th centuries, European and Asian, particularly Chinese, emigrants also have made their mark on the culture and gene pool. The language has various dialects reflecting the proximity of islands to other language groups as well as general language drifts occurring due to the relative isolation of the island populations. The advent of the radio and national schooling has tended to standardise the language and the younger generation tends to be more uniform in language than their elders.
The earliest recorded visit by Europeans was in 1606 when a Spanish explorer happened on to Butaritari. Few Europeans were seen by Kiribati residents until the late 1700s when Pacific exploration and trade began in earnest. The Gilbert Islands

5
were named in the 1820s (by a Russian hydrographer, not, as is widely believed, by the British). Whalers were the main visitors in the mid-1800s along with Catholic and Protestant missionaries. Unfortunately slaving ships, the “Blackbirders” also visited though they did not depopulate the islands as severely as occurred in parts of Tokelau and Tuvalu.
In 1892, the British declared the Gilbert Islands as a protectorate and in 1900 also annexed Banaba with its major rock-phosphate resource. The removal of the phosphate left the island essentially without resources needed to support the populace and, after World War II, most of the Banaba citizens were moved to Rabi Island off the coast of Vanua Levu in Fiji where they and their descendents remain. The population left on Banaba still consider themselves as separate from Kiribati and have in the past proposed independence. But with less than 400 residents and minimal resources, that is not an option likely to be taken. Adding complexity to the issue is the fact that most land ownership on Banaba is with families residing in Rabi and there are two local governments, one on Rabi (the Rabi Council of Leaders) representing mainly issues regarding the absentee land owners and one on Banaba itself, the Banaba Island Council that handles local social matters. Also relocated were Phoenix Islanders who, in the face of droughts and serious problems with their water supply, were moved to the Solomon Islands where there remains a sizeable I-Kiribati enclave on Guadalcanal.
In 1916, the Gilbert and Ellice Islands officially became a Crown Colony with the addition of the Line Islands. The Phoenix Islands were added in 1937 to form what is present day Kiribati.
World War Two found Kiribati to be strategically located and Japanese and American forces met in fierce battle at Betio where many relics of the war still remain. Kiritimati Island was the site of the British-American atmospheric hydrogen bomb tests in the late 1950s and early 1960s but there were no surface detonations so radioactive fallout was not a problem and, unlike in the Marshall Islands, nuclear testing has had no lasting effect on the islands.
The move to independence began in 1963 with the formation of legislative and executive councils under the supervision of a British governor- general. The legislative council later evolved into the Maneaba ni Maungatabu (Parliament) of today. In 1975, the Ellice Islands seceded to form the separate Polynesian territory of Tuvalu. The Gilbert, Line and Phoenix islands became the independent republic of Kiribati on 12 July 1979. Ieremia Tabai, a veteran of Kiribati politics, won the first three post-independence presidential elections, held in 1982, 1983 and 1987. Kiribati remains a member of the British Commonwealth of Nations.
Local, traditional government remains a strong force, particularly on the outer islands. Power is vested in an Island Council, typically composed of older men, who meet in the community hall, the maneaba, and make the decisions needed to keep island society running smoothly.
The national government has its focus on Tarawa where virtually all national government is concentrated. The President and Head of State is (2004) Anote Tong, elected by popular vote from candidates selected by parliament, to a four-year term in July 2003 when he defeated his elder brother, Harry Tong. A court challenge followed which claimed violations of laws relating to campaign finance. However, in October 2003, a neutral judge was brought in from Australia who ultimately ruled in President

6
Tong's favour. There is a 12-member cabinet appointed by the president from among the members of parliament. The Maneaba Ni Maungatabu has 42 seats, 39 elected by popular vote, one ex-officio member (the Attorney General), one appointed to represent the island of Banaba, and one other. Members serve four-year terms. The judicial system consists of a Court of Appeal, a High Court, and 26 Magistrates' courts with all judges appointed by the president.
Democratic values in Kiribati are strong with free elections every four years by universal adult suffrage. The government combines Westminster principles and customary values, with considerable influence held by the elder males. Policy formulation and decision-making are relatively open, involving widespread consultation. The overall quality of public administration has improved in recent years but the government itself identifies weaknesses in: 1) the budgeting and budget control system including data collection and analysis; 2) sectoral planning and monitoring; and 3) focus by ministries on their core functions.
1.5 Economic
Phosphate, mined on Banaba, was once the leading source of income. The national economy suffered severely when phosphate mining ceased in 1979 although Kiribati continues to receive interest income from a phosphate reserve fund established in 1956. Today, only South Tarawa and Kiritimati Islands can be considered full participants in the monetised economy. Outer islands remain largely in a subsistence based economy with individual, family and group ownership of land at its base. Even the North Tarawa population with its ready access to markets and facilities on South Tarawa remains a largely subsistence based economy. Although by conventional poverty definitions, rural residents are generally considered impoverished, there is strong evidence that the average quality of life – and indeed the length of life – is often better in rural areas. True poverty, where there is difficulty in meeting basic human needs, is more easily found on Tarawa than on the outer islands.
Kiribati is a small, isolated and geographically widespread atoll nation, categorised by the United Nations as least-developed due to low incomes, weak human resources, and a high degree of economic vulnerability. As with most PIC economies, small size and dependence on a few sectors allow large fluctuations from year to year. Changes in copra price and the sale of fishing licenses to foreign fishing operations are factors that have considerable effect on the money economy. Drought is the primary factor in the subsistence economy. The Asian Development Bank ranks Kiribati as its most economically vulnerable Pacific island member.
The agricultural base is very narrow with coconuts, breadfruit, pandanus and giant taro the only significant land based food resources. The arid climate and poor soil offer little potential for further agricultural development. Ocean resources are the mainstay of the economy, about 80% of households making a living or surviving through fishing.
The public sector dominates all spheres of economic activity. Fishing licensing fees are the major source of foreign exchange and government revenue, while import duties and remittances from I-Kiribati employed in foreign shipping fleets provide significant additional government revenue and foreign exchange, respectively. Transport within Kiribati is limited and is primarily by boat though all islands of the Gilberts have airports and scheduled flights by 20-30 seat aircraft. The nearest large markets are in Honolulu and Brisbane, around 4000 kilometres from Tarawa. A major
7
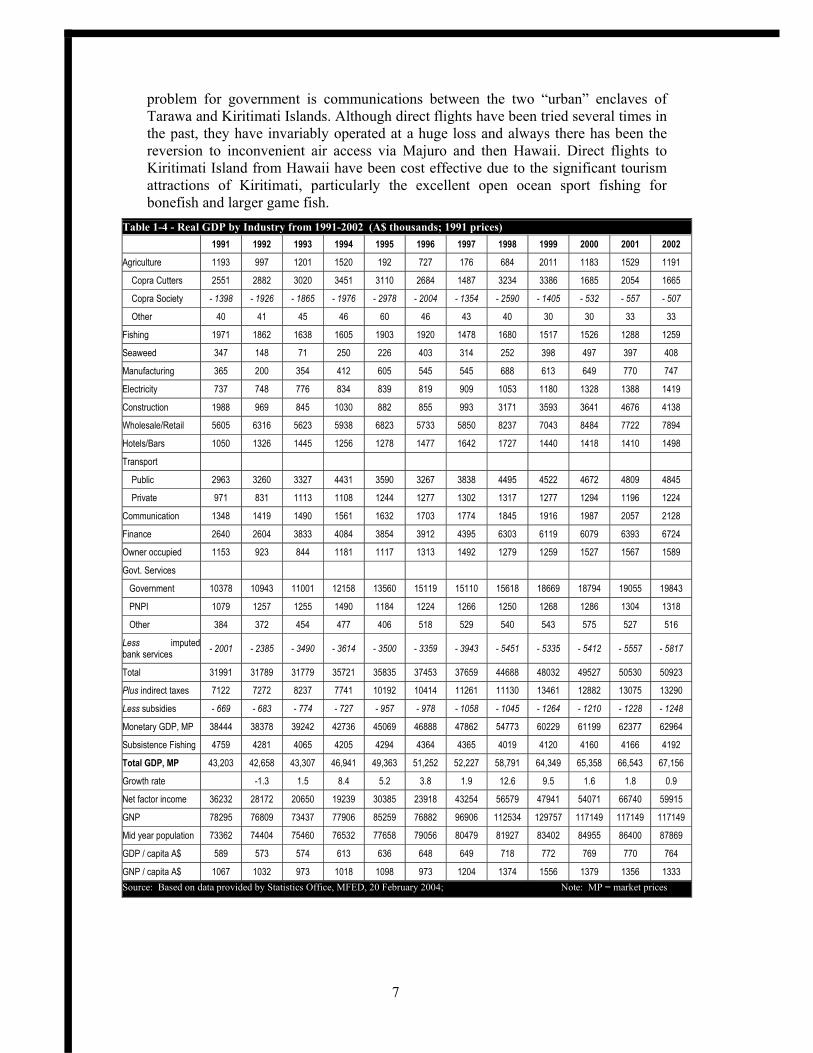
problem for government is communications between the two “urban” enclaves of Tarawa and Kiritimati Islands. Although direct flights have been tried several times in the past, they have invariably operated at a huge loss and always there has been the reversion to inconvenient air access via Majuro and then Hawaii. Direct flights to Kiritimati Island from Hawaii have been cost effective due to the significant tourism attractions of Kiritimati, particularly the excellent open ocean sport fishing for bonefish and larger game fish.
Table 1-4 - Real GDP by Industry from 1991-2002 (A$ thousands; 1991 prices) 1991 1992 1993 1994 1995 1996 1997 1998 1999 2000 2001 2002
Agriculture 1193 997 1201 1520 192 727 176 684 2011 1183 1529 1191
Copra Cutters 2551 2882 3020 3451 3110 2684 1487 3234 3386 1685 2054 1665
Copra Society - 1398 - 1926 - 1865 - 1976 - 2978 - 2004 - 1354 - 2590 - 1405 - 532 - 557 - 507
Other 40 41 45 46 60 46 43 40 30 30 33 33
Fishing 1971 1862 1638 1605 1903 1920 1478 1680 1517 1526 1288 1259
Seaweed 347 148 71 250 226 403 314 252 398 497 397 408
Manufacturing 365 200 354 412 605 545 545 688 613 649 770 747
Electricity 737 748 776 834 839 819 909 1053 1180 1328 1388 1419
Construction 1988 969 845 1030 882 855 993 3171 3593 3641 4676 4138
Wholesale/Retail 5605 6316 5623 5938 6823 5733 5850 8237 7043 8484 7722 7894
Hotels/Bars 1050 1326 1445 1256 1278 1477 1642 1727 1440 1418 1410 1498
Transport
Public 2963 3260 3327 4431 3590 3267 3838 4495 4522 4672 4809 4845
Private 971 831 1113 1108 1244 1277 1302 1317 1277 1294 1196 1224
Communication 1348 1419 1490 1561 1632 1703 1774 1845 1916 1987 2057 2128
Finance 2640 2604 3833 4084 3854 3912 4395 6303 6119 6079 6393 6724
Owner occupied 1153 923 844 1181 1117 1313 1492 1279 1259 1527 1567 1589
Govt. Services
Government 10378 10943 11001 12158 13560 15119 15110 15618 18669 18794 19055 19843
PNPI 1079 1257 1255 1490 1184 1224 1266 1250 1268 1286 1304 1318
Other 384 372 454 477 406 518 529 540 543 575 527 516
Less imputedbank services - 2001 - 2385 - 3490 - 3614 - 3500 - 3359 - 3943 - 5451 - 5335 - 5412 - 5557 - 5817
Total 31991 31789 31779 35721 35835 37453 37659 44688 48032 49527 50530 50923
Plus indirect taxes 7122 7272 8237 7741 10192 10414 11261 11130 13461 12882 13075 13290
Less subsidies - 669 - 683 - 774 - 727 - 957 - 978 - 1058 - 1045 - 1264 - 1210 - 1228 - 1248
Monetary GDP, MP 38444 38378 39242 42736 45069 46888 47862 54773 60229 61199 62377 62964
Subsistence Fishing 4759 4281 4065 4205 4294 4364 4365 4019 4120 4160 4166 4192
Total GDP, MP 43,203 42,658 43,307 46,941 49,363 51,252 52,227 58,791 64,349 65,358 66,543 67,156
Growth rate -1.3 1.5 8.4 5.2 3.8 1.9 12.6 9.5 1.6 1.8 0.9
Net factor income 36232 28172 20650 19239 30385 23918 43254 56579 47941 54071 66740 59915
GNP 78295 76809 73437 77906 85259 76882 96906 112534 129757 117149 117149 117149
Mid year population 73362 74404 75460 76532 77658 79056 80479 81927 83402 84955 86400 87869
GDP / capita A$ 589 573 574 613 636 648 649 718 772 769 770 764
GNP / capita A$ 1067 1032 973 1018 1098 973 1204 1374 1556 1379 1356 1333 Source: Based on data provided by Statistics Office, MFED, 20 February 2004; Note: MP = market prices

8
Since independence, economic growth has been relatively modest, and development has been uneven between South Tarawa and other islands, but the economy has been prudently managed. As shown in Figure 1.4, real GDP growth has averaged 1.4% per year since 1999 and is projected by the International Monetary Fund (IMF) to be 1% for the next several years; GDP per capita has thus been declining as population growth rates have exceeded GDP growth rates. A distinguishing feature of the economy is an external reserve fund, the Revenue Equalisation Reserve Fund (RERF) for keeping foreign reserves in overseas accounts prudently managed by international brokerage firms. Its value has steadily grown to the equivalent of seven years’ imports or nine times the value of GDP. Investment income is currently about a third of GDP. Because of the fund, Gross National Product (GNP) has been about 80% higher than GDP since 1995. Table 1-1 summarises some key economic statistics from 1991 – 2002.
Only 20% of the labour force participates in the formal wage economy, which accounts for over 90% of GDP. Nearly 80% of paid employment is for the government or government owned enterprises with 64% of all cash jobs based in South Tarawa. South Tarawa is far more monetised than all other islands and has far better access to health, education transport, communications and other amenities and services.
The non-formal traditional economy evens out some of these differences by redistributing monetary and other wealth along kinship lines although cash is increasingly important. Throughout Kiribati, the traditional economy remains important for food and general livelihood security. This is likely to continue for some years.
In the 1990s the labour force grew at 4.6% per year, more than twice as fast as overall population growth. With the majority of the population aged twenty or below there is high youth unemployment and few new jobs. Practical policies are needed to address improvements in the livelihoods of the growing numbers of young I-Kiribati who will remain in the informal sector.
Table 1-5 - Some Economic Indicators (1991 – 2002) 1991 1992 1993 1994 1995 1996 1997 1998 1999 2000 2001 2002 6
Price Index 1 83.6 86.9 92.2 97.1 100.6 100 100 101.9 105.6 107.5 114.3 118.4
US$ / A$ 0.78 0.73 0.68 0.73 0.74 0.78 0.74 0.63 0.64 0.58 0.51 0.54
Balance of payments 2 - 1.9 - 10.4 - 9.8 5.7 - 1.9 - 4.0 17.0 27.4 0.6 1.8 n/a n/a
Total exports ($m) 3.7 6.5 4.5 7.1 10.3 6.8 8.4 9.3 14.1 10.7 n/a n/a
Visitors to Tarawa 2446 3189 3385 2991 2919 3410 3763 3941 2906 2996 n/a n/a
Fees from EEZ access (US$m) 3 31.4 30.6 46.4 n/a
Value of reserve fund (A$m) 4 263 296 353 318 368 371 459 570 602 658 636 n/a
Subsidy to PUB (A$ ‘000) 5 120 120 120 210 120 120 260 850 800 Source: Kiribati Monetization in an Atoll Society: Managing Economic and Social Change (ADB, Dec. 2002) n/a = not available Notes: 1) Retail price changes (1996 = 100) 2) BOP in A$ millions 3) Access to Kiribati fish resource 4) Current price value of
RERF 5) For 2003 and 2004, subsidy estimated as $0.6m & $0.4m respectively 6) 2002 data through June only (except PUB subsidy)
Table 1-6 - Real GDP in A$ millions (1991 prices)
30
40
50
60
70
80
1991 1993 1995 1997 1999 2001 2003
Source: 1991-2002 MFED; 2003-2004 IMF projections

9
1.5.1 Millennium Development Goals
In September 2000, Kiribati was among 147 countries which adopted the Millennium Development Goals (MDGs), a set of development targets with quantifiable indicators, to assess development progress. In 2003, the ADB reported on the progress of Pacific Island Countries (PICs) toward meeting MDGs. For Kiribati, the ADB cautions that data (which are often unreliable) suggest that approximately 50% of the population fell below the national poverty line in 1996. Since then education indicators have improved, including gender equality in primary and secondary enrolment, although access to primary education remains a problem especially in the outer islands. The outer islands are also disadvantaged in terms of access to health services, other services and communications. The rise in population in South Tarawa is straining water and sanitation services. Health indicators are improving but child mortality remains high.
The national development strategy (NDS 2004-2007) aims to address these challenges, and reach the MDGs, by emphasising six ‘Key Policy Areas’: 1) economic growth underpinned by increased investment and maintaining past policies of sound public financial management; 2) equitable distribution of the benefits of development, including upgrading outer island facilities and services; 3) implementing a performance monitoring system to improve efficiency of public enterprises (which still dominate the economy); 4) an expansion of realistic and practical training and health services; 5) sustainable use of physical resources; and 6) protecting and effectively using financial reserves at the national level and in villages.
As shown in Table 1-7, Kiribati is signatory to the three Pacific regional trade and economic trade agreements, the most important of which are the Pacific Islands Trade Agreement (PICTA) and the Pacific Agreement on Closer Economic Relations (PACER; between PICTA signatories and Australia and New Zealand). The GoK has also signed the Cotonou Agreement, providing membership in the African Caribbean Pacific (ACP) group of countries, and thus access to further development assistance from the European Union.
1.5.2 Investment and banking
The GoK has long encouraged private sector investment and diversification of the economy. Foreign investment is generally encouraged and no discrimination is shown between foreign and local investors. Investors who wish to establish an enterprise must make application to the Foreign Investment Commission (FIC) that is chaired by the Secretary for Commerce, Industry and Tourism. Granting of FIC licences is on a case by case basis under the following guidelines: 1) the potential employment of I-Kiribati (the indigenous population); 2) net export contribution; 3) the balance between local resource exploitation and the size of the foreign investment; 4) the potential for transferring to I-Kiribati foreign managerial and technical skills required in the enterprise; 5) the extent of competition with local enterprises; and 6) the impact on social and natural environments.
The Development Bank of Kiribati (DBK) provides business loans to local citizens. There are flexible guidelines regarding guarantees, equity, security, the experience
Table 1-7 - Kiribati and Regional Economic Treaties
Status SPARTECA PACER PICTA Signed Ratified Entered into force
14 July1980 10 July 1981 09 Aug 1981
18 Aug 2001 04 June 2003 03 Oct 2002
18 Aug 2001 04 June 2003 13 April 2003
Source: Communication from Pacific Islands Forum Secretariat (January 2004)

10
and qualifications of potential borrowers, and other factors but a flat interest rate of 12% is charged. The sole commercial bank is the Bank of Kiribati (BoK), a joint venture with the Australia New Zealand Banking Corporation (ANZ), and is75% owned by ANZ. BoK provides secured loans at 8.5% interest and unsecured loans at 10%. For small businesses, the BoK prefers co-borrowers; for loans to government owned enterprises, a government guarantee is required.
Only two DBK loans (and no BoK loans) have been provided for the energy sector, both for the government-owned Solar Energy Company (SEC) for $20,000 in 1994 to purchase equipment and components for the subsequent manufacture of solar photovoltaics equipment and $16,000 in 1999 to assist with operational expenses. Both loans have been repaid.
1.6 Institutional Context for Energy
According to the government’s 2004 National Budget, the Ministry of Works and Utilities (MW&U; formerly the Ministry of Works and Energy or MWE) is responsible for an “energy outcome” whose goal is “meeting the energy needs of the community in a sustainable manner.” In addition, “the Ministry is to provide and maintain a resource centre that promotes the development of renewable energy resources and encourages energy efficiency.” MW&U has the following energy sector responsibilities, as stated in the ministry’s 1999-2001 Strategic Plan:
• the Energy Planning Unit (EPU), responsible for coordinating the implementation of energy policies and providing necessary advice and assistance on all energy activities and energy-related matters;
• the Public Utilities Board (PUB), a statutory authority responsible for provision of power, water supply and sewerage services for South Tarawa and the provision, operation and maintenance of all assets associated with service delivery;
• the Solar Energy Company (SEC), an incorporated company majority owned by the ministry involved in renewable energy, particularly sale or lease of solar electric systems and relevant components;
• the Kiribati Oil Company (KOIL), an incorporated company majority owned by the ministry involved in distribution of petroleum products.
Figure 1-3 -Institutional Arrangements for Energy in Kiribati
Ministry of Works and Utilities Ministry of Commerce, Industry and Tourism
Ministry of Finance and Economic Development
Solar Energy Company (solar PV)
Energy Planning Unit
(policy and planning)
Public Utilities Board * (electric power)
Fuel pricing Aid coordination and capital investment
* For Kiritmati, electric power is the responsibility of the Ministry of Line and Phoenix Islands.

11
1.6.1 EPU
The EPU has accepted somewhat broader responsibilities than those listed above, including responsibility for energy policy and planning, implementing a range of activities such as energy audits and energy use surveys, and monitoring the operations of PUB, SEC and KOIL. The EPU is headed by an Energy Planner who reports to the Permanent Secretary for Works and Utilities, and supervises an Assistant Energy Planner (a position currently vacant), an Energy Projects Engineer, an Assistant Project Engineer and three support staff. In recent years, the EPU’s operating budget has ranged from about $80,000-95,000 with personnel costs accounting for roughly half of the total.
1.6.2 PUB
The PUB has a board of 4-8 commissioners – currently seven – who are selected by a panel of three Ministers (chaired by the Works and Utilities Minister and also including the Ministers for Transport, Communications and Tourism; and Finance). PUB sets its own tariffs, although Cabinet can reject proposed changes. The PUB is responsible for electricity, water and sewage. There is a significant, although unquantified, cross-subsidy from electricity operations to water and sewerage that represents a long-standing financial drain on the PUB. That has recently led to consideration of separating electric power from water and sewerage services. The current chair of PUB is the MW&U’s Acting Chief Engineer. Although PUB remains strongly attached to the MW&U and its policies, it has become somewhat more autonomous since 1999, in part due to pressure from the ADB for increased accountability and more commercialised operations.
1.6.3 SEC
The SEC was established in 1984. Its board of five directors, also currently chaired by the Acting Chief Engineer of MW&U, is appointed by the Minister for MW&U. SEC has over 20 staff and is expected to expand during 2004 (as a result of a five fold increase in customers due to a large EU solar energy contribution) to a structure as shown in Figure 1.5. Despite a long history of MW&U/MWE interference, and sometimes indifferent management, SEC has been by far the most successful and longest surviving Pacific solar services company outside of the French Territories. Although the SEC has received no subsidies or grants from the GoK for some years, for 2004 it is seeking a grant or loan of $120,000 to ease cash-flow problems during the late implementation of the large EU project.
The SEC Board and the ministry have also approved in principle a reorganisation, under which the SEC would be renamed the Rural Electrification Company (REC) with responsibilities broadened to include conventional as well as renewable energy development for the rural areas. Eventually it is expected to assume responsibility for diesel-based rural electrification, mostly at Island Council offices and a few larger government facilities, away from Tarawa within the Gilberts group of islands. To date there has been no actual shift it its activities reflecting this change, however.
Expansion of operations to the Line group is contemplated but all capacity is currently directed toward development of solar based rural electrification in the Gilberts. By the end of 2005, approximately 2000 households, maneabas, schools and clinics will be electrified by solar under the management of the SEC. Estimates are that this represents about half the market for these services so additional funding for further

12
development is expected to be sought even before the current EU project is completed. There are concerns that the SEC can successfully shift from a customer base of 350 homes on nearby islands to nearly 2000 installations spread throughout the Gilberts group. The EU programme specifically is engaged in capacity building and management advisory services to help prevent problems from arising due to this dramatic increase in operations.
1.6.4 KOIL
The KOIL Board of Directors is appointed by the Minister of MW&U. The current chairman is a former Permanent Secretary of Works and Energy and the current CEO is a former head of the Energy Planning Unit. On Tarawa, KOIL distributes petroleum fuels, which are supplied by Mobil Oil and stored in Mobil-owned bulk tanks. Supply to other islands in the Gilberts group is by 200 litre drums. On Kiritimati (Christmas island), KOIL owns the bulk storage facilities and is therefore not tied to Mobil as its sole supplier. BP is the supplier for aviation fuel products and contracts directly with aviation operators. Figure 1-4 - KOIL Storage on Betio, Tarawa
Herb Wade
1.6.5 Fuel price control
KOIL distributes fuel at a government-controlled maximum wholesale price, which applies to petrol (benzine), kerosene and distillate. Prices are normally adjusted quarterly by KOIL, with the approval (although not actually required under law) of the Ministry of Commerce, Industry and Tourism (MCI&T). MCI&T also establishes maximum retail prices for petrol and kerosene, usually immediately after a wholesale price change. Tarawa prices also apply to all islands in the Gilberts group, with 75% of local transport costs to the islands met through government subsidies. The price in Kiritimati is reportedly 2-3¢/litre higher than Tarawa due to the much longer route for direct shipment from the Fiji supplier. Consideration has been given to supplying the Line Islands from relatively nearby Hawaii though there is no indication that this is likely to occur in the near future.
1.6.6 Energy investments and aid
The Ministry of Finance and Economic Development (MFED) is the Secretariat to the Development Coordinating Committee; it must approve any development projects which exceed $50,000 dollars. Although this is not specifically an energy sector responsibility, it means that MFED has considerable influence on energy investments. MFED is also a member of a PIREP coordinating committee and is expected to be the Kiribati focal point for the Pacific Islands Energy Policies and Strategic Action Planning project (PIEPSAP), a Danish-funded, UNDP-managed SOPAC operated project running for three years starting in late 2004.

13
The Asian Development Bank has assessed 32 government-owned or majority-owned enterprises including PUB, KOIL and SEC which are 100% GoK owned. PUB and SEC are among those that ADB describes as obliged to undertake activities that are not commercially viable or have government-imposed restraints on pricing though thus far the SEC has not been called on to either change prices or engage in non-commercially viable activities. Financial accounts tend to be outdated and unreliable but the ADB has estimated the performance of the government-owned enterprises, summarised in Table 1-8. From 1994 through 2004, the ADB estimates that the GoK will have provided over $3.7 million in subsidies to the PUB (Table 1-5). Table 1-8 - Estimated Financial Performance of State-Owned Energy Enterprises
Assets Equity ROR Return on Equity
GoK Subsidy and Investment ($m) Enterprise
($m) ($m) (%) (%)
Year
2001 2002 est KOIL 6.6 5.1 17 22 1998 0.3 0.0 PUB 7.6 6.0 0 0 1995 1.0 8.5 SEC * 0.3 0.2 - 16 - 27 2000 0.0 0.0 All 32 enterprises 240.5 130.6 8 41 2001 3.5 0.0 Source: Kiribati Monetization in an Atoll Society: Managing Economic and Social Change (ADB, Dec. 2002)
Notes: ROR = rate of return on total assets. Return on equity is after tax on total assets. * Excludes subsequent 4m euro grant
1.6.7 Energy policy
Various national energy policies have been developed and endorsed by the GoT (1983) or prepared in draft but largely ignored (1995). There is presently an Energy Policy Issues and Guidelines document (2002), which has not been endorsed by Cabinet and has no formal status. It contains broad goals and objectives, and strategies to meet them, but is an unprioritized mixture of proposed, current and outdated material. Although SEC may evolve into a broader rural electrification company, there is no a national rural electrification policy even in draft form.
1.6.8 Energy Legislation
There are several Acts of the Kiribati Parliament that deal directly with energy issues. These are:
• The Public Utilities Act (CAP 83 of 1977; revised 1998) provides for “the exclusive right [by PUB] within any electricity supply area to generate, transform, transmit, distribute, supply and sell electricity and to electricity perform services incidental thereto.” The Minister may declare Minister may “declare any island or part of an island to be an electricity supply area.” The Act specifies that PUB is “free of all customs duty, import levy or any other tax” including income taxes.’
• The Prices Ordinance (CAP 75 of 1976; revised 1981) provides for the Minister to make regulations regulating the retail prices of prescribed commodities. Currently the only petroleum fuels under retail price control are benzine and kerosene.
• The Environment Act (Act 9 of 1999) “provides for the protection, improvement and conservation of the environment of the Republic of Kiribati” and came into effect from 21 March 2000. It is supplemented by Environment

14
Regulations 2001 (Environment Act; Section 53). The Environment Act is meant to reduce pollution (including any liquid, solid or gaseous substance or energy) …which may tend to be injurious to the environment or human health; too protect and conserve natural resources; and to comply with regional and international environmental conventions and obligations. The Act lists “prescribed developments” which require an initial environmental report (IER), an environmental impact assessment (EIA) and an Environmental Impact Statement (EIS) for any major project. There are mechanisms for public access to the reports and for public objections and appeals. Although there is little mention of energy, prescribed developments include oil refineries, petroleum product storage tanks, and (surprisingly as Kiribati has no hydroelectric resource) hydroelectric power.
1.6.9 Inter-ministerial Energy Committees
A PIREP coordinating committee, with membership from a number of ministries and chaired by the EPU, was established in 2003. By late February 2004 it had met twice and a third meeting was planned. There is also a Kiribati Energy Coordinating Committee chaired by the EPU and also comprising the CEOs or managers of PUB, SEC, KOIL. The committee is supposed to coordinate the activities and policies of the state-owned energy companies but is reportedly inactive.

15
2 ENERGY
2.1 Energy Supply
Kiribati is highly dependent on imported refined petroleum fuels for electricity generation, for transport by land, sea and air and for cooking and lighting. It is likely that biomass provides around 25% of gross national energy production. It is used for household cooking and copra drying in rural areas. Solar energy is growing rapidly but accounts for well under 1% of the total. There is no hydropower resource. Petroleum accounts for about 75% of the total gross energy supply.
2.1.1 Petroleum
The most recent overall national energy sector assessment for Kiribati is the joint World Bank, UNDP, Forum and ADB’s Pacific Regional Energy Assessment (PREA, 1992) which predicted that petroleum fuel sales would grow at an average rate of 4.5% per annum over the next decade, with distillate for electricity generation showing the most rapid growth at 5.5% annually. Actual growth for inland products has been slightly less at 3.9% per year (Table 2-1) but with a far different composition of the 10-year growth than predicted by the PREA analysis. However, Figure 2-1 shows that since 1997 the growth of imports of kerosene has been small, gasoline imports grew comparatively slowly while ADO growth was much greater, making the last five years of overall growth more in line with the PREA predicted rates. Table 2-1 - Inland Kiribati Petroleum Sales in 1990 and 2003
1990 2003 1990 – 2003 AAGR (% per year) Product
KL sold (Actual)
KL sold (PREA forecast)
KL sold (actual)
Predicted (PREA) Actual
Gasoline 2,358 3,463 4,917 3.0 % 5.8 % Kerosene 1,168 1,329 1,997 1.0 % 4.2 % Distillate (ADO) 6,227 12,490 9,105 5.5 % 3.0 % Total inland 9,753 17,282 16,019 4.5 % 3.9 % Sources: 1990 sales and 2003 forecast sales calculated from PREA data (Vol. 5, Kiribati; Aug. 1992). Actual sales from KOIL (Feb. 2004). Notes: 1) Gasoline is also called motor spirit, mogas and petrol. 2) Ignores aviation fuel (which PREA expected to be static) as data were not obtained from BP
The changes in petroleum use are largely due to migration from rural areas to Tarawa causing rapid transport and electricity use increases. As long as outer island electrification continues to be through renewable sources, the growth of the Tarawa population is likely to be the main driving force for increasing petroleum imports.
Figure 2-1 -Petroleum Imports 1996-2003 (litres)
-
2,000,000
4,000,000
6,000,000
8,000,000
10,000,000
12,000,000
14,000,000
1996 1997 1998 1999 2000 2001 2002 2003
Year
Litr
es
ADOULPDPK
Source: KOIL (2004)
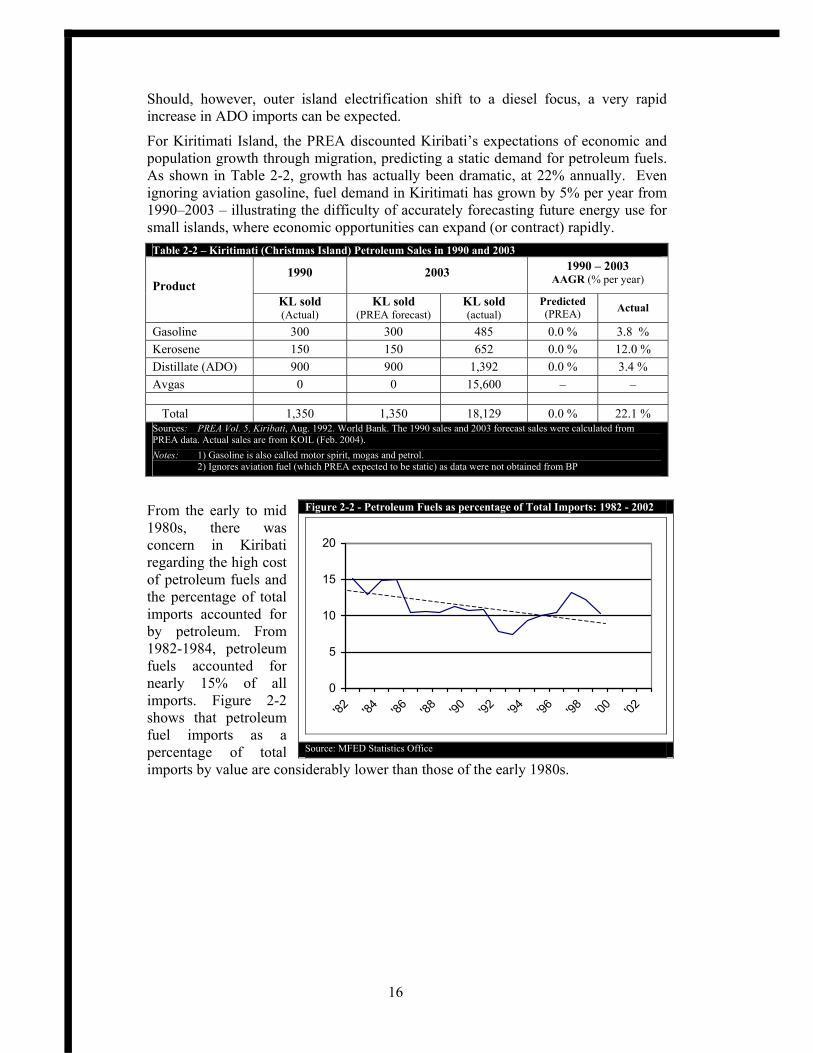
16
Should, however, outer island electrification shift to a diesel focus, a very rapid increase in ADO imports can be expected.
For Kiritimati Island, the PREA discounted Kiribati’s expectations of economic and population growth through migration, predicting a static demand for petroleum fuels. As shown in Table 2-2, growth has actually been dramatic, at 22% annually. Even ignoring aviation gasoline, fuel demand in Kiritimati has grown by 5% per year from 1990–2003 – illustrating the difficulty of accurately forecasting future energy use for small islands, where economic opportunities can expand (or contract) rapidly. Table 2-2 – Kiritimati (Christmas Island) Petroleum Sales in 1990 and 2003
1990 2003 1990 – 2003 AAGR (% per year) Product
KL sold (Actual)
KL sold (PREA forecast)
KL sold (actual)
Predicted (PREA) Actual
Gasoline 300 300 485 0.0 % 3.8 % Kerosene 150 150 652 0.0 % 12.0 % Distillate (ADO) 900 900 1,392 0.0 % 3.4 % Avgas 0 0 15,600 – –
Total 1,350 1,350 18,129 0.0 % 22.1 % Sources: PREA Vol. 5, Kiribati, Aug. 1992. World Bank. The 1990 sales and 2003 forecast sales were calculated from PREA data. Actual sales are from KOIL (Feb. 2004). Notes: 1) Gasoline is also called motor spirit, mogas and petrol. 2) Ignores aviation fuel (which PREA expected to be static) as data were not obtained from BP
From the early to mid 1980s, there was concern in Kiribati regarding the high cost of petroleum fuels and the percentage of total imports accounted for by petroleum. From 1982-1984, petroleum fuels accounted for nearly 15% of all imports. Figure 2-2 shows that petroleum fuel imports as a percentage of total imports by value are considerably lower than those of the early 1980s.
Figure 2-2 - Petroleum Fuels as percentage of Total Imports: 1982 - 2002
0
5
10
15
20
'82 '84 '86 '88 '90 '92 '94 '96 '98 '00 '02
Source: MFED Statistics Office

17
Petroleum fuels are supplied to Kiribati by Mobil and BP. Except for Kiritimati (and sometimes other islands of the Line group), fuels are shipped to the outer islands in 200 litre drums and there are sometimes shortages due to irregular shipping. Kiritimati is 3500 km from Tarawa and is supplied directly from Fiji, over 5000 km distant. As the PREA noted over a decade ago, small quantities, long transportation routes, and transhipment result in landed costs of petroleum products in Kiribati above those of several neighbouring Pacific Island Countries (PICs). Recent wholesale prices of gasoline and ADO (excluding taxes and duties) are shown in Figure 2-3. Prices in Tarawa remain higher than average for the PICs. Prices in Kiritimati (not shown) are reportedly 2-3¢ per litre higher than Tarawa, due to the higher cost of shipment from Fiji.
Kiribati is a relatively low per capita user of liquid petroleum gas (LPG) since almost all use is on Tarawa and even there kerosene is still the primary cooking fuel. LPG is distributed by KOIL (imported in bulk by an Australian company, Cowen and Russell) and by Tarawa Motors (marketed as Kirigas) with an estimated 40% of market share.
2.1.2 Fuel storage
On South Tarawa, Mobil has nearly 2.4 million litres (ML) of storage facilities as shown in Table 2-3. BP has nearly 1.0 ML. KOIL owns 2.6 ML of storage on Kiritimati sufficient for about four months of demand so the island is only supplied three or four times per year while deliveries are about monthly for Tarawa.
2.1.3 Duties on petroleum fuels
Under the Customs Schedule of 1993, all aircraft operating within Kiribati or international flights to or from Kiribati are exempt from all customs duties and taxes. Since then, Cabinet has also exempted from duty all fuel used by PUB. Neither kerosene nor LPG, both used for cooking, attract duty. The only fuels currently subject to duty are benzine (petrol) and distillate, shown in Table 2-4.
Figure 2-3 - PIC Wholesale Petroleum Fuel Prices (excluding import duties and taxes; August 2003)
Source: Pacific Fuel Price Monitor, Edition 5 (PIFS; 12 Nov. 2003)
Table 2-3 - Tarawa Petroleum Storage (ML)
Product Mobil BP Total Avgas 296 296 Petrol 640 640 Jet A1 135 591 726 Kerosene 390 390 Distillate 1,220 1,220 Total 2,385 591 2,976 Sources: Mobil from KOIL (provided in tonnes and converted using data of Annex 2; BP from PREA)
Table 2-4 - Fuel Import Duty Fuel Early
2003 From
Oct 2003
Benzine 12 ¢/l 7 ¢/l Distillate 4 ¢/l 6 ¢/l Source: Price Control Office (Feb 2004)

18
2.1.4 Biomass
For all islands excepting Tarawa and Kiritimati, biomass is the primary fuel for cooking and copra drying. Most of the biomass used is in the form of coconut husks and shells though fuel wood is also commonly used (and on Banaba, is the primary source) though not in large enough quantities to present a danger to the resource base anywhere in Kiribati except on densely populated South Tarawa.
Though there have been no comprehensive biomass fuel use surveys for all of Kiribati, small scale surveys indicate that there is no shortage of fuel and no danger of serious depletion of biomass resources for the foreseeable future except on much of South Tarawa where there has long been inadequate biomass fuel resources for the dense population.
2.1.5 Electricity Supply
The PUB is presently in the last stages of a large power development project funded by Japan. A new power plant, upgrading of existing power plants as well as expansion and upgrading of the distribution system are included in the project.
All HV and LV distribution is underground except for a few old overhead lines being phased out. There is about 54 km of 11kV distribution, partially in a ring main configuration, constrained by the long narrow shape of the Tarawa atoll. With most of the load either in the Betio/Bairiki area or in the area between Bikenibeu and Bonriki
the two main power plants have been located in Betio and Bikenibeu. Unfortunately the relatively small cable between the two load areas is insufficient to allow full power interconnection between the power stations though that cable is scheduled for upgrading under the JICA project. A loss of power at the Betio power station usually results in a loss of power to Betio customers even though the system is interconnected with the Bikenibeu station. Since the Betio power station is much older and generally less reliable than the Bikenibeu station, the government and commercial facilities at Bairiki see poorer power reliability than those further east that can benefit from the more reliable Bikenibeu power station. The installation of a new 1.25 MW generator at the Betio station in 2004 should improve system reliability and ultimately the interconnection cable is to be increased in size to allow full capacity power transfer between stations.
Table 2-5 - Generation installed (Nov 2003) Capacity Station Unit
Number Date of
Mfg Manufacturer Running hours Voltage Rating Available
1 1969 Blackstone 465,805 415 600 Off Line 2 1969 Blackstone 516.958 415 600 450 3 2002 Daihatsu 8861 11kV 1,400 1,400
Bikenibeu
4 2002 Daihatsu 8820 11kV 1,400 1,400
6 1976 English Electric 30052 11kV 750 600
7 1976 English Electric N/A 11kV 750 Off Line
8 1988 Wartsila N/A 11kV 1,000 Of Line
Betio
Total 6,500 3,850 Source - JICA Design Study 2003 with data from PUB (as of end of November 2003) Notes: 1)At Betio, generators 1-5 and number 8 have now been retired and removed 2) PUB is repairing Bikenibeu Number 1 3) There is around 1.5MW of back up power systems at various government and commercial sites

19
Electricity Pricing
The connection fee is $30 plus from $2-$5 per meter over 30 meters from the connection point. The user must prepare the trench for the cable and provide all preparation for the connection.
Tariffs were increased in September 2000 and May 2001 to keep up with changes in ADO prices. As of 2003, the tariffs were $0.37 per kWh for domestic customers and $0.47 per kWh for government and commercial customers, up about 10% over the 2000 prices.
2.2 Energy Demand
2.2.1 Petroleum
There are no readily accessible data to indicate the demand for petroleum products among various economic classifications such as government, commerce and industry, domestic households or transport. Jet fuel and aviation gasoline is obviously used for air transport and petrol for ground transport and outboard engine fuel.
For all islands except Tarawa and Kiritimati, there are few uses of petroleum products other than by the island council for transport and electricity generation at the council offices. JICA has installed diesel powered freezers on some islands but most are not working. Outboard motor ownership is not high as most outer island fishing is done with traditional sailing canoes. There is virtually no ownership of private transport on outer islands other than small motorcycles. A few petrol or diesel portable generators are used by churches and at community meeting houses (maneabas). Kerosene is, however, the dominant lighting fuel and an increasing number of households are using kerosene for cooking.
Household surveys indicate that of the outer island households that use kerosene for lighting, the median use is about one litre each week. Since pressure lamps use much more fuel than wick lanterns and lanterns use more than bottle wick lights, the amount used depends both on the number of lights in use and on whether they are bottle wick types, enclosed wick lantern type or pressure lamps. Cooking increases usage to an average of about two-thirds of a litre per day that varies according to family size and how much cooking is by kerosene and how much by biomass. Though the census did not include questions regarding the fuel used for cooking, small scale surveys indicate that at least 10-15% of outer island households use kerosene as their primary cooking fuel, up to about 30% use kerosene for part of their cooking and the rest uses biomass exclusively. LPG remains expensive for outer islanders and is little used though its use is expanding. For other fuels, demand by sector must be estimated, sometimes crudely. Direct use of fuel for business or commercial use is not separated in the data provided but is expected to be quite small in relation to other uses. Distillate used for electricity generation is estimated from the power sector data presented later in this section and it is assumed that distillate imported but not used for electricity generation is used for transport – though it is not possible to differentiate between land and marine transport use.
2.2.2 Biomass
In terms of overall energy use for Kiribati, biomass based energy production probably no longer exceeds that of petroleum. Its use is partly for cooking and partly for copra drying though the total amount used for either is not well documented. It is clear that

20
the majority of biomass used is in the form of coconut husks and shells, usually burned together as residue from copra production. Demand for biomass is generally smaller than the supply resulting from copra production and much of the copra production waste is dumped, sometimes causing health problems as it can provide open rain water pools allowing the increase of mosquito populations.
Biomass use for cooking on Banaba was surveyed by the EPU (2001) and it was found that most households using biomass as their primary fuel used a bag (about .5 m3) of biomass in five days. Unfortunately the weight of a bag was not recorded so estimating the calorific content is difficult. Based on similar surveys in other atoll countries and the size of the bag, about 5 kg of air dried biomass per day appears to be a reasonable estimate. That results in a daily energy production of about 70MJ per household per day for those households cooking exclusively with wood, probably equivalent to about 80% of all outer island homes in terms of fuel use. With rural households numbering around 6300, that means a total daily energy production of around 353GJ from 25.2 tonnes of biomass burned for cooking each day. An additional 100 GJ (7.1 tonnes per day) is estimated to be used for copra drying. In terms of oil equivalent, that represents about 10.7 tonnes of oil equivalent (toe) per day or around 3890 toe per year for Kiribati.
2.2.3 Electricity on Tarawa
In 2002, 15% of electricity demand was commercial, 30% domestic and 55% government. The demand is polarised with major demand centres at each end of South Tarawa. With demand largely by government, Betio and Bairiki with its concentration of government facilities and dense population has the largest concentration of electricity demand and is about four times that of the other load centre in the Bikenibeu to Bonriki area.
JICA estimates only a 3% growth in Tarawa electricity demand (even though it has grown at an 8% rate since 1998) citing their expectation that migration to Tarawa is saturated, there are no large demand projects on the horizon and economic growth is modest. The team considers this as a low figure and suggests 4-5% growth as more likely for at least 10 years. For PIREP GHG calculations the team uses 4.5% as the AAGR for electrical growth from 2003-2013 on Tarawa.
Table 2-6 - Electricity statistics 1998-2003 1998 1999 2000 2002 2002 2003 Generated (MWh) 11,440 12,814 14,482 15,134 13,979 15.9 Peak (kW 2,060 2,200 2,695 2,857 2,550 3,093 Capacity (kW) 2,750 3,250 3,200 3,150 4,350 3,900 Domestic customers 3,500 3,500 3,500 3,500 3,500 3,650 Government & Industrial 150 160 140 160 170 190 Commercial 510 510 500 610 600 680 Fuel (‘000 litres) 3,436 3,311 3,946 3,831 3,914 4,400 Efficiency (kWh/litre) 3.33 3.87 3.67 3.95 3.57 3.60 Source: EPU (2004)
Based on available estimates, about 15.9 GWh was generated in 2003. Using an estimated fuel efficiency for generation of 3.6 kW/litre, that represents a use of around 4.4 ML of ADO.

21
2.2.4 Electrification away from South Tarawa
In 1992, Asian Development Bank consultants urged the PUB to accept a loan for an extension of power from Buota (near the airport) to Nabeina, a location about one-third way down the length of North Tarawa. The 9 km extension was promoted by ADB based on the New Zealand consultant’s assumption that population growth in that area would be large, particularly after completion of an Australian funded bridge connecting two major islets of North Tarawa together. That population growth has not occurred and at the time of the team visit, the PUB listed only 28 customers for the last six kilometres of the extension. The total average monthly energy use for all those customers is around 1200 kWh/month (46 kWh/month/meter), with all 28 customers totalling less energy use than that of one household in Niue.
Although most of the outer islands have a small (2 to 5 kW) portable petrol or diesel genset supplying power for the island council office and a few government employee houses near to the office, outside Tarawa only Kiritimati Islands has a grid that serves the community at large. It is operated by the Public Works Department (PWD), not the PUB. A major hospital facility is being developed on Tabiteuea North that will have its own generation system but there are no plans to deliver power beyond the boundaries of the hospital complex.
2.3 Future Growth in Energy Demand
2.3.1 Petroleum
Small economies such as that of Kiribati, especially those heavily reliant on a narrow range of exports and services, tend to have highly variable economic growth and energy use can change quickly and radically due to infrastructure development projects being undertaken. Therefore any prediction of energy growth is no more than an educated guess and should only be taken as an indication of what seems likely under a specific development scenario.
In Kiribati, the primary use of petroleum is for electricity generation and inter-island shipping (all ADO uses). Transport on Tarawa is the primary use of petroleum. Both electricity generation and petroleum growth is therefore closely linked with Tarawa and to a lesser extent Kiritimati population growth and the growth of the money economy of the two atolls. In terms of growth percentages, the Kiritimati economy is expected to continue to grow rapidly as the island is far from fully developed. Tarawa economic growth is likely to be lower but in real terms much larger than Kiritimati, at least in the near term. In the long term, tourism development coupled with large scale migration made possible by its large land area, could permit Kiritimati to pass Tarawa in the size of its local economy and therefore in energy use.
In its preparation for the South Tarawa power system upgrading project, JICA consultants forecast a 3% load increase for PUB based on the assumption that the high rate of migration to Tarawa will stop and economic development will be at a low rate for the future preventing the expansion of the appliance base in households and keeping government energy demand in check. The PIREP team does not agree with these assumptions and has used a rate of 4.5% for PUB load growth and associated ADO use growth for electricity generation.

22
2.3.2 Electricity
Electricity demand growth on Tarawa is estimated at 4.5% per year. This growth is partly expected to take place because of continued emigration to Tarawa and partly through increasing demand for household services due to increased household incomes as monetisation of the economy continues. There is a large potential for domestic demand growth since individual household use is typically less than 100 kWh per month and an increased use of just refrigerators and freezers could easily double the average domestic electricity consumption.
Electricity demand on Kiritimati is expected to grow much faster than on Tarawa largely through grid extensions adding customers and further development of electricity infrastructure. An increase in tourism could rapidly increase electricity demand due to development of hotels, resorts and other tourist facilities. Planning for energy development on Kiritimati should be immediately undertaken so the overall economic development of Kiritimati can proceed rapidly and smoothly.
Outer island electricity needs are presently being met through the use of solar energy. Small grids with 2-10 connections exist around island council offices and stores or homes with small generators but represent a very small percentage of outer island electrification. However, as demand for electricity services grows, the SEC will need to be flexible enough to expand services based on individual household needs rather than sticking with the traditional “one size fits all” solar installation design. If the SEC cannot provide the services people desire and can pay for, the services will be developed through the purchase of inefficient petrol or diesel generators. With the acceptance by the SEC of all forms of electrification on the outer islands, the possibility of biofuel development for small grid electrification and the integration of solar into small multiple-dwelling grids could be developed and still retain the renewable energy focus of the SEC.
Figure 2-4 - Maximum Demand and Fuel Use for Generation Trends 1987-2000
Maximum demand & Fuel used trends
1,2001,105
1,280 1340.0 1361.01550.0
1454.0
1658.0 1621.01714.5 1675.2
1973.12060.0
2,861.00
0
500
1,000
1,500
2,000
2,500
3,000
3,500
1987 1988 1989 1990 1991 1992 1993 1994 1995 1996 1997 1998 1999 2000
Year
Pow
er (k
W)
0
500
1,000
1,500
2,000
2,500
3,000
3,500
4,000
4,500
Fuel
use
d (k
l)
Max Demand (kW) Fuel used (kl)
Source – EPU (2003)

23
2.4 GHG Inventory
Assuming no significant new renewable energy development over the next decade, Table 2-7 indicates the forecast change in GHG emissions from 2003 to 2013. This forecast assumes that rural electrification will continue to be only through solar energy making the growth of fossil fuel use mostly a function of transport and electricity generation on Tarawa and Kiritimati Islands.
Table 2.7 -Greenhouse gas production due to petroleum imports for 2003 and projections for 2013 2003 2013
Fuel KL T TOE GHG (tonnes)
GHG (Gg)
% of GHG
AAGR KL GHG
(Gg) % of GHG
Motor Spirit Gilberts 4,917 3,589 3,912 12,293 12.3 24.7% 3.5% 6,936 18.2 25.2% Motor Spirit Kiritimati 652 476 519 1,630 1.6 3.3% 5.0% 1,062 2.4 3.3% Avgas (Kiritimati) 15.6 11 12 36 0.0% 15.6 Kerosene Gilberts 1997 1,572 1,714 5,591 5.6 11.3% 3.0% 2,684 7.5 10.4% Kerosene Kiritimati 652.0 513.4 559.6 1,825.6 1.8 3.7% 4.0% 965 2.5 3.4% ADO Gilberts (transport) 4,705 3,954 4,270 12,704 12.7 25.6% 3.0% 6,323 17.1 23.6% ADO Gilberts (electricity) 4,400 3,697 3,993 11,880 11.9 23.9% 4.5% 6,833 18.4 25.5% ADO (Kiritimati) * 1,392 1,170 1,263 3,758 3.8 7.6% 5.5% 2,378 6.1 8.5% Total 18,731 14,972 16,231 49,682 49.7 100.0% 3.8% 27,197 72.2 100.0% Sources: KOIL, EPU, PUB * Estimated to be half electricity and half transport
Large scale renewable energy implementation that is within the realm of possibility, provided necessary barrier reductions take place and the government aggressively supports investment in renewable energy development, can be expected to lower the rate of growth of GHG production through the addition of solar energy, biofuels and possibly wind energy to replace fossil fuel use on Tarawa and Kiritimati Islands over the next decade.
As noted elsewhere, solar energy and wind energy (if found to be practical in Kiribati) can at most together be expected to provide about 15% of the 2013 level of electricity generation.
With investment in replanting, development of biofuel processing facilities and conversion of power plant engines, the remaining 85% of fuel for electricity generation can be converted to biofuels if sufficient biofuel capacity is developed on Tarawa and Kiritimati Islands to handle projected electricity load increases to 2013. Conversion of the electricity generation system to biofuels will be less costly and more straightforward than conversion of transport to biofuels and is expected to take place first. Biofuels are not likely to impact significantly on marine or land transport over the next decade since it is very unlikely that sufficient biofuel production capacity can be developed over that period to provide for both electricity and transport use.
Energy efficiency measures for electricity use could save 10% of the volume of fuel used for electricity generation in 2013, that is 10% of 8022 KL = 802 KL. This is less than some other PICs as per capita household use is already low and new JICA generation and distribution investments mean supply losses will be low. However, if 100% of all ADO for electricity is displaced by biofuels, solar and wind, then the savings to Kiribati would be in fuel only, with no additional GHG savings. Energy
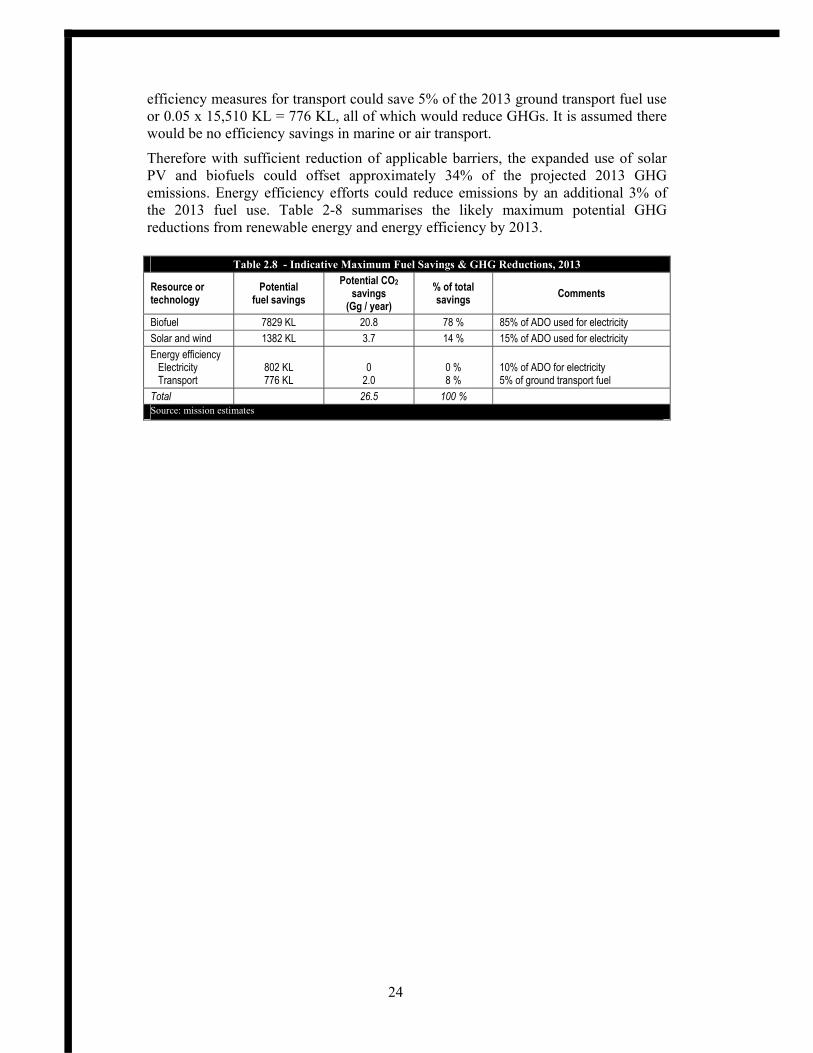
24
efficiency measures for transport could save 5% of the 2013 ground transport fuel use or 0.05 x 15,510 KL = 776 KL, all of which would reduce GHGs. It is assumed there would be no efficiency savings in marine or air transport.
Therefore with sufficient reduction of applicable barriers, the expanded use of solar PV and biofuels could offset approximately 34% of the projected 2013 GHG emissions. Energy efficiency efforts could reduce emissions by an additional 3% of the 2013 fuel use. Table 2-8 summarises the likely maximum potential GHG reductions from renewable energy and energy efficiency by 2013.
Table 2.8 - Indicative Maximum Fuel Savings & GHG Reductions, 2013
Resource or technology
Potential fuel savings
Potential CO2 savings
(Gg / year) % of total savings Comments
Biofuel 7829 KL 20.8 78 % 85% of ADO used for electricity Solar and wind 1382 KL 3.7 14 % 15% of ADO used for electricity Energy efficiency Electricity Transport
802 KL 776 KL
0
2.0
0 % 8 %
10% of ADO for electricity 5% of ground transport fuel
Total 26.5 100 % Source: mission estimates

25
3 RENEWABLE ENERGY
3.1 Solar
3.1.1 Solar photovoltaics
The solar resource on Tarawa was measured for many years at the meteorological station in Betio. Data for six years is summarised in Table 3-1. Also, JICA installed an automated weather station on North Tarawa that included horizontal and diffuse solar energy measuring devices. There is reason to believe that good quality solar radiation data is also available for Kiritimati atoll but it was not available from Tarawa sources.
Table 3-1 - Solar Radiation Measurements – Horizontal Surface 1981-1986 Jan Feb Mar Apr May Jun Jul Aug Sep Oct Nov Dec Year1981 5.15 5.43 4.96 5.00 5.67 5.57 6.20 6.81 6.96 6.74 8.44 5.55 6.041982 6.43 5.84 6.80 5.38 5.80 0.00 4.34 5.01 7.21 5.55 5.86 5.90 5.341983 5.55 5.90 6.08 6.01 4.32 0.00 5.05 5.61 6.05 6.01 5.70 5.42 5.141984 5.63 5.57 6.08 5.75 5.40 4.91 4.77 5.35 5.86 5.82 5.50 5.54 5.511985 5.40 5.86 5.61 5.72 5.44 5.37 5.74 5.79 5.75 5.82 5.64 4.74 5.571986 5.40 6.00 6.30 6.06 5.50 5.27 6.78 5.48 5.17 6.41 4.50 4.28 5.60Avg. 5.59 5.77 5.97 5.65 5.35 5.27 5.48 5.67 6.17 6.06 5.94 5.24 5.53
Source – Kiribati Meteorological Service (1992)
Since atoll islands do not significantly modify the surrounding oceanic climate, the NASA satellite data can be expected to also be useful, particularly in providing data for the outer islands. The Tarawa data from NASA is summarised in Table 3-2. The data labelled “Tilted” is the value computed as what would be the solar radiation on a surface tilted at the optimum angle for energy reception. This value is indicative only since this is a computed value, not an actual measurement.
Table 3-2 - Solar Radiation values for Tarawa Jan Feb Mar Apr May Jun Jul Aug Sep Oct Nov Dec YearHoriz. 4.84 5.29 5.41 5.45 5.15 5.03 5.24 5.61 5.83 5.84 5.21 4.83 5.31Tilted 5.49 5.68 5.42 5.44 5.38 5.57 5.54 5.72 5.67 6.17 5.85 5.54 5.61Source – NASA - http://eosweb.larc.nasa.gov
The solar resource tends to be lower in the north and increase toward the south. In the northernmost island of the Gilberts, Makin, the NASA data shows the following:
Table 3-3 - Solar Radiation values for Makin Jan Feb Mar Apr May Jun Jul Aug Sep Oct Nov Dec YearHoriz. 4.83 5.34 5.43 5.48 5.11 4.98 5.14 5.52 5.56 5.54 4.98 4.73 5.22Tilted 5.52 5.77 5.46 5.45 5.28 5.25 5.42 5.59 5.41 5.85 5.61 5.48 5.51Source – NASA - http://eosweb.larc.nasa.gov
And for the southernmost island of the Gilberts, Arorae, the data is almost 15% higher than for Makin:
Table 3-4 - Solar Radiation values for Arorae Jan Feb Mar Apr May Jun Jul Aug Sep Oct Nov Dec YearHoriz. 5.65 5.93 6.21 5.87 5.91 5.78 5.82 6.65 6.83 6.74 6.25 5.57 6.05Tilted 6.04 6.11 6.10 6.09 6.49 6.54 6.50 6.65 6.58 6.85 6.64 6.02 6.39Source – NASA - http://eosweb.larc.nasa.gov

26
Kiritimati Island also has a very good solar radiation environment:
Table 3-5 - Solar Radiation values for Kiritimati Island Jan Feb Mar Apr May Jun Jul Aug Sep Oct Nov Dec YearHoriz. 5.16 5.73 5.46 5.54 5.38 5.32 5.62 6.04 6.14 5.96 5.51 5.22 5.59Tilted 5.85 6.20 5.47 5.53 5.62 5.70 5.98 6.18 5.96 6.29 6.21 6.04 5.92Source – NASA - http://eosweb.larc.nasa.gov
Since solar designs need to be based on the lowest level of solar energy over the year to ensure reliable power the year around, the fact that Kiribati has only a small variation from month to month allows an efficient solar design with little power wasted in the higher insolation months and a low probability of power outage during the lower insolation months.
There is a large potential for household electrification by solar photovoltaics on the outer islands. A lesser but still important use is for the pumping of ground water for village water supply. Over the past 20 years most of the outer islands have received at least one solar pump for village water supply.
3.1.2 Solar thermal
A few solar water heaters have been installed in Kiribati on Tarawa but have not worked well. This is because the piped water supply is from wells with high mineral (calcium carbonate) content. When the water is heated in the solar collector, the mineral is deposited on the inside of the solar collector tubing rapidly reducing the efficiency of the units and ultimately causing the unit to become clogged with scale. If solar water heaters are to be used in Kiribati it is important that ground water not be used for the water supply to the heaters, only rain water. If rain water is used, they can be expected to have a long life and perform well in the high insolation environment of Kiribati.
3.2 Biomass
3.2.1 Biomass
Part of the waste from copra production is used for cooking and copra drying but much is left in waste piles. Also senile coconut trees can be harvested for fuel when a replanting is underway. So in theory, at least, there appears to be sufficient waste to fuel a small steam power or gasification system for electricity generation. A steam power installation at a coconut plantation in Fiji uses copra cutting waste and wood from cut coconut trees to provide electrical power for the plantation and a small village. Steam heat from the boiler is also used for drying copra. However, the technology is not simple and boiler operation requires constant professional attention if operation is to be reliable and safe. A 1980s trial in a Fijian village situation using a smaller scale of the technology failed. Recently there have been commercial trials of a self-contained coconut shell gasifier/engine generator unit that also in theory could provide electrical power from copra cutting waste but the unit has not been tested for the difficult Kiribati outer island environment.
3.2.2 Biofuel
Most of the land area in Kiribati is classed as coconut forests and the coconut is by far the largest tree resource. The 26,000 ha of coconut trees in Kiribati appears to be sufficient to produce enough biofuel to replace all imported diesel fuel and the new coconut mill has a production capacity of about 700 tonnes per month, an amount

27
sufficient to offset most if not all of the diesel fuel used for electricity generation. Actual production for 2004 is estimated to be around 2700 tonnes of oil, enough to offset over half the diesel fuel used for power generation on South Tarawa. The problem is working out a process whereby the biofuel is comparable in cost to diesel fuel. Currently the market price is about $650 per tonne CIF the receiving port. With $120 per tonne the cost of shipping, the effective Tarawa FOB price is about $520 per tonne for raw oil. Therefore after processing into biofuel, the cost would only be marginally higher than diesel fuel at mid-2004 prices and with petroleum prices likely to go higher in the future, the economics of biofuel look reasonably good for Kiribati. The labour costs on the outer islands are relatively low but the tree resource has not been generally well maintained in recent years so productivity is not optimum. Favourable conditions also exist for production of coconut oil on the outer islands as a fuel in direct competition with diesel fuel though considerable investment would be necessary. With the current very small demand for diesel fuel on the outer islands, that is not likely to be an option for the near-term.
Table 3-6 - Kiribati Copra Production by Island 1990-2003 Metric Tonnes
Gilbert Islands 1990 1991 1992 1993 1994 1995 1996 1997 1998 1999 2000 2001 2002 2003
Makin 253 255 328 153 247 396 271 321 277 234 92 287 220 247 Butaritari 174 303 197 202 187 330 124 146 237 257 52 248 80 79 Marakei 284 543 355 434 387 496 351 229 374 373 148 470 341 250 Abaiang 78 493 609 288 341 507 218 87 458 311 7 256 287 146 Tarawa 25 241 254 168 88 189 104 9 180 103 N/A 70 88 141 Maiana 187 563 514 441 654 738 557 240 568 510 82 378 327 319 Kuria 250 480 670 663 603 662 504 267 477 564 135 278 241 296 Aranuka 159 298 409 491 361 405 297 175 406 393 97 200 181 266 Abemama 618 970 1423 954 1613 1324 1141 636 1195 1391 218 854 760 792 Nonouti 376 688 1067 922 1082 909 775 302 1178 1129 82 319 417 441 Tabiteuea 621 916 1383 1540 1473 1200 1177 418 1489 1716 424 568 448 856 Onotoa 151 343 369 516 491 363 405 146 544 551 113 161 128 265 Beru 324 394 459 580 687 616 530 291 570 712 187 347 244 375 Nikunau 414 722 572 764 728 790 724 375 855 902 205 593 414 441 Tamana 123 325 301 383 372 268 221 105 456 258 98 104 134 250 Arorae 29 307 278 354 636 183 288 52 543 480 42 72 188 215 Gilberts Total 4066 7841 9188 8853 9950 9376 7687 3799 9807 9884 1982 5205 4498 5379 Line Islands Kiritimati 618 161 322 885 1790 865 574 562 439 688 1447 886 373 299 Tabuaeran 318 104 170 202 156 72 121 76 70 150 125 100 64 89 Teeraina 601 555 331 343 320 491 939 728 897 1038 772 980 811 425 Orona 47 49 13 Lines Total 1537 820 823 1430 2266 1428 1634 1366 1406 1876 2344 2013 1297 826 TOTAL 5603 8661 10011 10283 12216 10804 9321 5165 11213 11760 4326 7218 5795 6205 Source: EPU (2004)
With the stated priority of government being outer island development, the substitution of coconut oil for diesel fuel appears to be not only a way to reduce the import of fossil fuels but also a means to increase, possibly dramatically, the
28
economic conditions on outer islands. Therefore, it is recommended that there be a careful examination of the options and conditions for the development of coconut oil as a replacement for diesel fuel. This will need to consider 1) the logistics of coconut oil production and the relative cost of small oil extraction on each of the outer islands vs. large scale extraction on Tarawa; 2) the advantages and disadvantages of various types of biofuel (pure oil, chemically modified oil, oil blended with diesel fuel, etc.) in the Kiribati context; 3) the efficient use of all resources including biomass waste from larger scale copra production; and 4) the non-financial advantages to Kiribati in the form of security from foreign oil supply problems and price fluctuations, lowered foreign exchange requirements and greater transfer of money to the outer islands.
The 2003 opening of the coconut oil mill on Tarawa with its approximately 700 tonnes per month oil production capacity indicates a continuing commitment by government to copra production and an incentive for the outer islands to improve their copra production capacity. The plant could, if operated at capacity, provide almost all of the fuel requirements for diesel engines in Kiribati.
3.2.3 Biogas
On most of the islands of Kiribati, pigs remain free ranging. There is some potential for biogas generation if community pigs could be kept penned in a small area that is associated with a biogas digester to both produce gas and reduce the waste disposal problem. However, to be useful for energy it would be necessary to include equipment for gas compression and storage with either piping to nearby houses or additional compression into pressure cylinders of the same type as is used for liquefied petroleum gas.
3.3 Wind
Wind power has been used for water pumping but those systems have all fallen into disrepair and are no longer used. Solar powered pumping has been accepted as the standard pumping technology by the PWD for outer island water supply.
There are unconfirmed reports from the EPU that the National Oceanographic and Atmospheric Administration (NOAA) of the USA have extensive data (logged every 30 minutes for some years) on wind speeds at Kiritimati Island. These reportedly suggest an average wind speed of 6.0 metres per second, relatively consistent throughout the year. However the data could not be located in Tarawa.
The Tarawa wind data indicates a variable and seasonal wind resource with an annual average velocity too low for economic energy production. However the meteorological station on Betio does not have as its mandate the determination of the energy content of the wind and it is likely that a carefully designed wind resource survey would find significantly higher energies than are indicated by the meteorological service measurements. But until such resource surveys are carried out, it is not reasonable to propose wind power for Tarawa.
3.4 Ocean Energy
3.4.1 OTEC
Though there have not been specific surveys of the OTEC resource in Kiribati, the resource is definitely available and probably large. In particular, the atolls with a shallow lagoon have a water temperature several degrees higher than the surface

29
temperature of the open ocean. If the warm water intake were from the lagoon and the cold water from deep in the open ocean, improved thermal efficiency for the conversion process could be obtained. However the technology is not even close to commercial application for Kiribati and is not considered as a practical approach for power production at this time.
Hawaii based OTEC expert, Dr. Luis Vega, notes that "Technical and economic studies as well as experimental work have been conducted by numerous private and public entities in France, Japan and the USA. It was concluded that, for example, in Hawaii electricity production with OTEC technology is cost effective for 50 MW or larger plants. This conclusion is independent of the type of OTEC power cycle (i.e. Open, Closed, Kalina or Uehara) utilized. Moreover, it was concluded that commercialisation ought to be preceded by the design, installation and operation of a pre-commercial plant sized at about 2 to 5 MW…The situation in some Pacific Island Nations is such that smaller OTEC plants (e.g., 1 to 10 MW) configured to produce desalinated water in addition to electricity could be cost effective. However, because the technology is presently not commercialised, proposed installations in independent island states must be implemented without any financial responsibility assumed by their governments.1”
3.4.2 Wave Energy
Although there is known to be a moderate wave energy resource in Kiribati as based on several years of wave energy measurements funded by the Norwegian Agency for International Development (NORAD) and carried out by OCEANOR during 1987 to 1995 for SOPAC2, there is no commercially available, cost effective energy conversion equipment available for installation. A number of companies and laboratories are experimenting with different technologies to convert wave energy to electrical energy but none are past the trial stage. One advantage that Kiribati has for wave energy is an absence of the typhoons and major oceanic storms that can cause damage to or destroy wave energy systems.
1 Vega, Luis "Ocean Thermal Energy Conversion Primer" Marine Technology Society Journal, Vol. 36, No. 4, pp 25-35, Winter 2002/2003 2 Barstow, S.F. and Haug, O., The Wave Climate of Tuvalu, SOPAC Tech. Report no. 203 1994
Figure 3-1 - Satellite measurements of wave energy for Kiribati
Scanned from Barstow, Stephen & Falnes, Johannes, 1996 Ocean Wave Energy in the South Pacific: The Resource and its Utilisation (prepared for SOPAC & the Government of Norway). The numerical data are Geosat satellite altimeter calculations. Both show estimated annual average wave power in kW/m of wavefront.

30
Due to the large surface area of the Pacific that includes Kiribati islands, the wave resource can be expected to vary considerably from boundary to boundary of the country. Therefore when wave energy conversion equipment becomes commercially available a more thorough wave resource inventory for all islands will need to be carried out to set priorities for investment in wave energy conversion for electrification.
3.4.3 Tidal energy
Although there is a significant flow of tidal waters through lagoon channels during tide change periods, its intermittent nature and the small tidal range in Kiribati does not allow cost effective development of tidal energy.
3.5 Geothermal
There is no known geothermal potential in Kiribati.
3.6 Hydro
There is no hydro potential in Kiribati.

31
4 RENEWABLE ENERGY EXPER IENCE
Except for mechanical power from multi-bladed windmills for water pumping, there has been virtually no experience with renewable energy for electricity generation other than solar photovoltaics. Solar water heating also has been used on a few homes and visitor facilities but there is no expectation of significant market demand for the technology for the foreseeable future.
Biomass remains an almost universal source of thermal energy for copra drying and cooking at a low technology level that needs no documentation of the experience. The source is largely coconut fronds, husks and shells though some firewood is used, especially for cooking. There does not appear to be any problem with collection of sufficient biomass for these traditional purposes. Environmental effects of the use of this resource do not seem large though there have been reports of reduction in the mangrove forest areas near villages due to firewood collection.
4.1 Solar Photovoltaic Experience
Although solar photovoltaics have been used to provide remote power for communications equipment and water pumping since the late 1970s, until the formation of the Solar Energy Company (SEC) in 1984, the total installed capacity in Kiribati was less than 1 kWp.
From 1984 to 1992, most of the solar PV installations used equipment sold by the SEC though funding sources varied from private sales to multilateral donor projects. Except for PWD installed water pumps, most installation was also done by the company.
4.1.1 Solar Pumping
About 1993, ten Southern Cross positive displacement pumps were installed for village water supply under SPC funding in the Gilbert Islands. All those pumps failed within a few years and are being replaced as funds become available by less complex centrifugal pumps. Early failures were mainly attributed to failures of the associated electronic package that provided the high starting current needed by the pump. The manufacturer refused to provide circuit diagrams and other repair information, requiring that the units be sent back to Australia for service, an expensive and time consuming process that seriously reduced the average time of pump operation. The electronic package had as its purpose the delivery of a short pulse of high power for starting the pump to rotate. Once started, the pump would run as long as the sun was shining brightly on the panels.
After the electronics failed, the pump would not start automatically, but if started by hand it would continue to rotate, so some villages posted a person at the pump all day
Table 4-1 - North Tarawa School Solar Pump
Herb Wade

32
to manually start the pump early in the morning and after passage of a cloud. Panels were also added to some systems to increase the current available for starting. Unfortunately, as the pumps aged, they became harder and harder to start and ultimately would not run even if manually started.
In 1995, UNDP funded village water supply pumps for Miana (2), Aranuka (1), Nonouti (2), Tabiteuea South (2), Beru (1) and Arorae (1). The systems included a Mono brand positive displacement pump, a storage tank and 550 Wp of panel capacity per pump. All the pumps failed within five years. Based on the uniformly poor performance of the positive displacement pumps, the PWD is replacing them with Dankoff brand centrifugal pumps that have a low starting current and no requirement for an electronic interface. Those installations have thus far performed well.
As rehabilitation takes place, other water system design changes, such as increasing the delivery pipe size, are also being incorporated based on analysis of the problems found in the earlier failed projects.
4.1.1 Solar Clinic Electrification
In 1994, Canada Aid funded 18 clinic installations for the Gilbert Islands. Each installation consisted of two separate systems. One just for the solar vaccine refrigerator (24V Sun Frost refrigerator and 282 Wp of panel capacity except on Makin and Butaritari where the more cloudy climate required 376Wp of panel) and a second system (12V 110Wp) for lights and communications radio. The installations were made by the SEC and the SEC provides maintenance under contract to the Department of Health. The most significant problem has been the mechanical thermostat used on the refrigerators that fails after a few years due to corrosion.
One reason for success appears to be the highly efficient Sun Frost refrigerator that has a small storage capacity, entirely sufficient for the small island vaccine storage needs but not large enough for staff to be tempted to use the refrigerator for food storage that might overload the PV system.
4.1.2 School, government and maneaba electrification
Several church sponsored and some public primary schools have been electrified by solar PV. Although most use the PV for lighting and water pumping, a Catholic school on North Tarawa has installed sufficient solar capacity with inverters to operate AC type freezers as well as office machines and lights. A church school on Abemama has used PV for water pumping and lighting since the early 1980s.
Nearly 15kWp of solar capacity, almost all for lighting, has been installed for government offices, maneaba lighting, school electrification and business use. The systems are typically maintained by SEC technicians for a fixed monthly fee.
4.1.3 Telecom
The TSKL has installed and maintains at least one PV powered public phone on most of the islands within VHF radio range of Tarawa. The units allow direct dialling to all islands having a dial-up capability through Tarawa. The quality of installation and maintenance of the systems on the outer islands has been only fair and system reliability has been an issue. With SEC agents now available on all islands of the Gilberts, TSKL should consider contracting with the SEC for maintenance and installation support.

33
Approximately 5 kWp of solar panels are estimated to be installed on outer islands for telephone operation and another 5kWp installed at the TSKL earth station in Kiritimati. Plans are in place for multiple earth stations serving groups of islands interconnected by microwave or VHF links. All will all be solar powered and will greatly increase the solar capacity installed by TSKL.
4.1.4 Street Lighting
Four street lights on North Tarawa and 40 on South Tarawa (for the Betio-Bairiki causeway) were installed in 1999 and have performed well. The Pecan brand units utilise a sealed battery that is installed in an underground box to provide a cool, dry environment for long battery life. Power to operate the single high efficiency 20W tube light is provided by 80 Wp of panel capacity.
4.1.5 Private sales
By 1990, the SEC as a sales organisation had sold approximately 275 PV systems to outer island customers representing around 14 kWp of solar capacity.
After 1990, although reorganised as a solar utility, the SEC also sold PV systems to more than 300 households on the outer islands totalling about 20kWp of panel capacity. By the late 1990s, there were enough private installations and installations at schools and clinics for contract maintenance to allow the SEC to train and station maintenance agents on all islands of the Gilberts except Banaba.
There has been no specific programme by the SEC to extend the solar utility to the Line and Phoenix Islands because of the problems of logistics and the small market. However, there are both government and private solar PV installations already in place and future electrification of households in the Line and Phoenix group under the SEC is planned. However, the rapid development of tourism in the Line Islands makes it of some urgency to commence development of rural electrification by the SEC.
4.1.6 Solar Energy Company experience
Solar System Sales Organisation 1984-1990
The SEC was established as a private enterprise by the Foundation for the Peoples of the South Pacific Kiribati (FSPK), a U.S. based NGO. The FSPK received USAID funding for the start up costs and the Solar Energy Company was organized as a private, limited corporation. The initial majority shareholders were private, being the FSPK and the Bank of Kiribati. Some shares also held by the Ministry of Works and Energy. The original charter of the SEC was to act as a retail outlet for solar PV systems and to provide technical assistance where needed for their installation and
Figure 4-1 - Marakei telecom installation (note the surface dirt)
Herb Wade

34
maintenance. The company was organized to provide installation and maintenance services on demand by customers. Space was rented in Betio and two staff hired, a manager and a clerk.
From 1984 - 1989 the SEC sold solar panels, batteries, controls and associated DC appliances to outer island customers, mostly for cash though some credit was provided under special conditions. Many of the sales, if not most, were to households that had a family member as a seaman on a foreign, usually German, ship. Around 275 PV systems were sold to outer island customers, usually with a single panel in the 38WP to 55Wp range. The quality of products sold was good and comprehensive local language installation, operation and maintenance instructions were developed and provided with systems. Although the SEC was willing to provide installations near the actual cost, the expense of travel to outer islands and the time involved in waiting for transport made that option viable only for some larger, private school installations on nearby islands.
The initial sales were good with a rapid rise in sales the second year of operations and in that year the company made a substantial profit.
In 1986, the FSPK, believing that the company no longer needed its support, relinquished all its shares in the SEC to the Ministry of Works and Energy (MWE), making the MWE the 99% owner of the corporation with the Bank of Kiribati retaining the remaining 1% ownership. Unfortunately 1985-1986 was the peak of the business and sales fell continuously for three more years. Even with an additional input of US$25,000 from USAID for more stock to sell, the SEC was effectively bankrupt by 1989 even though almost all the investment in stock had come from USAID or FSC and only operating expenses needed to be paid for by sales. Since the potential market for solar PV measured in the 5000-8000 household range, it was clear that the problem was not market saturation.
Reorganisation as an energy service company
At the request of the MWE through the SEC Board of Directors, assistance was requested from the Forum Secretariat Energy Division and the South Pacific Institute for Renewable Energy (S.P.I.R.E in French Polynesia) to determine the causes of the problem that faced the company and to recommend the actions to take. The FSED agreed to fund an outer island survey to better understand the market requirements and the S.P.I.R.E. fielded a consultant to assist in the development of an action plan. Table 4.2 shows where PV systems were found by the survey and their application.
The S.P.I.R.E. consultant recommended reorganisation into a “solar utility” structure that would emulate the approach used by a conventional electric utility:
• all technical equipment would be installed, owned and maintained by the SEC, ownership would never be shifted to users, local committees or island councils.
Figure 4-2 - Private solar installation
Herb Wade

35
• energy recipients would have no responsibility other than paying a fee for the energy provided; and
• non-payment of fees would result in disconnection of service.
The FSED survey confirmed that the problem with the sales approach had been greatly reduced customer confidence in solar PV because of the general lack of reliability shown by the systems that had been purchased. The reasons were not, however, related to solar technology in general but rather to improper installations, an almost complete lack of maintenance and the replacement of failed solar batteries with car batteries that lasted only a short time. The survey found 275 PV systems on outer islands but only around 10% of the systems were still operation and providing the intended services.
Table 4-2 - Solar installations in the Gilbert Islands as enumerated by the 1990 FSED Survey
Island Number of
PV systems
Lights Lights
+ Radio + Tape
Lighting + CB Radio
Lighting + Pump Fridge Comm.
Radio Pump Other
Makin 8 6 1 1 Butaritari 12 7 3 2 Marakei 22 15 1 1 1 2 2 Abaiang 22 13 1 4 4 No. Tarawa 11 6 2 1 2 Maiana 33 16 6 4 1 2 4 Abemama 51 41 3 1 1 2 3 Kuria 15 7 3 1 3 1 Aranuka 11 4 2 1 1 3 Nonouti 12 6 4 1 1 Tabiteuea North 14 6 2 1 3 2 Tabiteuea South 8 7 1 Beru 7 2 3 1 1 Nikunau 14 4 1 2 7 Onotoa 13 11 2 Tamana 10 6 1 2 1 Arorae 12 7 1 1 1 1 1 TOTALS 275 164 7 28 2 14 29 11 20 Source: A Study of Utilization of Photovoltaics for Rural Electrification in the Republic of Kiribati, Final Report, Main Report (JICA 1994)
The overall finding was that the end result of the sales approach for solar electrification was unreliable systems, a high rate of expensive battery failures and general customer dissatisfaction. This translated into general distrust of PV as an electrical supply source and that lack of market confidence reduced sales to the point where the sales company could not stay in business. JICA pilot project (1990-1993)
During the same time period as the shift from a sales to a “solar utility” company was being contemplated, JICA agreed to fund a pilot PV based rural electrification project. Initially the project was intended to provide lighting for community facilities only but with the strong support of the MWE, the SEC convinced JICA to instead fund a pilot trial of the solar utility concept. The pilot project was designed by the JICA team and consisted of 56 home installations and a maneaba lighting installation on North Tarawa. Persons desiring the systems paid a connection fee of $20 and agreed to pay a monthly fee of $9 dollars. The fee was set based on the amount that would have to be charged

36
for maintenance and repair if 500 systems were installed. Of the $9 about one third was intended for deposit in a battery replacement fund, about one third would go for the field. technician costs and the remaining third to the SEC for its administrative and supervision costs. It was recognised that the SEC would lose money at this level of fee and JICA provided additional funding to subsidise the SEC for the first years of operation with the expectation that at least 500 systems would be installed within five years if the pilot project was successful.
A pre-installation survey to determine probable acceptance of systems indicated about 120 households wanted systems. Since only around 55 systems would be available, a lottery was devised to provide for a fair distribution of units. When it came time to actually pay the deposit for the systems, less than 40 paid. In order to be able to install all the available systems, the Island Council agreed to pay the installation fee for the remaining systems and install them on council employee homes with occupants paying the monthly fee. The installations were centred on the Island Council village of Abaokoro and were installed on homes from Kainaba north to Taborio.
The home installations included:
2-55Wp panels from various Japanese manufacturers; 1-16A shunt type controller (LR-114-12) made by STECA (Germany)*; 1-110Ah C100 Furukawa open cell Battery (12CTE-110)*; 1-11W PL lights (from New Zealand); 2-7W PL light (from New Zealand); and 1-LED night light (locally made) *two systems were installed with sealed 120Ah C100 batteries and Furukawa 30A MD200-PVI controllers for trial.
The maneapa installation at Kainaba included;
12-60Wp panels (Kyocera); 2-16A shunt type controller (LR-114-24) made by STECA (Germany)*; 4-110Ah C100 Furukawa open cell Battery (12CTE-110); and 4-20W 24V tube lights (from Japan). *circuit board specially coated with a silicone rubber film to protect against moisture and salt entry
The maneapa system was installed as two separate systems of 360Wp @24 volts. This allowed the use of the same specification of batteries and controllers as the household systems and provided for light even if there was a component failure in one system.
Table 4-3 – Estimated PV installed since 1990 (kWp)
Type of installation
Estimated Installed Capacity
(kWp)
SHS under the utility concept 35
SHS privately installed 14
Public and commercial lighting systems
15
TSKL 10 PWD Water supply 9
Street lights 3 Health Centres 7 Total Estimated Solar Capacity (Wp)
93
Source: SEC and MW&U

37
Figure 4-3 - Maneapa panel installation (Kainaba)
Source: JICA (1992)
Household systems were installed on a steel, hot-dipped heavily galvanised pole. The maneapa system was installed in two sections near the ground with PVC pipes filled with concrete acting as the supports for the hot-dipped galvanised frame. Two household systems included data loggers that recorded voltage and current parameters and also the time of turning each light on and off.
Three persons were selected, based on interviews, by the SEC as trainees to be field technicians. They and members of the Tarawa SEC technical staff were trained by the JICA team in the installation and maintenance of the systems. The persons receiving training installed the systems with the assistance and supervision of the JICA team. The North Tarawa trainee judged to be the best of the three was hired as the North Tarawa field technician with the responsibility of visiting each installation on a monthly basis, doing preventive maintenance (especially checking battery electrolyte levels) and collecting user fees.
The battery manufacturer recommend that the open cell batteries be charged up to 15.3V for best service and the charge controllers were set to shut off the charge at that voltage. It was soon obvious that although this high charge limit resulted in a high level of charge for the battery it also resulted in a high rate of water loss and required the technician to check at least twice a month to be sure that the electrolyte level was not too low. To determine what charge cut-off voltage would be acceptable, several controllers were adjusted to a series of lower set points and
Figure 4-4 - Household panel Installation
Source: JICA (1992)

38
water loss measured. A set point of 14.4V was determined to provide the best level of charge completion with an acceptable monthly water loss.
Although there were no significant technical problems, the field technician had serious problems accounting for the money that he collected. As a young man, he was unable culturally to say no to his older relatives asking for “loans” and as a result he was soon more than $400 short in his payments to the SEC. The SEC changed its policy from hiring on the basis of trainability for high technical competence (typically young persons) to one based on probable ability to collect and account for fees – typically older persons with some social seniority. Since the technical demands on the field technician are not great, this approach has worked satisfactorily with fewer problems relating to accountability of collected money but without compromising maintenance.
EU Lomé II PV Follow-Up Project (1992-1995)
In 1994, to close out the long running Lomé II Pacific Renewable Energy Programme, five countries, including Kiribati, were selected to receive solar PV projects. Since the JICA pilot ran very well with a high percentage of fee collection and excellent technical performance, the Kiribati project was designed to expand the initial JICA pilot project to reach more distant islands while using the same institutional structure and the same size of system. The EU project was considered as a pilot trial for outer island electrification using PV while the JICA project was considered as an institutional and technical pilot for the “solar utility” concept. The project was designed and managed by S.P.I.R.E. and operated from 1992 - 1994.
Capacity building was a major component of the project and week long training courses in PV technology, PV system design, specification and tendering, and project development were provided by S.P.I.R.E. over the term of the project and local staff were intimately involved in the design of their project and its implementation.
For Kiribati, the project allowed the further electrification of North Tarawa by making an additional 100 PV systems available to households. With this increase in the number of systems and the much expanded size of the electrified area, a second technician was hired for North Tarawa. The basic rule of thumb used by the SEC is that one technician can typically handle no more than 125 households and in some cases where the distance between villages is great, that number may have to be reduced.
The islands of Nonouti and Marakei were selected to each receive 75 PV systems. Components for all five countries were tendered at the same time and Kiribati elected to tender for the production of controllers using the well tested and reliable Pacific Controller design developed by S.P.I.R.E. in the 1980s. The SEC was awarded the contract for all controllers under the five country EU project and, though it was the first time any electronic manufacturing had been attempted in Kiribati, the controllers were delivered and accepted by all five countries.
For the Kiribati project the components selected under the tender were:
2 – 55W p solar panels (Siemens); 1 – 20A SEC manufactured charge/discharge controller; 1 – 100 Ah @ C10 open cell, tubular positive plate battery (Oldham); 1 – 11W PL 12V light (New Zealand); and 2 – 7 W PL 12V lights (New Zealand).

39
In this case, the good results from the earlier North Tarawa installations helped with customer acceptance and the 100 systems that were allocated for North Tarawa were all taken quickly. Scepticism remained on Nonouti and Marakei and several site visits were necessary to get all available systems accepted by households.
Most installations had panels installed on treated wooden poles with treated wooden mounting racks for the panels. In a few cases where the best solar access was at the house, a roof mount was used. Since Kiribati residences typically consist of several small structures instead of a single multi-room building, underground connection between structures was commonly used.
Three technician trainees were selected from each of the three islands and brought to Tarawa for training in installation and maintenance. The systems were installed using SEC technical staff and contracted supervisors from Tarawa with trainees from all three islands participating. After installations were completed, a final inspection was made by the EU consultant and the few problems that were found were corrected by the crews and the systems placed in service.
Even with over 300 installed systems, the SEC could not break even on just user fees. Various estimates for break-even numbers were made with 1000-2000 systems considered necessary for profitability of the SEC on user fees alone. Although subsidies were offered, the SEC management rejected the offers in favour of increasing their profitability through implementation of additional donor, private or government projects. The SEC actively promoted the sale of private installations and donor projects for public infrastructure including clinics, schools and telecommunications installations. The success of the existing project prompted acceptance of many project proposals. Canadian aid provided funding for large outer island clinic installations, UNDP funded a series of solar pumping projects and installations were ordered by private institutions, mostly schools and churches. Also, the SEC continued manufacturing the S.P.I.R.E. controller for sale internationally with orders from Tonga, Fiji and Bhutan. These sales, which in most cases included installation contracts as well, provided the additional funds necessary to maintain a positive cash flow for the SEC while awaiting an expansion project to take the total user base beyond 1000 systems. Additional income came from contracts with the Department of Education and Department Health for maintenance of their PV systems on outer islands. By 2000, all the islands of the Gilberts group (except Banaba) had an SEC agent/technician on island available to do PV repairs under contract to private or public customers with payment to the technicians made on the basis of the systems to be maintained.
Figure 4-5 - Battery testing training (Lomé II)
Herb Wade

40
The EU Solar Rural Electrification Project (1999~2006)
Between 1994-1999, JICA and the EU both sent inspection teams to determine the relative success of their projects. Both recommended that additional systems be installed to increase the user base and work toward completion of Kiribati’s rural electrification. A proposal was sent to JICA in 1996 but the GoK placed harbour development as a higher priority than solar. In 1998, the EU inspection team encouraged the submission of a request for additional systems and in 1999 the request was granted and the process begun for a major expansion project. A budget of €4 million was provided and tenders sent out for the management firm. A management contractor was selected in 2000 but due to a technicality, the number one rated contractor was disqualified along with the other top three tendering companies. In 2001 the contract was offered and signed by the fourth ranked company that had tendered.
Work on development of the project actually started in Kiribati in 2001, over a year later than originally estimated. Since the SEC was anticipating being fully occupied with the expansion project in 2000 and 2001, the company had not developed side projects for cash generation and found themselves in a difficult situation regarding cash flow. The Government of Kiribati was approached for PV project funding and agreed to fund solar street lights for the Betio-Bairiki Causeway. However even with that project, it was necessary for the SEC to draw down the battery replacement fund and cut back on Tarawa labour expenses to maintain operations while awaiting the cash flows from the EU project. By 2003, some of the original JICA batteries were beginning to fail but funds were not available for their proper replacement. From late 2002 through 2003, the quality of service to many customers deteriorated and fee collections fell making the cash flow situation worse. Low cost car type batteries were purchased to at least temporarily restore service to many customers and a loan/grant was requested from the Kiribati government to keep the company solvent.
The component tenders were sent out in 2002 and purchases made in 2003. The components selected for the new EU project are identical to those that used in the 1994 PV Follow-Up project that had provided nearly 10 years of high reliability service.
By late 2003 services provided to the EU project began to bring in cash and by May, 2004, when installations began on North Tarawa the cash flow crisis appeared to be over.
Approximately 1500 household systems and around 140 maneapa systems will be installed under the project. The intent is to complete full electrification of North Tarawa, Nonouti and Marakei, providing systems to all households who want them.
Figure 4-6 – Organisational Structure of the SEC in 2004
Source: SEC (2004)

41
The remaining systems will be distributed to all the remaining islands of the Gilberts group that can assure a minimum of 75 paid installations. Political pressure may require the installation of a smaller number on some of the small islands, particularly Banaba where there are less than 75 households on the island.
A major problem facing the SEC is the fact that inflation has increased the company operating costs but the SEC failed to follow the recommendation of both the JICA team and the EU PV Follow up team to annually review the fees and raise them as necessary to compensate for cost increases. From a marketing point of view, it would make placing the new 1500 systems difficult if there were an immediate increase in user fees so at least at the time of installation it was considered important not to increase fees above the existing $9 per month. One option would be to request an operating subsidy from the government (as is the case with PUB and many other government corporations) but the stated policy of the SEC is to operate without subsidy in order to avoid the government interference and operating efficiency problems faced by other government owned corporations, like the PUB, that depend on subsidies. The approach being taken is to start the new systems at the existing $9 per month rate (plus added fees for extra services, e.g. $1 per month for the addition of a high efficiency DC/DC converter to operate a home radio) and over the next 10 years gradually ramp up the fees to ensure sufficient cash income to meet the cost of future battery replacements as well as day to day operating expenses.
The remaining installations should be completed in 2005 with all 2000 rural PV systems then operational. The challenge will be for the SEC to smoothly expand its capacity from management of 320 systems on three islands to 2000 systems spread over all the Gilberts group.
For the future, the goal is to further expand with at least another 2000 installations by 2010. This will require external funding and a project proposal will be submitted in 2004 so that funding can hopefully be made available by at least 2007.
4.2 Lessons Learned
Technical
• 100 Wp is the minimum acceptable panel capacity for rural Kiribati.
• Good quality batteries can provide continuous service for 10 years and more if reliable charge controls and adequate panel capacity are included in the system design.
• Rainwater can used for battery water replacement if carefully collected and stored.
• Positive displacement pumps are not a good choice for ground water pumping in an atoll.
• The S.P.I.R.E. Pacific controller design can be successfully manufactured in Kiribati and can provide substantially higher reliability and longer battery life than off-the-shelf commercial controllers.
Institutional
• A majority of rural households in Kiribati can and will pay A$10 for basic lighting and radio services.

42
• Fee collection rate depends on quality of service provided and on willingness to disconnect for failure to pay fees.
• Field technicians need to be sufficiently mature to have the respect of the community and to be able to fully understand their responsibility for funds management.
• One field technician can successfully manage 100-120 household systems for maintenance and fee collection.
Commercial
• Development of reliable energy service company operations increases the opportunity for the sale of PV systems and for service of private installations.
• Management of personnel is the most difficult part of energy service company operations.
• Good quality accounting and records management are essential to successful energy service company operations.
4.3 Proposed Renewable Energy Projects
4.3.1 Further electrification of the Gilberts
With the completion of the EU project, approximately 25% of outer island households in the Gilberts will be electrified. Based on past experience, approximately 50% of rural households can be expected to accept solar electrification from the SEC. Therefore, a new project to develop an additional 2000 SHS for the Gilberts should be initiated immediately so that actual installation can begin to take place within five years.
4.3.2 Wind resource assessment for Tarawa and Kiritimati
The two urban islands of Kiribati can take advantage of wind power as a supplement to the grid if the resource is sufficient. A wind resource assessment should be begun immediately with measurement sites chosen as those most likely to be suitable for installation of a wind farm for connection to the grid. Lagoon and reef sites should be included for consideration as possible locations.
4.3.3 Electrification in Line and Phoenix
By far the fastest growing are of Kiribati is the Line group of Islands. If renewable energy is to be a major source of electricity for the development of the Line Islands, it is important that there be planning and development of the necessary renewable energy projects now since the time scale required for implementation of renewable energy electrification is invariably longer than that for conventional sources and the longer the delay in preparing renewable energy projects for the Line Islands, the further along will be the development of conventional energy sources.
4.3.4 Biofuel development
A detailed feasibility study of the economic, technical and logistic aspects of medium to large scale development of coconut oil for fuel appears warranted. If the study indicates that biofuel as a diesel replacement appears to be physically, technically and economically reasonable for Kiribati use, then there should follow a pilot project on

43
one or two islands for the use of coconut oil to locally manufacture fuel for small diesel generators and vehicle engines.
4.3.5 Grid based solar
Both Tarawa and Kiritimati have a large enough peak load to be able to take advantage of solar supplementation of the grid. A small scale trial of around 12 kWp of solar arranged in 3 to 4 kWp modules is recommended as a pilot project. It is not recommended that PUB or PWD install and maintain the PV systems. The project could be installed and managed by the SEC with generated power sold to the grid from the solar installations to repay the cost of operation and maintenance.

44
5 BARRIERS TO DEVELOPMENT AND CO MMERC IAL IZAT IO N OF RENEWABLE ENERGY
5.1 Specific Barriers
5.1.1 Fiscal and Financial Barriers
At the top of the list of barriers must be those relating to the relative cost of renewable energy, both in terms of its actual financial cost and the cost of shifting from familiar and convenient fossil fuels to unfamiliar technologies. Fiscal policies include import duties that unfairly tax renewable energy systems, taxes applied to renewable energy systems that are biased against renewable energy and inadequate government budgets for renewable energy development.
Taxes and import duties for renewable energy in Kiribati is an issue since virtually all renewable energy development of any capacity will be developed by the SEC and other commercial enterprises. The SEC has the lead role for PV and other private sector activities are expected to include solar water heating and possibly biofuels, though government is most likely to be the primary investor in biofuel production.
The real cost of electricity delivery by PUB is not known. In addition to the problem of poor record keeping, the PUB operates water, sewer and electrical services and their costs are not adequately separated to enable the understanding of the real cost of any of the services. This makes development of alternatives to existing generation difficult because it is not clear what costs are being offset.
Dependence on external funding for projects. That limits opportunities for funding, adds complexities to project development and also imposes limits on the types and sources of renewable energy technologies that can be used to those considered acceptable by the donor agencies.
Duties and Taxes are applied inconsistently. Duties and taxes affect KOIL, PUB and the SEC differently and their application tends to show a bias against the SEC lowering their ability to compete with the other forms of energy supply.
5.1.2 Legislative, Regulatory and Policy Barriers
For there to be a consistent focus for energy development, a national energy policy is essential. Though there have been several draft policies, none were accepted by government as they tended to be externally developed and did not represent the priorities of government or the public.
There is no National Energy Policy accepted at all levels of Government. Without a clear policy and energy strategy, the EPU will of necessity continue to focus on immediate problems and opportunities rather than on long range planning and achievement of policy goals. With an accepted national energy policy, shifts in energy policy when governments change should be much less than is currently the case and the SEC, PUB and KOIL can be more confident that their long range plans can be followed.
5.1.3 Institutional Barriers
Throughout the Pacific, one of the main points of failure in renewable energy projects has been institutions that are inadequate to provide sustainable operations. Each form of renewable energy has specific technical and institutional structures that must be in place for receiving payment for energy services, maintenance of equipment and

45
installation of new components. In Kiribati the only existing institution able to fulfil those requirements is SEC. For biofuel production and distribution, an institutional structure will have to be developed, though the existing coconut oil mill may be a good starting point.
Limited capacity for energy planning and project development at the EPU. With only three positions (and one currently vacant) it is not possible to have the broad range of skills needed to cover the national energy planning and energy project development needs. The problem is made worse by the need for overseas training of staff that takes personnel away from the office for months and sometime years leaving the EPU even more short handed. Turnover is relatively high meaning that the average experience level tends to be low.
Limited capacity for financial planning and analysis at the PUB, SEC and KOIL. A continuing problem for the management of the Kiribati energy companies is a lack of capacity for long term financial planning and analysis. Large investments must be made and that requires that detailed planning take place years before the actual need for the investment. The energy companies have not yet been able to do adequate forward planning for cash and investment requirements for more than six months to a year in the future. At least a three to five year forecasting and analysis capability is needed. Although the SEC has expressed concern regarding their difficulty in obtaining loans for working capital, the problem does not appear to be a lack of available finance in Kiribati but rather the problem of management not realising that there will be a need for working capital influx far enough in advance to plan for the need instead of it becoming a last minute emergency problem.
Poor record keeping and data management in the energy companies. Though the EPU has one of the best kept national databases in the region, the data provide by the energy companies to the EPU has been late and of poor quality. The ADB attempted to shift the PUB to computerised accounts in 1992 but the system introduced was complex, unique to the PUB and could not be maintained in Kiribati. As a result the PUB has reverted to customer accounts maintained largely on cards and in account books. This causes a serious delay between transactions and the time that management can be made aware of them. The PUB has not provided auditable accounts to government auditors in years and is not really in control of its own finances. Data on operations at the PUB is somewhat better than the financial accounts but clearly some of the numbers entered in the generation and sales records are spurious and lack sufficient accuracy and content for management to be able to clearly understand the nature of system technical and non-technical losses in order to take action for their reduction. For KOIL, it took three months to get basic petroleum import data. There are no power system records for Kiritimati that could be made available on Tarawa. The SEC is much better than the PUB regarding its accounts – but they have been tracking only 350 customers instead of 5000 and it remains to be seen whether or not they will have problems maintaining proper accounts after their 1500 new customers come on line in 2005.
Lack of local training capacity in business management. The technical service business is fairly new to Kiribati and the management problems quite different from the trade related businesses that have long experience in the country. The need for up to date and detailed customer records, spare parts control and service logistics is not being met very well by Kiribati service businesses. Thus there is a need for training and advisory support. Although USP maintains a facility on Tarawa and provides

46
basic business courses, they are primarily intended for students seeking a certificates or degrees and are not oriented toward the practical problems of managing a business in Kiribati.
Lack of availability of trained or experienced personnel either for management or for technical positions. This lack means that significant time and money must be made available for formal and on-the-job training. Also it must be accepted that a year or more may pass before the new employee is really able to perform the required tasks.
5.1.4 Technical Barriers
Although the technologies that are expected to be used in Kiribati are mature and in wide use around the world, the difficult environmental conditions of Kiribati cause problems with many of the mainstream components in use around the world and this represents a significant technical barrier to introduction of renewable energy technology.
Difficult environmental conditions for energy equipment. Energy equipment, particularly high-technology electronics used for control systems, has not survived as long as expected in the salt-laden, high temperature and humidity environment of Kiribati. Over the years, equipment has been located or specifically designed that works well for SHS but for grid connected or hybrid installations, there is no field experience.
5.1.5 Physical Barriers
Physical barriers are not directly amenable to barrier reduction. They must be figured into any renewable energy system design and effort made to reduce their harmful effect.
Widely dispersed population on numerous atoll islands. Kiribati has the most difficult access conditions of the Pacific with 32 islands totalling only 811 km2spread over an area 4200 km from east to west and 2000 km from north to south.
5.1.6 Market Barriers
Market barriers are those that reduce opportunity for private enterprise to participate in developing renewable energy. The primary market barrier of small size is basic and not amenable to externally delivered barrier reduction programmes.
Poor quality air and surface international shipping. Attempts to develop overseas markets for solar controllers has met with serious problems obtaining reliable air shipment of raw materials into and finished products out of Kiribati. Even premium air shippers like DHL and UPS have been found to be unreliable for shipment to and from Kiribati. Surface shipment is slow with a number of freight forwarding points between Kiribati and most markets slowing down shipments and increasing the risk of damage or loss. The quality of service in Kiribati is also poor. A full container of batteries was “lost” on the Tarawa wharf for six months with probable damage to the contents due to the high temperatures inside the container.
Problems of access to outer islands. Within the Gilberts, though all islands (except Banaba) have scheduled air services, air freight capacity is minimal and air passenger service is limited to only about 20 persons per flight. By ship it is difficult to arrange

47
personnel visits of less than two weeks. This makes installation, spare parts delivery and supervision visits very expensive. For access to the Line and Phoenix islands, the problems are much greater than for the Gilberts.
Small size and fragmentation of the energy market makes development of generation and energy efficiency businesses unlikely. Effectively, Tarawa and Kiritimati represent the only opportunities for energy efficiency businesses. Generation of electricity on outer islands is unlikely to be profitable for private business and the opportunity for cogeneration or IPP development is very limited on Tarawa and Kiritimati.
5.1.7 Informational and Public Awareness Barriers
For renewable energy technology to be accepted, it is important that people at all levels understand its benefits and its problems and become familiar with the idea of replacing fossil fuels with renewable technologies. Various public awareness programmes have been established in the region but Kiribati has none presently in place.
Lack of public awareness regarding renewable energy. Although the. success of the SEC with PV electrification has resulted in public acceptance of home electrification by solar energy, there is little awareness of the role that solar PV can play by supplementing grid power or the possibilities that exist for biofuels.

48
6 IMPLEMENTATION AND CAPACITY DEVELOPMENT NEEDS FO R BARRIER REDUCTION
6.1 Reducing Barriers Through Capacity Development
6.1.1 Fiscal and Financial Barriers
Project development support. There is some problem accessing project finance due to problems with the development of project documentation acceptable by financing institutions. As part of regional capacity building efforts, specific programmes in project development, project document preparation, economic analysis and interfacing with international finance agencies should be developed and delivered to Kiribati. These need to focus not only on the SEC, PUB and EPU but also on any other agency, public or private, that has a need to access international finance for renewable energy projects. The EPU, SEC and PUB all could benefit from increased capacity for economic analysis, logical frame work analysis and budgeting for project development.
Fiscal policy development. Taxes, import duties and government purchasing policies have an impact on the cost of renewable energy relative to fossil fuels. Government officials responsible for these policies should be made aware of the effect these policies have on the development of renewable energy and energy efficiency measures. This can be done through a regional capacity building programme that provides informational materials and training for the appropriate officials.
6.1.2 Legislative, Regulatory and Policy Barriers
Energy policy development. Over the past decade there have been several attempts to assist PICs to develop energy policies. A problem that has been common to those attempts is that the policy concepts have been developed externally and though those policies have sometimes been formally accepted by countries, their application has been minimal because the governments that must implement the policies had little real input to the policy making process. For written policy to be effective it must be implemented and for implementation to take place, implementers must have a stake in the success of the policy. The PIEPSAP project is addressing this issue starting in late 2004 and is expected to thoroughly involve the government in the policy development process so that the resulting policy will be one that is acceptable by the present government and can be expected to continue to be acceptable by future governments.
6.1.3 Institutional Barriers
Management capacity development. Most of the problems facing the energy sector in Kiribati relate to poor management of available resources and a lack of management capacity to accurately forecast needs and take action in a timely and appropriate manner. Short course training needs to be made available in Kiribati to upgrade the skills of existing managers of energy programmes. This is to be addressed under the ESCAP developed regional training plan.
The capacity of TTI to train electrical trades people needs to be improved. TTI facilities and staff need to be upgraded to meet the training needs of both PUB and SEC and course modules on SHS and grid based solar electrification included. Staff training and facility upgrading are both needed. Since this is also needed in several other PICs, a regional programme seems appropriate.
49
Development of record keeping, storage and retrieval capacity at PUB and SEC. The PUB, and to a lesser extent, the SEC need to further develop their data gathering, data recording, data analysis, data storage and data retrieval capacities if long range planning, financial analysis, technical improvement and capital development is to be carried out on other than an emergency basis. Without access to updated and accurate data, it is not possible to properly plan for the future or to understand the cause of problems today. Given the generally poor energy records found in the PICs by the PIREP team, this is a candidate for a regional capacity building programme.
Assistance is needed by the EPU, SEC and PUB in the development of grid connected renewable energy systems. There is no experience in Kiribati with Pips or cogeneration. If renewables are to provide input to the urban power sector, the local capacity must be developed through external assistance and small scale trials developed specifically for the gaining of practical experience with the technologies to be used. The EPU will need to develop legislation, standards, regulations, etc. relating to the connection to the grid of renewable energy systems. The SEC will need to understand the technology necessary for the successful connection of solar PV systems to the grid and the PUB will need to develop procedures, installation standards and operational regulations to ensure maintenance of power quality and safety for maintenance personnel. PPA is planning an introductory training for utilities for grid connected renewable energy but will not accept non-members to the course. In any case the course planned is basic and introductory and a more in depth technical programme is needed on a regional basis.
6.1.4 Technical Barriers
Development of standards and certifications for RETs. Although there are international standards already developed and being developed for RETs, they are generic and must be fitted to the local situation. Because equipment must be manufactured to survive under the harsh conditions of Kiribati, those requirements need to be embodied at least as purchasing guidelines or, better, as actual standards for the purchasing of RET equipment. Unlike the training programme, a standards and certification development programme needs to be done only at several year intervals. As this is a multi-country issue, with similar problems facing Tuvalu, Tokelau, RMI and FSM, a regional programme is appropriate.
6.1.5 Physical Barriers
Although nothing can be done to bring the outer islands physically closer, much of the management impact of this barrier can be removed through the development of good quality data communications between outer island SEC employees and the main office on South Tarawa.
6.1.6 Informational and Public Awareness Barriers
Delivery of renewable energy information to decision makers. Through in country programmes, sessions at international assemblies of decision makers, PPA annual meetings, SOPAC meetings, Forum meetings and other venues, information needs to be provided decision makers regarding the appropriate technologies for Kiribati and problem areas that need to be avoided. EPU staff and cabinet advisory staff should receive specific information packages and, where possible, actual training on the manner that RETs can aid national development and on the best approaches to energy strategies using energy efficiency and renewable energy methods. This is a need

50
common to most of the smaller PICs and can be developed into a regional programme.
Public information programmes. Although solar energy for home electrification is well known, there is little public knowledge about biofuel, biogas, wind power or hybrid systems for Kiribati. As this is a need for most of the PICs, the necessary public information materials can be developed regionally and delivered to countries along with short term training and advice in their proper delivery.

51
7 IMPLICAT IONS OF LARGE SCALE RENEWABLE ENERGY DEVELO PMENT
Only two technologies, solar and biofuel, are known to have the potential for large scale renewable energy implementation in Kiribati. Wind power may be found to also be a cost effective component for electricity generation in some places but until several years of resource assessment can be carried out, the practicality of its development is unknown.
7.1 Solar development
7.1.1 Rural electrification
The widespread use of solar for rural electrification can improve education, communications, health and public safety. For the mid-term, it appears that individual SHS represent the best approach to rural electrification in Kiribati as long as the SEC is able to provide the level of services to each household that specifically meets the needs of that customer. The use of individual SHS eliminates the very costly buried cable reticulation needed for grid based power delivery and the land tenure issues that are associated with developing reticulation right-of-ways. Further, it eliminates the problem of all households losing power simultaneously due to technical faults. The primary environmental problem associated with SHS use is battery recycling. By using high quality, 10 year batteries the need and cost for recycling is greatly reduced. Arrangements made with the Foundation for the People of the South Pacific, Kiribati (FSPK) to handle the logistics of battery recycling for a small fee should minimise this problem.
In addition to the social development aspects, the large scale use of SHS on outer islands has economic benefits through the employment of maintenance technicians and support staff resident on the rural islands as well as through the reduction in imported kerosene for lighting and diesel fuel for generation.
7.1.2 Urban electrification
Solar photovoltaics, probably in 4-10 kWp self-contained generation modules distributed through out the urban grid system, can provide up to about 25% of the instantaneous, daytime electricity demand for Tarawa and Kiritimati without the use of very expensive energy storage systems. However, since the PV only provides energy during the day and that varies not only over the day but with the changing weather, it is not likely that the total energy input would much exceed 5% of the total energy delivered by the grid unless battery banks or hydrogen production and storage is included. Though it may be cost effective to include the solar supplement to the diesel power without storage, it is currently not cost effective to include solar with storage and that will continue until the cost of fuel rises or the cost of the storage falls. The inclusion of large scale solar for grid based power would have little or no affect on social or economic activities and should present little or no environmental problems if storage is not used.
7.2 Wind power for urban island power production
Should the wind resource prove to be adequate for the production of electrical energy at a cost that is acceptable, up to as much as 20% of the instantaneous electricity demand of an urban island could be delivered to the Tarawa or Kiritimati grid without resorting to storage or complex power management systems. Due to the inconsistency

52
of the resource, the total energy delivery to the grid probably could not be greater than about 10% of the total grid delivered energy. To achieve that level of penetration on Tarawa is expected to require around 0.8 MW of installed capacity, a substantial wind farm. There is no opportunity for installation of that large a wind farm on land so lagoon or reef installation would be required. That increases the cost of installation and maintenance and therefore the cost of energy from the wind farm. The environmental impact of a reef or lagoon mounted wind farm is not known but would probably not be large. A Kiritimati installation would be smaller and there is much more available land so reef or lagoon installation may not be required.
There is unlikely to be any specific measurable impact on society brought about by adding wind power to the urban grid. Overall, it could benefit the economy through offsetting some petroleum imports and could provide some employment.
7.3 Biofuel production to offset diesel imports
The large scale use of biofuel to replace diesel for transport and electricity generation could result in significant economic benefit to the rural areas of Kiribati through increased sale of coconuts, copra and/or oil. It could also remove the problem common to outer islands of running out of fuel before a shipment arrives. However, there will also be problems associated with large scale use of biofuels. A significant problem will be the need for rejuvenation of the coconut tree source. According to the Imperial College Resource assessment, many if not most of the trees are over 50 years old with attendant drop in coconut production. A large scale replanting of trees will be needed in order to obtain the maximum benefit from biofuels and that would result in a great deal of biomass (tree trunks and fronds) that will need to be disposed of in a fashion that will be environmentally acceptable. The development of local sawmills for production of coconut lumber for the urban based manufacture of exotic wood furniture or structural materials may be an option. Also, depending on the size of the replanting that is needed and the time span it will take to complete the task, gasifiers or small steam systems could be used for electricity generation using the released biomass.
As a part of the large scale development of biofuels, an institutional arrangement that assures land owners, nut collectors and nut processors receive a fair share of the proceeds will be essential. Also careful evaluation should be made of the options for processing (whether whole nuts, copra or finished oil should be shipped from the outer islands) and their effect on the end cost of the biofuel as well as the effect of the scale of production on the biofuel price.

53
8 ENERGY EFF IC IENCY OPPORTUNIT IES
Renewable energy cannot impact urban energy as easily as rural energy since the cost of conventional energy delivery is much lower. Therefore, for renewable energy to provide the highest possible percentage of energy supply for South Tarawa and Kiritimati Islands, energy efficiency measures should accompany any large scale implementation of renewable energy for urban islands.
8.1 Petroleum Use Efficiency
Transport is the largest user of petroleum in Kiribati. Marine transport and electricity generation are the major users of diesel fuel. Inter-island air transport, cooking and lights are the largest internal uses of kerosene. Automobiles on Tarawa and Kiritimati along with outboard powered private boats represent the main use of petrol. LPG is rapidly growing as a replacement for kerosene for cooking.
Within these use sectors is scope for significant improvement in petroleum use efficiency, particularly with regards to marine transport where scheduling, maintenance and ship management significantly affect the use of fuel.
Automobile use of petrol is often inefficient and with some focused effort can be significantly improved in efficiency. Special attention should be given to improving fuel efficiency in the public transport and government transport sectors and providing incentives for shifting to diesel so that biofuels can offset petroleum for transport as well as electricity generation.
8.2 Electricity Efficiency
The supply side efficiency should be reasonably good since the JICA upgrade project has installed new and adequately sized equipment for the PUB. However, there have been no concentrated efforts to improve demand side management (DSM) and there are many possibilities for more efficient electricity use, particularly in government facilities.

54
9 CAPAC ITY DEVELOPMENT CO-F INANCING OPPORTUN IT IES
There are no firm renewable energy projects presently scheduled after completion of the EU outer island electrification project in 2005. However, there are a number of capacity development needs that could be co-financed as the project opportunities arise.
1. Business training. A continuing programme to develop the management skills in the service sector of Kiribati through training in Kiribati would be of great value to the energy service sector including PUB, SEC and KOIL. It is important to realise that this cannot be accomplished by a one-off training programme, the training needs to be continually available as employee turnover makes retraining necessary and existing employees need refresher training. Although such training can be obtained external to Kiribati, the staff of the energy companies is small and the loss of even one for several months of training is a serious problem. For this to be effective, it also must be geared toward solving the unique problems of doing business in Kiribati, so local training is the only acceptable approach.
2. Development of electrical trades technical training. A rejuvenation and upgrading of the electrical trades programme at TTI would benefit the PUB and the SEC as well as private electrical trades companies. As a part of the upcoming upgrading of facilities, the facilities for electrical trade training – the training programme should include solar photovoltaic installation and maintenance – should receive some priority. Training of teachers of electrical trades should be provided with specialty training in solar photovoltaic technology. Training modules specific to solar photovoltaics should be developed for TTI and included in the standard electrical trades curriculum.
3. Assistance in National Energy Policy Development. Although there is a good understanding of the need for energy policy at the EPU, the capacity for its formal development needs development. Support through the PIEPSAP programme and other regional efforts for policy development may meet this need.
4. Capacity building for the EPU regarding project development, project management and energy data management. If renewable energy and energy efficiency measures are to be rationally and effectively implemented, increased capacity at the EPU in the planning and preparation of high quality project documents is needed. The relatively rapid staff turnover at the EPU will require repetition of capacity building efforts every few years.
5. Biofuel development assistance. Technical assistance and training related to the development and management of biofuel production in Kiribati will be needed if biofuel is to be a reasonable replacement for diesel in electricity generation and transport. This should be directed at agricultural specialists working with coconut growers as well as EPU personnel.
6. Marine transport efficiency improvements. A training programme for marine diesel mechanics, ship’s officers and ship owners needs to be developed to improve the efficiency of marine transport.
7. Tarawa public and government transport efficiency improvements. Training in energy efficiency improvement provided for public transport owners and the

55
PWD vehicle pool managers could result in 10% to 15% reductions in their fuel use and lower emissions of air pollutants.
8. Development of energy efficiency improvement fund. If the private sector is to participate in energy efficiency development, they will need finance for their customers to purchase the technology to provide the energy efficiency improvements and to guarantee that the customer will in fact receive the savings that are expected. A fund to underwrite the purchase of energy efficiency improvement equipment and to guarantee savings due to improved efficiency could make it possible for the private sector to participate.
56
10 ANNEXES
Annex A: People Consulted by the PIREP Mission to Kiribati
1) GOVERNMENT OF KIRIBATI:
Ministry of PublicWorks and Utilities
Mr. Taakei Taoaba Permanent Secretary for Public Works and Utilities
Mr Mautaake Tannang Energy Planner, Energy Planning Unit; and PIREP National Coordinator, e-mail: [email protected]
Mr Kireua Kaiea Energy Projects Officer, EPU
Mr Tiante Tarakia Assistant Energy Planner, EPU
Ministry of Finance and Economic Development
Mr Peter Tong Chief Planning Officer
Mr Kautuuna Kaitara Comptroller of Customs, Customs and Excise Division
Ms Jenny Keaki-Tonganibeia Government Statistician
Ministry of Environment, Lands, and Agricultural Development
Mr Andrew Teem Climate Change Officer; email: [email protected]
Ministry of Commerce, Industry and Cooperatives
Mr Takabea Barantarawa Commerce Officer and Price Control Officer
Mr Aritaake Ientaake Assistant Commerce Officer
2) GOVERNMENT-OWNED ENTERPRISES:
Mr Titaaake Pinatake Chairman of Board of Commissioners, Public Utilities Board (PUB), and Chairman of Board of Directors, Solar Energy Company (SEC)
Mr Tokia Grieg Chief Executive Officer, Public Utilities Board PO Box 443 Betio; [email protected]
Mr Rutete Ioteba Chief Executive Officer, Kiribati Oil Company (KOIL)
Ms Katerina Tofinga Chief Executive Officer, Kiribati Copra Marketing Company (KCMC)
Mr Terubentau Akura General Manager, Solar Energy Company (SEC); [email protected]
Dr Jens Mertens EU Adviser, SEC
Ms Tiaen Abaiota Business Development Manager, Development Bank of Kiribati (DBK)
Ms Teango Teimarawe Business Development Officer, DBK
3) DIPLOMATIC MISSIONS, PRIVATE SECTOR AND CIVIL SOCIETY / NGOS:

57
Ms Angiua Tekanene Manager Lending, Bank of Kiribati / ANZ
Mr Anthony Hughes Consultant, Kiribati National Development Strategy andClimate Change Mitigation, [email protected]
Mr Mike Fudakowski Director, Foundation for the Peoples of the South Pacific, Kiribati
Mr John Goodman High Commissioner, New Zealand High Commission
Mr John Pirie Power Utilities Engineering Adviser and Pacific Power Association Training Needs Consultant to PUB; [email protected]
58
Annex B: References for Kiribati PIREP Report
ADB, 2002 Country Strategy and Program Update: 2003 – 2005 (Manila; July)
ADB, 2002 Monetization in an Atoll Society: Managing Economic and Social Change (ADB supported by AusAID; Manila; December)
ADB, 2002 Poverty Assessment and Strategies for Equitable Growth and Poverty Reduction (Discussion Papers; Pacific Regional Department; Manila; April)
ADB, 2003 Kiribati Section, Millennium Development Goals in the Pacific: Relevance and Progress (downloaded from www.adb.org; Manila; March)
ADB, 2003 Key Indicators of Asian & Pacific Countries: Kiribati 1983-2000 (Manila)
ADB, undated Kiribati Country Data (downloaded from www.adb.org; January 2004)
AEA Technology, 1999 Evaluation of the PREP Component: PV Systems for Rural Electrification in Kiribati & Tuvalu (Project 7 ACP RPR 175; Final Report for the EU’s DGVIII Development; Brussels; March)
Cheatham, C, 1997 Business Management Assistance to the Solar Energy Company of Kiribati (Final Report (prepared by C Cheatham with Kamlesh Kumar and H N Pande; Suva; September)
CIA, 2003 World Factbook: Kiribati (updated August)
Energo Group, 2002 Solutions for Reducing the Difference Between the Optimal and Real Fee (prepared for SEC by EDF Project ‘Solar Energy for the Outer islands’; Tarawa; September)
Forsec, 1993 Kiribati Energy Conservation Project: Recommendations for Upgrading Kiritimati Energy System (prepared by Biomass Technology Group; 28 May)
Forsec, 2001 Foreign Investment Environment in Individual Forum Island Countries: Kiribati (updated July)
Forsec, 2003 Pacific Fuel Price Monitor (Edition 5; 12 Nov. 2003)
GoK, 1981 Prices Ordinance (Laws of Kiribati; Chapter 75; 1976; revised 1979 & 1981)
GoK, 1993 Exemptions From Duties (Customs Schedule 1; No 13 of 1993)
GoK, 1995 National Energy Policy in Kiribati (second draft)
GoK, 1998 Public Utilities Act (Laws of Kiribati; Revised Edition 1998; Chapter 83; incorporating amendments up to 1 September 1998)
GoK, 1999 Ministry of Works and Energy Strategic Plan for 1999 – 2001
GoK, 1999 Kiribati: Initial National Communication under the United Nations Framework Convention on Climate Change (Tarawa)

59
GoK, 1999 Environment Act (Act 9 of 1999): An Act to provide for the protection, Improvement and Conservation of the Environment of the Republic of Kiribati (Tarawa; in effect from 21 march 2000)
GoK, 2001 Energy Survey Report for Beru Island (prepared by Kireua Kaiea, EPU; July)
GoK, 2001 Environment Regulations 2001 (Environment Act 1999; Section 53)(
GoK, 2002 Energy Policy Guidelines and Issues (Energy Planning Unit)
GoK, 2002 Kiribati Country Paper (prepared by Mautaake Tannang for the Regional Energy Meeting 2002; Rarotonga; 15-19 July)
GoK, 2002 Kiribati Country Paper (prepared by Mautaake Tannang for the Middle Management Meeting; Tokyo; 2-6 September)
GoK, 2003 2004 Budget of Republic of Kiribati (as approved by Te Maneaba Ni Maungatabu; 27 November)
GoK, 2003 Energy Survey Report for Banaba Island (prepared by Kireua Kaiea, EPU; survey: September 2001; published: February 2003)
GoK, 2003 National Development Strategies 2004 – 2007: Enhancing Growth and Ensuring Its’ Equitable Distribution (Ministry of Finance and Economic Development; November)
GoK, 2003 Presentation on Kiribati Petroleum Issues (prepared by Kireua Kaiea, EPU for Kiribati Petroleum Workshop; Tarawa; October)
GoK, 2004 National Accounts: Real GDP by Industry from 1991-2002 (Statistics Office)
GoK/Forsec, 2003 Participants’ Handbook: Price Control Workshop (Ministry of Commerce, industry & Tourism; Betio)
IEEJ, 2001 Manual for ‘Simple Econometric Simulation System’ (Tokyo)
IMF, 2001 Kiribati Article IV Consultation (International Monetary Fund; Washington)
JICA, 2003 Basic Design Study on the Project for Upgrading of Electric Power Supply in Tarawa Atoll, Phase II Field Report (December)
McNamara, Luke, 1998 Institutional Strengthening of Kiribati Public Works Department (Western Institute of TAFE for AusAID CON 6356; Tarawa; September)
PEDP, 1983 Draft National Energy Policy: Republic of Kiribati (report Kiri 83-2; Suva & Tarawa; December)
SOPAC, 2003 Individual Country Biomass Resource Assessment Profile for Kiribati (from ‘Biomass Resource Assessment, Utilisation and Management for Six Pacific Island Countries’ prepared by Department of Environmental Science and Technology of Imperial College London; December)
UN, 2002 Common Country Assessment for Kiribati (prepared by Peter Johnston with Margaret Chung for the Office of the UN Resident Coordinator; Fiji)

60
Wade, Herbert, 2001 Overview Report on an Advisory Mission to Kiribati (Prepared for Ministry of Works and Energy, for Energy Resources Section, ESCAP, Bangkok; October)
WB, 2002 Kiribati at a Glance (20 September)
WB, et. al. 1992 Kiribati: Issues and Options in the Energy Sector (Volume 5 of Pacific Regional Energy Assessment or PREA; prepared jointly by World Bank with UNDP/ESCAP PEDP plus ADB and Forum Secretariat)