A Circulation Model to Investigate the Movement of Wastes from an Open Ocean Aquaculture Site David...
23
A Circulation Model to A Circulation Model to Investigate the Movement of Investigate the Movement of Wastes from an Open Ocean Wastes from an Open Ocean Aquaculture Site Aquaculture Site David W. Fredriksson U. S. Naval Academy NOAA Research - Marine Aquaculture Program Grant # NA08OAR4170859 James D. Irish University of New Hampshire Dale A. Kiefer University of Southern California Jack Rensel Rensel Associates Aquatic Sciences Frank O’brien System Science Applications
-
Upload
gabriella-dennis -
Category
Documents
-
view
214 -
download
0
Transcript of A Circulation Model to Investigate the Movement of Wastes from an Open Ocean Aquaculture Site David...

A Circulation Model to Investigate the A Circulation Model to Investigate the Movement of Wastes from an Open Ocean Movement of Wastes from an Open Ocean
Aquaculture SiteAquaculture Site
David W. FredrikssonU. S. Naval Academy
NOAA Research - Marine Aquaculture Program Grant # NA08OAR4170859
James D. IrishUniversity of New Hampshire
Dale A. KieferUniversity of Southern California
Jack RenselRensel Associates Aquatic Sciences
Frank O’brienSystem Science Applications
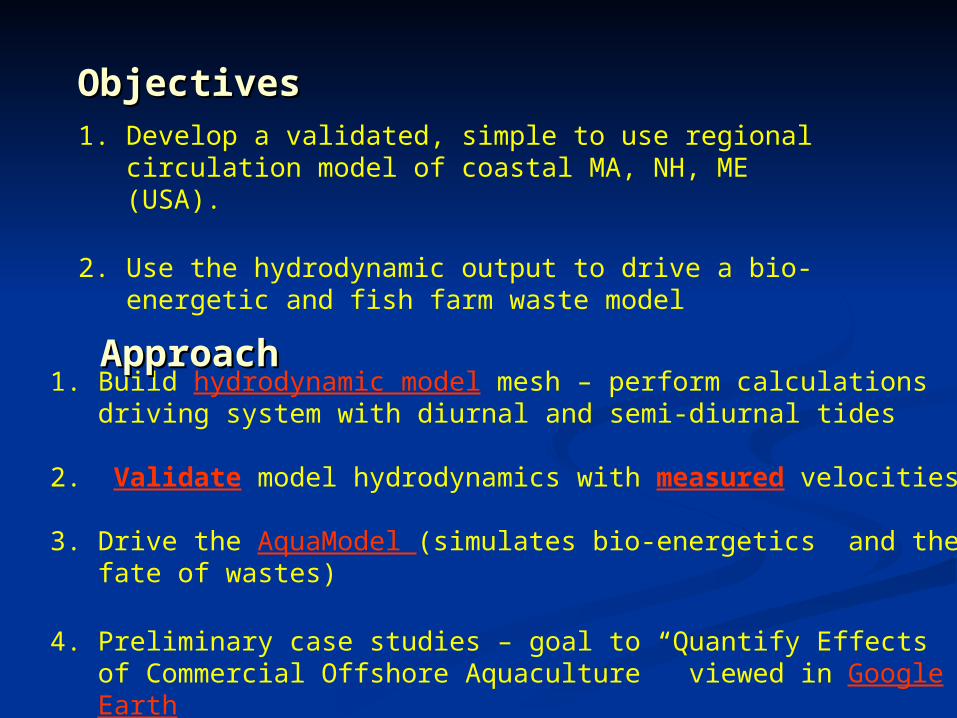
ObjectivesObjectives
1. Build hydrodynamic model mesh – perform calculations driving system with diurnal and semi-diurnal tides
2. Validate model hydrodynamics with measured velocities
3. Drive the AquaModel (simulates bio-energetics and the fate of wastes)
4. Preliminary case studies – goal to “Quantify Effects of Commercial Offshore Aquaculture” viewed in Google Earth
1. Develop a validated, simple to use regional circulation model of coastal MA, NH, ME (USA).
2. Use the hydrodynamic output to drive a bio-energetic and fish farm waste model
ApproachApproach

Hydrodynamic ModelHydrodynamic Model
1. Advanced Circulation Model – ADCIRC: Standard “off-the-shelf” depth averaged hydrodynamic model (with variations)
2. Solves shallow water wave equations – suitable for coastal applications – requires bathymetry and boundary conditions
3. Used by: U.S. Army Corps FEMA Navy NOAA Just about everyone else
4. Techniques can be taught to STEM* majors
5. Validation is the difficult part of modeling!
* Educational buzz-word for Science, Technology, Engineering and Math
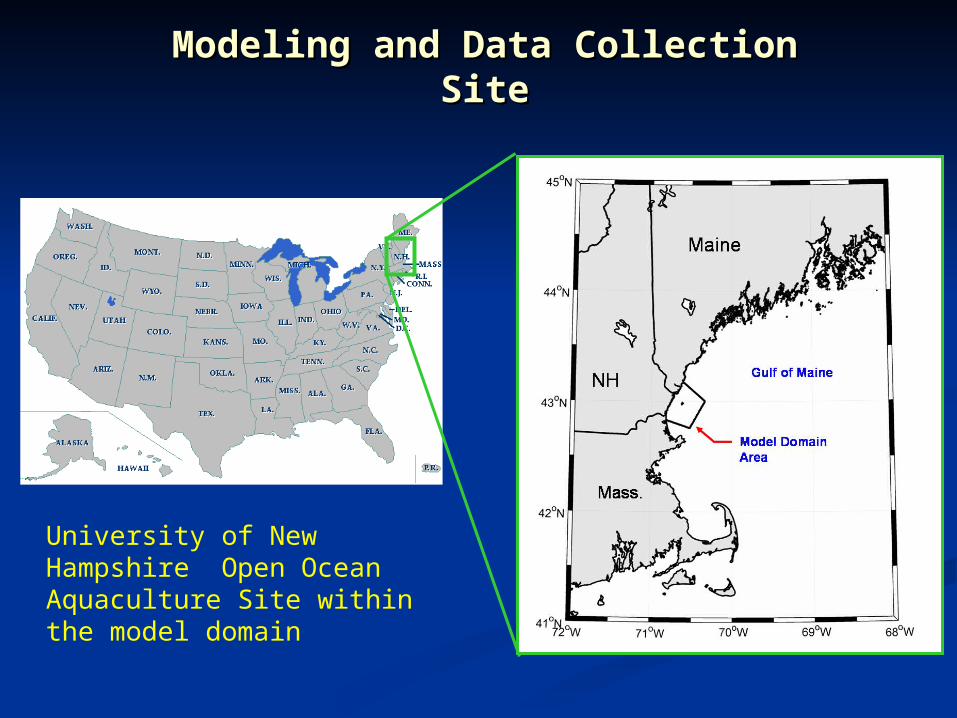
Modeling and Data Collection SiteModeling and Data Collection Site
University of New Hampshire Open Ocean Aquaculture Site within the model domain
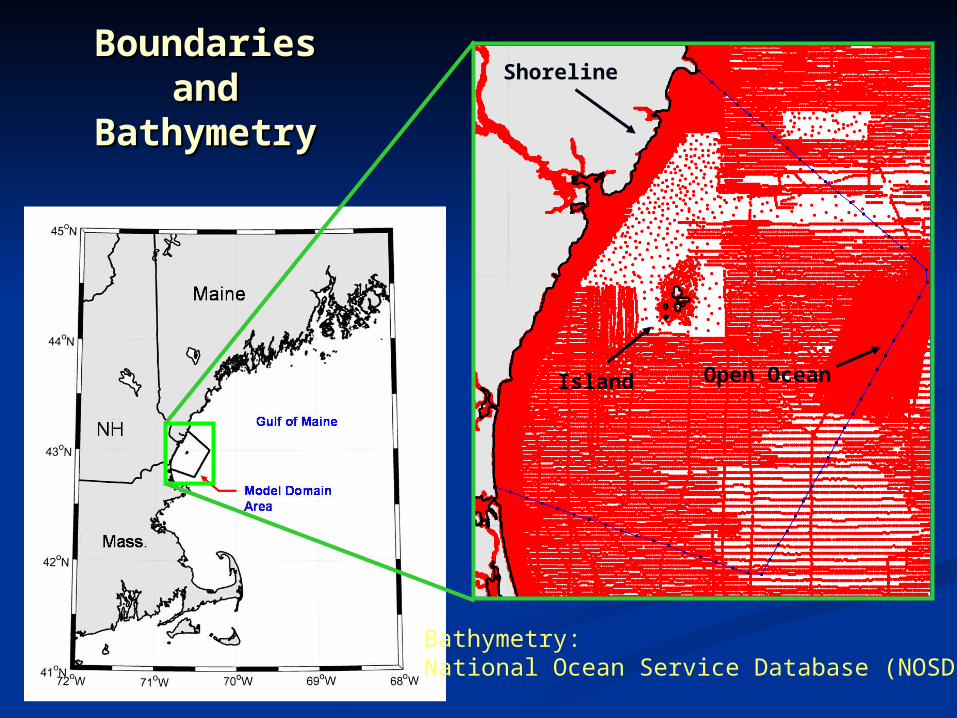
Boundaries and Boundaries and BathymetryBathymetry
Open Ocean
Shoreline
Island
Bathymetry: National Ocean Service Database (NOSDB)
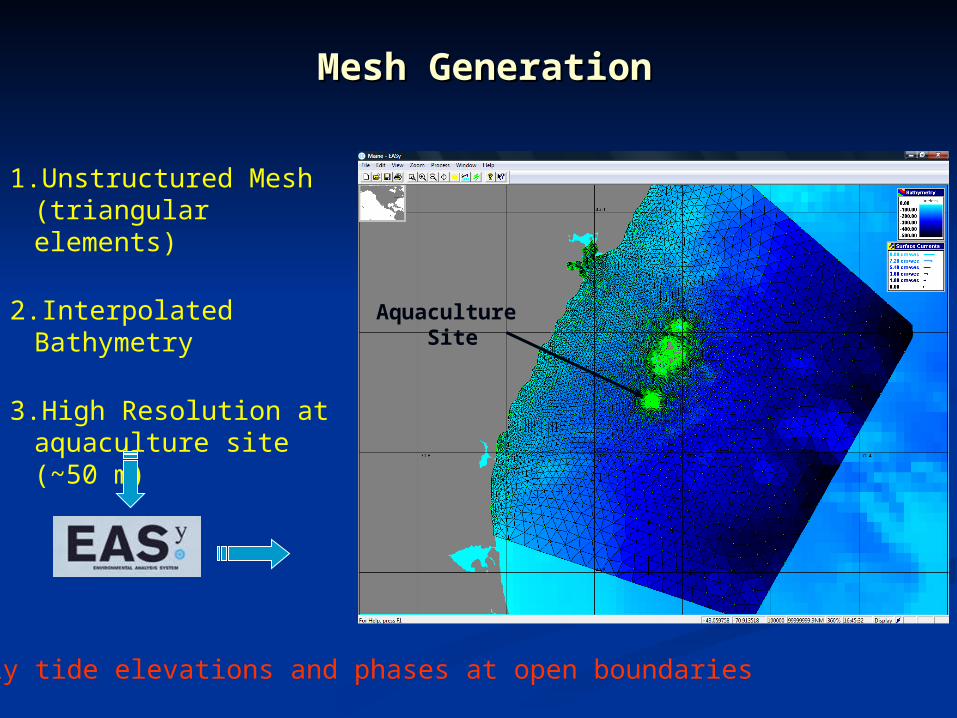
Mesh GenerationMesh Generation
Aquaculture Site
1.Unstructured Mesh (triangular elements)
2.Interpolated Bathymetry
3.High Resolution at aquaculture site (~50 m)
Apply tide elevations and phases at open boundaries
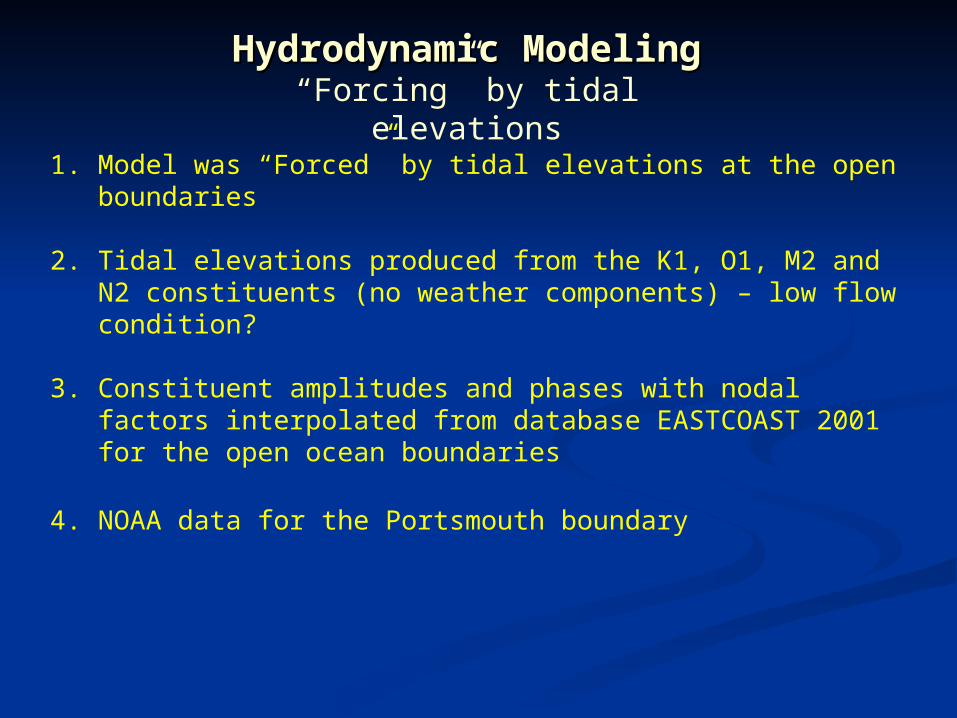
Hydrodynamic ModelingHydrodynamic Modeling“Forcing” by tidal elevations
1. Model was “Forced” by tidal elevations at the open boundaries
2. Tidal elevations produced from the K1, O1, M2 and N2 constituents (no weather components) – low flow condition?
3. Constituent amplitudes and phases with nodal factors interpolated from database EASTCOAST 2001 for the open ocean boundaries
4. NOAA data for the Portsmouth boundary

Simulation VideoSimulation Video
Portsmouth, NH Harbor
Isles of Shoals
Aquaculture Site

Oceanographic Buoy at the Aquaculture site
Hydrodynamic ModelingHydrodynamic ModelingComparison with measured data
Pressure Sensor measures surface elevation
ADCP measures velocities

WARNING !!!!WARNING !!!!
The next The next THREE THREE
slides showsslides shows
DATADATA

Data Comparison – Aquaculture SiteData Comparison – Aquaculture SiteModel vs. Measured Surface Elevation
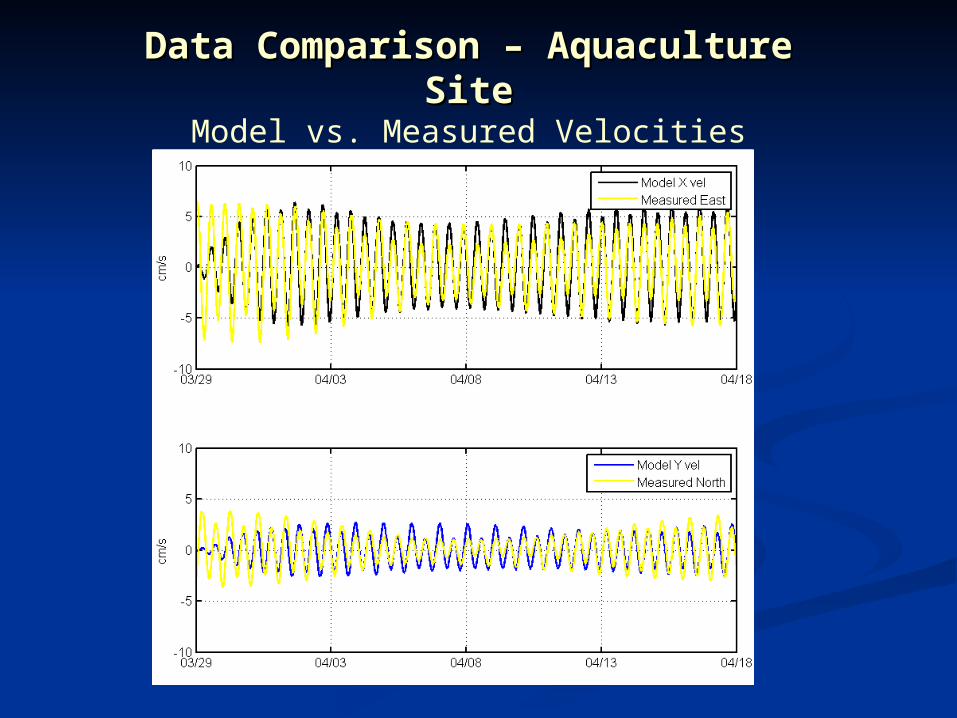
Data Comparison – Aquaculture SiteData Comparison – Aquaculture SiteModel vs. Measured Velocities
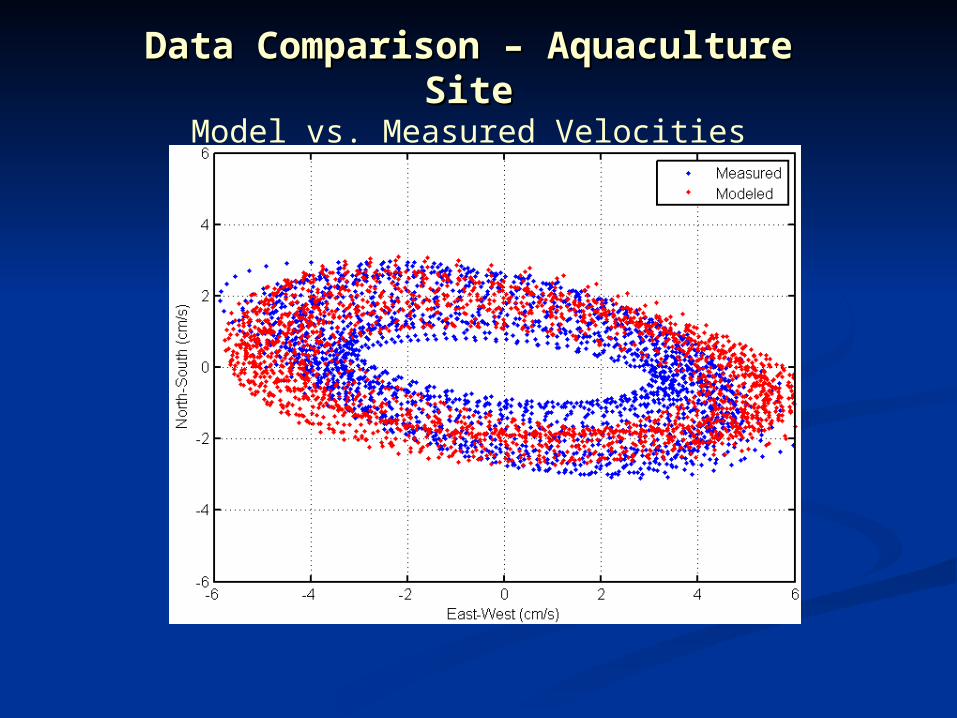
Data Comparison – Aquaculture SiteData Comparison – Aquaculture SiteModel vs. Measured Velocities
AquaModelAquaModel
1. AquaModel: Simulates waste deposition, benthic dynamics, water quality and bio-energetics
2. Like the hydrodynamic model results, operated within the EASy GIS program.
3. In this case, used the output of the circulation model as input to AquaModel
4. Results can be view in a Google-Earth environment
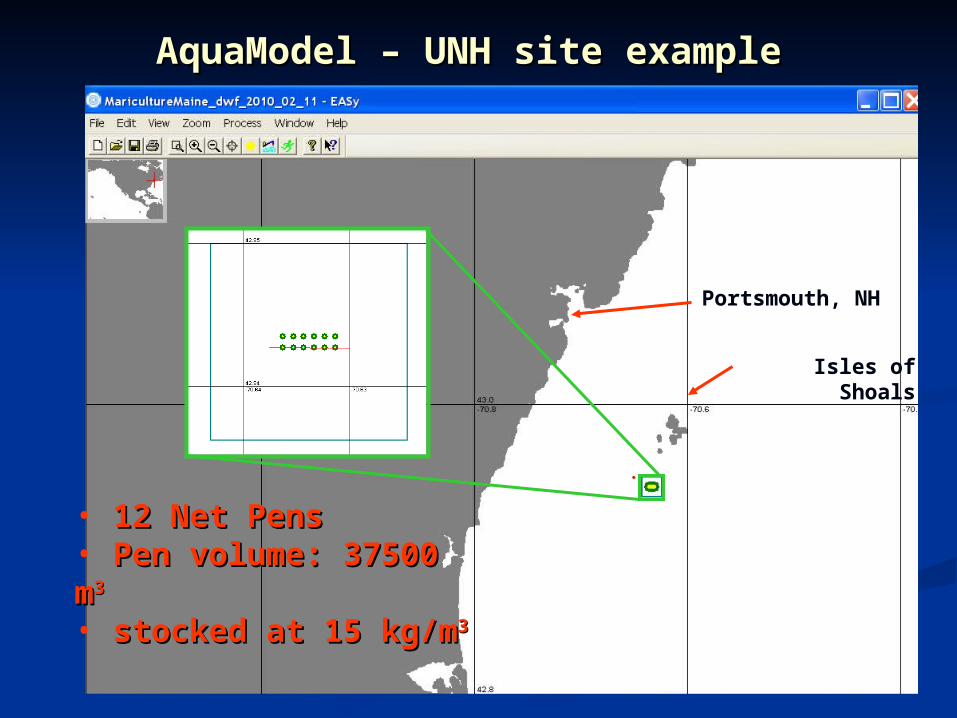
AquaModel – UNH site exampleAquaModel – UNH site example
• 12 Net Pens12 Net Pens• Pen volume: 37500 mPen volume: 37500 m33
• stocked at 15 kg/mstocked at 15 kg/m33
Portsmouth, NH
Isles of Shoals
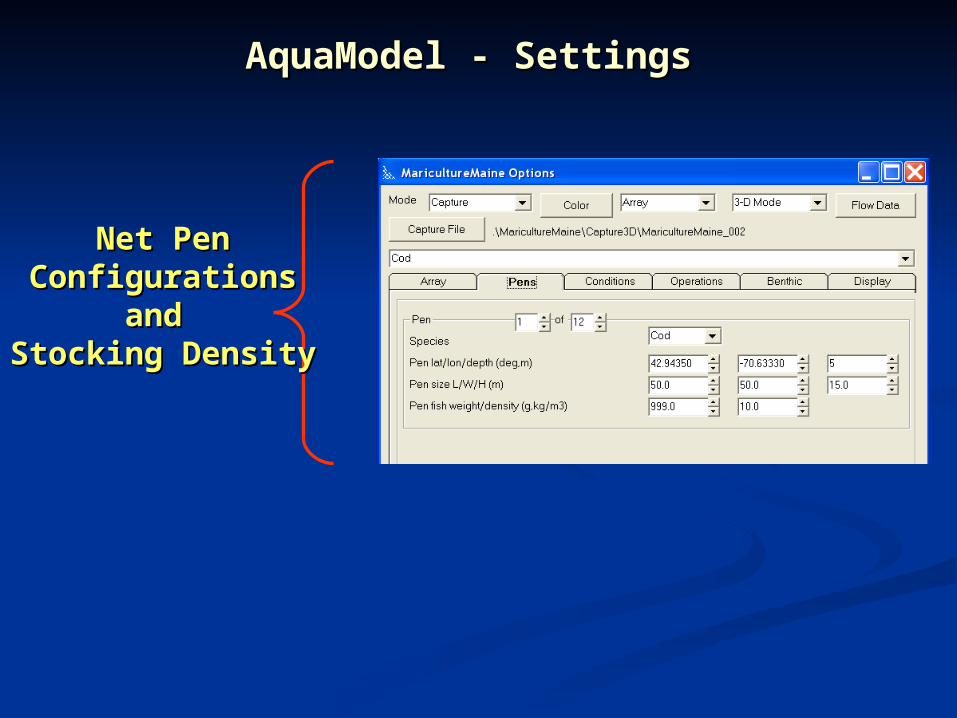
AquaModel - SettingsAquaModel - Settings
Net PenNet PenConfigurationsConfigurations
and and Stocking DensityStocking Density
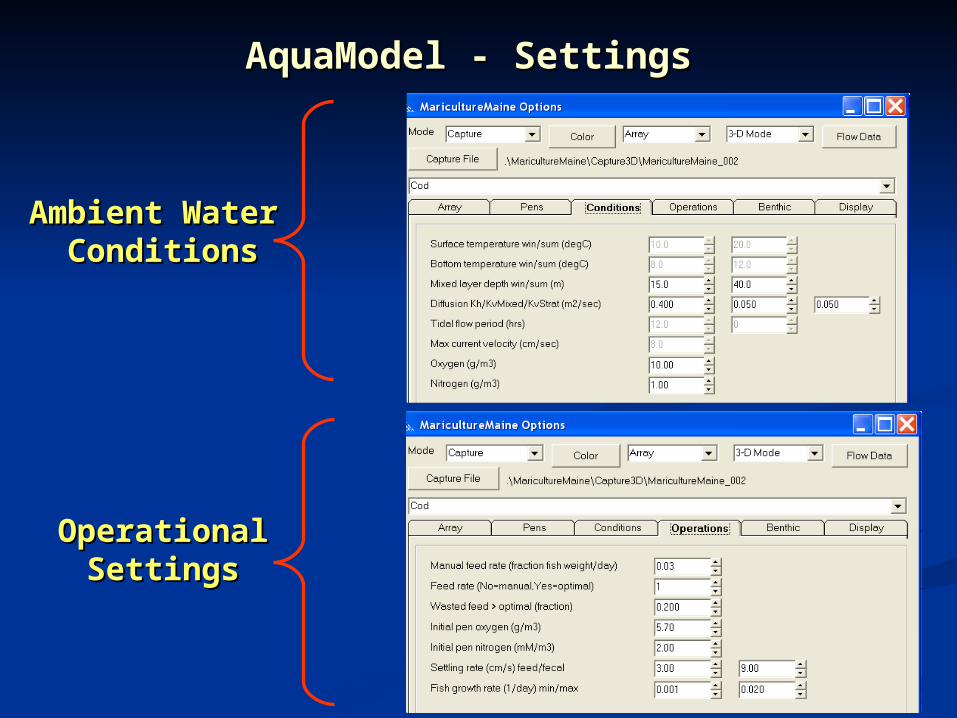
AquaModel - SettingsAquaModel - Settings
Ambient Water Ambient Water ConditionsConditions
OperationalOperationalSettingsSettings
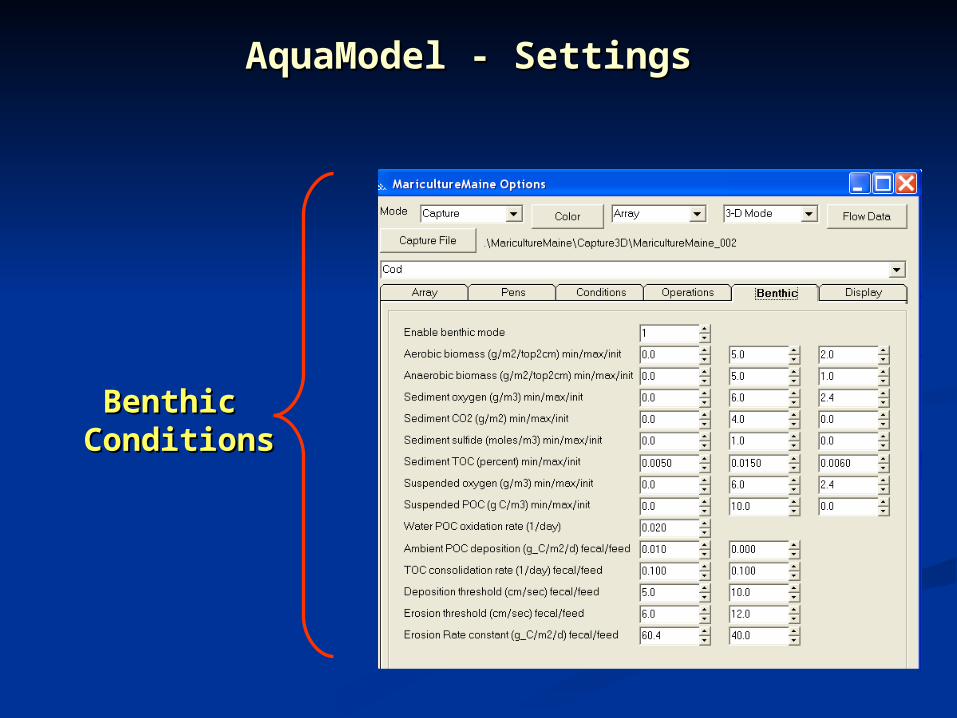
AquaModel - SettingsAquaModel - Settings
Benthic Benthic ConditionsConditions

Hydrodynamic Hydrodynamic and and
AquaModel AquaModel results results
Presented Google EarthPresented Google Earth

Hydrodynamic and AquaModel results in Hydrodynamic and AquaModel results in Google EarthGoogle Earth
Fish Fish Farm Farm DataData
Site
Oxygen Profile
Oxygen Transect
NitrogenProfile
NitrogenTransect
SedimentCharacteristics
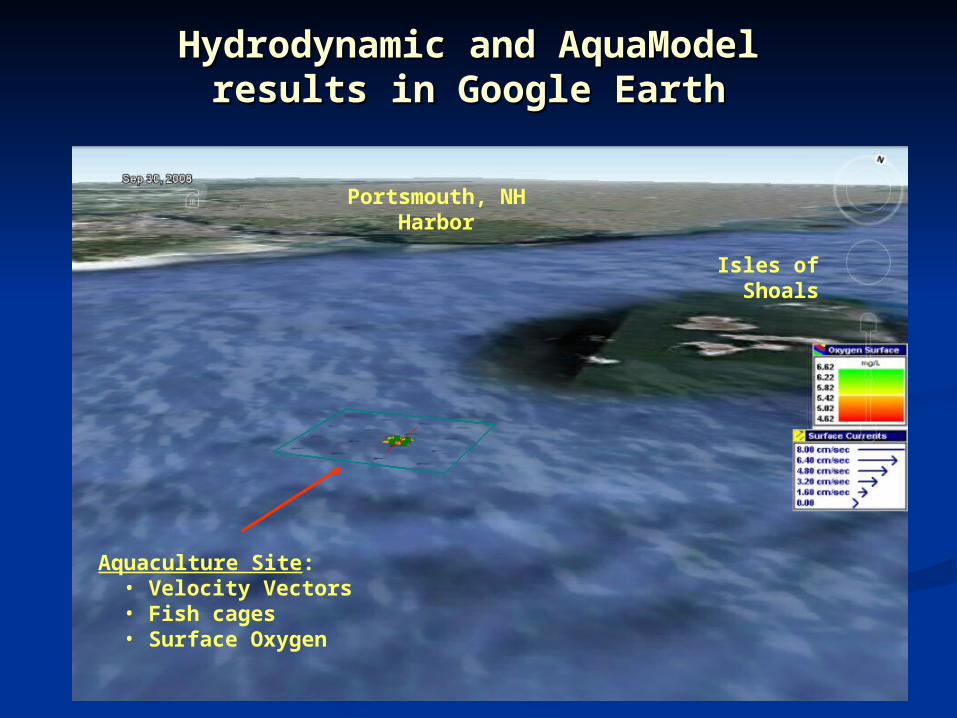
Hydrodynamic and AquaModel results in Hydrodynamic and AquaModel results in Google EarthGoogle Earth
Aquaculture Site: • Velocity Vectors• Fish cages• Surface Oxygen
Portsmouth, NH Harbor
Isles of Shoals
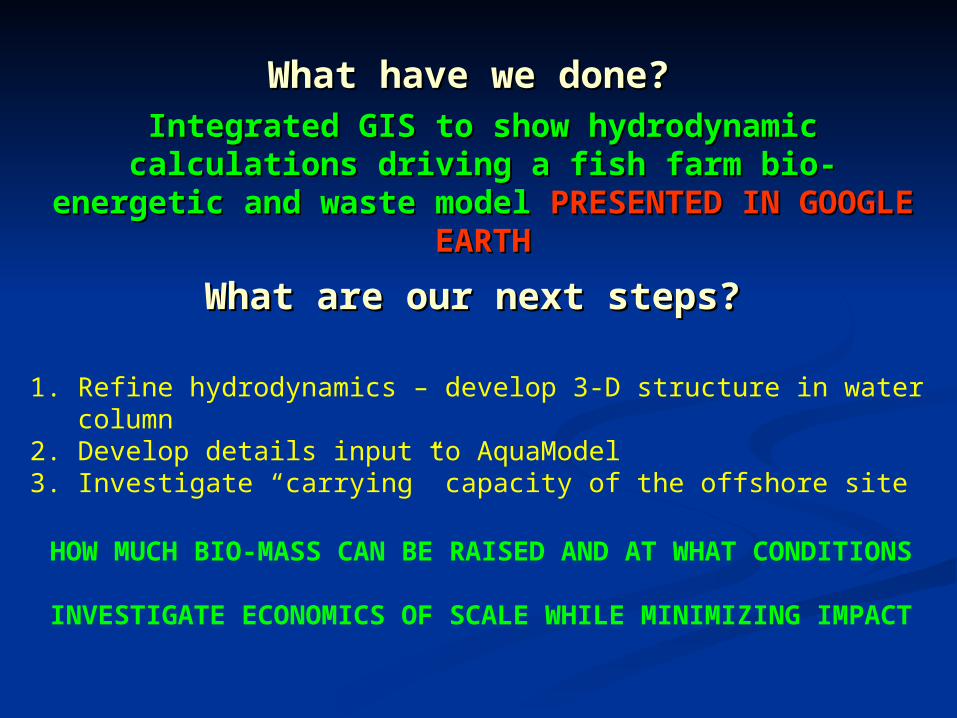
What have we done?What have we done?
1. Refine hydrodynamics – develop 3-D structure in water column2. Develop details input to AquaModel3. Investigate “carrying” capacity of the offshore site
HOW MUCH BIO-MASS CAN BE RAISED AND AT WHAT CONDITIONS
INVESTIGATE ECONOMICS OF SCALE WHILE MINIMIZING IMPACT
What are our next steps?What are our next steps?
Integrated GIS to show hydrodynamic calculations Integrated GIS to show hydrodynamic calculations driving a fish farm bio-energetic and waste modeldriving a fish farm bio-energetic and waste model
PRESENTED IN GOOGLE EARTHPRESENTED IN GOOGLE EARTH

GO NAVYGO NAVY