A Child's Day: 2000 (Selected Indicators of Child Well … · recent years, such as the ... Robert...
20
U S C E N S U S B U R E A U Helping You Make Informed Decisions Demographic Programs U.S. Department of Commerce Economics and Statistics Administration U.S. CENSUS BUREAU A Child’s Day: 2000 (Selected Indicators of Child Well-Being) Household Economic Studies Issued August 2003 Current Population Reports By Terry A. Lugaila P70-89 INTRODUCTION This is the second report based on data from the Survey of Income and Program Participation (SIPP) which provides a por- trait of the well-being of children and their daily activities. 1 This report address- es the topics presented in the initial report, such as reading interaction, extracurricular activities, and academic achievement and presents some new ones: how frequently children have meals with their parents and parents’ feelings toward their children. These aspects of growing up are important topics for study in light of the changes in family life and composition that have been occurring in recent years, such as the significant pro- portion of children currently growing up in single-parent families. 2 Previous research established a link between family structure and various measures of child development and well- being. 3 Children in two-parent families fare better developmentally than children in single-parent families, with children of divorced parents having the most prob- lems. In addition, children living with two biological parents are less likely to have problems than children living with 1 Jason Fields, Kristin Smith, Loretta Bass and Terry Lugaila, A Child’s Day: Home, School, and Play (Selected Indicators of Child Well-Being). Current Population Reports, P70-68. U.S. Census Bureau, Washington, DC, 2001. 2 Jason Fields, Living Arrangements of Children: Fall 1996. Current Population Reports, P70-74. U.S. Census Bureau, Washington, DC, 2001. 3 Robert Hauser, Brett Brown, and William Prosser (editors), Indicators of Children’s Well-Being, Russell Sage Foundation, New York, 1997. What’s in This Report? INTRODUCTION DAILY INTERACTIONS Children ever living away from home Mealtimes shared Daily interaction with fathers Praising and talking to the child Reading interaction Family rules about television Outings in the last month PARTICIPATION IN EXTRACURRICULAR ACTIVITIES Participation in clubs, sports, and lessons ACADEMIC ACHIEVEMENT Academically on-track Enrolled in gifted classes Changing schools Ever repeated a grade Ever suspended EDUCATIONAL EXPECTATIONS What level of education is a child expected to reach PARENTS’ FEELINGS TOWARD THEIR CHILDREN Child hard to care for Child does things that bother me a lot Child takes up more time than expected Parent feels angry with child SUMMARY
Transcript of A Child's Day: 2000 (Selected Indicators of Child Well … · recent years, such as the ... Robert...

U S C E N S U S B U R E A UHelping You Make Informed Decisions
Demographic Programs
U.S.Department of CommerceEconomics and Statistics Administration
U.S. CENSUS BUREAU
A Child’s Day: 2000 (SelectedIndicators of Child Well-Being)Household Economic Studies
Issued August 2003
CurrentPopulationReports
By Terry A. Lugaila
P70-89
INTRODUCTION
This is the second report based on datafrom the Survey of Income and ProgramParticipation (SIPP) which provides a por-trait of the well-being of children andtheir daily activities.1 This report address-es the topics presented in the initialreport, such as reading interaction,extracurricular activities, and academicachievement and presents some newones: how frequently children have mealswith their parents and parents’ feelingstoward their children. These aspects ofgrowing up are important topics for studyin light of the changes in family life andcomposition that have been occurring inrecent years, such as the significant pro-portion of children currently growing upin single-parent families.2
Previous research established a linkbetween family structure and variousmeasures of child development and well-being.3 Children in two-parent familiesfare better developmentally than childrenin single-parent families, with children ofdivorced parents having the most prob-lems. In addition, children living withtwo biological parents are less likely tohave problems than children living with
1 Jason Fields, Kristin Smith, Loretta Bass andTerry Lugaila, A Child’s Day: Home, School, and Play(Selected Indicators of Child Well-Being). CurrentPopulation Reports, P70-68. U.S. Census Bureau,Washington, DC, 2001.
2 Jason Fields, Living Arrangements of Children:Fall 1996. Current Population Reports, P70-74. U.S.Census Bureau, Washington, DC, 2001.
3 Robert Hauser, Brett Brown, and William Prosser(editors), Indicators of Children’s Well-Being, RussellSage Foundation, New York, 1997.
What’s in This Report?
INTRODUCTION
DAILY INTERACTIONS
Children ever living away from home
Mealtimes sharedDaily interaction with fathersPraising and talking to the childReading interactionFamily rules about televisionOutings in the last month
PARTICIPATION IN
EXTRACURRICULAR ACTIVITIES
Participation in clubs, sports, and lessons
ACADEMIC ACHIEVEMENT
Academically on-trackEnrolled in gifted classesChanging schoolsEver repeated a gradeEver suspended
EDUCATIONAL EXPECTATIONS
What level of education is a child expected to reach
PARENTS’ FEELINGS TOWARD
THEIR CHILDREN
Child hard to care forChild does things that bother me
a lotChild takes up more time than
expectedParent feels angry with child
SUMMARY

one biological parent and one step-parent.4 Child well-being indica-tors associated with children ofdivorced or single parents includelow measures of academic achieve-ment (e.g., repeated grades, lowmarks, low class standing),increased likelihood of droppingout of high school, early childbear-ing, and increased levels of depres-sion, stress, anxiety, and aggres-sion.
This report highlights a variety ofindicators that portray children’sexperiences both at home and atschool, such as daily interactionswith parents, including: how fre-quently children have meals withtheir parents; how often parentstalk to, play with, and praise theirchildren; incidence of reading andgoing on outings together; andwhether parents impose rulesabout television viewing at home.
2 U.S. Census Bureau
4 Sara McLanahan and Gary Sandefur,Growing Up With a Single Parent: WhatHurts, What Helps, Harvard University Press,Cambridge, MA, 1994.
The report’s school-based indica-tors range from academic achieve-ment and participation in extracur-ricular activities to potentialproblems, such as repeatinggrades or being suspended fromschool. In addition, parents wereasked about their expectations forthe ultimate level of educationthey want for their children andwhat they think their children willachieve.
Researchers at various federalagencies were interested in includ-ing questions on how parents actu-ally feel about their children inorder to get a more nuanced pic-ture than that provided by theusual social and economic indica-tors. The SIPP data are used topresent findings, for the first time,about parents’ feelings towardtheir children, based on issues,such as difficulty in caring for theirchildren and how often they feelangry with their children. Thesedaily activities, interactions, andbehavior patterns are apt to affectchildren’s success over time.
This report also examines thedegree to which children who areliving with both parents interactwith their mothers and theirfathers. Of special interest is howchildren interact with their parentsin unmarried-partner householdswhere their mother and their fatherare living together but are not mar-ried to each other, particularlycompared with children living inmarried-couple households.
The statistics in this report arebased on data collected in thechild well-being module of thetwelfth interview of the 1996 SIPPpanel, which was administered inthe period December 1999 throughMarch 2000.5 The 2000 SIPP datawere collected from a nationalsample of 10,445 “designated par-ents” (see definitions box) and
5 The population represented (the popula-tion universe) is the civilian noninstitutional-ized population of the United States.Whenever possible, comparable data frompast SIPP surveys collected in the fall of1994 and for the period December 1997through March 1998 are also shown in thisreport.
Table 1.Children Under 18 Years Old by Marital Status and Sex of Designated Parent: 2000(Numbers in thousands)
Characteristic
All children Under 6 years old 6 to 11 years old 12 to 17 years old
Number
90-percentconfidence
interval±1 Number
90-percentconfidence
interval±1 Number
90-percentconfidence
interval±1 Number
90-percentconfidence
interval±1
Total . . . . . . . . . . . . . . . . . . . . . . . . .
Parent female . . . . . . . . . . . . . . . . . . .Parent male. . . . . . . . . . . . . . . . . . . . .
Married2 . . . . . . . . . . . . . . . . . . . . . . . . . .Parent female . . . . . . . . . . . . . . . . . . .Parent male. . . . . . . . . . . . . . . . . . . . .
Separated, divorced, widowed. . . . . . .Parent female . . . . . . . . . . . . . . . . . . .Parent male. . . . . . . . . . . . . . . . . . . . .
Never married . . . . . . . . . . . . . . . . . . . . .Parent female . . . . . . . . . . . . . . . . . . .Parent male. . . . . . . . . . . . . . . . . . . . .
71,663
69,3802,282
51,88551,381
504
11,53810,1721,366
8,2407,828
412
593
588130
54153962
287270101
24423856
23,385
22,836549
17,24017,116
123
2,0601,872
188
4,0853,848
237
395
39164
34534430
12411838
17416942
24,581
23,888693
17,85817,683
176
4,0473,619
428
2,6762,586
89
404
39972
35134936
17316457
14113926
23,697
22,6561,041
16,78716,582
205
5,4314,691
750
1,4801,394
86
398
39088
34133939
20018675
10510225
1This figure added to or subtracted from the estimate provides the 90-percent confidence interval.2Married includes married, spouse present and married, spouse absent (excluding separated).
Source: U.S. Census Bureau, Survey of Income and Program Participation, 1996 Panel, Wave 12.

their 19,411 children. Theseresponses represented 71.7 millionchildren living in households withat least one parent, or with aguardian in the absence of the par-ents (Table 1).6 The majority ofthese children, 51.9 million, wereliving with a designated parentwho was currently married.Another 11.5 million were livingwith a designated parent who waseither separated, divorced, or wid-owed, while the remaining 8.2 mil-lion were living with a designatedparent who had never been mar-ried. As shown in Table 1, womenmade up the vast majority of thedesignated parents who reportedfor their children.
DAILY INTERACTIONS
One aspect of child well-being isthe type of daily interaction thatoccurs between children and their
parents. This section presents dataon everyday occurrences such aseating meals together, talking orplaying together, and parents prais-ing their children. Also shown, withcomparable data from past SIPP sur-veys, are reading interactionsbetween child and parent, familyrules about television viewing, andfamily outings in the past month.New data are also presented on theinstances of separation of childrenfrom their parents.
Children living away fromhome
An important part of a child-parentrelationship is the continuous pres-ence of at least one parent duringthe child’s formative years. For thefirst time, a SIPP question askedwhether the children of the desig-nated parent had ever lived apartfrom the parent, for any reason,for a month or more. Ninety-fivepercent of the 72 million childrenunder age 18 had never lived apartfrom their designated parent formore than a month, assuring somebasic stability with at least oneparent. Children whose parentsexperienced a permanent marital
disruption—widowhood ordivorce—were more likely thanchildren living with a married ornever-married parent to have livedapart from their designated parent.About 13 percent of children witha divorced parent and 12 percentof children with a widowed parenthad lived apart from their desig-nated parent for a month or more,compared with only 4 percent forchildren living with married par-ents, 6 percent living with a never-married parent, and 7 percent ofchildren living with a separatedparent.
Mealtimes shared
As Table 2 shows, the majority ofchildren under 6 years have a con-siderable amount of daily interac-tion with their parents—rangingfrom meals together to actual timeplaying and talking just for fun. Forexample, about three-fourths ofchildren under age 6 have dinnereach day with their designated par-ent. A slightly greater proportion ofchildren living with married parents(78 percent) than those living withunmarried parents (73 percent) haddinner with at least one designatedparent every day of the week.
Slightly more than half of the chil-dren under age 6 (53 percent) atebreakfast daily with their designat-ed parent, more often with a mar-ried parent than with an unmarriedparent (55 compared with 47 per-cent, respectively). The lower pro-portions for breakfast meals arenot unexpected, as working par-ents may leave for work early andtheir children may have breakfastwith a child care provider or atschool.
Since older children may havemore activities both before andafter school, they are less likelythan younger children to havemeals each day with their parents.
U.S. Census Bureau 3
6 The estimates in this report are basedon responses from a sample of the popula-tion. As with all surveys, estimates mayvary from the actual values because of sam-pling variation or other factors. All compar-isons made in this report have undergonestatistical testing and are significant at the90-percent confidence level unless otherwisenoted.
Designated Parent
In the SIPP child well-being module, data are collected about childrenfrom a respondent who is identified as the “designated parent.” Therespondent must be 15 years old or over. The designated parentincludes biological, step, and adoptive parents, and may also includeother relatives or nonrelatives acting as a guardian for the child in theabsence of the parents. In married-couple families, the mother is thedesignated parent. If the mother is not available for an interview, thefather or her husband may provide the mother’s information as aproxy respondent. In single-parent families, the resident parent is thedesignated parent. If neither parent is in the household, the guardianis the designated parent. In this module, 98 percent of the childrenhad their mother assigned as the designated parent. Data fromfathers who were the designated parent are included with the datafrom mothers. People 15 to 17 years old, who themselves may beparents, have their childhood well-being history reported by their par-ents when they live with them in the household.

Sixty-five percent of children aged 62 percent of children living with child lived with a married parent,6 to 17 had dinner every day with an unmarried parent. the proportion was 32 percent forat least one parent, with little dif- the older group compared with
The breakfast structures of olderference noted by the marital status 55 percent for the younger group.
and younger children differed dra-of the child’s parent. The same These low proportions for school-
matically. Only 29 percent of chil-proportion, 65 percent, of children age children may be attributed to
dren 6 to 17 years old had break-living with a married parent had parents allowing their children to
fast each morning with a parent,dinner each day with one or more eat breakfast at school.
compared with 53 percent of chil-of their parents, compared with
dren under 6 years old. If the
4 U.S. Census Bureau
Table 2.Selected Indicators of Daily Interaction of Children Under 18 With Designated Parent orWith Father/Stepfather if Present by Marital Status of Designated Parent: 2000(Numbers in thousands)
Children under 6 years old Children 6 to 17 years old
Living withmarried parents2
Living withunmarried parent(s)3
Living withmarried parents2
Living withunmarried parent(s)3
Characteristic
Total1
Interaction with Interaction with
Total1
Interaction with Interaction with
Desig-nated
parent
Father/step-
father4
Desig-nated
parent Father4
Desig-nated
parent
Father/step-
father4
Desig-nated
parent Father4
Number of children. . . . .
PERCENT DISTRIBUTION
Parent ate breakfast withchild in typical week
23,385 17,240 16,649 6,145 835 48,278 34,645 33,114 13,633 636
No days . . . . . . . . . . . . . . . . . . . . 14.2 12.6 26.0 18.5 34.8 20.5 18.3 30.2 26.1 38.91 to 2 days . . . . . . . . . . . . . . . . . 16.5 15.6 33.1 19.1 25.4 28.7 27.3 33.1 32.3 32.23 to 6 days . . . . . . . . . . . . . . . . . 16.3 16.7 16.5 15.3 8.8 21.5 22.1 17.3 19.9 12.87 days . . . . . . . . . . . . . . . . . . . . .
Parent ate dinner with childin typical week
53.0 55.1 24.3 47.2 31.1 29.3 32.3 19.3 21.7 16.1
No days . . . . . . . . . . . . . . . . . . . . 5.3 5.0 7.5 6.2 15.2 3.2 2.8 5.0 4.4 3.61 to 2 days . . . . . . . . . . . . . . . . . 3.3 2.8 8.5 4.6 7.0 5.4 4.9 8.9 6.8 8.23 to 6 days . . . . . . . . . . . . . . . . . 15.1 14.6 24.4 16.4 11.3 26.8 27.0 32.1 26.5 17.77 days . . . . . . . . . . . . . . . . . . . . .
Child praised by parent
76.4 77.7 59.7 72.8 66.5 64.5 65.4 54.0 62.4 70.6
Never—once a week . . . . . . . . 1.8 1.5 2.5 2.6 5.8 5.2 4.6 6.9 6.8 11.8A few times per week . . . . . . . . 7.6 6.1 9.7 12.1 17.0 22.7 21.4 26.5 26.0 24.2Once or twice per day . . . . . . .Three or more times per
20.3 19.3 24.8 23.1 23.0 31.3 31.3 30.6 31.2 36.2
day . . . . . . . . . . . . . . . . . . . . . . .
Child talked to or playedwith for 5 minutes or morejust for fun
70.3 73.2 63.0 62.3 54.2 40.9 42.7 36.0 36.1 27.9
Never—once a week . . . . . . . . 1.0 0.4 1.7 2.6 5.8 5.7 4.9 6.8 7.9 8.5A few times per week . . . . . . . . 6.5 5.3 10.6 9.7 17.5 19.6 18.7 24.2 22.1 28.6Once or twice per day . . . . . . .Three or more times per
21.1 19.3 27.7 26.2 22.3 33.4 33.0 33.8 34.7 35.0
day . . . . . . . . . . . . . . . . . . . . . . . 71.4 75.0 60.0 61.5 54.4 41.2 43.4 35.2 35.4 27.9
1Totals given refer to questions of designated parents, regardless of sex of parent.2Married includes married, spouse present and married, spouse absent (excluding separated).3Includes never married, widowed, divorced, and separated.4Question asked of fathers who were not the designated parents. Fathers must be biological, step- or adoptive and must be present in the household.
Percent of children eating meals with fathers does not represent presence of both parents at the meals.
Source: U.S. Census Bureau, Survey of Income and Program Participation, December 1999 to March 2000.

Daily interaction with fathers
The survey data indicate that chil-dren living with two parentsreceived attention from both ofthem over the course of the day.The data in Table 2 show dailyinteractions between child andfather/stepfather if the male parentis present in the household andbetween child and father in unmar-ried partner households if thechild’s biological father is alsopresent.7 They indicate thatfathers interacted daily with theirchildren, but usually less frequent-ly than their spouses or unmarriedpartners. For example, while 55 percent of children under 6years old living with married par-ents ate breakfast daily with theirmother (or designated parent),only 24 percent ate breakfast on adaily basis with their fathers.Among children living with unmar-ried parents, about 47 percent ofchildren under 6 years old atebreakfast every day with theirmother (or designated parent) butonly 31 percent with their father ifthe biological father was present inthe household.
It is interesting to note that meal-time experiences between childrenand their fathers were similar forchildren living with married or withunmarried parents when the fatherwas present in the household. Theproportion of children under 6years old who ate breakfast or din-ner with their father on all sevendays was actually slightly higheramong children in unmarried
U.S. Census Bureau 5
7 For children with married parents, thenumbers of designated parents andfathers/stepfathers do not exactly match, assome parents may be married but theirspouses are absent from the household (forexample, in an institution or in the armedforces). For children living with unmarriedparents (including separated), the majorityare living with only one parent, usually themother, but some children may also havetheir biological father living with them in thehousehold and thus are also asked thesedaily interaction items.
partner households than in marriedpartner households.
Praising and talking to the child
The 2000 SIPP asked parents howoften they praised or compliment-ed their child by saying, for exam-ple, “Good for you” or “Way to go.”Overall, 70 percent of childrenunder age 6 received such praisethree or more times per day. Ahigher proportion of children livingwith a married parent receivedpraise three or more times per daythan those living with an unmar-ried parent (73 percent and 62 per-cent, respectively).
For the school-age group, only 41 percent received praise three ormore times per day, but again theproportion was slightly higher forchildren living with married parents(43 percent) than with unmarriedparents (36 percent). Parents mayhave more opportunities to praiseyounger children since older chil-dren spend more time at school, onoutside activities, and with theirpeers than younger ones do.
Parents were also asked how oftenthey talked or played with theirchild for 5 minutes or more, justfor fun. Table 2 shows thatyounger children had more ofthese interactions with their par-ents than older children, and chil-dren with married parents tendedto interact with their parents moreoften than children with unmarriedparents.
Reading interaction
Another indicator of child well-being is how often parents andother family members read to chil-dren in the household. The childwell-being module included ques-tions about the number of storiesread to children who were under12 years old. Information was col-lected on the number of times in
the past week when children wereread stories, not only by the desig-nated parent or the father or thestepfather, but also by other mem-bers of the family. Table 3 focuseson reading to children 1 to 5 yearsold by any family member, whileTable 4 shows reading by both par-ents to children 1 to 11 years oldliving with married couples andunmarried couples.
Of the 19.6 million childrenbetween the ages of 1 and 5 yearsold in 2000 (Table 3), about 1.6million children (8 percent) werenever read stories in the week pre-ceding the survey by any familymember (9 percent for 1- and 2-year-olds and 7 percent for 3- to 5-year-olds). The proportion of 1-and 2-year-olds never read todecreased 4 percentage pointsfrom 1994 (from 13 to 9 percent).Half of all children 1 to 5 years oldin 2000 were read to seven ormore times per week. Of thosechildren read to by their parents,children 1 and 2 years old wereread to an average of 7.6 times perweek and children 3 to 5 years oldwere read to 6.8 times per week.
By race and ethnicity, one-quarterof Hispanic children 1 and 2 yearsold and 17 percent of those 3 to 5years old were never read to in theweek preceding the survey,8 whichis significantly higher than the per-centages for non-Hispanic Whitechildren and Black children forboth age groups.9 The average
8 Hispanics may be of any race. Data forthe American Indian and Alaska Native popu-lation are not shown in this report becauseof their small sample size in the 1996 panelof the Survey of Income and ProgramParticipation (SIPP). Based on the 1996 SIPPPanel, Wave 12 child well-being data, 4 per-cent of the Black population and 6 percent ofthe Asian and Pacific Islander population arealso of Hispanic origin.
9 The percents never read to for Blackchildren 1 to 2 years old and 3 to 5 yearsold (10.9 percent and 12.9 percent, respec-tively) were not statistically different fromeach other.

number of times per week that a Higher proportions of children liv- children with parents who had everfamily member read to Hispanic ing with either a never-married married, or had more than a highchildren—6.1 times for ages 1 to 2 parent or a parent with a high school education, or had a familyand 5.7 times for ages 3 to 5—was school education or less, or in a income 200 percent or more abovenot significantly different from family with income below the poverty. each other, but was lower than poverty level, were never read to
The average number of times perthat reported for non-Hispanic than their counterparts in other liv-
week that a parent read to a childWhite children (8.1 and 7.3, ing arrangements and, hence,
was somewhat higher for childrenrespectively). lower proportions were read to
1 and 2 years old with marriedseven or more times per week than
6 U.S. Census Bureau
Table 3.Reading to Children 1 to 5 Years Old by Any Family Member, by Selected Characteristics:1994 to 2000(Numbers in thousands)
Characteristics
Number of children
Family reading practices
Percent never readto last week
Percent of childrenread to 7 or moretimes per week
Average times readto child per week1
1 and 2years
3 to 5years
1 and 2years
3 to 5years
1 and 2years
3 to 5years
1 and 2years
3 to 5years
Total children, 2000 . . . . . . . . . . .
Sex of Child
7,830 11,780 8.6 7.4 54.8 49.0 7.6 6.8
Female . . . . . . . . . . . . . . . . . . . . . . . . . . . 3,801 5,808 7.9 7.5 55.5 48.8 7.7 6.8Male . . . . . . . . . . . . . . . . . . . . . . . . . . . . .
Race and Ethnicity of Child
4,029 5,971 9.3 7.4 54.1 49.2 7.5 6.8
White . . . . . . . . . . . . . . . . . . . . . . . . . . . . 6,177 9,420 7.7 6.1 56.4 51.9 7.9 7.0Non-Hispanic. . . . . . . . . . . . . . . . . . . . 5,164 7,631 4.6 3.6 60.9 56.0 8.1 7.3
Black. . . . . . . . . . . . . . . . . . . . . . . . . . . . . 1,260 1,813 10.9 12.9 47.8 35.5 6.3 5.8Asian and Pacific Islander . . . . . . . . . . 277 391 19.1 10.7 52.3 46.9 8.5 6.3Hispanic (of any race) . . . . . . . . . . . . . .
Marital Status of Parent
1,063 1,928 23.8 17.2 34.2 34.3 6.1 5.7
Married2 . . . . . . . . . . . . . . . . . . . . . . . . . . 5,750 8,700 7.2 5.9 57.6 52.0 8.0 7.0Separated, divorced, widowed. . . . . . . 647 1,233 11.7 9.0 49.1 42.5 6.5 6.3Never married . . . . . . . . . . . . . . . . . . . . .
Parent’s Educational Level
1,434 1,846 12.9 13.5 46.0 39.2 6.5 5.8
High school or less . . . . . . . . . . . . . . . . 3,490 5,392 14.1 11.8 44.6 40.0 6.3 6.0Some college . . . . . . . . . . . . . . . . . . . . . 1,265 2,083 5.7 4.7 58.1 52.7 7.5 7.3Vocational or associate degree . . . . . . 927 1,399 5.6 3.8 60.3 52.2 8.3 6.6Bachelor’s degree . . . . . . . . . . . . . . . . . 1,709 2,180 2.9 3.2 66.1 60.9 9.2 7.6Advanced degree . . . . . . . . . . . . . . . . . .
Poverty Status3
438 725 3.0 2.3 69.8 63.7 9.4 8.5
Below poverty level . . . . . . . . . . . . . . . . 1,323 2,006 17.9 13.7 44.3 42.2 6.7 6.0On or above poverty level . . . . . . . . . . 6,296 9,520 6.3 5.9 57.5 50.5 7.8 6.9
100 to 199 percent of poverty . . . . . 1,681 2,968 10.9 9.0 49.2 44.0 6.7 6.4200 percent of poverty or higher. . . 4,615 6,552 4.6 4.5 60.5 53.5 8.2 7.2
Total children, 1998 . . . . . . . . . . . 7,764 12,088 9.3 9.0 51.9 45.9 7.9 6.6Total children, 19944 . . . . . . . . . 5,777 9,375 12.8 9.1 48.2 46.5 8.9 6.8
1Based on children reported as being read to one or more times per week.2Married includes married, spouse present and married, spouse absent (excluding separated).3For families with income reported.4Based on those children for whom valid answers were reported (no allocation for nonresponse).
Note: Family members include either parent or any other relative.
Source: U.S. Census Bureau, Survey of Income and Program Participation, 1996 Panel, Waves 6 and 12 (1998 and 2000 data). Current PopulationReports, P70-68, Table 5 (1994 data).

parents than for those with parentswho were other than married (8and 6.5, respectively).
For children 3 to 5 years old, thosewith married parents were read to7 times per week, compared with6.3 times for children of separated,divorced, or widowed parents, and5.8 times for children of never-married parents.10
By educational level, the averagenumber of times per week thatparents read to their children wassignificantly different betweenthose children whose parent had ahigh school degree or lower andchildren whose parent had a highereducation. For example, children 1and 2 years old whose parent hada high school degree or lower wereread to, on average, 6.3 times perweek compared to 9.4 times forchildren whose parent had anadvanced degree.
For 3- to 5-year-olds, there was asignificant increase in the averagenumber of times per week thatparents read to their childrenbetween the lowest and highestlevels of education (6 times perweek and 8.5 times per week,respectively).11
Table 4 shows that, although moth-ers did the majority of the readingto their children, fathers were alsoinvolved. Thirty-two percent of allchildren 1 to 11 years old were read
U.S. Census Bureau 7
10 The average number of times per weekread to for children 3 to 5 years old withseparated, divorced, or widowed parentsand children 3 to 5 years old with never-married parents (6.3 times and 5.8 times,respectively) were not statistically differentfrom each other. Also, the average numberof times per week read to for children withseparated, divorced, or widowed parentswas not statistically significant between thetwo age groups (1 and 2 versus 3 to 5).
11 The average number of times read tochildren per week was not significantly dif-ferent between children 1 and 2 years oldand children 3 to 5 years old with parentswith either a high school degree or belowand those with an advanced degree.
Table 4.Reading Practices for Children 1 to 11 Years Old WithTwo Parents in the Household: 2000(Numbers in thousands)
All children Children of Children ofCharacteristics with two married unmarried
parents couples couples2
Children 1 to 11 years old with twoparents in the household
Number . . . . . . . . . . . . . . . . . . . . . . . . . . . . . . . . . . 32,079 30,999 1,080Percent distribution . . . . . . . . . . . . . . . . . . . . . . . . 100.0 100.0 100.0
Not read to by any family member. . . . . . . . . . . 19.4 19.3 22.1Never by mother:. . . . . . . . . . . . . . . . . . . . . . . . . . 3.9 4.0 3.3
Never by father1 . . . . . . . . . . . . . . . . . . . . . . . . 1.9 2.2 2.71 to 6 times by father . . . . . . . . . . . . . . . . . . . . 1.6 1.6 0.67 or more times by father . . . . . . . . . . . . . . . . 0.4 0.5 -
1 to 6 times by mother: . . . . . . . . . . . . . . . . . . . . 49.6 49.7 47.6Never by father . . . . . . . . . . . . . . . . . . . . . . . . . 16.6 16.7 14.01 to 6 times by father . . . . . . . . . . . . . . . . . . . . 31.6 31.6 31.57 or more times by father . . . . . . . . . . . . . . . . 1.4 1.4 2.1
7 or more times by mother: . . . . . . . . . . . . . . . . . 27.0 27.0 27.0Never by father . . . . . . . . . . . . . . . . . . . . . . . . . 6.5 6.2 10.91 to 6 times by father . . . . . . . . . . . . . . . . . . . . 10.0 9.8 4.47 or more times by father . . . . . . . . . . . . . . . . 10.5 10.5 11.7
Children 1 to 5 years old with twoparents in the household
Number . . . . . . . . . . . . . . . . . . . . . . . . . . . . . . . . . . 14,537 13,915 623Percent distribution . . . . . . . . . . . . . . . . . . . . . . . . 100.0 100.0 100.0
Not read to by any family member. . . . . . . . . . . 6.4 6.1 13.4Never by mother:. . . . . . . . . . . . . . . . . . . . . . . . . . 3.0 3.0 2.8
Never by father1 . . . . . . . . . . . . . . . . . . . . . . . . 1.4 1.4 2.61 to 6 times by father . . . . . . . . . . . . . . . . . . . . 1.1 1.1 0.27 or more times by father . . . . . . . . . . . . . . . . 0.5 0.5 -
1 to 6 times by mother: . . . . . . . . . . . . . . . . . . . . 51.7 51.7 50.1Never by father . . . . . . . . . . . . . . . . . . . . . . . . . 15.3 15.4 13.71 to 6 times by father . . . . . . . . . . . . . . . . . . . . 34.5 34.6 32.87 or more times by father . . . . . . . . . . . . . . . . 1.9 1.8 3.7
7 or more times by mother: . . . . . . . . . . . . . . . . . 38.9 39.1 33.7Never by father . . . . . . . . . . . . . . . . . . . . . . . . . 8.0 7.8 13.21 to 6 times by father . . . . . . . . . . . . . . . . . . . . 14.4 14.8 5.37 or more times by father . . . . . . . . . . . . . . . . 16.5 16.6 15.2
Children 6 to 11 years old with twoparents in the household
Number . . . . . . . . . . . . . . . . . . . . . . . . . . . . . . . . . . 17,542 17,084 458Percent distribution . . . . . . . . . . . . . . . . . . . . . . . . 100.0 100.0 100.0
Not read to by any family member. . . . . . . . . . . 30.2 30.0 34.0Never by mother:. . . . . . . . . . . . . . . . . . . . . . . . . . 4.7 4.7 3.8
Never by father . . . . . . . . . . . . . . . . . . . . . . . . . 2.3 2.3 2.81 to 6 times by father . . . . . . . . . . . . . . . . . . . . 1.9 2.0 1.07 or more times by father . . . . . . . . . . . . . . . . 0.4 0.4 -
1 to 6 times by mother: . . . . . . . . . . . . . . . . . . . . 47.9 48.0 44.2Never by father . . . . . . . . . . . . . . . . . . . . . . . . . 17.7 17.8 14.51 to 6 times by father . . . . . . . . . . . . . . . . . . . . 29.3 29.3 29.87 or more times by father . . . . . . . . . . . . . . . . 1.0 1.0 -
7 or more times by mother: . . . . . . . . . . . . . . . . . 17.2 17.2 17.9Never by father . . . . . . . . . . . . . . . . . . . . . . . . . 5.3 5.2 7.71 to 6 times by father . . . . . . . . . . . . . . . . . . . . 6.3 6.4 3.27 or more times by father . . . . . . . . . . . . . . . . 5.6 5.6 7.0
- Represents or round to zero.1Children were read to by another family member, for example, a sibling, but not by their parent.2Includes only children living with both biological or adoptive parents.
Source: U.S. Census Bureau, Survey of Income and Program Participation, 1996 Panel, Wave 12.

to one to six times per week by Overall, there was no difference 13 percent of children with unmar-both parents, about the same per- between the proportion of children ried parents. It should be notedcentage as children of both married in unmarried-couple families and that the number of children livingand unmarried couples where the children in married-couple families with both parents who were unmar-biological father was present. In who were never read to by any fam- ried was relatively small (1 million)addition, there was no significant ily member (22 percent compared compared with the number livingdifference between children with with 19 percent, respectively). By with both parents who were mar-married parents and children with age, however, there was a signifi- ried (31 million). These data sug-unmarried parents in the proportion cant difference for children 1 to 5 gest that children and parents inter-being read to seven or more times years old: 6 percent of children with act as a family unit on the issue ofper week by both parents (11 per- married parents were never read to reading to children even if the par-cent and 12 percent, respectively). by a family member compared to ents are not married to each other.
8 U.S. Census Bureau
Table 5.Family Television Rules for Children 3 to 17 Years Old by Selected Characteristics:1994 to 2000(Numbers in thousands)
Characteristics
Number of children
Family television rules
Percent with at leastone television rule
Percent with three typesof television rules
3 to 5years
6 to 11years
12 to 17years
3 to 5years
6 to 11years
12 to 17years
3 to 5years
6 to 11years
12 to 17years
Total children, 2000 . . . . . . . .
Sex of Child
11,780 24,581 23,697 89.9 92.0 72.6 64.4 69.0 41.7
Female . . . . . . . . . . . . . . . . . . . . . . . . 5,808 11,998 11,526 89.0 91.8 71.5 63.3 69.2 40.9Male . . . . . . . . . . . . . . . . . . . . . . . . . .
Race and Ethnicity of Child
5,971 12,583 12,171 90.7 92.3 73.6 65.5 68.7 42.5
White. . . . . . . . . . . . . . . . . . . . . . . . . . 9,420 19,340 18,678 90.3 92.8 73.5 63.9 68.8 41.1Non-Hispanic. . . . . . . . . . . . . . . . . 7,631 15,080 15,301 91.8 93.9 74.2 64.0 68.5 40.3
Black . . . . . . . . . . . . . . . . . . . . . . . . . . 1,813 4,061 3,745 88.3 89.5 69.6 68.3 69.9 45.6Asian and Pacific Islander . . . . . . . 391 846 834 86.2 88.9 70.2 61.3 69.8 44.8Hispanic (of any race) . . . . . . . . . . .
Marital Status of Parent
1,928 4,520 3,683 83.7 89.1 69.6 64.2 70.3 44.3
Married1 . . . . . . . . . . . . . . . . . . . . . . . 8,700 17,858 16,787 91.0 92.8 75.3 66.2 70.5 43.8Separated, divorced, widowed. . . . 1,233 4,047 5,431 89.9 90.9 65.3 63.2 68.1 34.5Never married . . . . . . . . . . . . . . . . . .
Parent’s Educational Level
1,846 2,676 1,480 84.4 88.4 68.5 56.9 59.9 44.2
High school or less . . . . . . . . . . . . . 5,393 11,990 11,665 86.2 89.6 70.2 60.5 66.8 40.0Some college . . . . . . . . . . . . . . . . . . 2,083 4,385 4,110 92.4 94.1 73.9 64.2 69.5 44.0Vocational or associate degree . . . 1,399 3,236 3,420 92.2 92.7 75.6 63.0 68.0 41.5Bachelor’s degree . . . . . . . . . . . . . . 2,180 3,784 3,063 92.9 95.3 76.4 72.0 73.3 43.9Advanced degree . . . . . . . . . . . . . . .
Poverty Status2
725 1,186 1,440 96.6 97.1 72.6 74.0 77.5 45.0
Below poverty level . . . . . . . . . . . . . 2,006 4,379 3,476 84.5 87.4 71.9 59.8 66.0 44.4On or above poverty level . . . . . . . 9,520 19,663 19,861 90.6 93.0 72.7 65.1 69.5 41.3
100 to 199 percent of poverty .200 percent of poverty or
2,968 5,956 5,353 88.0 89.4 71.3 64.7 68.0 41.5
higher . . . . . . . . . . . . . . . . . . . . . . 6,552 13,707 14,508 91.7 94.6 73.2 65.3 70.1 41.2
Total children, 1998 . . . . . . . . 12,088 24,095 23,345 89.4 93.3 75.3 61.6 65.2 41.0Total children, 19943 . . . . . . . 9,576 19,472 17,683 91.3 94.7 79.2 54.0 60.3 40.2
1Married includes married, spouse present and married, spouse absent (excluding separated).2For families with income reported.3Based on those children for whom valid answers were reported (no allocation for nonresponse).
Source: U.S. Census Bureau, Survey of Income and Program Participation, 1996 Panel, Waves 6 and 12 (1998 and 2000 data). Current PopulationReports, P70-68, Table 8 (1994 data).

Family rules about television
The SIPP child well-being moduleinquired about constraints placedon children’s television (TV) rulesby asking if parents imposed ruleson any of three issues: type ofprogram watched, time of day(how early or late the TV was on),and the number of hours watched.
In 2000, 84 percent of children 3 to17 years old (50.4 million) lived inhouseholds with at least one typeof family TV rule: 90 percent of 3-to 5-year-olds, 92 percent of 6- to11-year-olds, but only 73 percent ofchildren 12 to 17 years old lived infamilies with TV rules that pertainedto them (Table 5).
About 67 percent of children 3 to11 years old and 42 percent ofchildren aged 12 to 17 had allthree types of TV rules. Parentsmay think older children are ableto make their own choices on TVprograms, times of day, and hourswatched as they gain maturity andresponsibility with age.
Children 3 to 5 years old livingwith a parent with a high school
diploma or less education wereless likely to have at least one TVrule (86 percent) than children liv-ing with a parent with a bachelor’sdegree (93 percent) or with anadvanced degree (97 percent).Children 3 to 5 years old whoseparents had the lowest educationwere also less likely to have allthree types of TV rules (61 per-cent) compared with 72 percent ofchildren living with a parent with abachelor’s degree or 74 percentwith an advanced degree.12
Higher proportions of rules forchildren with a parent havingadvanced degrees than with a highschool education or less werenoted within each age group forchildren 6 to 11 years and 12 to17 years.
Do parents who exercise strictercontrol over their children’s TVviewing habits spend more time
reading to their children than par-ents who are more lenient in settingTV rules? Figure 1 shows thesefamily decisions and behaviors forchildren 3 to 5 years old, an agewhen pre-school reading habits arebeginning to develop. More thanone-half of children 3 to 5 years oldwho had three types of televisionrules were read to by their parentsseven or more times per week.Only 6 percent of these childrenwere not read to at all. For childrenliving in families with no TV rules(which included children whose par-ents may have answered nobecause no television was in thehousehold), only 31 percent wereread to by a family member sevenor more times per week, and anadditional 17 percent were not readto at all by their parents in theweek preceding the survey. Moreinformation would be needed toknow if some families decide to useTV as a substitute for reading.
Outings in the last month
Children may benefit from experi-ences outside the household andschool settings. The 2000 SIPPasked how many times in the pastmonth the parent or a family mem-ber took the child on any kind ofouting—for example, to a park, achurch, a playground, a grocerystore, or a visit with friends or rel-atives.13 Of the 48 million childrenunder 12 years old, 2.4 million, or5 percent, were not taken on out-ings with a parent or a familymember in the past month. Theaverage number of outings permonth for children who went onone or more outings was 12.3times per month.
Figure 2 looks at outings by pover-ty status and race. Non-Hispanic
U.S. Census Bureau 9
12 The percentage of children 3 to 5 yearsold with three TV rules living with a parentwith a bachelor’s degree was not statisticallydifferent from the percentage of children 3to 5 years old with three TV rules living witha parent with an advanced degree.
13 The survey did not collect informationon which of the outings the child went on,just the number of times the child went onany outing.
Figure 1.Percent Distribution of Number of Times Per Week Family Members Read to Children 3 to 5 Years Old by Presence of Television Rules: 2000
Source: U.S. Census Bureau, Survey of Income and Program Participation, 1996 Panel, Wave 12.
All 3 typesof TV rules
1 or 2 typesof TV rules
No TV rules
Total
Not read to at all
Read to 1 to 6 times per week
Read to 7 or more times per week
52.3
7.4 43.6 49.0
17.1 52.1 30.8
7.5 44.5 48.0
5.9 41.9
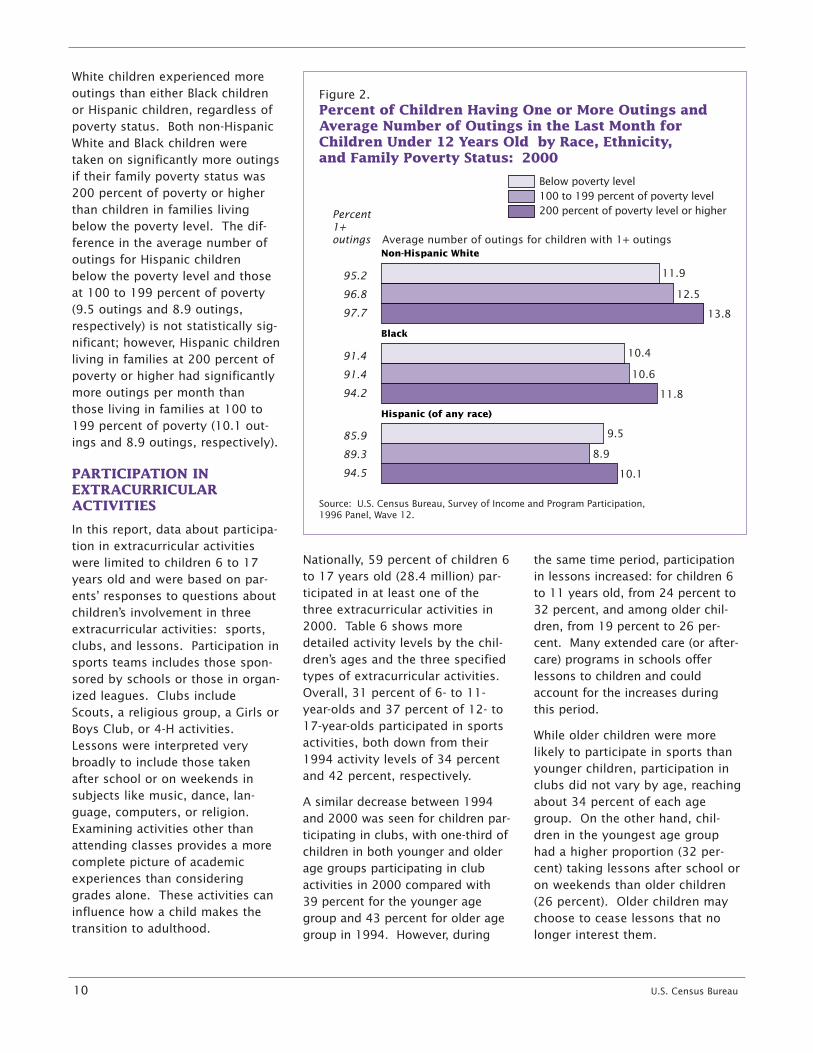
White children experienced moreoutings than either Black childrenor Hispanic children, regardless ofpoverty status. Both non-HispanicWhite and Black children weretaken on significantly more outingsif their family poverty status was200 percent of poverty or higherthan children in families livingbelow the poverty level. The dif-ference in the average number ofoutings for Hispanic childrenbelow the poverty level and thoseat 100 to 199 percent of poverty(9.5 outings and 8.9 outings,respectively) is not statistically sig-nificant; however, Hispanic childrenliving in families at 200 percent ofpoverty or higher had significantlymore outings per month thanthose living in families at 100 to199 percent of poverty (10.1 out-ings and 8.9 outings, respectively).
PARTICIPATION INEXTRACURRICULARACTIVITIES
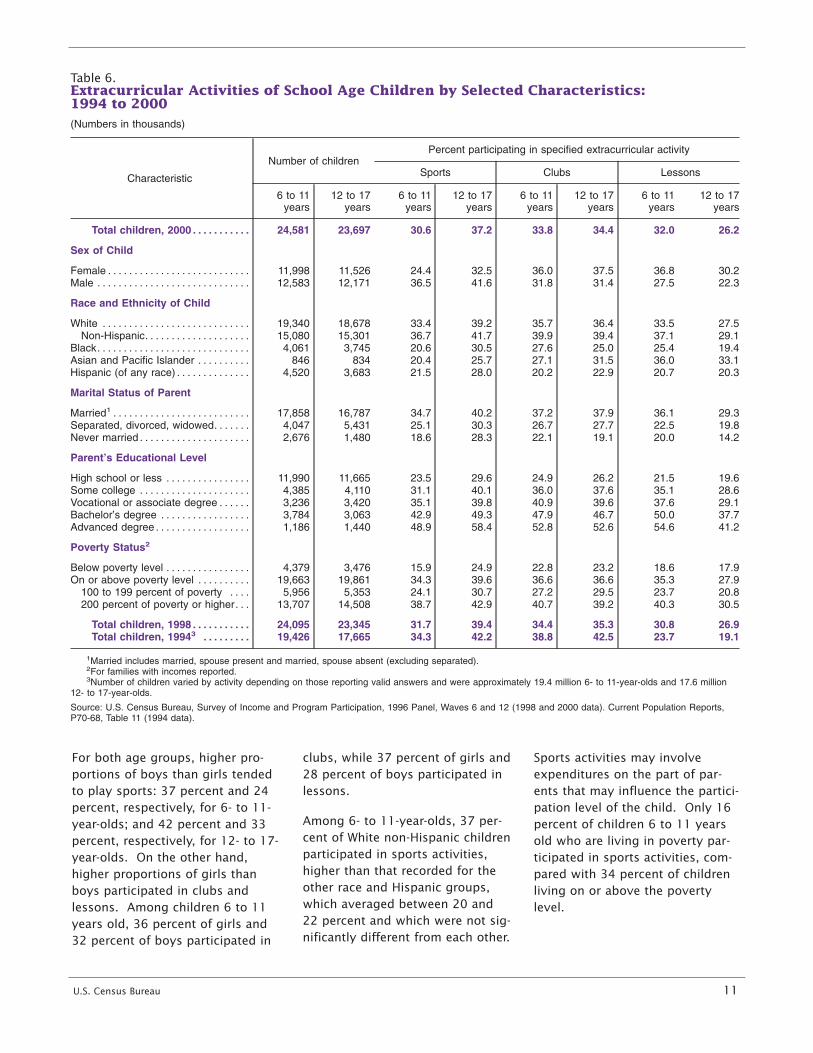
In this report, data about participa-tion in extracurricular activitieswere limited to children 6 to 17years old and were based on par-ents’ responses to questions aboutchildren’s involvement in threeextracurricular activities: sports,clubs, and lessons. Participation insports teams includes those spon-sored by schools or those in organ-ized leagues. Clubs includeScouts, a religious group, a Girls orBoys Club, or 4-H activities.Lessons were interpreted verybroadly to include those takenafter school or on weekends insubjects like music, dance, lan-guage, computers, or religion.Examining activities other thanattending classes provides a morecomplete picture of academicexperiences than consideringgrades alone. These activities caninfluence how a child makes thetransition to adulthood.
Nationally, 59 percent of children 6 the same time period, participationto 17 years old (28.4 million) par- in lessons increased: for children 6ticipated in at least one of the to 11 years old, from 24 percent tothree extracurricular activities in 32 percent, and among older chil-2000. Table 6 shows more dren, from 19 percent to 26 per-detailed activity levels by the chil- cent. Many extended care (or after-dren’s ages and the three specified care) programs in schools offertypes of extracurricular activities. lessons to children and couldOverall, 31 percent of 6- to 11- account for the increases duringyear-olds and 37 percent of 12- to this period. 17-year-olds participated in sports
While older children were moreactivities, both down from their
likely to participate in sports than1994 activity levels of 34 percent
younger children, participation inand 42 percent, respectively.
clubs did not vary by age, reachingA similar decrease between 1994 about 34 percent of each ageand 2000 was seen for children par- group. On the other hand, chil-ticipating in clubs, with one-third of dren in the youngest age groupchildren in both younger and older had a higher proportion (32 per-age groups participating in club cent) taking lessons after school oractivities in 2000 compared with on weekends than older children39 percent for the younger age (26 percent). Older children maygroup and 43 percent for older age choose to cease lessons that nogroup in 1994. However, during longer interest them.
10 U.S. Census Bureau
Figure 2.Percent of Children Having One or More Outings and Average Number of Outings in the Last Month for Children Under 12 Years Old by Race, Ethnicity, and Family Poverty Status: 2000
Source: U.S. Census Bureau, Survey of Income and Program Participation, 1996 Panel, Wave 12.
Below poverty level100 to 199 percent of poverty level 200 percent of poverty level or higher
Hispanic (of any race)
Black
Non-Hispanic White
10.1
11.9
12.5
13.8
10.4
10.6
11.8
9.5
8.9
Percent 1+outings Average number of outings for children with 1+ outings
91.4
91.4
94.2
95.2
96.8
97.7
85.9
89.3
94.5
For both age groups, higher pro- clubs, while 37 percent of girls and Sports activities may involveportions of boys than girls tended 28 percent of boys participated in expenditures on the part of par-to play sports: 37 percent and 24 lessons. ents that may influence the partici-percent, respectively, for 6- to 11- pation level of the child. Only 16year-olds; and 42 percent and 33 Among 6- to 11-year-olds, 37 per- percent of children 6 to 11 yearspercent, respectively, for 12- to 17- cent of White non-Hispanic children old who are living in poverty par-year-olds. On the other hand, participated in sports activities, ticipated in sports activities, com-higher proportions of girls than higher than that recorded for the pared with 34 percent of childrenboys participated in clubs and other race and Hispanic groups, living on or above the povertylessons. Among children 6 to 11 which averaged between 20 and level. years old, 36 percent of girls and 22 percent and which were not sig-
32 percent of boys participated in nificantly different from each other.
U.S. Census Bureau 11
Table 6.Extracurricular Activities of School Age Children by Selected Characteristics:1994 to 2000(Numbers in thousands)
Characteristic
Number of childrenPercent participating in specified extracurricular activity
Sports Clubs Lessons
6 to 11years
12 to 17years
6 to 11years
12 to 17years
6 to 11years
12 to 17years
6 to 11years
12 to 17years
Total children, 2000 . . . . . . . . . . .
Sex of Child
24,581 23,697 30.6 37.2 33.8 34.4 32.0 26.2
Female . . . . . . . . . . . . . . . . . . . . . . . . . . . 11,998 11,526 24.4 32.5 36.0 37.5 36.8 30.2Male . . . . . . . . . . . . . . . . . . . . . . . . . . . . .
Race and Ethnicity of Child
12,583 12,171 36.5 41.6 31.8 31.4 27.5 22.3
White . . . . . . . . . . . . . . . . . . . . . . . . . . . . 19,340 18,678 33.4 39.2 35.7 36.4 33.5 27.5Non-Hispanic. . . . . . . . . . . . . . . . . . . . 15,080 15,301 36.7 41.7 39.9 39.4 37.1 29.1
Black. . . . . . . . . . . . . . . . . . . . . . . . . . . . . 4,061 3,745 20.6 30.5 27.6 25.0 25.4 19.4Asian and Pacific Islander . . . . . . . . . . 846 834 20.4 25.7 27.1 31.5 36.0 33.1Hispanic (of any race) . . . . . . . . . . . . . .
Marital Status of Parent
4,520 3,683 21.5 28.0 20.2 22.9 20.7 20.3
Married1 . . . . . . . . . . . . . . . . . . . . . . . . . . 17,858 16,787 34.7 40.2 37.2 37.9 36.1 29.3Separated, divorced, widowed. . . . . . . 4,047 5,431 25.1 30.3 26.7 27.7 22.5 19.8Never married . . . . . . . . . . . . . . . . . . . . .
Parent’s Educational Level
2,676 1,480 18.6 28.3 22.1 19.1 20.0 14.2
High school or less . . . . . . . . . . . . . . . . 11,990 11,665 23.5 29.6 24.9 26.2 21.5 19.6Some college . . . . . . . . . . . . . . . . . . . . . 4,385 4,110 31.1 40.1 36.0 37.6 35.1 28.6Vocational or associate degree . . . . . . 3,236 3,420 35.1 39.8 40.9 39.6 37.6 29.1Bachelor’s degree . . . . . . . . . . . . . . . . . 3,784 3,063 42.9 49.3 47.9 46.7 50.0 37.7Advanced degree . . . . . . . . . . . . . . . . . .
Poverty Status2
1,186 1,440 48.9 58.4 52.8 52.6 54.6 41.2
Below poverty level . . . . . . . . . . . . . . . . 4,379 3,476 15.9 24.9 22.8 23.2 18.6 17.9On or above poverty level . . . . . . . . . . 19,663 19,861 34.3 39.6 36.6 36.6 35.3 27.9
100 to 199 percent of poverty . . . . 5,956 5,353 24.1 30.7 27.2 29.5 23.7 20.8200 percent of poverty or higher. . . 13,707 14,508 38.7 42.9 40.7 39.2 40.3 30.5
Total children, 1998 . . . . . . . . . . . 24,095 23,345 31.7 39.4 34.4 35.3 30.8 26.9Total children, 19943 . . . . . . . . . 19,426 17,665 34.3 42.2 38.8 42.5 23.7 19.1
1Married includes married, spouse present and married, spouse absent (excluding separated).2For families with incomes reported.3Number of children varied by activity depending on those reporting valid answers and were approximately 19.4 million 6- to 11-year-olds and 17.6 million
12- to 17-year-olds.
Source: U.S. Census Bureau, Survey of Income and Program Participation, 1996 Panel, Waves 6 and 12 (1998 and 2000 data). Current Population Reports,P70-68, Table 11 (1994 data).

Among the grade-school-age chil-dren, Table 6 also shows that chil-dren living with two married par-ents—who may have moreeconomic resources to spend ontheir children—participated to agreater extent (35 percent) than dochildren living with formerly mar-ried parents (25 percent) or never-married parents (19 percent). Thistype of activity, which oftenrequires parental participation,may also be more likely to occur ifa child is living with two parentsrather than one parent. Also notedin Table 6 is that the level of par-ticipation is twice as high for chil-dren whose parents have advanceddegrees (49 percent) as childrenwhose parents have a high schoolor less level of education (24 per-cent).
Figure 3 shows that the povertystatus of the child’s family playedan important role in participationin all three activities. A child wholived in a household with sufficientincome to afford activities fees wasmore likely to participate in sports,clubs, or lessons. Within eachspecified activity, children whosefamily poverty status was 200 per-cent of poverty or higher hadgreater activity participation levelsthan children living below thepoverty level or those whosepoverty status was 100 to 199 per-cent of poverty. Children livingbelow the poverty level might havean opportunity to participate inprograms that have little or nocost, or, as in the case of playingsports for their schools, programswhose costs are offset by otherfunding sources.
ACADEMIC ACHIEVEMENT
Children’s academic achievement inthis report is analyzed by consider-ing outcomes, such as beingacademically “on-track” (i.e.,enrolled in school at or above the
modal grade level for their age), on staying on-track: 73 percent oftaking classes for gifted students, children who had never changedchanging schools, repeating schools remained on-track, com-grades, and being suspended. pared with 70 percent who had
changed schools. Suspension fromAcademically on-track school, which can be an indicator of
emotional or adjustment problems,Nationally, 72 percent of children
was also closely related to being12 to 17 years old were academi-
academically on-track: sixty-threecally on-track for their age (see
percent of children who had beenTable 7). Girls were more likely to suspended were on-track, comparedbe on-track than boys—79 percent with 73 percent of children whoand 69 percent, respectively. had never been suspended.
Are students able to stay on-track,Enrolled in gifted classes
even when experiencing changes,such as a parent’s divorce or attend- The SIPP child well-being module
ing a new school? Children 12 to also asked parents if their children
17 years old were more likely to were in a special class for gifted
stay on-track if their parents were students or did advanced work in
married (74 percent), compared any subjects (Table 8). Thirteen
with those with separated, percent of children 6 to 11 years
divorced, or widowed parents old and 22 percent of children 12 to
(67 percent), and those with 17 years old were in such classes,
never-married parents (66 percent). which include honors and advanced
Changing schools had some affect placement classes in high school.
12 U.S. Census Bureau
Figure 3.Percent of Children 6 to 17 Years Old Participating in Extracurricular Activities by Family Poverty Status: 2000
Source: U.S. Census Bureau, Survey of Income and Program Participation, 1996 Panel, Wave 12.
Below poverty level100 to 199 percent of poverty level 200 percent of poverty level or higher
LessonsClubsSports
40.9 39.935.2
27.2 28.3
22.319.9
23.018.3

Half (49 percent) of children 12 to17 years old whose parent had anadvanced degree were in giftedclasses, compared with only 14 per-cent of children whose parent hadattained a high school education orlower. The proportion in giftedclasses was also higher for childrenaged 12 to 17 whose parents weremarried (24 percent) than for chil-dren living with separated,divorced, or widowed parents, ornever-married parents (17 percentand 12 percent, respectively).Among 12- to 17-year-olds whosefamily poverty status was 200 per-cent of poverty or higher, 26 per-cent were attending gifted classes,compared with only 14 percent ofchildren living below poverty. It ispossible that these differences ingifted class enrollment reflect theavailability of classes offered at theschools the children were attending.
Changing schools
Not including the normal progres-sion and graduation from elemen-tary and middle schools, 23 percentof children aged 6 to 11 and 40 percent of children aged 12 to17 who had ever attended or beenenrolled in first grade or higher hadchanged schools at some time intheir educational careers (see Table8). The higher number for olderchildren is normal as these childrenhave had more time to experience achange. Changing schools can bedisruptive because children usuallyhave to make new friends, adjust tonew teachers, and become integrat-ed into a different school settingand routine. A change in schoolsmay have been prompted by a resi-dential move, a change in school-district boundaries, failure at anoth-er school, or a change in theirhousehold structure or finances,
U.S. Census Bureau 13
Table 7.Children 12 to 17 Years Old Academically On-Track:1994 to 2000(Numbers in thousands)
Characteristic All currently enrolled Percent on-track
Total children, 2000 . . . . . . . . . . . . . . . . . .
Age of Child
23,008 71.8
12 years . . . . . . . . . . . . . . . . . . . . . . . . . . . . . . . . . 3,848 74.513 years . . . . . . . . . . . . . . . . . . . . . . . . . . . . . . . . . 3,857 73.714 years . . . . . . . . . . . . . . . . . . . . . . . . . . . . . . . . . 3,947 73.415 years . . . . . . . . . . . . . . . . . . . . . . . . . . . . . . . . . 3,772 75.716 years . . . . . . . . . . . . . . . . . . . . . . . . . . . . . . . . . 3,983 68.517 years . . . . . . . . . . . . . . . . . . . . . . . . . . . . . . . . .
Sex of Child
3,602 64.5
Female. . . . . . . . . . . . . . . . . . . . . . . . . . . . . . . . . . . 11,215 78.8Male . . . . . . . . . . . . . . . . . . . . . . . . . . . . . . . . . . . . .
Race and Ethnicity of Child
11,793 68.5
White . . . . . . . . . . . . . . . . . . . . . . . . . . . . . . . . . . . . 18,149 72.3Non-Hispanic . . . . . . . . . . . . . . . . . . . . . . . . . . . 14,888 72.1
Black . . . . . . . . . . . . . . . . . . . . . . . . . . . . . . . . . . . . 3,636 68.4Asian and Pacific Islander . . . . . . . . . . . . . . . . . . 817 80.4Hispanic (of any race) . . . . . . . . . . . . . . . . . . . . .
Marital Status of Parents
3,564 72.4
Married1. . . . . . . . . . . . . . . . . . . . . . . . . . . . . . . . . . 16,340 73.8Separated, divorced, widowed . . . . . . . . . . . . . . 5,250 67.2Never married . . . . . . . . . . . . . . . . . . . . . . . . . . . .
Participation in at Least OneExtracurricular Activity
1,418 65.6
Participated in an extracurricular activity . . . . .Did not participate in an extracurricular
14,054 73.9
acitvity . . . . . . . . . . . . . . . . . . . . . . . . . . . . . . . . . .
Poverty Status2
8,954 68.6
Below poverty level . . . . . . . . . . . . . . . . . . . . . . . . 3,309 62.7On or above poverty level . . . . . . . . . . . . . . . . . . 14,220 73.4
100 to 199 percent of poverty. . . . . . . . . . . . . 5,199 68.2200 percent of poverty or higher . . . . . . . . . .
Ever Changed Schools3
14,165 75.4
Changed schools. . . . . . . . . . . . . . . . . . . . . . . . . . 9,215 70.1Did not change schools . . . . . . . . . . . . . . . . . . . .
Ever Suspended
13,793 72.9
Suspended from school . . . . . . . . . . . . . . . . . . . . 2,401 63.3Never suspended from school . . . . . . . . . . . . . . 20,607 72.8
Total children, 1998 . . . . . . . . . . . . . . . . . . 22,782 71.1Total children, 19944 . . . . . . . . . . . . . . . . . 18,118 69.3
1Married includes married, spouse present and married, spouse absent (excluding separated).2Families with income reported.3Does not include the normal progression and graduation from elementary and middle schools.4Based on those children for whom valid answers were reported (no allocation for nonresponse).
Includes children who are not currently enrolled.
Note: Children are generally considered on-track when they are enrolled at or above the modalgrade for their age (the grade at which most children of a given age are enrolled).
Source: U.S. Census Bureau, Survey of Income and Program Participation, 1996 Panel, Waves 6and 12 (1998 and 2000 data). Current Population Reports, Series P70-68, Table 15 (1994 data).

which could be caused by a separa- or widowed had changed schools Black children 6 to 11 years oldtion or divorce of parents. For (46 percent) than children with tended to change schools at aexample, a higher proportion of married parents (39 percent) or higher rate than did non-Hispanicchildren 12 to 17 years old whose those with never-married parents White children, Asian and Pacificparents were separated, divorced, (36 percent). Islander children, or Hispanic
14 U.S. Census Bureau
Table 8.Academic Achievement of School Age Children„Selected(Numbers in thousands)
Characteristics: 1994 to 2000
Characteristic
Gifted classes1 Change of schools2 Ever repeated a grade3 Ever suspended1
6 to 11 years 12 to 17 years 6 to 11 years 12 to 17 years 6 to 11 years 12 to 17 years 12 to 17 years
Total Total Total Total Total Total Totalnum- Per- num- Per- num- num- num- Percent num- Percent num- Percent
ber of cent in ber of cent in ber of Percent ber of Percent ber of ever re- ber of ever re- ber of everchil- gifted chil- gifted chil- changed chil- changed chil- peated chil- peated chil- sus-dren classes dren classes dren schools dren schools dren a grade dren a grade dren pended
Total children, 2000
Sex of Child
24,015 12.7 23,008 21.8 24,037 23.3 23,086 40.1 24,214 5.3 23,417 10.7 23,008 10.4
Female . . . . . . . . . . . . . . . 11,685 13.1 11,215 23.5 11,702 23.8 11,251 40.5 11,810 4.3 11,413 8.7 11,215 7.0Male . . . . . . . . . . . . . . . . .
Race and Ethnicity ofChild
12,330 12.3 11,793 20.2 12,335 22.8 11,834 39.7 12,404 6.2 12,004 12.7 11,793 13.7
White . . . . . . . . . . . . . . . . 18,882 13.4 18,149 22.5 18,905 22.5 18,214 40.1 19,046 4.9 18,465 9.5 18,149 9.0Non-Hispanic . . . . . . . . 14,671 14.7 14,888 24.3 14,693 22.1 14,935 40.3 14,813 4.9 15,123 9.4 14,888 9.3
Black . . . . . . . . . . . . . . . .Asian and Pacific
4,005 10.0 3,636 18.4 4,005 27.9 3,642 39.2 4,029 7.7 3,710 17.2 3,636 17.9
Islander. . . . . . . . . . . . . . 818 11.8 817 27.5 818 19.9 821 35.2 818 2.6 824 6.4 817 5.3Hispanic (of any race) . . .
Marital Status of Parent
4,466 9.1 3,564 14.3 4,466 23.1 3,582 39.4 4,488 4.6 3,648 11.3 3,564 8.5
Married4 . . . . . . . . . . . . . .Separated, divorced,
17,393 13.6 16,340 24.1 17,410 21.3 16,389 38.6 17,544 4.4 16,552 8.2 16,340 8.1
widowed . . . . . . . . . . . . . 3,994 10.3 5,250 17.2 3,998 29.1 5,280 45.8 4,020 7.3 5,397 15.9 5,250 16.2Never married. . . . . . . . . .
Parent’s EducationalLevel
2,628 10.2 1,418 12.4 2,628 27.7 1,418 36.0 2,650 7.7 1,468 20.5 1,418 16.6
High school or less. . . . . . 11,741 8.6 11,220 14.4 11,746 24.1 11,277 39.0 11,837 6.4 11,509 13.6 11,220 11.6Some college . . . . . . . . . .Vocational or associate
4,249 15.4 4,012 22.3 4,258 25.0 4,015 44.8 4,305 4.9 4,076 9.9 4,012 11.7
degree . . . . . . . . . . . . . . 3,172 13.4 3,352 23.4 3,176 22.4 3,367 41.4 3,198 4.9 3,390 8.7 3,352 9.9Bachelor’s degree. . . . . . . 3,684 19.6 2,998 34.2 3,689 21.1 3,003 37.7 3,703 3.5 3,010 5.9 2,998 6.3Advanced degree . . . . . . .
Poverty Status5
1,169 21.2 1,424 48.9 1,169 18.2 1,424 37.2 1,172 1.4 1,431 4.9 1,424 5.7
Below poverty level . . . . .On or above poverty
4,239 7.6 3,309 13.7 4,244 26.6 3,334 41.6 4,268 8.7 3,416 19.3 3,309 14.5
level . . . . . . . . . . . . . . . .100 to 199 percent of
19,249 14.0 19,364 23.4 19,267 22.4 19,413 39.6 19,416 4.5 19,653 9.2 19,364 9.5
poverty . . . . . . . . . . . .200 percent of poverty
5,801 10.5 5,199 15.9 5,815 24.3 5,217 39.4 5,883 6.6 5,302 13.7 5,199 11.9
or higher . . . . . . . . . . . 13,448 15.5 14,165 26.2 13,452 21.6 14,196 39.7 13,533 3.6 14,351 7.5 14,165 8.7
Total children, 1998 . 23,704 12.7 22,782 21.4 23,734 18.7 22,869 43.5 23,835 5.8 23,204 12.1 22,782 11.8Total children, 19946 18,952 12.5 NA NA 18,885 29.5 16,888 51.6 18,936 6.6 17,058 15.9 17,003 10.3
NA Not available. The question on gifted classes was not asked of children 12 to 17 years old in 1994.1Includes children currently enrolled in school.2Includes children who have ever attended or been enrolled in first grade or higher. Does not include the normal progression and graduation from elemen-
tary and middle schools.3Includes children who have ever attended or been enrolled in kindergarten or higher.4Married includes married, spouse present and married, spouse absent (excluding separated).5Families with income reported.6Based on those children for whom valid answers were reported (no allocation for nonresponse).
Source: U.S. Census Bureau, Survey of Income and Program Participation, 1996 Panel, Waves 6 and 12 (1998 and 2000 data). Current PopulationReports, Series P70-68, Table 13 (1994 data).
children. These differences disap- Only 6 percent of children whose education or less (45 percent andpeared for children aged 12 to 17. parent had earned a bachelor’s 16 percent, respectively).All race and ethnic groups fell into degree or an advanced degree had Conversely, 29 percent of childrenthe 35 to 40 percent range, with ever been suspended, compared whose parents had a high schoolWhite, Black, and Hispanic children with 12 percent of those whose education or less were expected tohaving virtually the same propor- parent had either a high school achieve less than a college educa-tions who had changed schools education or less, or had some col- tion, compared with only 7 percent(40 percent, 39 percent, and lege education but had not of children whose parents had an39 percent, respectively). attained a degree. advanced degree.
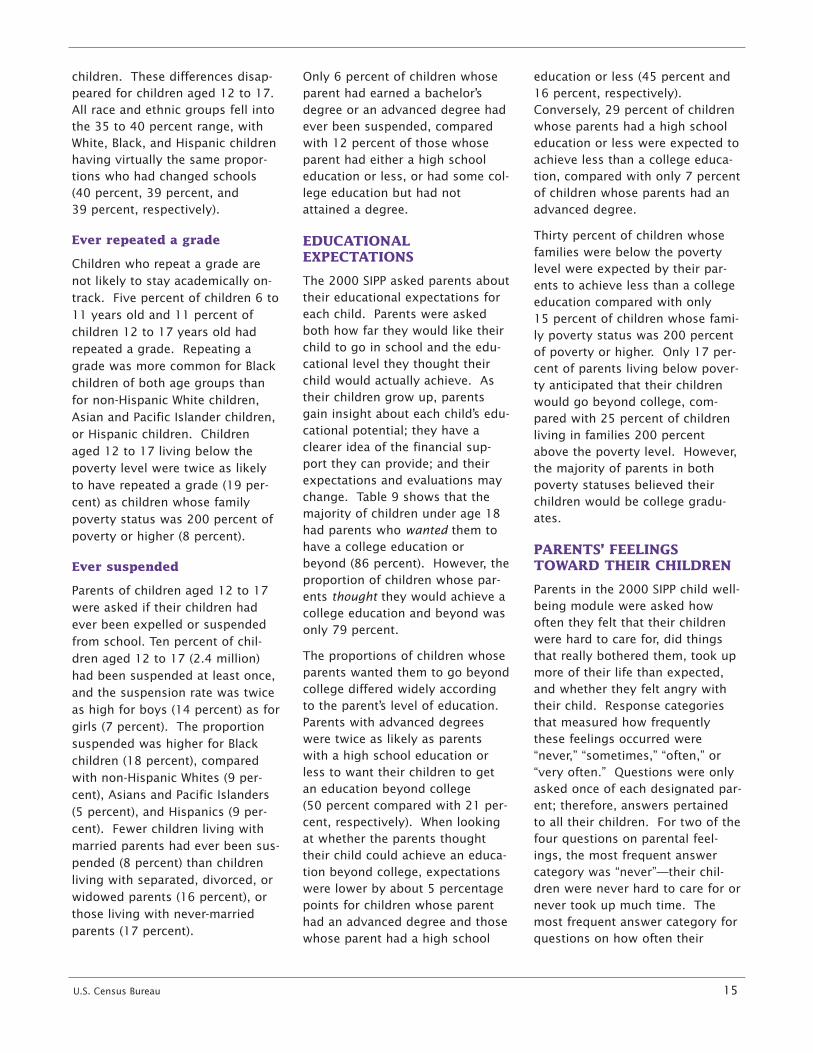
Thirty percent of children whoseEver repeated a grade EDUCATIONALEXPECTATIONS families were below the poverty
Children who repeat a grade are level were expected by their par-not likely to stay academically on- The 2000 SIPP asked parents about ents to achieve less than a collegetrack. Five percent of children 6 to their educational expectations for education compared with only 11 years old and 11 percent of each child. Parents were asked 15 percent of children whose fami-children 12 to 17 years old had both how far they would like their ly poverty status was 200 percentrepeated a grade. Repeating a child to go in school and the edu- of poverty or higher. Only 17 per-grade was more common for Black cational level they thought their cent of parents living below pover-children of both age groups than child would actually achieve. As ty anticipated that their childrenfor non-Hispanic White children, their children grow up, parents would go beyond college, com-Asian and Pacific Islander children, gain insight about each child’s edu- pared with 25 percent of children
cational potential; they have aor Hispanic children. Children living in families 200 percentclearer idea of the financial sup-aged 12 to 17 living below the above the poverty level. However,port they can provide; and theirpoverty level were twice as likely the majority of parents in bothexpectations and evaluations mayto have repeated a grade (19 per- poverty statuses believed theirchange. Table 9 shows that thecent) as children whose family children would be college gradu-majority of children under age 18poverty status was 200 percent of ates.had parents who wanted them topoverty or higher (8 percent). have a college education or PARENTS’ FEELINGS
Ever suspended beyond (86 percent). However, the TOWARD THEIR CHILDRENproportion of children whose par-
Parents of children aged 12 to 17 Parents in the 2000 SIPP child well-ents thought they would achieve a
were asked if their children had being module were asked howcollege education and beyond was
ever been expelled or suspended often they felt that their childrenonly 79 percent.
from school. Ten percent of chil- were hard to care for, did things
dren aged 12 to 17 (2.4 million) The proportions of children whose that really bothered them, took up
had been suspended at least once, parents wanted them to go beyond more of their life than expected,college differed widely according and whether they felt angry withand the suspension rate was twiceto the parent’s level of education. their child. Response categoriesas high for boys (14 percent) as forParents with advanced degrees that measured how frequentlygirls (7 percent). The proportionwere twice as likely as parents these feelings occurred weresuspended was higher for Blackwith a high school education or “never,” “sometimes,” “often,” orchildren (18 percent), comparedless to want their children to get “very often.” Questions were onlywith non-Hispanic Whites (9 per-an education beyond college asked once of each designated par-cent), Asians and Pacific Islanders(50 percent compared with 21 per- ent; therefore, answers pertained(5 percent), and Hispanics (9 per-cent, respectively). When looking to all their children. For two of thecent). Fewer children living withat whether the parents thought four questions on parental feel-
married parents had ever been sus-their child could achieve an educa- ings, the most frequent answer
pended (8 percent) than childrention beyond college, expectations category was “never”—their chil-
living with separated, divorced, orwere lower by about 5 percentage dren were never hard to care for or
widowed parents (16 percent), orpoints for children whose parent never took up much time. The
those living with never-marriedhad an advanced degree and those most frequent answer category for
parents (17 percent). whose parent had a high school questions on how often their
U.S. Census Bureau 15
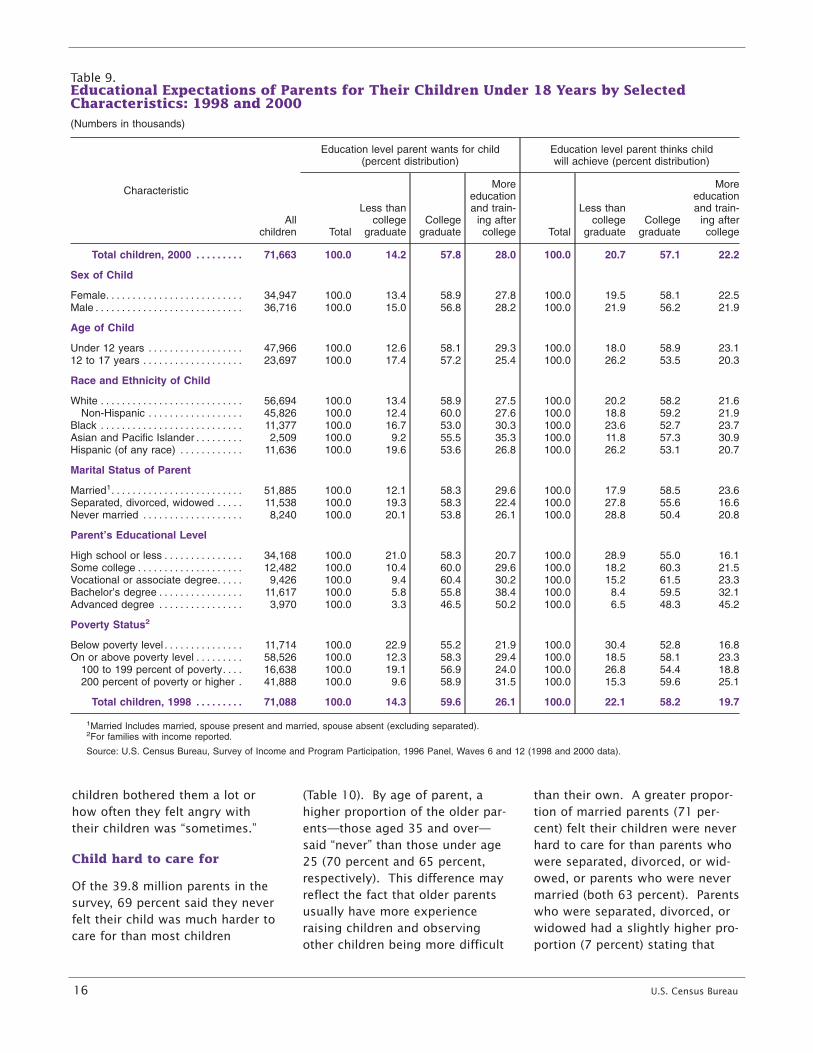
children bothered them a lot or (Table 10). By age of parent, a than their own. A greater propor-how often they felt angry with higher proportion of the older par- tion of married parents (71 per-their children was “sometimes.” ents—those aged 35 and over— cent) felt their children were never
said “never” than those under age hard to care for than parents whoChild hard to care for 25 (70 percent and 65 percent, were separated, divorced, or wid-
respectively). This difference may owed, or parents who were neverOf the 39.8 million parents in the
reflect the fact that older parents married (both 63 percent). Parentssurvey, 69 percent said they never
usually have more experience who were separated, divorced, orfelt their child was much harder to
raising children and observing widowed had a slightly higher pro-care for than most children
other children being more difficult portion (7 percent) stating that
16 U.S. Census Bureau
Table 9.Educational Expectations of Parents for Their Children Under 18 Years by SelectedCharacteristics: 1998 and 2000(Numbers in thousands)
Characteristic
Allchildren
Education level parent wants for child(percent distribution)
Education level parent thinks childwill achieve (percent distribution)
Total
Less thancollege
graduateCollege
graduate
Moreeducationand train-
ing aftercollege Total
Less thancollege
graduateCollege
graduate
Moreeducationand train-
ing aftercollege
Total children, 2000 . . . . . . . . .
Sex of Child
71,663 100.0 14.2 57.8 28.0 100.0 20.7 57.1 22.2
Female. . . . . . . . . . . . . . . . . . . . . . . . . . 34,947 100.0 13.4 58.9 27.8 100.0 19.5 58.1 22.5Male . . . . . . . . . . . . . . . . . . . . . . . . . . . .
Age of Child
36,716 100.0 15.0 56.8 28.2 100.0 21.9 56.2 21.9
Under 12 years . . . . . . . . . . . . . . . . . . 47,966 100.0 12.6 58.1 29.3 100.0 18.0 58.9 23.112 to 17 years . . . . . . . . . . . . . . . . . . .
Race and Ethnicity of Child
23,697 100.0 17.4 57.2 25.4 100.0 26.2 53.5 20.3
White . . . . . . . . . . . . . . . . . . . . . . . . . . . 56,694 100.0 13.4 58.9 27.5 100.0 20.2 58.2 21.6Non-Hispanic . . . . . . . . . . . . . . . . . . 45,826 100.0 12.4 60.0 27.6 100.0 18.8 59.2 21.9
Black . . . . . . . . . . . . . . . . . . . . . . . . . . . 11,377 100.0 16.7 53.0 30.3 100.0 23.6 52.7 23.7Asian and Pacific Islander . . . . . . . . . 2,509 100.0 9.2 55.5 35.3 100.0 11.8 57.3 30.9Hispanic (of any race) . . . . . . . . . . . .
Marital Status of Parent
11,636 100.0 19.6 53.6 26.8 100.0 26.2 53.1 20.7
Married1. . . . . . . . . . . . . . . . . . . . . . . . . 51,885 100.0 12.1 58.3 29.6 100.0 17.9 58.5 23.6Separated, divorced, widowed . . . . . 11,538 100.0 19.3 58.3 22.4 100.0 27.8 55.6 16.6Never married . . . . . . . . . . . . . . . . . . .
Parent’s Educational Level
8,240 100.0 20.1 53.8 26.1 100.0 28.8 50.4 20.8
High school or less . . . . . . . . . . . . . . . 34,168 100.0 21.0 58.3 20.7 100.0 28.9 55.0 16.1Some college . . . . . . . . . . . . . . . . . . . . 12,482 100.0 10.4 60.0 29.6 100.0 18.2 60.3 21.5Vocational or associate degree. . . . . 9,426 100.0 9.4 60.4 30.2 100.0 15.2 61.5 23.3Bachelor’s degree . . . . . . . . . . . . . . . . 11,617 100.0 5.8 55.8 38.4 100.0 8.4 59.5 32.1Advanced degree . . . . . . . . . . . . . . . .
Poverty Status2
3,970 100.0 3.3 46.5 50.2 100.0 6.5 48.3 45.2
Below poverty level . . . . . . . . . . . . . . . 11,714 100.0 22.9 55.2 21.9 100.0 30.4 52.8 16.8On or above poverty level . . . . . . . . . 58,526 100.0 12.3 58.3 29.4 100.0 18.5 58.1 23.3
100 to 199 percent of poverty. . . . 16,638 100.0 19.1 56.9 24.0 100.0 26.8 54.4 18.8200 percent of poverty or higher . 41,888 100.0 9.6 58.9 31.5 100.0 15.3 59.6 25.1
Total children, 1998 . . . . . . . . . 71,088 100.0 14.3 59.6 26.1 100.0 22.1 58.2 19.7
1Married Includes married, spouse present and married, spouse absent (excluding separated).2For families with income reported.
Source: U.S. Census Bureau, Survey of Income and Program Participation, 1996 Panel, Waves 6 and 12 (1998 and 2000 data).
their child was often or very often harder to care for than other chil- below poverty. Examining theharder to care for than most chil- dren. responses of parents who felt theirdren, compared with married par- child was often or very often hard-ents (5 percent). The challenge of Seventy-one percent of parents er to care for than most children, caring for a child alone after shar- who were living 200 percent or 7 percent of parents below povertying the responsibility with another more above poverty never felt that status felt that way, compared withperson and possibly having had a their child was harder to care for 5 percent of parents who lived atsecond income may cause a parent than most children, compared with 200 percent of poverty or higher.to perceive his or her child as 62 percent of parents who lived
U.S. Census Bureau 17
Table 10.Parent s Feeling Toward Their Children by Selected Characteristics: 1998 and 2000(Numbers in thousands)
Characteristics
Allparents
Percent reporting that:
Child is much harderto care for than most
children
Child does thingsthat really bother
me a lot
Child takes up moretime than expected
Parent feels angrywith child
Never
Often orvery
often Never
Often orvery
often Never
Often orvery
often Never
Often orvery
often
Total, 2000 . . . . . . . . . . . . . . . . . .
Age of Parent
39,836 68.7 5.4 43.3 5.1 49.4 15.4 44.5 2.4
Under 25 years old . . . . . . . . . . . . . . . 3,164 64.5 6.2 49.7 5.0 50.9 17.2 53.2 1.425 to 34 years old . . . . . . . . . . . . . . . . 13,083 68.2 5.2 44.9 5.9 50.2 15.0 47.9 2.935 years and over . . . . . . . . . . . . . . . .
Race and Ethnicity of Parent
23,590 69.5 5.4 41.5 4.7 48.8 15.4 41.5 2.2
White . . . . . . . . . . . . . . . . . . . . . . . . . . . 31,557 69.1 5.6 43.1 4.9 50.2 15.2 43.7 2.2Non-Hispanic . . . . . . . . . . . . . . . . . 26,179 69.5 5.7 41.0 5.3 49.1 15.9 42.7 2.3
Black . . . . . . . . . . . . . . . . . . . . . . . . . . . 6,220 68.7 4.7 42.8 6.8 45.8 17.1 49.1 3.1Asian and Pacific Islander . . . . . . . . . 1,534 65.7 5.6 52.3 3.0 51.9 13.7 49.3 2.0Hispanic (of any race) . . . . . . . . . . . .
Marital Status of Parent
5,834 67.5 5.0 53.0 3.0 54.6 12.3 49.1 1.7
Married1. . . . . . . . . . . . . . . . . . . . . . . . . 27,885 71.2 4.8 44.6 4.0 52.2 13.8 45.2 1.9Separated, divorced, widowed . . . . . 6,902 62.8 7.3 38.5 7.8 43.2 19.2 40.9 3.6Never married . . . . . . . . . . . . . . . . . . .
Parent’s Educational Level
5,049 62.8 6.3 42.4 7.7 42.6 19.2 45.9 3.5
High school or less . . . . . . . . . . . . . . . 18,477 66.8 5.6 43.7 6.1 49.4 16.2 45.4 2.7Some college . . . . . . . . . . . . . . . . . . . . 7,143 69.4 4.5 43.2 5.4 47.9 15.2 42.8 2.5Vocational or associate degree. . . . . 5,442 71.1 5.6 41.3 5.0 49.5 15.1 43.2 2.2Bachelor’s degree . . . . . . . . . . . . . . . . 6,451 69.5 5.7 42.8 3.1 50.4 14.4 44.1 1.8Advanced degree . . . . . . . . . . . . . . . .
Poverty Status2
2,322 73.5 4.7 46.3 2.1 51.7 13.7 47.8 1.7
Below poverty level . . . . . . . . . . . . . . . 5,392 61.6 7.3 40.2 8.1 44.1 20.1 44.3 3.5On or above poverty level . . . . . . . . . 33,989 70.0 5.1 43.8 4.6 50.4 14.6 44.5 2.2
100 to 199 percent of poverty. . . . 8,677 65.9 5.9 43.2 6.2 49.2 14.3 44.2 2.6200 percent of poverty or higher . 25,312 71.4 4.8 43.9 4.0 50.8 14.8 44.6 2.1
Total, 1998 . . . . . . . . . . . . . . . . . . 39,088 67.8 4.7 40.9 5.5 45.4 18.8 39.0 2.9
1Married includes married, spouse present and married, spouse absent (excluding separated).2For families with income reported.
Note: The questions on feelings toward each designated parent’s child or children were only asked once and refer to all children living with the designatedparent. The omitted category of response, sometimes, would be calculated by subtracting the never and often or very often percent responses from 100 percentunder each question item.
Source: U.S. Census Bureau Survey of Income and Program Participation, 1996 Panel, Waves 6 and 12 (1998 and 2000 data).

Figure 4 shows that parents withthree or more own14 children wereless likely than parents with one ortwo own children to say that theirchild was never harder to care forthan most other children (65 per-cent compared with 70 percent,respectively).
Child does things that botherme a lot
Over one-half of parents (52 per-cent) said that “sometimes” theirchild does things that bother thema lot.15 Only 5 percent of all par-ents felt this happened often orvery often, while 43 percent saidtheir child never did things thatbothered them a lot. Non-HispanicWhite parents and Black parents
18 U.S. Census Bureau
14 Own children are the natural-born,step, and adopted child of the householder.
15 The response category “sometimes” wascalculated by subtracting the “never” and“often or very often” percent responses from100 percent under each question item inTable 10. The questions on feelings towardeach designated parent’s child or childrenwere only asked once and refer to all childrenliving with the designated parent.
were the least likely never to havefelt that their child did things thatbother them (41 percent and 43 percent, respectively), com-pared with Asians and PacificIslanders (52 percent) andHispanics (53 percent).Considering the number of chil-dren in the family, the data againshow that those with three or moreown children were less likely tosay that their children never didthings that bother them a lot (37 percent) than parents who hadone own child (47 percent) or twoown children (42 percent, seeFigure 4).
Child takes up more time than expected
One-half of all parents never feltthat their children’s needs tookmore of their life than they expect-ed. However, 15 percent repliedthat often or very often their chil-dren’s demands used up more oftheir time than they had expected.Married parents were more likely
never to have felt their child wastaking up more time than expected(52 percent), compared withseparated, divorced, or widowedparents and never-married parents(both 43 percent).
Twenty percent of parents living inpoverty felt their children often orvery often took up more of theirlife than expected, in contrast withparents 200 percent or more abovepoverty (15 percent). Parents withonly one or two children weremore likely never to feel that theirchildren took up more time thanexpected (53 percent and 49 per-cent, respectively) than parentswith three or more own children(46 percent, see Figure 4). In gen-eral, having a larger number ofchildren in a household createsgreater demands on parents’ timethan fewer children.
Parent feels angry with child
Only 2 percent of all parentsresponded that they felt angry with
Figure 4.Percent of Parents Responding “Never” to Questions About Frequency of Difficulty With Their Children by Number of Own Children in the Family: 2000
Source: U.S. Census Bureau, Survey of Income and Program Participation, 1996 Panel, Wave 12.
All parentsWith one own childWith two own childrenWith three or more own children
Parent feels angrywith child
Child's needs take up moreof parent's life than expected
Child does things thatbother parent a lot
Child much harder to carefor than most children
64.6
36.9
46.0
39.3
70.0
41.7
48.8
42.4
70.4
47.452.5
48.6
68.7
43.3
49.444.5

their child often or very often. Children whose parents had higher universe, is composed primarily ofMost parents (53 percent) “some- levels of educational attainment the population in correctional insti-times” felt angry, while another were more often read to, required tutions and nursing homes large proportion (45 percent) said to follow rules about television, (91 percent of the 4.1 million insti-they never were angry with their and more frequently participated in tutionalized population in Censuschildren. In fact, regardless of the extracurricular activities. They 2000).characteristics of the parents, also were more likely to be in gift-40 percent or more of the parents ed classes, but less likely to have ACCURACY OF THEsaid they never were angry with been suspended or to have repeat- ESTIMATEStheir children. Non-Hispanic White ed any grades. Parents with high Statistics from surveys are subjectparents were the least likely never levels of education were far more to sampling and nonsampling error.to have felt angry at their child likely to think their child would All comparisons presented in this(43 percent), compared with Black complete more education and report have taken sampling errorparents, Asian and Pacific Islander training after college than parents into account and are significant atparents, and Hispanic parents (all with less education. the 90-percent confidence level.49 percent). Parents with the most This means the 90-percent confi-Family structure and income affectown children were least likely dence interval for the differencechildren’s everyday life, whethernever to have felt angry with their between the estimates being com-watching TV at home or participat-child (39 percent), compared with pared does not include zero.ing in after school activities.parents with one or two own chil- Nonsampling errors in surveys mayParents’ interactions with their chil-dren (49 and 42 percent, respec- be attributed to a variety ofdren and their feelings towardtively). sources, such as how the surveytheir children influence their chil-
was designed, how respondentsdren’s future.SUMMARY interpret questions, how able andThis report describes some of the SOURCE OF DATA willing respondents are to provideimportant aspects of the well-being correct answers, and how accurate-
The population represented (theof children: daily interactions with ly the answers are coded and classi-
population universe) in the 1992,parents, participation in extracur- fied. The Census Bureau employs
1993, and 1996 Survey of Incomericular activities, academic achieve- quality control procedures through-
and Program Participation (SIPP) isment, educational expectations of out the production process includ-
the civilian noninstitutionalizedparents, and parent’s feelings ing the overall design of surveys,
population of the United States.toward their children. the wording of questions, review of
SIPP is a longitudinal survey con- the work of interviewers andRelative to children living with a ducted at four-month intervals by coders, and statistical review ofsingle parent, children living with the Census Bureau. The data in reports to minimize these errors.married parents tended to have this report were collected frommore daily interaction with their December 1999 through March The Survey of Income and Programparents, such as sharing meals and 2000, from December 1997 Participation weighting proceduretalking with one another. Children through March 1998, in the 12th uses ratio estimation whereby sam-with married parents experienced and 6th waves (interviews) of the ple estimates are adjusted to inde-more restrictions on TV viewing 1996 SIPP and from October 1994 pendent estimates of the nationaland were read to more often than through January 1995 in the 9th population by age, race, sex, andchildren in single-parent families. wave of the 1992 SIPP and the 6th Hispanic origin. This weighting par-One benefit of living in a two- wave of the 1993 SIPP. tially corrects for bias due to under-parent household—whether mar- coverage, but biases may still be
Although the main focus of theried or unmarried—is illustrated by present when people who are
SIPP is information on labor forcethe number of times both parents missed by the survey differ from
participation, jobs, income, andread to their child at home. those interviewed in ways other
participation in federal assistanceChildren of married parents were than age, race, sex, and Hispanic
programs, information on otheralso more likely to participate in origin. How this weighting proce-
topics is also collected in topicalextracurricular activities and to dure affects other variables in the
modules on a rotating basis. Theprogress more steadily in school survey is not precisely known. All
institutionalized population, whichby keeping academically on-track. of these considerations affect
is excluded from the population
U.S. Census Bureau 19

comparisons across different sur- 1994 data, is also found on this contact the author of this report by veys or data sources. page. e-mail.
For further information on the Other research on child well-being Terry Lugailasource of the data and accuracy of from the SIPP can be found in the [email protected] estimates including standard following reports: Jason M. Fieldserrors and confidence intervals, go and Kristin E. Smith, Poverty, USER COMMENTSto www.sipp.census.gov/sipp/ Family Structure, and Child Well- The Census Bureau welcomes thesourceac/s&a96_040501.pdf or Being: Indicators From the SIPP, comments and advice of users ofcontact David Hall of the Census Population Division Working Paper its data and reports. If you haveBureau Demographic Statistical Series, No. 23, U.S. Census Bureau, any suggestions or comments,Methods Division on the Internet at Washington, DC, 1998; Kristin E. please write to:[email protected]. Smith, Loretta E. Bass, and Jason M.
Fields, Child Well-Being Indicators Chief, Population DivisionMORE INFORMATION From the SIPP, Population Division U.S. Census Bureau
Working Paper Series, No. 24, U.S. Washington, DC 20233The report as well as detailed
Census Bureau, Washington, DC,tables for both 2000 and 1998 are or send an e-mail inquiry to:1998. Both of these papers areavailable on the Internet [email protected] on the Internet on the(www.census.gov); search for child“Population: Working Paper,” sectionwell-being data by clicking on the SUGGESTED CITATIONunder “Subjects A to Z.”letter W in the “Subjects A to Z”
Lugaila, Terry A., 2003. A Child’ssection of the Web page and select-
CONTACT Day: 2000 (Selected Indicators ofing “Well-being /Dynamics of
Child Well-Being). CurrentEconomic Well-Being.” The previ- For additional child well-being
Population Reports, P70-89. U.S.ous report, A Child’s Day: Home, information, you may contact the
Census Bureau, Washington, DC.School, and Play (Selected author of this report in the FertilityIndicators of Child Well-Being), with and Family Statistics Branch on
301-763-2416. You may also
U.S. Department of CommerceEconomics and Statistics AdministrationU.S. CENSUS BUREAU
Washington, DC 20233
OFFICIAL BUSINESS
Penalty for Private Use $300
FIRST-CLASS MAILPOSTAGE & FEES PAIDU.S. Census Bureau
Permit No. G-58